q1 2003 results, may 8, 2003 - hugin onlinereports.huginonline.com/902758/117509.pdf · jun.92...
TRANSCRIPT

Q1 2003 results,
May 8, 2003
1

•Introduction
•Market update – outlook
•Corporate financial status
•Other
Agenda
2
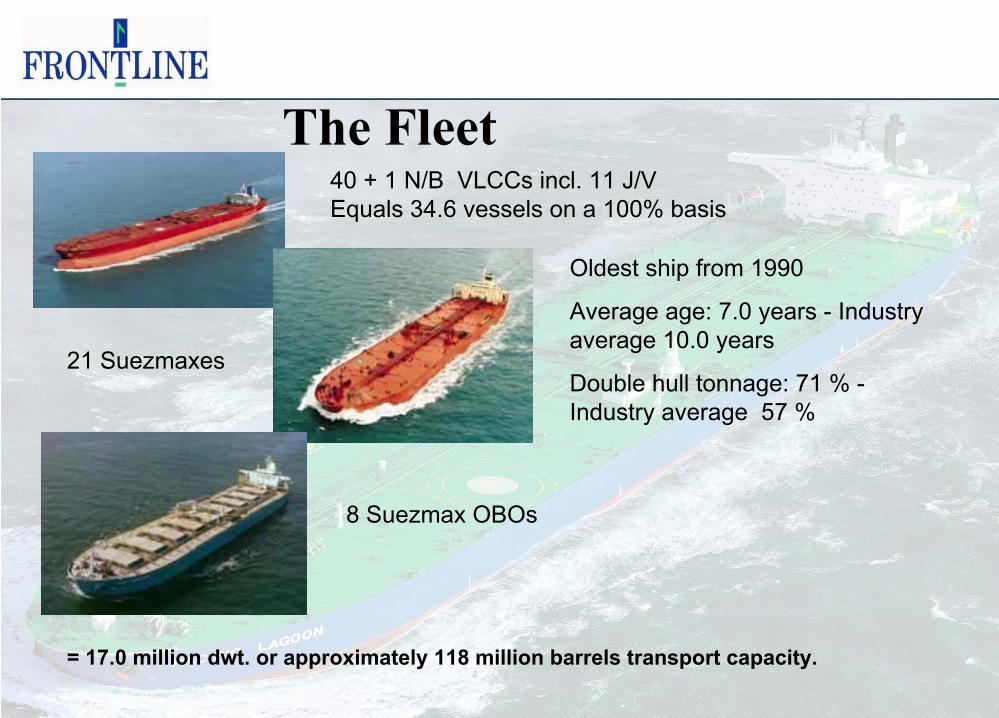
Oldest ship from 1990
Average age: 7.0 years - Industryaverage 10.0 years
Double hull tonnage: 71 % -Industry average 57 %
40 + 1 N/B VLCCs incl. 11 J/V Equals 34.6 vessels on a 100% basis
21 Suezmaxes
8 Suezmax OBOs
= 17.0 million dwt. or approximately 118 million barrels transport capacity.
The Fleet

Main events Q1 2003
4
•Frontline aquired the suezmax tankers Polytrader and Polytraveller,which were owned by Joint Ventures with Rasmussen in which Frontline had 40% and 35% respectively. The vessels weresubsequently sold in March 2003, with delivery of the second vessel taking place in April 2003,
•Frontline aquired 250,000 shares under the ESL with Nova Scotia, and as at March, 31 2003 a total of 2,945,000 shares are acquired pursuant to the existing Equity Swap Line facility at an average cost of $8.91 per share,
•A dividend of $0.15 per share paid out in late March
•$29.3 million in prepayment of debt in excess of scheduled repayments. Same for associated companies - $20.0 million (100% basis)

•The Board has adopted a strategy whereby the Company will seek to have a normalized future quarterly dividend target of $ 0.25 per share or $1.00 total per share per year which corresponds to a yield of 8.7 per cent based on current share price.
•In addition to the normalized quarterly dividend, each quarter the Board will evaluate how to utilize any potential earnings achieved in excess of the dividend break even level. Such earnings may be retained in the Company to strengthen the balance sheet, they may be used for capital investments, for repurchase of shares or paid out as additional dividend. The decision will be taken based on existing market conditions at the time, and will also take into consideration the need to have a large enough cash position to secure future ordinary dividends.
Dividend policy – “New deal”
5

Of whichVLCC's ULCC's*) Suezmaxes
Building year 200,000+ dw t 320,000 + dw t 120,000-200,000 dw t
1973 or earlier 2 01974-75 9 1 101976-77 26 9 141978-80 11 8 161981 or later 392 4 249Fleet as at May 7, 2003 440 22 289
On order2003 26 1 232004 28 24
2005+ 21 11Total on order 2003-2006 75 1 58
*) Each ULCC representing an average of 400,000 Dwt
Source: P.F.Bassøe
Supply VLCC’s / Suezmaxes(No. of vessels)
6

VLCC N/B, SH prices, parity and ratio
7
20,0
30,0
40,0
50,0
60,0
70,0
80,0
90,0
100,0
110,0
120,0
1990 1992 1994 1996 1998 2000 200250,0 %
55,0 %
60,0 %
65,0 %
70,0 %
75,0 %
80,0 %
85,0 %
90,0 %
95,0 %
100,0 %
Newbuilding (l.s.) 5 year old (l.s.) SH/NB ratio (r.s.) SH/NB parity
Trends in tanker valuesUSDm
Source: Bassøe, Clarkson, May 2, 2003

The macro trend
8
•A lower oil price, low inventories and increased focus on Middle East production after the Iraq war gives comfort on the demand side,
•The supply side is supported by the fact that, even in the current weak market, there is no material excess supply of ships and that very limited waiting time is being experienced on modern tonnage,
•Anticipated introduction of new EU legislation for tankers from July 1st 2003,
•Current acceleration of scrapping,
•Political unrest in several short haul production areas can create significant upside in the market
•Start up of nuclear power plant closures in Japan which requires substitution with fossil fuel for power generation have been delayed,
•High Natural gas prices
•Nigeria and Venezuela still not back to full production

Estimated oil demand/supply 2003
Avg. 02 Q103 Q203 Q303 Q403 Avg. 03
Demand* 76,9 78,8 76,6 77,5 79,5 78,1
Supply* 76,3 78,5 77,6 77,9 78,9 78,1
*)Based on JP Morgan estimates as of May 7, 2003
9

Oil production
10
Change 2000 2001 2002 2003 2000 - 2003
Canada 2,68 2,74 2,87 2,99 0,31Mexico 3,45 3,56 3,59 3,70 0,25USA 8,11 8,05 8,11 8,06Argentina 0,82 0,82 0,80 0,77Brazil 1,50 1,58 1,71 1,79 0,29Colombia 0,71 0,63 0,59 0,55 -0,16Ecuador 0,41 0,42 0,39 0,39Denmark 0,37 0,35 0,37 0,36Norway 3,35 3,42 3,33 3,26 -0,09UK 2,60 2,45 2,44 2,32 -0,28Oman 0,96 0,96 0,90 0,85Syria 0,54 0,55 0,55 0,54Yemen 0,54 0,46 0,46 0,46Australia 0,82 0,73 0,73 0,69 -0,13Brunei 0,20 0,20 0,19 0,19China 3,25 3,31 3,40 3,40 0,15India 0,79 0,78 0,76 0,76Malaysia 0,81 0,79 0,80 0,82Vietnam 0,32 0,35 0,32 0,30Angola 0,75 0,73 0,90 0,89 0,14Egypt 0,80 0,76 0,73 0,72Gabon 0,33 0,30 0,29 0,29Total 34,11 33,94 34,23 34,10
Other / smaller prod 2,43 2,48 2,53Refinery proc gain 1,76 1,79 1,83
Non OPEC supply ex FSU 38,13 38,50 38,46
Source: JPMorgan May 7, 2003

Oil production
11
Change 2000 2001 2002 2003 2000 - 2003
Russia 6,54 7,05 7,65 8,13 1,59Kazakhstan 0,75 0,83 0,95 1,04 0,29Other FSU 0,75 0,77 0,80 0,82FSU 8,04 8,65 9,40 9,99
OPEC NGL / Condensate 2,90 3,00 3,2Call on OPEC crude 26,80 25,90 26,4Stockbuild 0,40 -0,50 0,1OPEC crude 27,20 25,40 26,50
Source: JPMorgan May 7, 2003
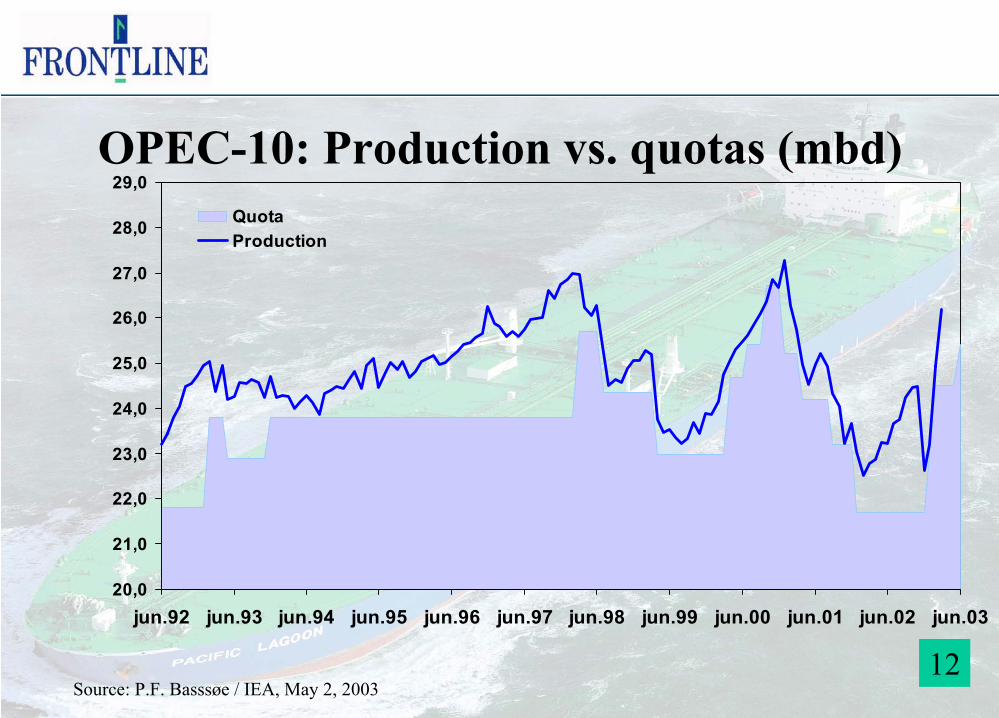
OPEC-10: Production vs. quotas (mbd)
12Source: P.F. Basssøe / IEA, May 2, 2003
20,0
21,0
22,0
23,0
24,0
25,0
26,0
27,0
28,0
29,0
jun.92 jun.93 jun.94 jun.95 jun.96 jun.97 jun.98 jun.99 jun.00 jun.01 jun.02 jun.03
QuotaProduction

13Source: RS Platou

14Source: RS Platou

Oil inventories, OECD and US, mb
15Source. P.F. Bassøe / IEA / DOE May 2, 2003
2 300
2 400
2 500
2 600
2 700
2 800
2 900
Jan Mar Mai Jul Sep Nov
Commercial inventories, OECD
850
900
950
1 000
1 050
1 100
1 150
Jan Mar Mai Jul Sep Nov
Commercial inventories, US
5-year high range
5-year low range
2002
2003
5-year high range
5-year low range
2002
2003
mblmbl

Oil inventories, Europe and Asia, mbCommercial inventories, OECD Europe Commercial inventories, OECD Asia
16Source. P.F. Bassøe / IEA / Euroilstock May 2, 2003
840
860
880
900
920
940
960
980
1 000
1 020
1 040
1 060
Jan Mar Mai Jul Sep Nov380390400410420430440450460470480490500510520530
Jan Mar Mai Jul Sep Nov
5-year high range
5-year low range
2002
2003
5-year high range
5-year low range
2002
2003
mblmbl
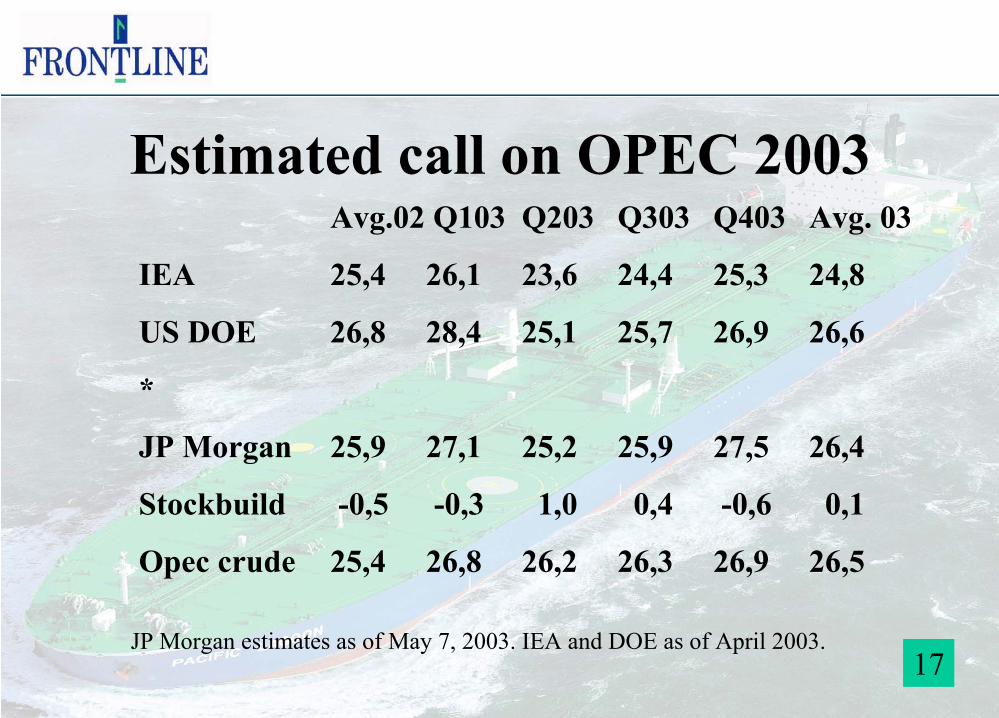
Avg.02 Q103 Q203 Q303 Q403 Avg. 03
IEA 25,4 26,1 23,6 24,4 25,3 24,8
US DOE 26,8 28,4 25,1 25,7 26,9 26,6
*
JP Morgan 25,9 27,1 25,2 25,9 27,5 26,4
Stockbuild -0,5 -0,3 1,0 0,4 -0,6 0,1
Opec crude 25,4 26,8 26,2 26,3 26,9 26,5
JP Morgan estimates as of May 7, 2003. IEA and DOE as of April 2003.
Estimated call on OPEC 2003
17

Oil production, Opec-10 and Iraq
18
20,0
22,0
24,0
26,0
28,0
30,0
32,0
jan.98 jul.98 jan.99 jul.99 jan.00 jul.00 jan.01 jul.01 jan.02 jul.02 jan.03 jul.03
Iraq (r.s.)Opec-10 (l. s.)
Estimate JPMorgan from Apr. 03
Source: P.F. Bassøe / IEA JPMorgan May 2, 2003
mbl

WTI-Brent Blend / Natural Gas
19
OILW TX2-OILBRNT 6/5/03
1998 1999 2000 2001 2002-0.50
0
0.50
1.00
1.50
2.00
2.50
3.00
3.50
4.00
4.50
OILWTX2-OILBRNT(P)
HIGH 4.08 10/3/03, LOW -0.14 21/1/02, LAST 2.17 5/5/03 Source: DATASTREAM
Natural Gas, Henry Hub $/MMBTUFROM 4/5/98 TO 5/5/03 WEEKLY
1998 1999 2000 2001 2002 20030
2
4
6
8
10
12
14
HIGH 12.2000 24/ 2/03 LOW 1.5750 7/12/98 LAST 5.2300Source: DATASTREAM
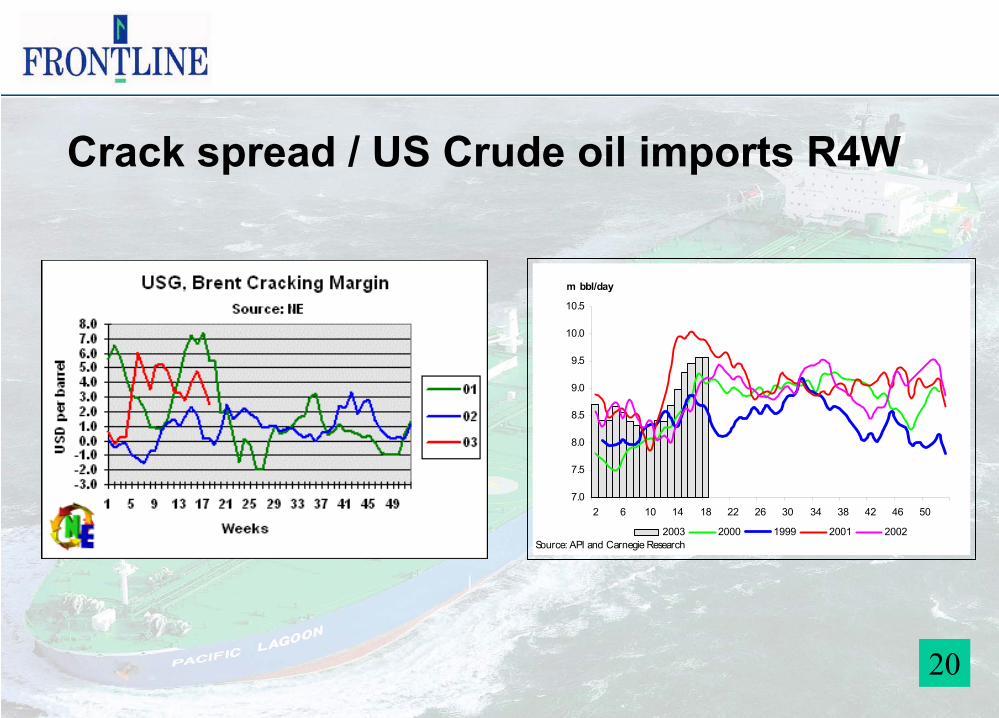
Crack spread / US Crude oil imports R4W
20
7.0
7.5
8.0
8.5
9.0
9.5
10.0
10.5
2 6 10 14 18 22 26 30 34 38 42 46 50
m bbl/day
2003 2000 1999 2001 2002Source: API and Carnegie Research

Correlation between production and VLCC rates
21Source: R.S. Platou

Profit & Loss
22
USD million Q1 03 Q1 02 2002
Net operating revenues 258,9 94,8 429,0Gain / loss on sale of vessels 0,5 0,0 -4,3Total expenses 53,7 39,0 187,1Operating profit before depreciation (EBITDA) 205,8 55,8 237,6Depreciation 36,2 34,0 139,9Operating profit (EBIT) 169,6 21,8 97,7Financial items 8,0 -7,8 -90,5Net profit (loss) before min. & taxes 177,6 14,0 7,2Taxes 0,0 0,0 0,0Cumulative effect of change in accounting principle - -14,1 -14,1Net profit (loss) 177,6 -0,1 -6,9
EPS before cumulative effect of change in accounting principle 2,32 0,18 0,09Cumulative effect of change in accounting principle - -0,18 -0,18EPS 2,32 - -0,09

Income on time charter basis
23
Q1 03 Q1 02 2002 2001
VLCC, spot , T/C and B/B vessels 55 400 21 600 22 500 40 800VLCC, spot 60 500 18 900 21 000 -VLCC, T/C and B/B vessels 35 600 28 300 27 900Suezmax 40 800 16 500 18 400 30 700Suezmax OBO 42 400 18 000 17 700 28 900
01000020000300004000050000600007000080000
Q197
Q2 Q3 Q4 Q198
Q2 Q3 Q4 Q199
Q2 Q3 Q4 Q100
Q2 Q3 Q4 Q101
Q2 Q3 Q4 Q102
Q2 Q3 Q4 Q103
USD
per d
ay

Ship operating expenses (USD/day)
24
Q1 03 2002 2001 2000 1999
VLCC 5 632 6 311 6 339 6 940 6 828Suezmax 5 138 5 597 5 706 5 476 5 976Suezmax OBO 5 473 5 711 8 996 6 246 6 385Drybulk 2 763 4 053
No. of vessels drydocked or expected to be
012345678
Q101
Q201
Q301
Q401
Q102
Q202
Q302
Q402
Q103
Q203
Q303
Q403
Ship operating expenses
0
2 000
4 000
6 000
8 000
10 000
12 000
Q199
Q299
Q399
Q499
Q100
Q200
Q300
Q400
Q101
Q201
Q301
Q401
Q102
Q202
Q302
Q402
Q103
VLCC Suezmax Suezmax OBO
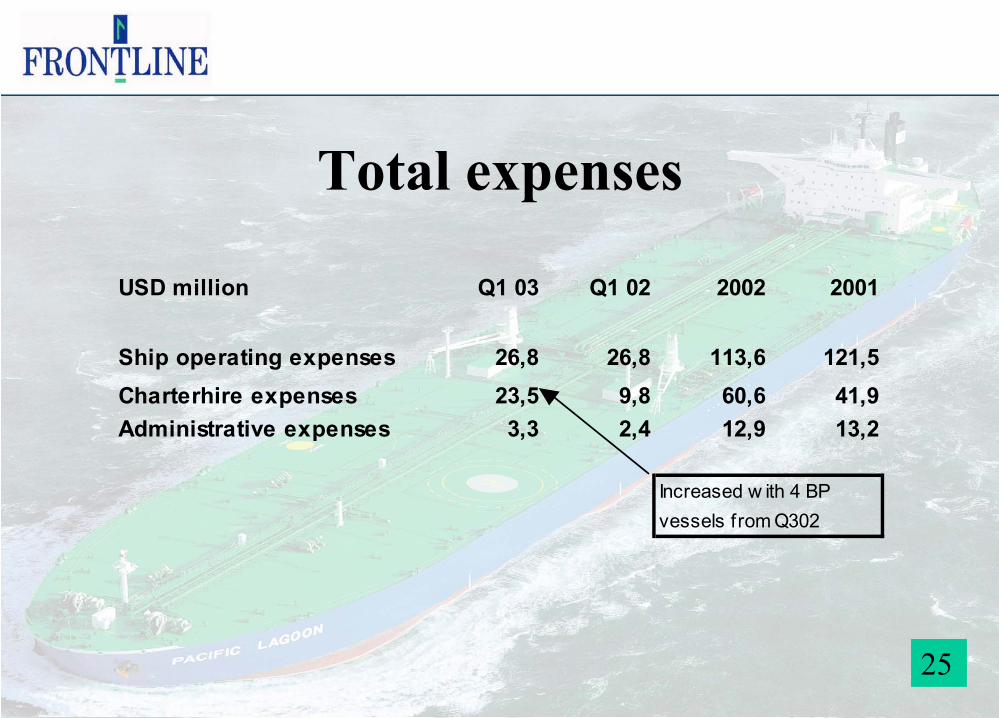
Total expenses
25
USD million Q1 03 Q1 02 2002 2001
Ship operating expenses 26,8 26,8 113,6 121,5Charterhire expenses 23,5 9,8 60,6 41,9Administrative expenses 3,3 2,4 12,9 13,2
Increased w ith 4 BPvessels from Q302
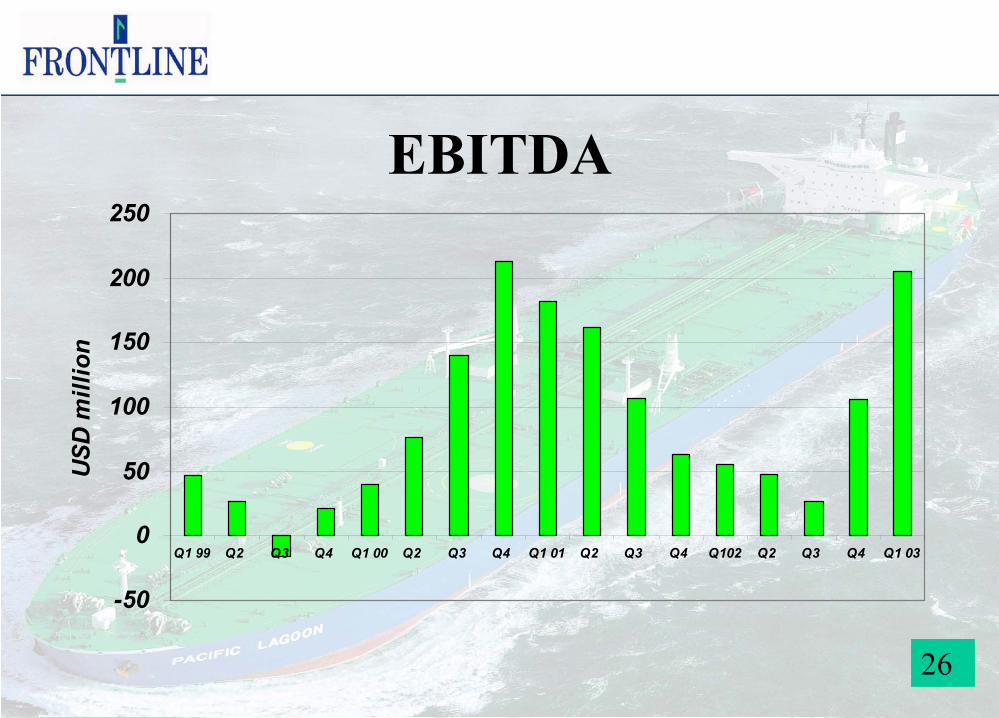
EBITDA
26
-50
0
50
100
150
200
250
Q1 99 Q2 Q3 Q4 Q1 00 Q2 Q3 Q4 Q1 01 Q2 Q3 Q4 Q102 Q2 Q3 Q4 Q1 03
USD
mill
ion

Financial items
27
USD million Q1 03 Q1 02 2 002
Net operating revenues 258,9 94,8 429,0Gain / loss on sale of vessels 0,5 0,0 -4,3Total expenses 53,6 39,0 187,1Operating profit before depreciation (EBITDA) 205,8 55,8 237,6Depreciation 36,2 34,0 139,9Operating profit (EBIT) 169,6 21,8 97,7Financial items 8,0 -7,8 -90,5Net profit (loss) before min. & taxes 177,6 14,0 7,2Taxes 0,0 0,0 0,0Cumulative effect of change in accounting principle 0,0 -14,1 -14,1Net profit (loss) 177,6 -0,1 -6,9
Interest income 2,7 2,5 13,1Interest expense -17,8 -17,7 -72,9Share of result in assoc 17,2 1,0 -10,7Other financial items 4,9 5,7 -6,6Foreign currency gain / loss 1,0 0,7 -13,3

Balance sheet - Assets
28
USD million Q1 03 Q1 02 2002
Short termCash and Bank deposits 149,4 81,6 100,3Other current assets 188,3 94,9 133,1
Long termNewbuildings 35,0 62,1 27,4Vessels and equipment, net 2 605,1 2 623,1 2 638,1Associated companies 136,7 116,6 119,3Goodwill - - -Deferred charges and other assets 18,4 16,5 17,7Total assets 3 132,9 2 994,8 3 035,9
Front Hawk 26.6 Oscilla 8.4
Trade rec./Voyages in progress 127.2Prepayment/inventory 44.6Other 16.4

29
0,0
50,0
100,0
150,0
200,0
250,0
300,0
Q199
Q299
Q399
Q499
Q100
Q200
Q300
Q400
Q101
Q201
Q301
Q401
Q102
Q202
Q302
Q402
Q103
Quarter
$mill
ion
Net working capital (excl. Cash) Net working capital (incl. Cash)Average net working capital Cash
Net working capital development

Associated companies
30
As at 31.03.03Debt
outstandingOur
shareGuarantee
liability
Our share of cash and net working capital
•Front Tobago (40%) partners OSG and Euronav 10,1 4,1 2,4 2,8•Ariake (33%), partners OSG and Euronav 45,8 15,3 4,2 2,1•Sakura (33%), partners OSG and Euronav 45,8 15,3 4,2 2,2•Ichiban (33%), partners OSG and Euronav 43,6 14,5 4,8 2,0•Tanabe (33%), partners OSG and Euronav 46,0 15,3 5,1 1,4•Hakata (33%), partners OSG and Euronav 48,3 16,1 5,4 2,0•Edinburgh (50,1%), partner OSG 23,6 11,8 3,5 2,4•Dundee (50,1%), partner OSG 23,6 11,8 3,5 2,4•Golden Fountain (50%) partner Euronav 29,3 14,6 29,3 3,7•New Circassia (50%) partners Ropner and Runciman 53,3 26,6 53,3 4,7•Pacific Lagoon (50%) partner Euronav 52,8 26,4 52,8 3,4
Total = 422,2 171,9 168,5 29,2
Yen denominated debt 116,7Our share 58,3
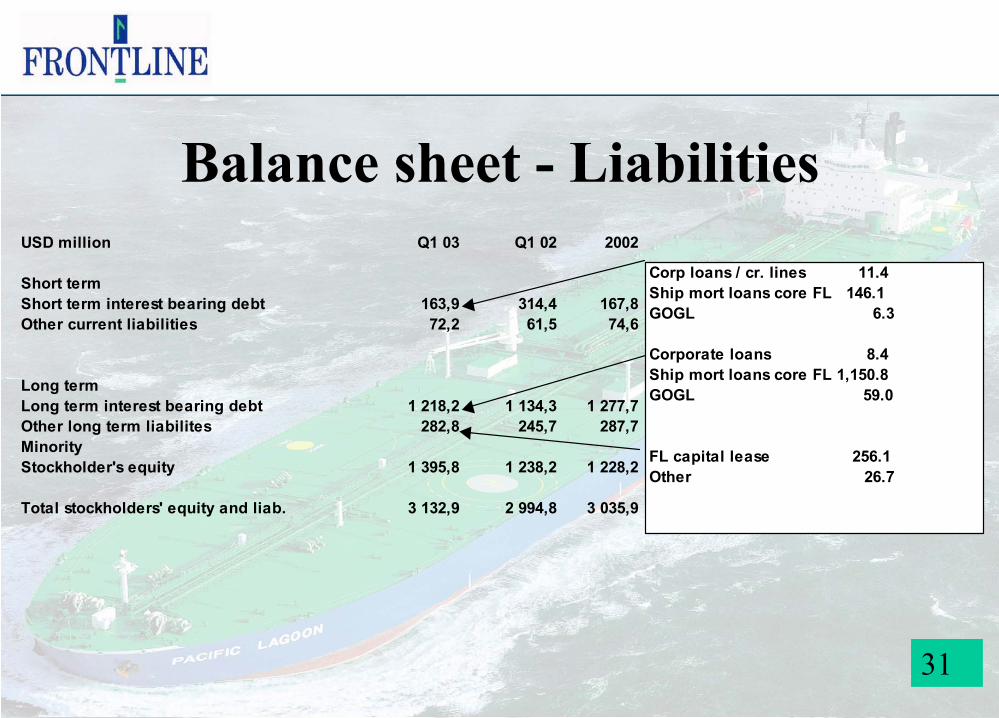
Balance sheet - Liabilities
31
USD million Q1 03 Q1 02 2002
Short termShort term interest bearing debt 163,9 314,4 167,8Other current liabilities 72,2 61,5 74,6
Long termLong term interest bearing debt 1 218,2 1 134,3 1 277,7Other long term liabilites 282,8 245,7 287,7MinorityStockholder's equity 1 395,8 1 238,2 1 228,2
Total stockholders' equity and liab. 3 132,9 2 994,8 3 035,9
Corp loans / cr. lines 11.4Ship mort loans core FL 146.1GOGL 6.3
Corporate loans 8.4Ship mort loans core FL 1,150.8GOGL 59.0
FL capital lease 256.1Other 26.7
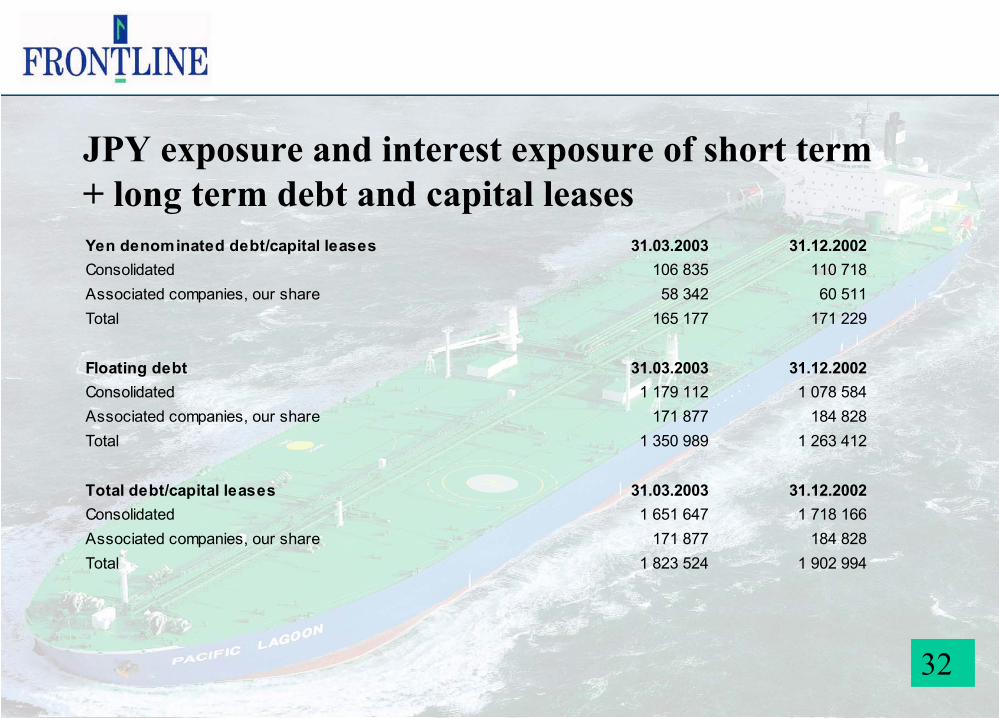
JPY exposure and interest exposure of short term + long term debt and capital leases
32
Yen denominated debt/capital leases 31.03.2003 31.12.2002Consolidated 106 835 110 718Associated companies, our share 58 342 60 511Total 165 177 171 229
Floating debt 31.03.2003 31.12.2002Consolidated 1 179 112 1 078 584Associated companies, our share 171 877 184 828Total 1 350 989 1 263 412
Total debt/capital leases 31.03.2003 31.12.2002Consolidated 1 651 647 1 718 166Associated companies, our share 171 877 184 828Total 1 823 524 1 902 994
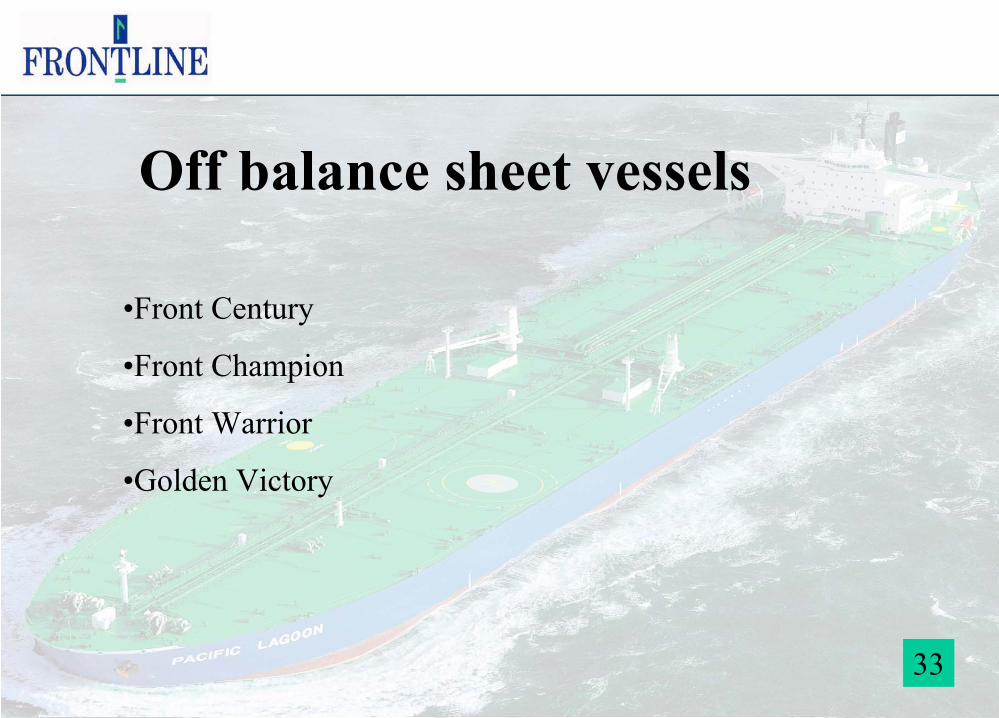
Off balance sheet vessels
•Front Century
•Front Champion
•Front Warrior
•Golden Victory
33

Remaining N/B commitments
34
Q3 03Gross cap. ex 52Bank loan 47Equity financing 5

Statement of Cashflows
35
STATEMENT O F CASHFLO WS 2003 2002 2002
(in thousands of $) Jan-Mar Jan-Mar Jan-Dec
(restated)O PERATING ACTIVITIES
Net income (loss) 177,61 -112 -6,931
Adjustments to reconcile net income to net cash provided by operating activit ies
Depreciation and amortisation 36,638 34,086 142,149
Unrealised foreign currency exchange (gain) loss -1,258 -1,685 14,176
Gain or loss on sale of assets -493 - 4,337
Results from associated companies -17,165 -986 10,711
Change in accounting principle - 14,142 14,142
Adjustment of financial derivatives to market value -6,16 -5,116 7,495
Other 1,131 - -Change in operating assets and liabilities -53,379 -11,112 -34,816
Net cash provided by operating activities 136,924 29,217 151,263
INVESTING ACTIVITIES
Additions to newbuildings, vessels and equipment -14,314 -118,542 -376,844
Advances to associated companies, net 269 -5,541 -20,01
Purchase of minority interest - -5,652 -6,822
Proceeds from sale of assets 3,943 10,5 177,902
Net cash used in investing activities -10,102 -119,235 -225,774
FINANCING ACTIVITIES
Proceeds from long-term debt, net of fees paid -1,077 123,177 370,88
Repayments of long-term debt -62,103 -66,153 -341,784
Repayment of capital leases -3,156 -59,626 -24,671
Dividends paid -11,471 -15,294 -19,116
Issue of shares, net 52 223 223
Net cash used in financing activities -77,755 -17,673 -14,468
Net decrease in cash and cash equivalents 49,067 -107,691 -88,979
Cash and cash equivalents at start of period 100,298 189,277 189,277
Cash and cash equivalents at end of period 149,365 81,586 100,298

Breakeven rates (USD / day)
36
Cash Breakeven P/L Breakeven
VLCC 20 727 19 998Suezmax 13 545 12 440Suezmax OBO 13 351 13 666

Breakeven requirements are very low
37Source TCE: Clarksons
Average TCE VLCC’s in the period 1990 – May 2, 2003 is USD 29,355 per day, as compared to P&L B/E May 2003 of USD 19,998 per day and cash B/E of USD 20,727 per day.
VLCC TCE versus Cash Breakeven
0,00010,00020,00030,00040,00050,00060,00070,00080,00090,000
100,000
jan-
90
jan-
91
jan-
92
jan-
93
jan-
94
jan-
95
jan-
96
jan-
97
jan-
98
jan-
99
jan-
00
jan-
01
jan-
02
jan-
03
USD
/day
VLCC TCE Cash Breakeven May 2003 Average TCE in the period

Breakeven requirements are very low
38Source TCE: Clarksons
Average TCE Suezmax in the period 1990 – May 2, 2003 is USD 21,552 per day, as compared to P&L B/E May 2003 of USD 12,440 per day and cash B/E of USD 13,545 per day.
Suezmax TCE versus Cash Breakeven
0,000
10,00020,000
30,00040,000
50,000
60,00070,000
80,000
jan-
90
jan-
91
jan-
92
jan-
93
jan-
94
jan-
95
jan-
96
jan-
97
jan-
98
jan-
99
jan-
00
jan-
01
jan-
02
jan-
03
USD
/day
Suezmax TCE Cash Breakeven M ay 2003 Average TCE in the period
Appendixes
39

Income on time charter basis
40
USD'000s Q1 03 Q1 02 2 002 2 001
VLCC, spot 137 383 27 896 159 679 243 886VLCC, T/C and B/B vessels 20 896 17 015 57 889 -Suezmax 76 909 30 975 137 974 220 787Suezmax OBO 30 304 12 524 51 029 79 435
Trading days minus off hire Q1 03 Q1 02 2 002 2 001
VLCC, spot 2 271 1 477 7 586 5 973 VLCC, T/C and B/B vessels 587 602 2 078 -Suezmax 1 883 1 881 7 480 7 195Suezmax OBO 715 695 2 875 2 746

Newbuildings versus scrapping candidatesVL/ULCC fleet as of May 7, 2003
41Source: P.F. Bassøe
1 1 3 6
22
4 3 62 4 1 3 1 2
9 610
161318
26
39
19
2821
1113
32
41
26
37
16
26
28
1
20
05
1015202530354045
1972
1974
1976
1978
1980
1982
1984
1986
1988
1990
1992
1994
1996
1998
2000
2002
2004
2006
NO
. VS
LS
Order No. VslsFleet No. Vsls

Newbuildings versus scrapping candidates Suezmax fleet as of May 7, 2003
42Source: P.F. Bassøe
6 48 6 8
5 3 1 3 4 30 1
4 6
15
7
2227
139 8 9 11
2115
2317
23
23
24
10
10
5
10
15
20
25
30
3519
74
1976
1978
1980
1982
1984
1986
1988
1990
1992
1994
1996
1998
2000
2002
2004
2006
NO
VS
LS
Order No. VslsFleet No. Vsls

VLCC/ULCC fleet development
43Source: P.F. Bassøe
Change y/y Apr:+4,4%
Mill. dwt
116,0
118,0
120,0
122,0
124,0
126,0
128,0
130,0
132,0
134,0
136,0
apr.00 jul.00 okt.00 jan.01 apr.01 jul.01 okt.01 jan.02 apr.02 jul.02 okt.02 jan.03 apr.03
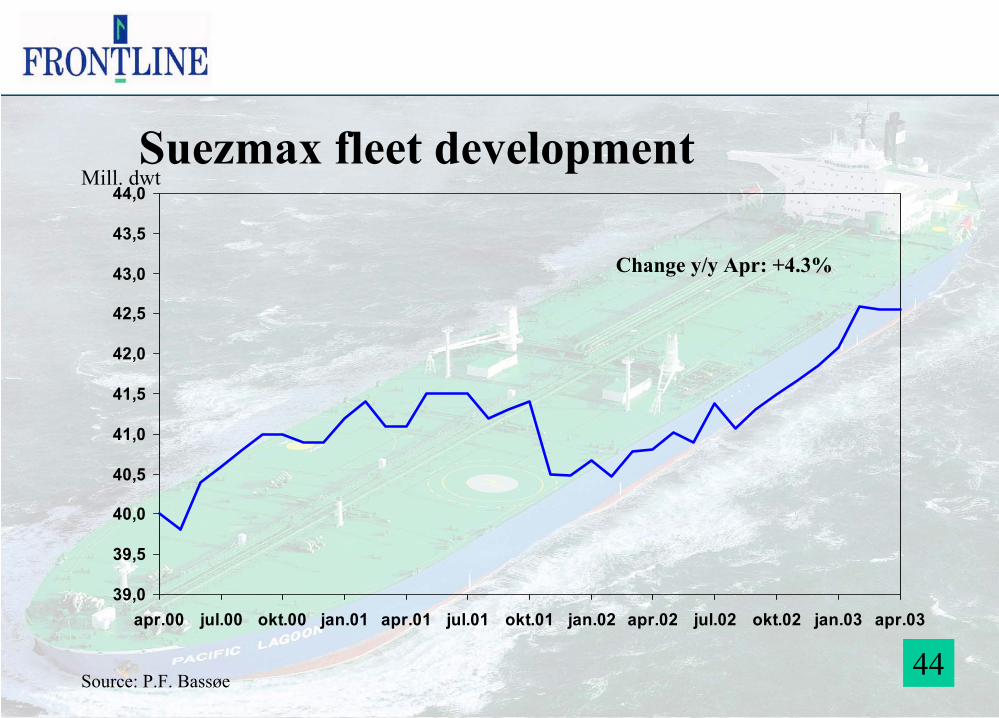
Suezmax fleet development
44Source: P.F. Bassøe
Change y/y Apr: +4.3%
Mill. dwt
39,0
39,5
40,0
40,5
41,0
41,5
42,0
42,5
43,0
43,5
44,0
apr.00 jul.00 okt.00 jan.01 apr.01 jul.01 okt.01 jan.02 apr.02 jul.02 okt.02 jan.03 apr.03