pyrolytic decomposition studies of aa2, a double-base ... · pyrolytic decomposition studies of...
TRANSCRIPT
ERD
C/C
ERL
TR-0
1-66
Pyrolytic Decomposition Studies of AA2, A Double-Base Propellant
Con
stru
ctio
n En
gine
erin
g
Res
earc
h La
bora
tory
Donald M. Cropek, Patricia A. Kemme, and Jean M. Day
October 2001
Approved for public release; distribution is unlimited.
REPORT DOCUMENTATION PAGE Form Approved OMB No.0704-0188
Public reporting burder for this collection of information is estibated to average 1 hour per response, including the time for reviewing instructions, searching existing data sources, gathering and maintaining the data needed, and completingand reviewing this collection of information. Send comments regarding this burden estimate or any other aspect of this collection of information, including suggestions for reducing this burder to Department of Defense, WashingtonHeadquarters Services, Directorate for Information Operations and Reports (0704-0188), 1215 Jefferson Davis Highway, Suite 1204, Arlington, VA 22202-4302. Respondents should be aware that notwithstanding any other provision oflaw, no person shall be subject to any penalty for failing to comply with a collection of information if it does not display a currently valid OMB control number. PLEASE DO NOT RETURN YOUR FORM TO THE ABOVE ADDRESS.
1. REPORT DATE (DD-MM-YYYY)01-10-2001
2. REPORT TYPEFinal
3. DATES COVERED (FROM - TO)xx-xx-2000 to xx-xx-2001
4. TITLE AND SUBTITLEPyrolytic Decomposition Studies of AA2, A Double-Base PropellentUnclassified
5a. CONTRACT NUMBER5b. GRANT NUMBER5c. PROGRAM ELEMENT NUMBER
6. AUTHOR(S)Cropek, Donald M. ;Kemme, Patricia A. ;Day, Jean M. ;
5d. PROJECT NUMBER5e. TASK NUMBER5f. WORK UNIT NUMBER
7. PERFORMING ORGANIZATION NAME AND ADDRESSU.S. Army Engineer Research and Development CenterConstruction Engineering Research LaboratoryPO Box 9005Champaign, IL61826-9005
8. PERFORMING ORGANIZATION REPORTNUMBERERDC TR-01-66
9. SPONSORING/MONITORING AGENCY NAME AND ADDRESS,
10. SPONSOR/MONITOR'S ACRONYM(S)11. SPONSOR/MONITOR'S REPORTNUMBER(S)
12. DISTRIBUTION/AVAILABILITY STATEMENTAPUBLIC RELEASE,13. SUPPLEMENTARY NOTES14. ABSTRACTPyrolysis is the thermal decomposition of a substance into a variety of by-products, usually in the absence of oxygen.15. SUBJECT TERMS16. SECURITY CLASSIFICATION OF: 17. LIMITATION
OF ABSTRACTSame as Report(SAR)
18.NUMBEROF PAGES46
19. NAME OF RESPONSIBLE PERSONCropek, Donald [email protected]
a. REPORTUnclassified
b. ABSTRACTUnclassified
c. THIS PAGEUnclassified
19b. TELEPHONE NUMBERInternational Area CodeArea Code Telephone NumberDSN
Standard Form 298 (Rev. 8-98)Prescribed by ANSI Std Z39.18
2 ERDC/CERL TR-01-66
Foreword
This study was conducted for Headquarters, U.S. Army Corps of Engineers under Project 4A162720D048, “Industrial Operations Pollution Control Technology”; Work Unit EP-UC5, “Studies of Pyrolytic Behavior of Energetic Materials.” The technical monitor was Richard L. Eichholtz, SFIM-AEC-TS.
The work was performed by the Environmental Processes Branch (CN-E) of the In-stallations Division (CN), Construction Engineering Research Laboratory (CERL). The CERL principal investigator was Dr. Donald M. Cropek. This research was supported in part by an appointment to the Research Participation Program at CERL administered by the Oak Ridge Institute for Science and Education through an interagency agreement between U.S. Department of Education and CERL. The technical editor was Linda L. Wheatley, Information Technology Laboratory — Champaign. Dr. Ilker Adiguzel is Chief, CN-E, Dr. John T. Bandy is Chief, CN; and Gary W. Schanche, CVT, is the associated Technical Director. The Acting Director of CERL is Dr. Alan W. Moore.
CERL is an element of the U.S. Army Engineer Research and Development Center (ERDC), U.S. Army Corps of Engineers. The Commander and Executive Director of ERDC is COL John W. Morris III, EN, and the Director of ERDC is Dr. James R. Houston.
DISCLAIMER: The contents of this report are not to be used for advertising, publication, or promotional purposes. Citation of trade names does not constitute an official endorsement or approval of the use of such commercial products. All product names and trademarks cited are the property of their respective owners. The findings of this report are not to be construed as an official Department of the Army position unless so designated by other authorized documents. DESTROY THIS REPORT WHEN IT IS NO LONGER NEEDED. DO NOT RETURN IT TO THE ORIGINATOR.

ERDC/CERL TR-01-66 3
Contents
Foreword................................................................................................................................................2
List of Figures and Tables ..................................................................................................................4
1 Introduction....................................................................................................................................7 Background......................................................................................................................... 7 Objective ........................................................................................................................... 10 Approach .......................................................................................................................... 10 Scope................................................................................................................................ 10 Mode of Technology Transfer ............................................................................................11
2 Experimental Parameters ..........................................................................................................12 Energetic Materials ........................................................................................................... 12 Equipment......................................................................................................................... 12 Pyrolysis............................................................................................................................ 14
3 Results and Discussion.............................................................................................................17 Light Molecular Weight Pyrolysis Results......................................................................... 17 Heavy Molecular Weight Pyrolysis Results ...................................................................... 25 Discussion ........................................................................................................................ 34 Pyrolysate Origins............................................................................................................. 37
4 Conclusion ...................................................................................................................................41
References ..........................................................................................................................................42
CERL Distribution ..............................................................................................................................44
4 ERDC/CERL TR-01-66
List of Figures and Tables
Figures
1 Chemical structures of AA2 components............................................................ 13 2 Timing profiles for the interface box, the pyrolysis probe, and the GC oven
for Configuration A .............................................................................................. 15 3 Timing profiles for the interface box, the pyrolysis probe and the GC oven
for Configuration B.............................................................................................. 15 4 LMW pyrogram of AA2 using Configuration A .................................................... 17 5 LMW pyrogram of NC using Configuration A ..................................................... 19 6 LMW pyrogram of NG using Configuration A ..................................................... 20 7 LMW pyrogram of triacetin using Configuration A .............................................. 22 8 LMW pyrogram of di-n-propyladipate using Configuration A.............................. 23 9 LMW pyrogram of NDPA using Configuration A ................................................. 24 10 HMW pyrogram of AA2 using Configuration B ................................................... 26 11 HMW pyrogram of NC using Configuration B..................................................... 27 12 HMW pyrogram of NG using Configuration B .................................................... 28 13 HMW pyrogram of triacetin using Configuration B ............................................. 29 14 HMW pyrogram of di-n-propyladipate using Configuration B ............................. 30 15 HMW pyrogram of NDPA using Configuration B ................................................ 31 16 HMW pyrogram of candelilla wax using Configuration B ................................... 33 Tables
1 Identification of numbered peaks in Figure 4 (LMW by-products from AA2 pyrolysis)............................................................................................................. 18
2 Identification of numbered peaks in Figure 5 (LMW by-products from NC pyrolysis)............................................................................................................. 19
3 Identification of numbered peaks in Figure 6 (LMW by-products from NG pyrolysis)............................................................................................................. 21
4 Identification of numbered peaks in Figure 7 (LMW by-products from triacetin pyrolysis) ............................................................................................... 22
5 Identification of numbered peaks in Figure 8 (LMW by-products from di-n-propyladipate pyrolysis) ...................................................................................... 23
6 Identification of numbered peaks in Figure 9 (LMW by-products from NDPA pyrolysis) .................................................................................................. 24
ERDC/CERL TR-01-66 5
7 Identification of numbered peaks in Figure 10 (HMW by-products from AA2 pyrolysis)............................................................................................................. 26
8 Identification of numbered peaks in Figure 11 (HMW by-products from NC pyrolysis)............................................................................................................. 27
9 Identification of numbered peaks in Figure 12 (HMW by-products from NG pyrolysis)............................................................................................................. 28
10 Identification of numbered peaks in Figure 13 (HMW by-products from triacetin pyrolysis) ............................................................................................... 29
11 Identification of numbered peaks in Figure 14 (HMW by-products from di-n-propyladipate pyrolysis)................................................................................... 30
12 Identification of numbered peaks in Figure 15 (HMW by-products from NDPA pyrolysis) .................................................................................................. 31
13 Identification of numbered peaks in Figure 16 ( HMW by-products from candelilla wax pyrolysis) ..................................................................................... 33
14 Compounds from pyrolysis of AA2 followed by the AA2 component that also produces this compound during pyrolysis................................................... 35

ERDC/CERL TR-01-66 7
1 Introduction
Background
The armaments industry generates approximately 1,600 tons/year of hazardous waste containing explosives and propellants as a result of munitions production (Stratta 1993). Controlled, high temperature incineration is identified as a Best Available Technology for the disposal of hazardous organic wastes (Taylor and Dellinger 1988; Smith, Vandell, and Hixson 1994), and several military installations have opted to use hazardous waste incinerators to dispose of much of this EM and waste (Subsinsky 1993). AA2 is an EM currently being incinerated during demilita-rization operations at one Army installation.
EMs have high potential reactivity or ignitability, which makes them ideally suited for incineration (controlled combustion at high temperature in the presence of ex-cess oxygen). Incineration, however, has its own reputation as a pollution source. Despite trial burns that guarantee at least 99.99 percent destruction and removal efficiency (DRE) of the input feed (NRC 1983; Koshland and Thomson 1992), incin-eration has low public acceptance. This is in large part due to the inevitable by-products generated by incineration. The two broad classifications of by-product emissions from incineration are principal organic hazardous constituents (POHC), which are compounds initially present in the waste that are not broken down, and products of incomplete combustion (PIC), which are any degradation by-product from POHC other than the most thermodynamically stable end product (Dellinger, Taylor, and Tirey 1991). A bench-scale method capable of predicting incineration effluent composition (i.e., POHC and PIC generated from a hazardous waste) is highly desirable. This method could test and optimize operational parameters off-line, identify the level of effluent control required to capture and eliminate recalci-trant POHC and PIC, and assess the potential of incineration for new waste streams (Dellinger et al. 1986).
A modern incinerator is designed to operate at temperatures greater than 1,800 °F (972 °C), a residence time for waste greater than 2 seconds and at least 50 percent excess air (Dellinger, Taylor, and Tirey 1991). Under these conditions, DREs exceed 99.9999 percent for even the most thermally stable compounds. Due to fluctuations in input feed and gas supply, inadequate mixing, decreased residence times due to short circuits, and localized temperature quenching, this level of DRE is not

8 ERDC/CERL TR-01-66
obtained, POHC are not completely destroyed, and PIC are formed. With respect to these conditions, the following parameters are important to PIC formation: oxygen concentration, reaction temperature, composition of the waste, degree of atomiza-tion of the waste, mixing of waste with oxygen, quenching of the combustion reaction, residence time, and halogen atoms present (Young and Voorhees 1992). Of these, oxygen concentration likely plays the primary role in PIC formation.
Numerous studies on high temperature degradation of organic compounds have rec-ognized that, as compared to oxygen rich atmospheres or stoichiometric ratios of re-quired oxygen to waste, oxygen deficient conditions produce the most complex mix-tures of PIC at the highest concentrations (Taylor and Dellinger 1988; Young and Voorhees 1992, and references therein; Taylor, Dellinger, and Tirey 1991; Fisher and Koshland 1992; Graham, Hall, and Dellinger 1986). Most bench-scale, labora-tory experiments have studied waste containing chlorinated compounds (Taylor and Dellinger 1988; Young and Voorhees 1992; Taylor, Dellinger, and Tirey 1991; Fisher and Koshland 1992; Graham, Hall, and Dellinger 1986; Young and Voorhees 1991; Taylor et al. 1994, and references therein; Lee, Cicek, and Senkan 1993; Vitovec et al. 1996; Tirey et al. 1990; Young and Voorhees 1992; Duvall, Rubey, and Mescher 1980) due to the potential creation of products far more toxic and recalcitrant than the input feed. As a general rule, results from these experiments illustrate that, when compared to oxygen rich conditions, PIC generated under oxygen deficient conditions are more numerous, the molecular weight and the distribution increase, and the maximum yields and temperature stability of the by-products increase.
This reasoning has been extended to incineration. Work by Dellinger et al. on thermal degradation of municipal type waste in atmospheres of varying oxygen con-tent shows that by-products generated under very low or no oxygen content condi-tions best match the PIC generated during incineration of these same wastes (Dellinger, Taylor, and Tirey 1991; Dellinger et al. 1986; Tirey et al. 1991; Taylor, Dellinger, and Lee 1990). It is postulated that under conditions of excess oxygen, POHC are completely oxidized to innocuous light permanent gases. In areas of low oxygen content, known as “pyrolytic pockets” (Tirey et al.) PIC are created. These areas are associated with poor micromixing of oxygen, fuel, and waste (Taylor, Dellinger, and Tirey 1991; Fisher and Koshland 1992; Vitovec et al. 1996; Taylor, Dellinger, and Lee 1990; Sidhu et al. 2001; Tanada et al. 1994). Replication of these pyrolytic pockets in the laboratory would generate the same PIC as incineration of the waste under worst-case conditions (Tirey et al. 1990). It has also been shown that DREs of POHC in oxygen deficient environments correlate well with full-scale emission data (Taylor and Dellinger 1988). These researchers conclude that labora-tory pyrolysis can provide valuable qualitative modeling of the incineration of mu-nicipal waste (Dellinger et al. 1986; Graham, Hall, and Dellinger 1986; Tirey et al. 1991; Taylor, Dellinger, and Lee 1990).

ERDC/CERL TR-01-66 9
Pyrolysis is the thermal decomposition of a substance into a variety of by-products, usually in the absence of oxygen. Pyrolytic reactions typically take place between 500 and 800 °C without the addition of any other assisting chemical (Moldoveanu 1998). Although pyrolysis experiments may be performed on samples in any physi-cal state, the resultant by-products are generally gaseous with possibly a solid resi-due due to the high temperatures involved. The coupling of a pyrolytic reaction ac-cessory with the appropriate analytical instrumentation provides identification of the gaseous by-products as well as chemical information regarding the decomposi-tion mechanism. Study of these pyrolytic by-products yields valuable information on the identity of the initial substance or on its behavior in high temperature envi-ronments.
The group of by-products from pyrolysis of a material is known as the pyrolysate. Since the pyrolysate is mostly gaseous in nature, combining pyrolysis with a gas analyzing method best characterizes the pyrolysate composition. Information on the pyrolysate can frequently be the best technique for study of substances that are not amenable to direct introduction into an analytical device. Soils, polymers, paints, microorganisms, powders, and other large complex samples can be pyrolyzed to obtain a gaseous pyrolysate that is a unique fingerprint to the original material (Wampler 1995).
One of the most useful techniques to unite with pyrolysis is gas chromatography/ mass spectrometry (GC/MS) thus resulting in the technique abbreviated PY/GC/MS. The powerful GC/MS analytical device is capable of separating and identifying the gaseous components of a mixture. It is ideal for analysis of the pyrolysate, which can be replete with components from light permanent gases to compounds that are larger than the initial components.
Data from analysis of the pyrolysate can be used in several ways. Identification of the starting material is one powerful application. For instance, PY/GC/MS data on a polymer material can rapidly characterize the polymer even though these large macromolecules cannot be directly analyzed or detected by GC/MS (Wampler 1995). As a second example, these experiments can not only establish the presence of mi-croorganisms in a sample but can also give taxonomy information (Moldoveanu 1998). Pyrolytic examination of forensic or environmental samples yields evidence for sample matching or sample origin. Other broad categories and applications of pyrolysis for sample characterization are given in Moldoveanu (1998) and Wampler (1995).
Pyrolytic data can further be used to characterize a material’s behavior under high temperature conditions. Gaseous by-products from conditions such as fires or ex-plosions can be produced from pyrolytic zones within these hot spots. Characteriza-
10 ERDC/CERL TR-01-66
tion and study of the behavior of energetic materials (EMs) during high tempera-ture decomposition with pyrolysis is a fertile field with primary relevance to the propellant industry. Understanding of the thermal decomposition of EMs provides predictions on new explosive molecules, predictions on sensitivity, and stability in-formation for long-term storage (Brill and James 1993). Example references on py-rolysis of energetic compounds include studies on nitroaromatic compounds (Brill and James 1993a and 1993b; Maksimov 1971), RDX (Botcher and Wight 1993), HMX (Kubota and Sakamoto 1989; Behrens 1990), and ammonium perchlorate composites (Oyumi, Mitarai, and Bazaki 1993).
Objective
The objective was to study the pyrolytic by-products of the double-base propellant AA2. This research studied the independent pyrolytic behavior of each individual component of AA2 to illustrate that the sum of the individual behavior is equivalent to the behavior of the total AA2. The data will show the power of pyrolysis to pre-dict which components will act as POHC and which generate individual PIC during incineration. Finally, pyrolytic experiments were studied to determine the benefi-cial effects of eliminating particular organic compounds from a double-base propel-lant formulation that create the largest variety of unwanted PIC.
Approach
Samples of original AA2 from the Army installation were collected for analysis. In addition, chemical standards were obtained for the major components of AA2. All samples and standards were subjected to pyrolysis and the by-products were ana-lyzed by GC/MS.
Scope
This work details pyrolytic studies on AA2 and its major organic constituents. Fu-ture work will compare this data to by-product data collected during the incinera-tion of AA2. Good matching between pyrolytic data and incineration data can sup-port the use of laboratory pyrolysis to predict incineration behavior of energetic or explosive compounds.
ERDC/CERL TR-01-66 11
Mode of Technology Transfer
The information derived from this study can be incorporated into guidance for envi-ronmental representatives at military installations for decisions regarding demilita-rization of EMs and pollution control when using incineration. In addition, these data will be included in a peer-reviewed journal article illustrating the utility of bench-scale pyrolysis for rapid prediction of incineration emissions.
This report will be made accessible through the World Wide Web (WWW) at http://www.cecer.army.mil.

12 ERDC/CERL TR-01-66
2 Experimental Parameters
Energetic Materials
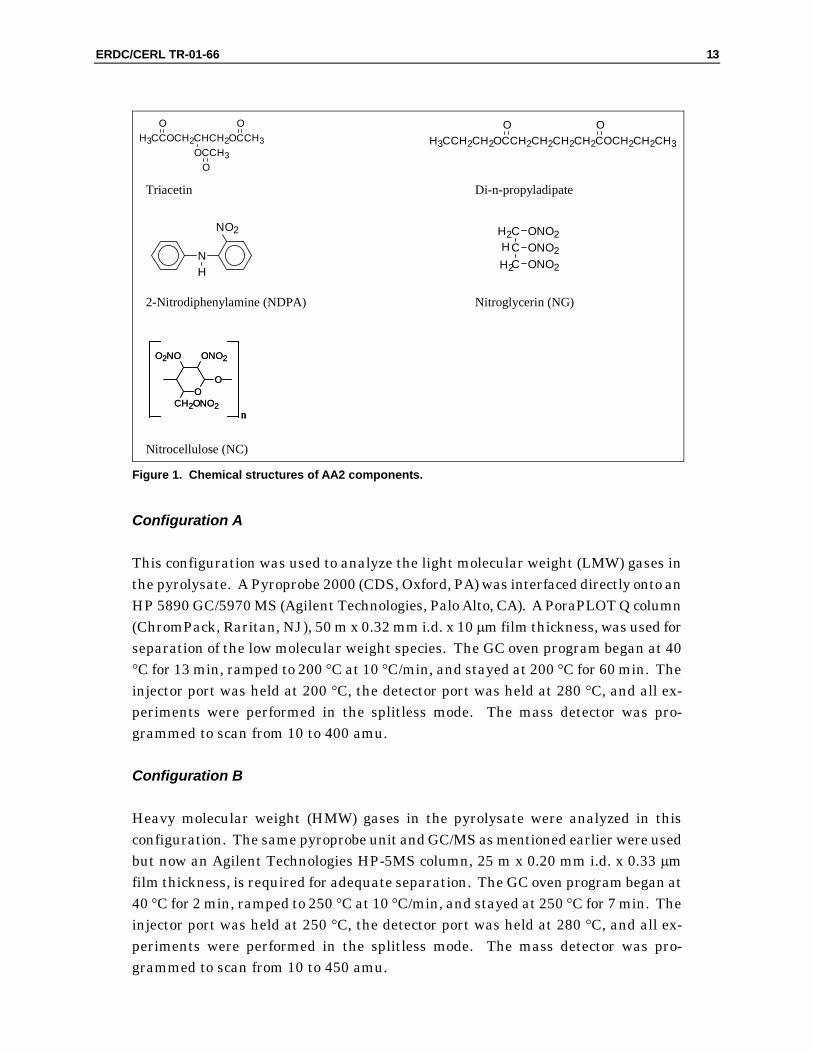
AA2 was obtained from the hazardous waste incinerator input feed at Radford Army Ammunition Plant (RAAP). The composition of the double base propellant AA2 includes the following ingredients in order of decreasing percent: nitrocellulose (NC), nitroglycerin (NG), an organometallic salt, triacetin, di-n-propyladipate, 2-nitrodiphenylamine (NDPA), and candelilla wax. The energetic components, NC and NG, comprise nearly 90 percent of AA2. The remaining components function as stabilizers, plasticizers, and burn rate modifiers. All compounds were obtained for individual pyrolytic investigation. Picatinny Arsenal, NJ provided 13.4 percent-nitrated NC. Nitroglycerin in acetone/ether solvent was both synthesized at this laboratory and purchased from Radian Corporation (Austin, TX) as a 1.0-mg/mL solution in acetonitrile. Triacetin (J.T. Baker, Phillipsburg, NJ), di-n-propyladipate (Fisher, Pittsburgh, PA), and NDPA and candelilla wax (Aldrich, Milwaukee, WI) were also obtained. All chemicals and materials were used as received without fur-ther purification. Figure 1 shows the chemical structures of these components are shown in Figure 1. Candelilla wax is not shown, as it is a complex mixture of hy-drocarbons, alcohols, sterols, and resins.
Equipment
A small pyrolysis chamber was installed on the injection port of a GC/MS. In this arrangement, the helium carrier gas flows through the chamber during pyrolysis and transports all gaseous by-products directly into the injection port of the GC. Two different instrument configurations were used in this study due to the expected characteristics of the pyrolysate. These configurations are described in the next two paragraphs.
ERDC/CERL TR-01-66 13
H3CCOCH2CHCH2OCCH3
O O
OCCH3O
H3CCH2CH2OCCH2CH2CH2CH2COCH2CH2CH3
O O
NH
NO2 H2C ONO2C ONO2C ONO2H2
H
O
ONO2
O
CH2ONO2
O2NO
n
O
ONO2
O
CH2ONO2
O2NO
nn
Triacetin Di-n-propyladipate
2-Nitrodiphenylamine (NDPA) Nitroglycerin (NG)
Nitrocellulose (NC) Figure 1. Chemical structures of AA2 components.
Configuration A
This configuration was used to analyze the light molecular weight (LMW) gases in the pyrolysate. A Pyroprobe 2000 (CDS, Oxford, PA) was interfaced directly onto an HP 5890 GC/5970 MS (Agilent Technologies, Palo Alto, CA). A PoraPLOT Q column (ChromPack, Raritan, NJ), 50 m x 0.32 mm i.d. x 10 �m film thickness, was used for separation of the low molecular weight species. The GC oven program began at 40 �C for 13 min, ramped to 200 �C at 10 �C/min, and stayed at 200 �C for 60 min. The injector port was held at 200 �C, the detector port was held at 280 �C, and all ex-periments were performed in the splitless mode. The mass detector was pro-grammed to scan from 10 to 400 amu.
Configuration B
Heavy molecular weight (HMW) gases in the pyrolysate were analyzed in this configuration. The same pyroprobe unit and GC/MS as mentioned earlier were used but now an Agilent Technologies HP-5MS column, 25 m x 0.20 mm i.d. x 0.33 �m film thickness, is required for adequate separation. The GC oven program began at 40 �C for 2 min, ramped to 250 �C at 10 �C/min, and stayed at 250 �C for 7 min. The injector port was held at 250 �C, the detector port was held at 280 �C, and all ex-periments were performed in the splitless mode. The mass detector was pro-grammed to scan from 10 to 450 amu.
14 ERDC/CERL TR-01-66
Pyrolysis
A complete pyrolytic investigation for a sample consisted of two separate experi-ments, one using Configuration A and one using Configuration B. A quartz tube (CDS, Oxford, PA) was loaded with a plug of quartz wool to keep the sample in the hot zone of the probe during pyrolysis. This tube was cleaned three times at 1200 �C for 20 s. A sample mass between 2 and 6 mg was loaded onto the wool. The pre-pared tube was placed inside a platinum wire coil on the probe and the probe was inserted into the pyrolysis chamber. A 20-min wait period allowed entrant air to pass through the system. The pyrolysis chamber was then heated from 40 to 150 �C at 20 �C/min and was held at this elevated temperature throughout the run time. The probe was fired after the pyrolysis chamber reached 150 �C, heating the sample from ambient to 900 �C at a rate of 20 �C/ms and holding at 900 �C for 100 s.
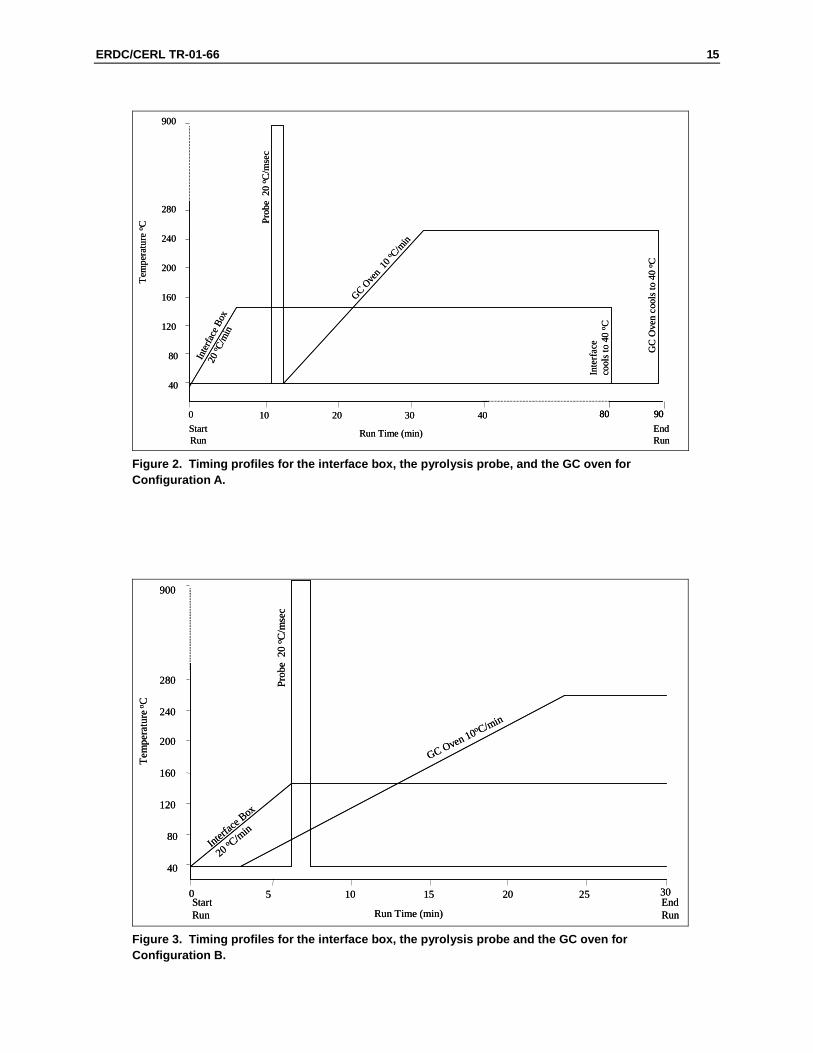
The timing among the interface box, the pyrolysis probe, and the GC oven program are shown in Figures 2 and 3 for the two configurations. The probe fires after the interface box has reached its final temperature of 150 �C. In some cases, the run time was extended due to the observation of late eluting peaks. In Configuration A (Figure 2), the oven temperature begins ramping only after the probe is fired. Some of the LMW species rapidly elute from the PoraPLOT Q column even at ambient (40 �C) temperatures. This oven temperature profile allows these compounds to experi-ence longer elution times and better separation. A long run time is needed because the PoraPLOT Q column strongly, if not irreversibly, retains many of the HMW spe-cies. A blank run with no loaded sample was repeated after each sample until no residual peaks were observed. Experiments were also performed without firing the probe and no evolution of LMW by-products due solely to the 150 �C interface box temperature was noted. In Configuration B (Figure 3), the oven temperature begins ramping before the probe is fired. An oven temperature of approximately 90 �C is reached during pyrolysis. The HMW species have reasonable retention on the HP5 MS column even at higher temperatures and initial heating of the oven serves to shorten the total analysis time. There is also no generation of HMW by-products due solely to the 150 �C interface box temperature.
Identification of the pyrolysate peaks was accomplished by comparing mass spectral data to library standards. No attempt was made to acquire standards of these iden-tified peaks for duplication of elution times and mass spectra due to the difficulty in replicating pyrolysis conditions via injection and the sheer number of pyrolysate peaks.
ERDC/CERL TR-01-66 15
0 10 20 30 40
40
900
280
240
200
160
120
80
80 90
Run Time (min)
GC Ove
n 10
o C/min
Inter
face
Box
20 o C/
min
Prob
e 2
0 o C
/mse
c
Inte
rfac
e co
ols t
o 40
o C
GC
Ove
n co
ols t
o 40
o C
StartRun
EndRun
Tem
pera
ture
o C
0 10 20 30 40
40
900
280
240
200
160
120
80
80 9080 90
Run Time (min)
GC Ove
n 10
o C/min
Inter
face
Box
20 o C/
min
Prob
e 2
0 o C
/mse
c
Inte
rfac
e co
ols t
o 40
o C
GC
Ove
n co
ols t
o 40
o C
StartRun
EndRun
Tem
pera
ture
o C
Figure 2. Timing profiles for the interface box, the pyrolysis probe, and the GC oven for Configuration A.
0 5 10 15 20
Run Time (min)
GC Oven 10o C/min
Interfac
e Box
20 o C/min
Prob
e 2
0 o C
/mse
c
StartRun
EndRun
25 30
40
900
280
240
200
160
120
80
Tem
pera
ture
o C
0 5 10 15 20
Run Time (min)
GC Oven 10o C/min
Interfac
e Box
20 o C/min
Prob
e 2
0 o C
/mse
c
StartRun
EndRun
25 30
40
900
280
240
200
160
120
80
Tem
pera
ture
o C
Figure 3. Timing profiles for the interface box, the pyrolysis probe and the GC oven for Configuration B.
16 ERDC/CERL TR-01-66
The resultant peaks in the LMW pyrolysates were analyzed by the Autointegrate function of the HP ChemStation software. Only in cases where the baseline for a peak was clearly skewed was manual integration performed. Peak areas are re-ported as a percent of the total peak area. The total peak area does not add to 100 percent since no attempt was made to disregard or eliminate unidentified peaks or to completely correct grossly broadened peaks. The percent area values in the ta-bles listed in the next sections can provide comparative information on the by-products in each pyrolysate.
The peaks in the HMW tables later in this chapter were analyzed differently. Due to the difficulty in measuring a peak area for the broad HMW peaks in each pyrolys-ate, these data were analyzed by manual integration of each major or identified peak. The total percent areas in these tables are therefore always 100 percent. Again, the peak areas are primarily for comparative information.

ERDC/CERL TR-01-66 17
3 Results and Discussion
Light Molecular Weight Pyrolysis Results
AA2
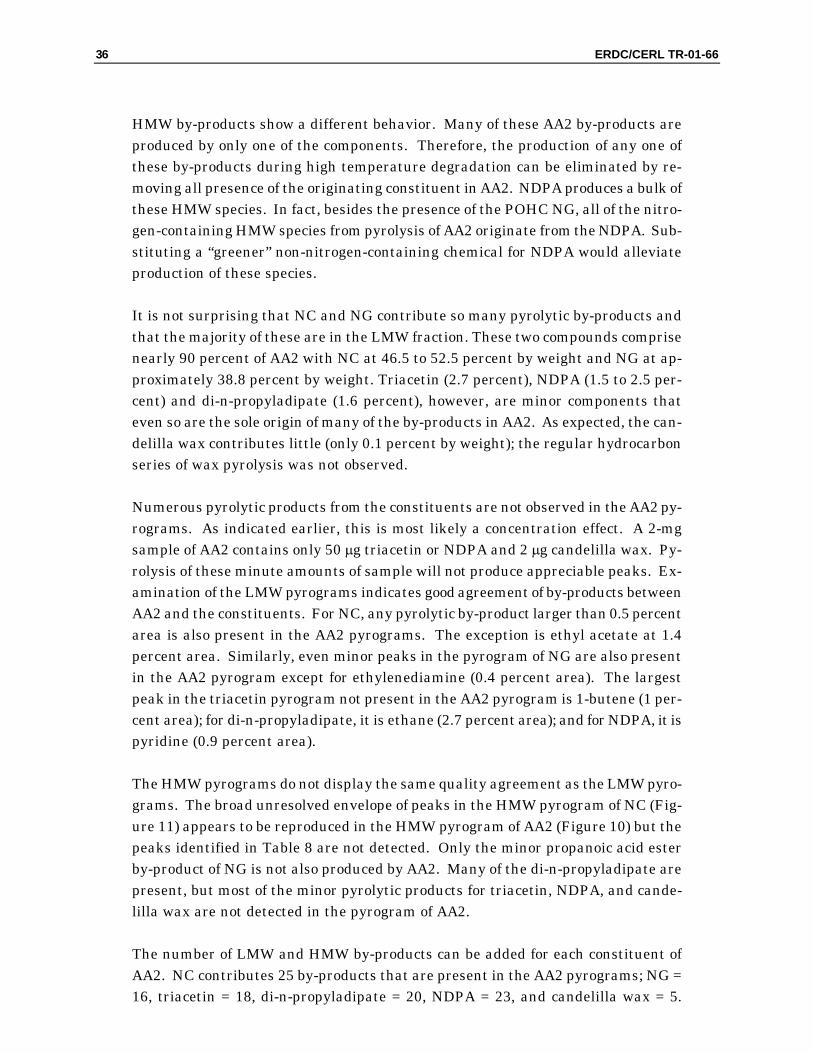
Figure 4 shows the pyrogram of AA2 using Configuration A. The inset expands the time scale to show a number of the smaller peaks. Table 1 identifies the numbered peaks by compound name, molecular formula, molecular weight, and peak area as a percent of the total area. AA2 comprises a considerable amount of EM. As expected for these types of materials, exposure to high temperatures generates a great deal of light gases. Carbon monoxide, nitric oxide, carbon dioxide, and water make up al-most 70 percent of the peak area. Formaldehyde, acetylene, acetic acid, propene, ethylene oxide, and 2-propenal make up the next 20 percent of the LMW species. All other by-products are small in comparison. Furan stands out as the by-product of highest notoriety. This experiment was repeated for an aqueous slurry of AA2 both as received from RAAP and dried at room temperature. The pyrogram was identical for both samples except for elevated levels of water in the slurry pyrogram. After demonstrating this negligible effect of water, only dried samples were pyro-lyzed for better control of the sample mass placed in the pyrolysis tube.
10.0 20.0 30.0 40.0 50.0 60.0 80.0
1
2
3
46
26 2728 29 30 31 32 33
70.0
24.0 26.0 28.0 30.0 32.0 34.0
7
8
109 11
12
13
141516 17
18
19
20 2122
2324
25
Retention Time (min.)
Abu
ndan
ce
1219
5
10.0 20.0 30.0 40.0 50.0 60.0 80.0
1
2
3
46
26 2728 29 30 31 32 33
70.0
24.0 26.0 28.0 30.0 32.0 34.0
7
8
109 11
12
13
141516 17
18
19
20 2122
2324
25
Retention Time (min.)
Abu
ndan
ce
1219
5
Figure 4. LMW pyrogram of AA2 using Configuration A (Filename: AA2b.d).
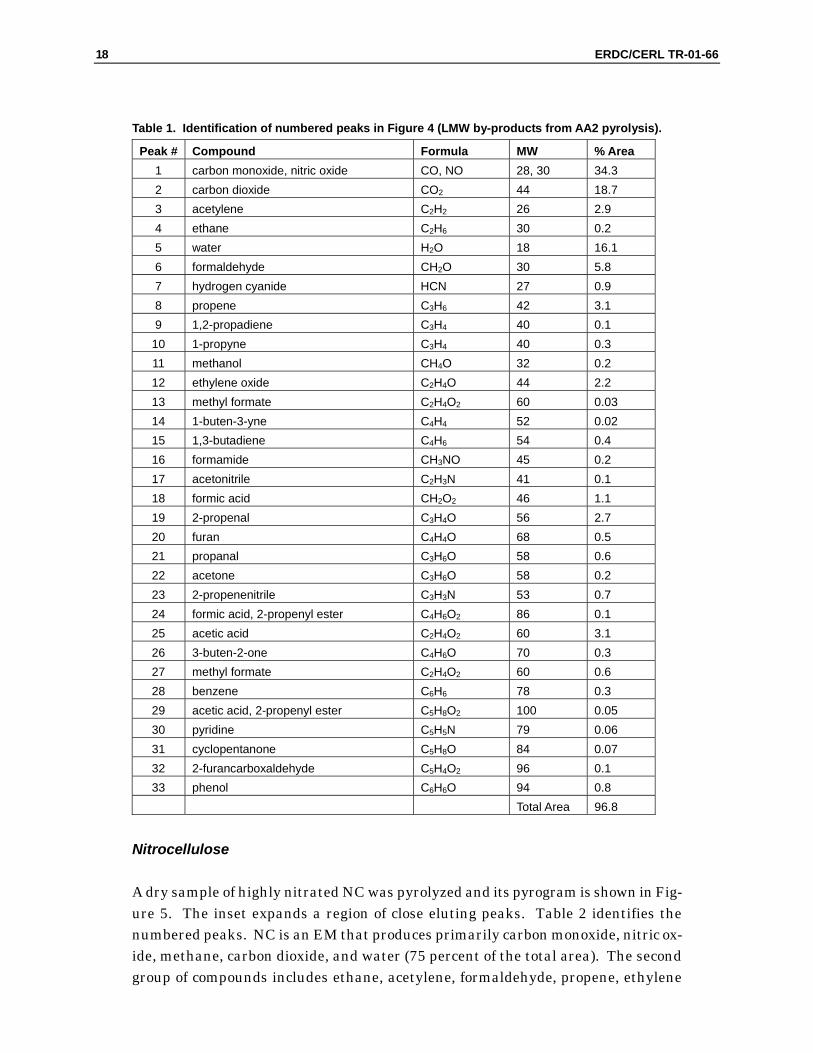
18 ERDC/CERL TR-01-66
Table 1. Identification of numbered peaks in Figure 4 (LMW by-products from AA2 pyrolysis).
Peak # Compound Formula MW % Area 1 carbon monoxide, nitric oxide CO, NO 28, 30 34.3 2 carbon dioxide CO2 44 18.7 3 acetylene C2H2 26 2.9 4 ethane C2H6 30 0.2 5 water H2O 18 16.1 6 formaldehyde CH2O 30 5.8 7 hydrogen cyanide HCN 27 0.9 8 propene C3H6 42 3.1 9 1,2-propadiene C3H4 40 0.1
10 1-propyne C3H4 40 0.3 11 methanol CH4O 32 0.2 12 ethylene oxide C2H4O 44 2.2 13 methyl formate C2H4O2 60 0.03 14 1-buten-3-yne C4H4 52 0.02 15 1,3-butadiene C4H6 54 0.4 16 formamide CH3NO 45 0.2 17 acetonitrile C2H3N 41 0.1 18 formic acid CH2O2 46 1.1 19 2-propenal C3H4O 56 2.7 20 furan C4H4O 68 0.5 21 propanal C3H6O 58 0.6 22 acetone C3H6O 58 0.2 23 2-propenenitrile C3H3N 53 0.7 24 formic acid, 2-propenyl ester C4H6O2 86 0.1 25 acetic acid C2H4O2 60 3.1 26 3-buten-2-one C4H6O 70 0.3 27 methyl formate C2H4O2 60 0.6 28 benzene C6H6 78 0.3 29 acetic acid, 2-propenyl ester C5H8O2 100 0.05 30 pyridine C5H5N 79 0.06 31 cyclopentanone C5H8O 84 0.07 32 2-furancarboxaldehyde C5H4O2 96 0.1 33 phenol C6H6O 94 0.8
Total Area 96.8
Nitrocellulose
A dry sample of highly nitrated NC was pyrolyzed and its pyrogram is shown in Fig-ure 5. The inset expands a region of close eluting peaks. Table 2 identifies the numbered peaks. NC is an EM that produces primarily carbon monoxide, nitric ox-ide, methane, carbon dioxide, and water (75 percent of the total area). The second group of compounds includes ethane, acetylene, formaldehyde, propene, ethylene
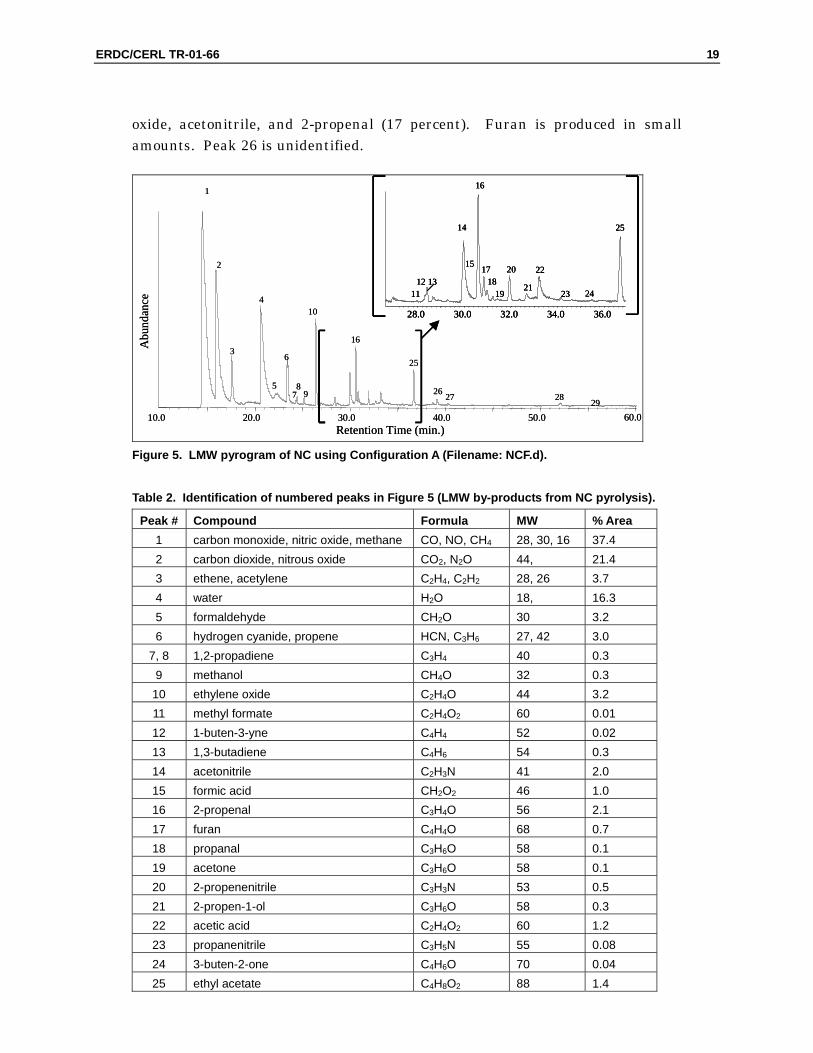
ERDC/CERL TR-01-66 19
oxide, acetonitrile, and 2-propenal (17 percent). Furan is produced in small amounts. Peak 26 is unidentified.
1
3
4
5
6
89
10
10.0 20.0 30.0 40.0 50.0 60.0
2
16
25
26 27 28 29
28.0 30.0 32.0 34.0 36.0
1112 13
14
15
16
1718
19
20
21
22
23 24
25
Retention Time (min.)
Abu
ndan
ce
7
1
3
4
5
6
89
10
10.0 20.0 30.0 40.0 50.0 60.0
2
16
25
26 27 28 29
28.0 30.0 32.0 34.0 36.0
1112 13
14
15
16
1718
19
20
21
22
23 24
25
28.0 30.0 32.0 34.0 36.0
1112 13
14
15
16
1718
19
20
21
22
23 24
25
Retention Time (min.)
Abu
ndan
ce
7
Figure 5. LMW pyrogram of NC using Configuration A (Filename: NCF.d).
Table 2. Identification of numbered peaks in Figure 5 (LMW by-products from NC pyrolysis).
Peak # Compound Formula MW % Area 1 carbon monoxide, nitric oxide, methane CO, NO, CH4 28, 30, 16 37.4 2 carbon dioxide, nitrous oxide CO2, N2O 44, 21.4 3 ethene, acetylene C2H4, C2H2 28, 26 3.7 4 water H2O 18, 16.3 5 formaldehyde CH2O 30 3.2 6 hydrogen cyanide, propene HCN, C3H6 27, 42 3.0
7, 8 1,2-propadiene C3H4 40 0.3 9 methanol CH4O 32 0.3
10 ethylene oxide C2H4O 44 3.2 11 methyl formate C2H4O2 60 0.01 12 1-buten-3-yne C4H4 52 0.02 13 1,3-butadiene C4H6 54 0.3 14 acetonitrile C2H3N 41 2.0 15 formic acid CH2O2 46 1.0 16 2-propenal C3H4O 56 2.1 17 furan C4H4O 68 0.7 18 propanal C3H6O 58 0.1 19 acetone C3H6O 58 0.1 20 2-propenenitrile C3H3N 53 0.5 21 2-propen-1-ol C3H6O 58 0.3 22 acetic acid C2H4O2 60 1.2 23 propanenitrile C3H5N 55 0.08 24 3-buten-2-one C4H6O 70 0.04 25 ethyl acetate C4H8O2 88 1.4
20 ERDC/CERL TR-01-66
Peak # Compound Formula MW % Area 26 60, 42, 31, 29 amu - - 0.5 27 benzene C6H6 78 0.2 28 toluene C7H8 92 0.3 29 2-furancarboxaldehyde C5H4O2 96 0.1
Total Area 99.75
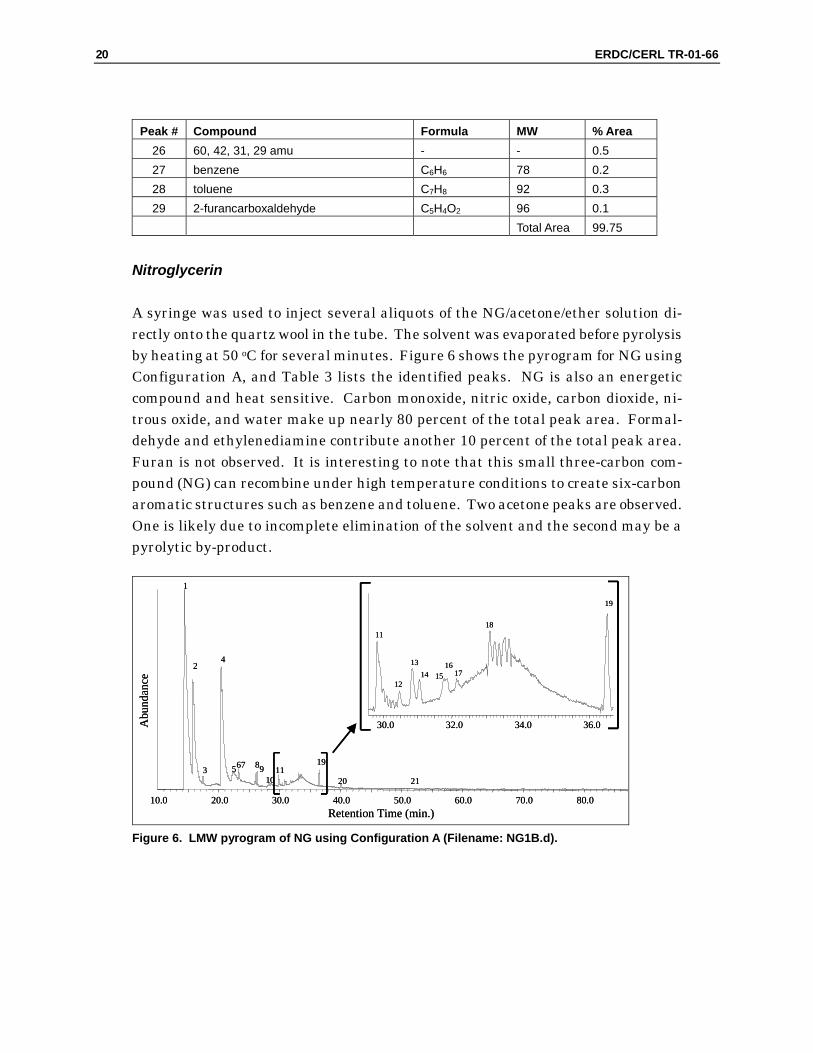
Nitroglycerin
A syringe was used to inject several aliquots of the NG/acetone/ether solution di-rectly onto the quartz wool in the tube. The solvent was evaporated before pyrolysis by heating at 50 oC for several minutes. Figure 6 shows the pyrogram for NG using Configuration A, and Table 3 lists the identified peaks. NG is also an energetic compound and heat sensitive. Carbon monoxide, nitric oxide, carbon dioxide, ni-trous oxide, and water make up nearly 80 percent of the total peak area. Formal-dehyde and ethylenediamine contribute another 10 percent of the total peak area. Furan is not observed. It is interesting to note that this small three-carbon com-pound (NG) can recombine under high temperature conditions to create six-carbon aromatic structures such as benzene and toluene. Two acetone peaks are observed. One is likely due to incomplete elimination of the solvent and the second may be a pyrolytic by-product.
30.0 32.0 34.0 36.0
11
12
1314 15
1617
19
10.0 20.0 30.0 40.0 50.0 60.0 70.0 80.0
1
2
3
4
67 8910 20 21
5 1119
Retention Time (min.)
Abu
ndan
ce
18
30.0 32.0 34.0 36.0
11
12
1314 15
1617
19
10.0 20.0 30.0 40.0 50.0 60.0 70.0 80.0
1
2
3
4
67 8910 20 21
5 1119
Retention Time (min.)
Abu
ndan
ce
18
Figure 6. LMW pyrogram of NG using Configuration A (Filename: NG1B.d).
ERDC/CERL TR-01-66 21
Table 3. Identification of numbered peaks in Figure 6 (LMW by-products from NG pyrolysis).
Peak # Compound Formula MW % Area 1 carbon monoxide, nitric oxide CO, NO 28, 30 49.6 2 carbon dioxide, nitrous oxide CO2, N2O 44 13.8 3 acetylene, ethene C2H2, C2H4 26, 28 0.4 4 water H2O 18 22.5 5 formaldehyde CH2O 30 9.4 6 hydrogen cyanide HCN 27 0.2 7 propene C3H6 42 0.3 8 ethylene oxide C2H4O 44 0.5 9 ethylene oxide C2H4O 44 0.4
10 1,3-butadiene C4H6 54 0.1 11 formic acid CH2O2 46 0.6 12 2-propenal C3H4O 56 0.1 13 acetone C3H6O 58 0.3 14 acetone C3H6O 58 0.2 15 2-propenenitrile C3H3N 53 0.1 16 formic acid, ethyl ester C3H6O2 74 0.1 17 nitromethane CH3NO2 61 0.1 18 ethylenediamine C2H8N2 60 0.4 19 ethyl acetate C4H8O2 88 0.7 20 benzene C6H6 78 0.2 21 toluene C7H8 92 0.1
Total Area 100.0
Triacetin
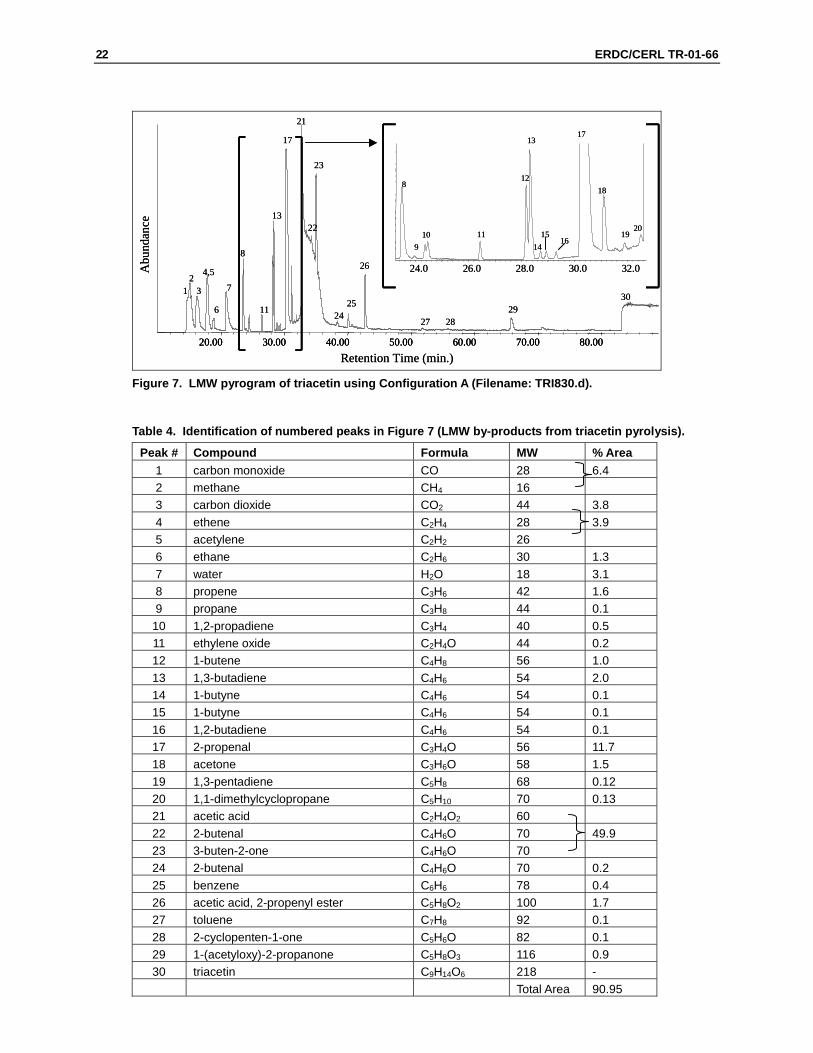
Figure 7 is the pyrogram for triacetin using Configuration A, and Table 4 lists the identity of the numbered peaks. Since triacetin is not an energetic molecule, the pyrogram is not dominated by light permanent gases as occurred in the three previ-ous samples. Instead, acetic acid is the major by-product, followed by 2-propenal. Although 2-butenal and 3-buten-2-one, which co-elute with the broad acetic acid peak, are grouped with the acetic acid peak area in the % Area column, they are not major peaks. The second tier of by-products includes the light gases, water, pro-pene, 1,3-butadiene, acetone, and the acetic acid, 2-propenyl ester. For the first time, the pyrolyzed compound is also observed in the pyrogram. Triacetin is ob-served as a plateau eluting at the end of the analysis. It is not classified as a pyro-lytic by-product and is not included in the % Area analysis in Table 4. Apparently, triacetin has a large degree of thermal stability and volatilizes at the pyrolysis tem-perature. Triacetin was exceedingly difficult to remove from the GC column used in Configuration A, with continual carryover and repeated presence in blank runs fol-lowing this experiment.
22 ERDC/CERL TR-01-66
12
3
4,5
6
7
8
13
11
20.00 30.00 40.00 50.00 60.00 70.00 80.00
17
21
22
23
2425
26
27 2829
30
Retention Time (min.)
Abu
ndan
ce
24.0 26.0 28.0 30.0 32.0
8
910 11
12
13
1415
16
17
18
1920
12
3
4,5
6
7
8
13
11
20.00 30.00 40.00 50.00 60.00 70.00 80.0020.00 30.00 40.00 50.00 60.00 70.00 80.00
17
21
22
23
2425
26
27 2829
30
Retention Time (min.)
Abu
ndan
ce
24.0 26.0 28.0 30.0 32.0
8
910 11
12
13
1415
16
17
18
1920
Figure 7. LMW pyrogram of triacetin using Configuration A (Filename: TRI830.d).
Table 4. Identification of numbered peaks in Figure 7 (LMW by-products from triacetin pyrolysis).
Peak # Compound Formula MW % Area 1 carbon monoxide CO 28 6.4 2 methane CH4 16 3 carbon dioxide CO2 44 3.8 4 ethene C2H4 28 3.9 5 acetylene C2H2 26 6 ethane C2H6 30 1.3 7 water H2O 18 3.1 8 propene C3H6 42 1.6 9 propane C3H8 44 0.1
10 1,2-propadiene C3H4 40 0.5 11 ethylene oxide C2H4O 44 0.2 12 1-butene C4H8 56 1.0 13 1,3-butadiene C4H6 54 2.0 14 1-butyne C4H6 54 0.1 15 1-butyne C4H6 54 0.1 16 1,2-butadiene C4H6 54 0.1 17 2-propenal C3H4O 56 11.7 18 acetone C3H6O 58 1.5 19 1,3-pentadiene C5H8 68 0.12 20 1,1-dimethylcyclopropane C5H10 70 0.13 21 acetic acid C2H4O2 60 22 2-butenal C4H6O 70 49.9 23 3-buten-2-one C4H6O 70 24 2-butenal C4H6O 70 0.2 25 benzene C6H6 78 0.4 26 acetic acid, 2-propenyl ester C5H8O2 100 1.7 27 toluene C7H8 92 0.1 28 2-cyclopenten-1-one C5H6O 82 0.1 29 1-(acetyloxy)-2-propanone C5H8O3 116 0.9 30 triacetin C9H14O6 218 -
Total Area 90.95
ERDC/CERL TR-01-66 23
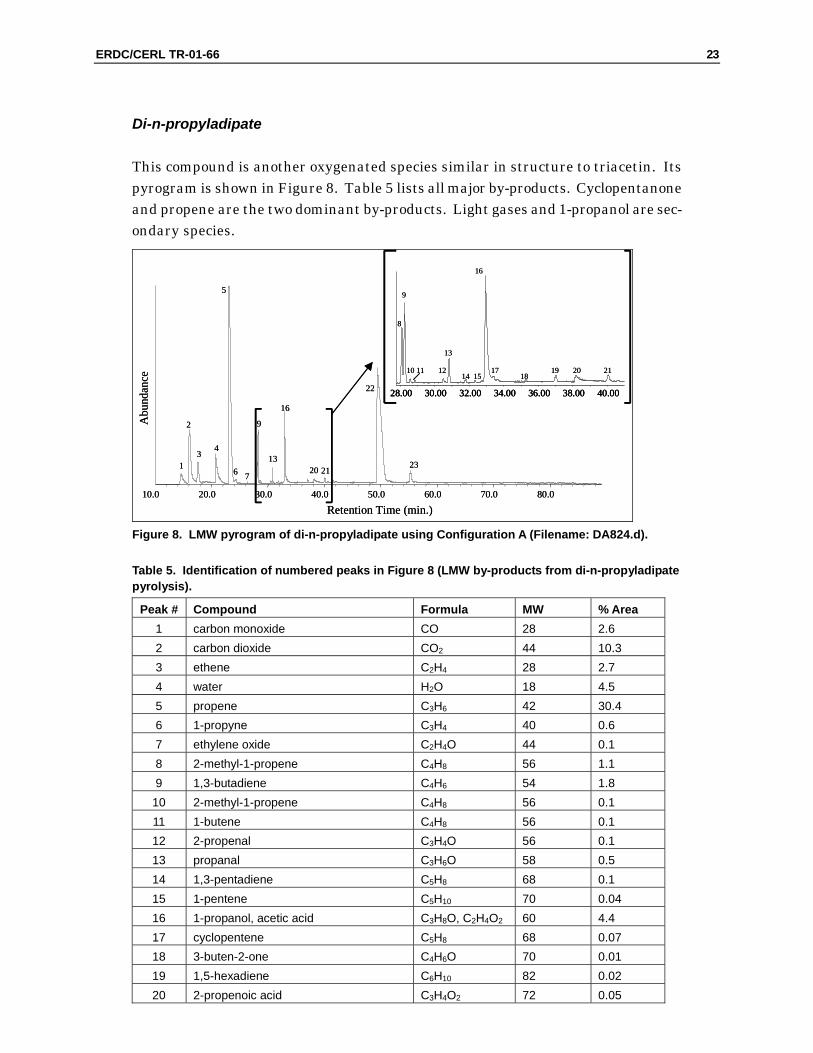
Di-n-propyladipate
This compound is another oxygenated species similar in structure to triacetin. Its pyrogram is shown in Figure 8. Table 5 lists all major by-products. Cyclopentanone and propene are the two dominant by-products. Light gases and 1-propanol are sec-ondary species.
1
2
34
6 7
9
1321
10.0 20.0 30.0 40.0 50.0 60.0 70.0 80.0
5
16
23
Retention Time (min.)
Abu
ndan
ce
20
8
10 11 12
13
14 15
16
1718
19 20 21
28.00 30.00 32.00 34.00 36.00 38.00 40.00
9
22
1
2
34
6 7
9
1321
10.0 20.0 30.0 40.0 50.0 60.0 70.0 80.0
5
16
23
Retention Time (min.)
Abu
ndan
ce
20
8
10 11 12
13
14 15
16
1718
19 20 21
28.00 30.00 32.00 34.00 36.00 38.00 40.0028.00 30.00 32.00 34.00 36.00 38.00 40.00
9
22
Figure 8. LMW pyrogram of di-n-propyladipate using Configuration A (Filename: DA824.d).
Table 5. Identification of numbered peaks in Figure 8 (LMW by-products from di-n-propyladipate pyrolysis).
Peak # Compound Formula MW % Area 1 carbon monoxide CO 28 2.6 2 carbon dioxide CO2 44 10.3 3 ethene C2H4 28 2.7 4 water H2O 18 4.5 5 propene C3H6 42 30.4 6 1-propyne C3H4 40 0.6 7 ethylene oxide C2H4O 44 0.1 8 2-methyl-1-propene C4H8 56 1.1 9 1,3-butadiene C4H6 54 1.8
10 2-methyl-1-propene C4H8 56 0.1 11 1-butene C4H8 56 0.1 12 2-propenal C3H4O 56 0.1 13 propanal C3H6O 58 0.5 14 1,3-pentadiene C5H8 68 0.1 15 1-pentene C5H10 70 0.04 16 1-propanol, acetic acid C3H8O, C2H4O2 60 4.4 17 cyclopentene C5H8 68 0.07 18 3-buten-2-one C4H6O 70 0.01 19 1,5-hexadiene C6H10 82 0.02 20 2-propenoic acid C3H4O2 72 0.05
24 ERDC/CERL TR-01-66
Peak # Compound Formula MW % Area 21 benzene C6H6 78 0.2 22 cyclopentanone C5H8O 84 36.5 23 2-cyclopenten-1-one C5H6O 82 1.5
Total Area 97.8
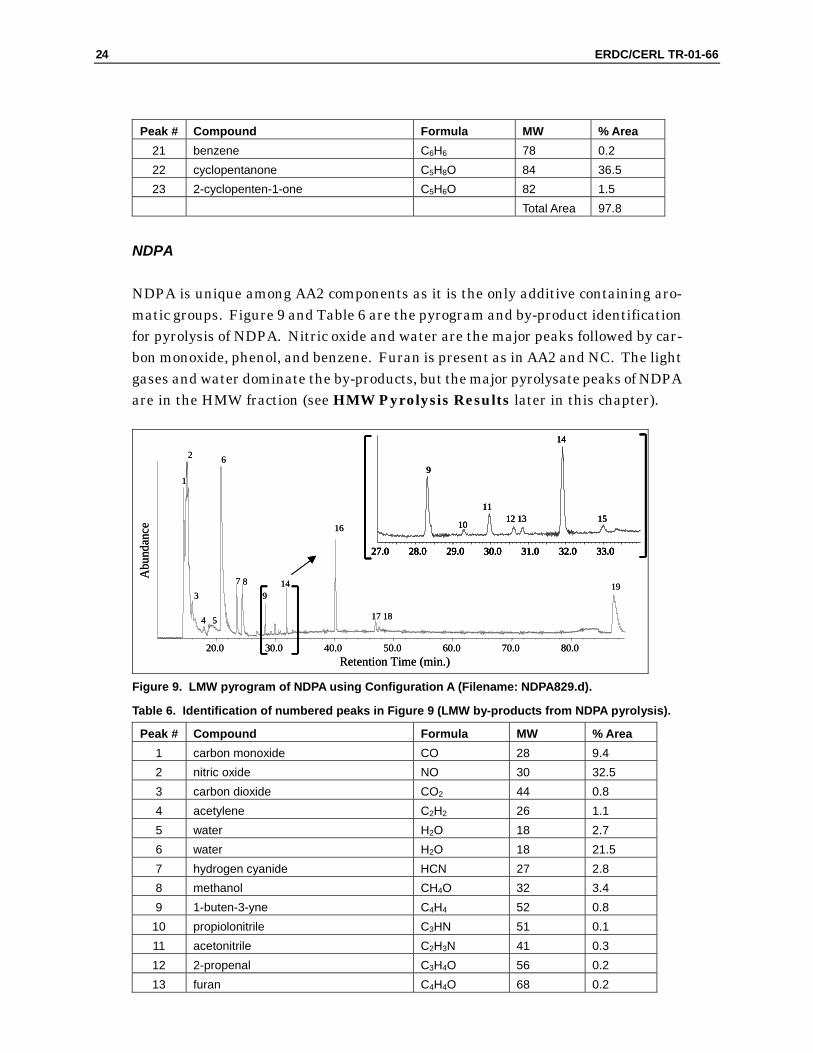
NDPA
NDPA is unique among AA2 components as it is the only additive containing aro-matic groups. Figure 9 and Table 6 are the pyrogram and by-product identification for pyrolysis of NDPA. Nitric oxide and water are the major peaks followed by car-bon monoxide, phenol, and benzene. Furan is present as in AA2 and NC. The light gases and water dominate the by-products, but the major pyrolysate peaks of NDPA are in the HMW fraction (see HMW Pyrolysis Results later in this chapter).
20.0 30.0 40.0 50.0 60.0 70.0 80.0
1
2
3
4 5
6
7 89
14
17 18
19
Retention Time (min.)
Abu
ndan
ce 16
27.0 28.0 29.0 30.0 31.0 32.0 33.0
9
14
1510
1112 13
20.0 30.0 40.0 50.0 60.0 70.0 80.0
1
2
3
4 5
6
7 89
14
17 18
19
Retention Time (min.)
Abu
ndan
ce 16
27.0 28.0 29.0 30.0 31.0 32.0 33.0
9
14
1510
1112 13
27.0 28.0 29.0 30.0 31.0 32.0 33.027.0 28.0 29.0 30.0 31.0 32.0 33.0
9
14
1510
1112 13
Figure 9. LMW pyrogram of NDPA using Configuration A (Filename: NDPA829.d).
Table 6. Identification of numbered peaks in Figure 9 (LMW by-products from NDPA pyrolysis).
Peak # Compound Formula MW % Area 1 carbon monoxide CO 28 9.4 2 nitric oxide NO 30 32.5 3 carbon dioxide CO2 44 0.8 4 acetylene C2H2 26 1.1 5 water H2O 18 2.7 6 water H2O 18 21.5 7 hydrogen cyanide HCN 27 2.8 8 methanol CH4O 32 3.4 9 1-buten-3-yne C4H4 52 0.8
10 propiolonitrile C3HN 51 0.1 11 acetonitrile C2H3N 41 0.3 12 2-propenal C3H4O 56 0.2 13 furan C4H4O 68 0.2
ERDC/CERL TR-01-66 25
Peak # Compound Formula MW % Area 14 2-propenenitrile C3H3N 53 1.3 15 3-penten-1-yne C5H6 66 0.3 16 benzene C6H6 78 5.0 17 pyridine C5H5N 79 0.9 18 2,4-pentadienenitrile C5H5N 79 0.5 19 phenol C6H6O 94 8.9
Total Area 92.7
Candelilla wax
Due to the persistent nature of triacetin on the PoraPLOT Q column, it was believed that candelilla wax would demonstrate similar, if not increased, contamination problems using Configuration A and may irreversibly damage the column. In addi-tion, candelilla wax is the smallest constituent of AA2 (0.1 percent) by weight and is not expected to contribute an interesting or relevant subset of LMW compounds. Therefore, this compound was not pyrolyzed under these conditions.
Heavy Molecular Weight Pyrolysis Results
AA2
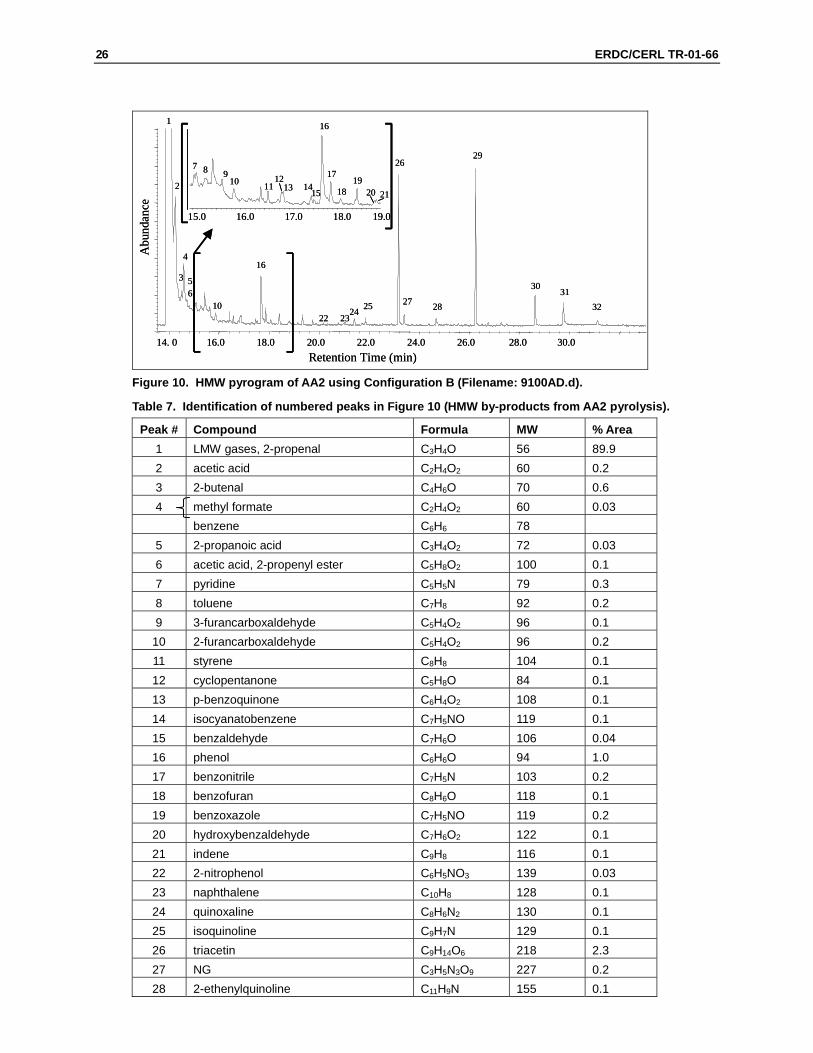
Analysis of the HMW pyrolysate for AA2 is shown in Figure 10. This experiment had a longer run time than that shown in the timing figure due to a longer wait pe-riod before probe firing to ensure the entrant air peak had eluted. Table 7 identifies the numbered peaks from Figure 10. The light gases make up almost 90 percent of the by-products; several of the species observed in the light gas fraction (Figure 4 and Table 1) are also seen in this analysis. This configuration does not separate these compounds well; the long trailing peak from 14 to 16 min interferes with separation and identification of all other species eluting over this same time period. Numerous aromatic and unsaturated ring compounds are identified, including com-pounds containing a heteroatom in the ring. Notable is the presence of four original compounds from the composition of AA2: triacetin, NG, di-n-propyladipate, and NDPA. These compounds have enough thermal stability and volatility that a de-tectable fraction escapes the pyrolysis chamber without degradation. The presence of NG is most surprising; it was expected that this highly energetic compound would readily and quickly decompose into light gases. Based on this data, it may be pre-dicted that pyrolytic pockets in the incinerator would produce the wide variety of by-products listed in Table 7 as PIC and POHC from an input feed of AA2.
26 ERDC/CERL TR-01-66
14. 0 16.0 18.0 20.0 22.0 24.0 26.0 28.0 30.0
2
3
416
22 2325 32
3130
29
2827
26
Retention Time (min)
Abu
ndan
ce
1
24
56
15.0 16.0 17.0 18.0 19.0
2019
18
17
16
141312
11108 9
7
10
15 21
14. 0 16.0 18.0 20.0 22.0 24.0 26.0 28.0 30.0
2
3
416
22 2325 32
3130
29
2827
26
Retention Time (min)
Abu
ndan
ce
1
24
56
15.0 16.0 17.0 18.0 19.0
2019
18
17
16
141312
11108 9
7
10
15 21
Figure 10. HMW pyrogram of AA2 using Configuration B (Filename: 9100AD.d).
Table 7. Identification of numbered peaks in Figure 10 (HMW by-products from AA2 pyrolysis).
Peak # Compound Formula MW % Area 1 LMW gases, 2-propenal C3H4O 56 89.9 2 acetic acid C2H4O2 60 0.2 3 2-butenal C4H6O 70 0.6 4 methyl formate C2H4O2 60 0.03 benzene C6H6 78
5 2-propanoic acid C3H4O2 72 0.03 6 acetic acid, 2-propenyl ester C5H8O2 100 0.1 7 pyridine C5H5N 79 0.3 8 toluene C7H8 92 0.2 9 3-furancarboxaldehyde C5H4O2 96 0.1
10 2-furancarboxaldehyde C5H4O2 96 0.2 11 styrene C8H8 104 0.1 12 cyclopentanone C5H8O 84 0.1 13 p-benzoquinone C6H4O2 108 0.1 14 isocyanatobenzene C7H5NO 119 0.1 15 benzaldehyde C7H6O 106 0.04 16 phenol C6H6O 94 1.0 17 benzonitrile C7H5N 103 0.2 18 benzofuran C8H6O 118 0.1 19 benzoxazole C7H5NO 119 0.2 20 hydroxybenzaldehyde C7H6O2 122 0.1 21 indene C9H8 116 0.1 22 2-nitrophenol C6H5NO3 139 0.03 23 naphthalene C10H8 128 0.1 24 quinoxaline C8H6N2 130 0.1 25 isoquinoline C9H7N 129 0.1 26 triacetin C9H14O6 218 2.3 27 NG C3H5N3O9 227 0.2 28 2-ethenylquinoline C11H9N 155 0.1
ERDC/CERL TR-01-66 27
Peak # Compound Formula MW % Area 29 di-n-propyladipate C12H22O4 230 2.3 30 phenazine C12H8N2 180 0.6 31 carbazole C12H9N 167 0.5 32 NDPA C12H10N2O2 214 0.1
Total Area 100.0
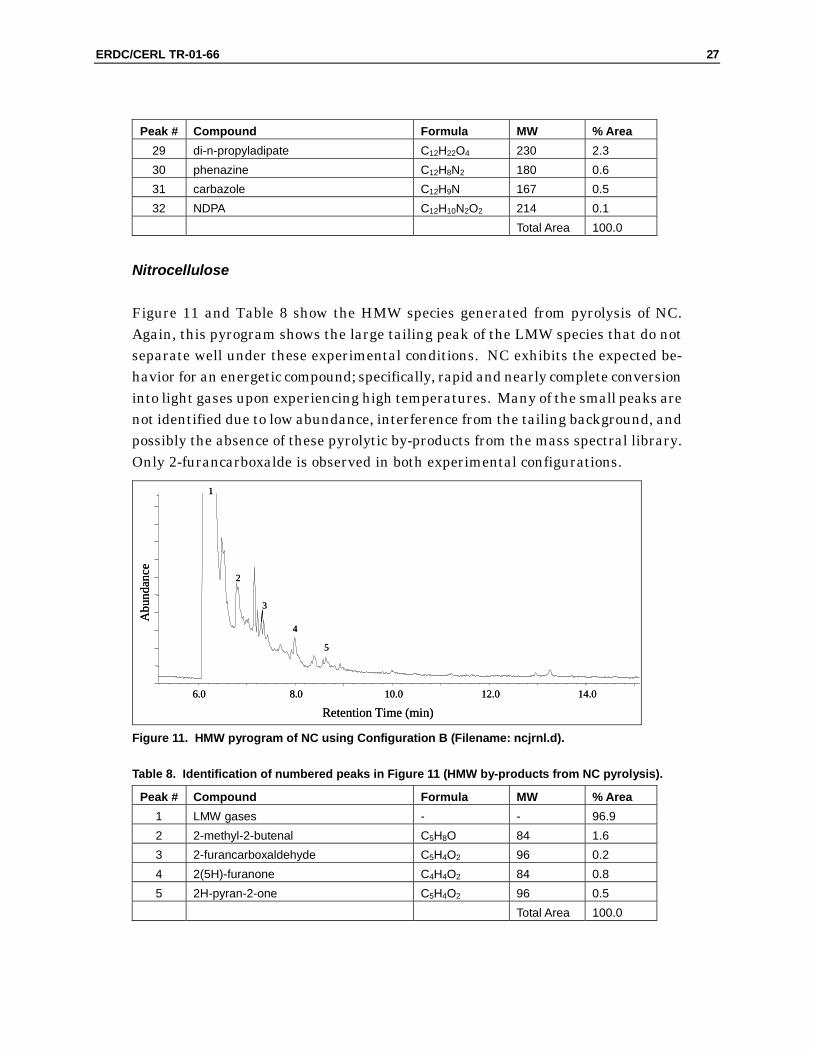
Nitrocellulose
Figure 11 and Table 8 show the HMW species generated from pyrolysis of NC. Again, this pyrogram shows the large tailing peak of the LMW species that do not separate well under these experimental conditions. NC exhibits the expected be-havior for an energetic compound; specifically, rapid and nearly complete conversion into light gases upon experiencing high temperatures. Many of the small peaks are not identified due to low abundance, interference from the tailing background, and possibly the absence of these pyrolytic by-products from the mass spectral library. Only 2-furancarboxalde is observed in both experimental configurations.
6.0 8.0 10.0 12.0 14.0
Abu
ndan
ce
Retention Time (min)
1
2
3
4
5
6.0 8.0 10.0 12.0 14.0
Abu
ndan
ce
Retention Time (min)
1
2
3
4
5
Figure 11. HMW pyrogram of NC using Configuration B (Filename: ncjrnl.d).
Table 8. Identification of numbered peaks in Figure 11 (HMW by-products from NC pyrolysis).
Peak # Compound Formula MW % Area 1 LMW gases - - 96.9 2 2-methyl-2-butenal C5H8O 84 1.6 3 2-furancarboxaldehyde C5H4O2 96 0.2 4 2(5H)-furanone C4H4O2 84 0.8 5 2H-pyran-2-one C5H4O2 96 0.5 Total Area 100.0
28 ERDC/CERL TR-01-66
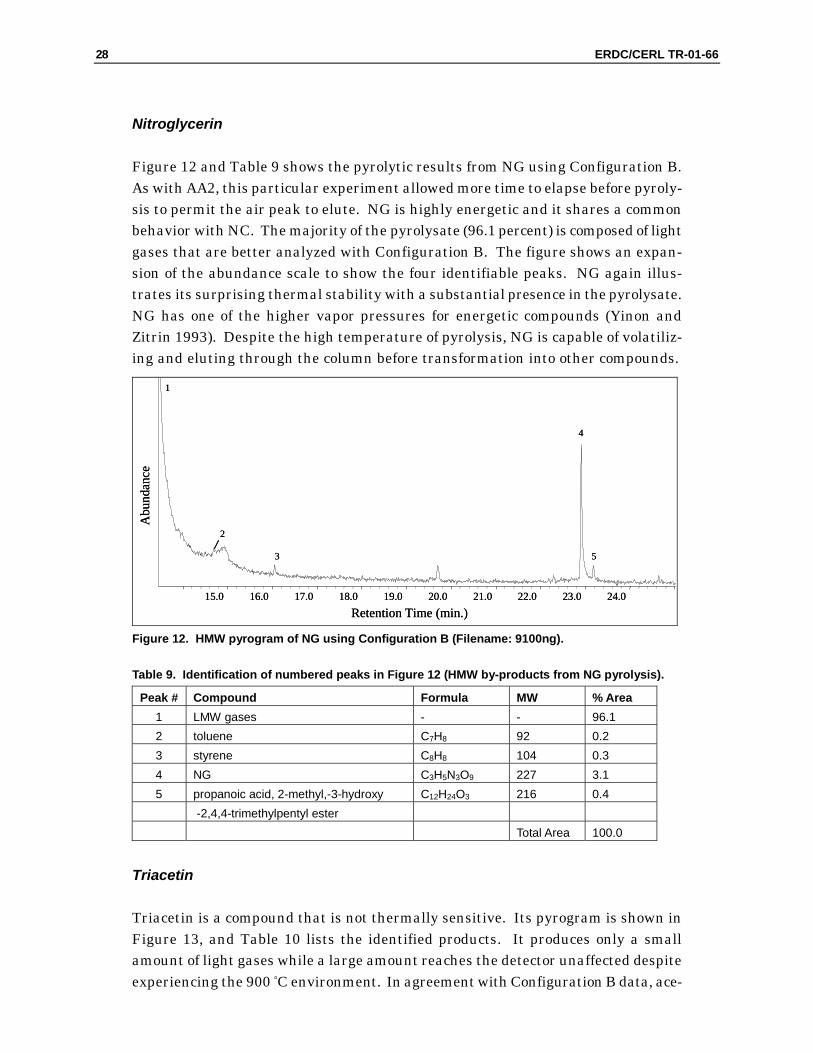
Nitroglycerin
Figure 12 and Table 9 shows the pyrolytic results from NG using Configuration B. As with AA2, this particular experiment allowed more time to elapse before pyroly-sis to permit the air peak to elute. NG is highly energetic and it shares a common behavior with NC. The majority of the pyrolysate (96.1 percent) is composed of light gases that are better analyzed with Configuration B. The figure shows an expan-sion of the abundance scale to show the four identifiable peaks. NG again illus-trates its surprising thermal stability with a substantial presence in the pyrolysate. NG has one of the higher vapor pressures for energetic compounds (Yinon and Zitrin 1993). Despite the high temperature of pyrolysis, NG is capable of volatiliz-ing and eluting through the column before transformation into other compounds.
15.0 16.0 17.0 18.0 19.0 20.0 21.0 22.0 23.0 24.0
1
2
3
4
5
Retention Time (min.)
Abu
ndan
ce
15.0 16.0 17.0 18.0 19.0 20.0 21.0 22.0 23.0 24.0
1
2
3
4
5
Retention Time (min.)
Abu
ndan
ce
Figure 12. HMW pyrogram of NG using Configuration B (Filename: 9100ng).
Table 9. Identification of numbered peaks in Figure 12 (HMW by-products from NG pyrolysis).
Peak # Compound Formula MW % Area 1 LMW gases - - 96.1 2 toluene C7H8 92 0.2 3 styrene C8H8 104 0.3 4 NG C3H5N3O9 227 3.1 5 propanoic acid, 2-methyl,-3-hydroxy C12H24O3 216 0.4 -2,4,4-trimethylpentyl ester Total Area 100.0
Triacetin
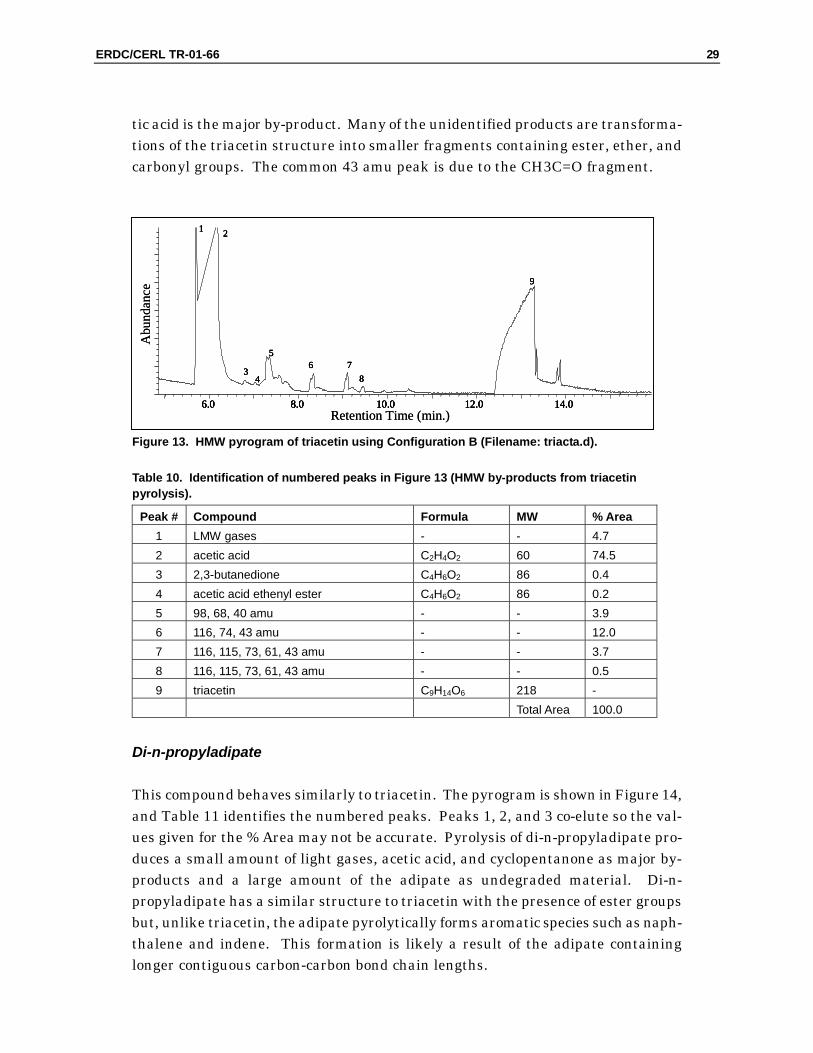
Triacetin is a compound that is not thermally sensitive. Its pyrogram is shown in Figure 13, and Table 10 lists the identified products. It produces only a small amount of light gases while a large amount reaches the detector unaffected despite experiencing the 900 °C environment. In agreement with Configuration B data, ace-
ERDC/CERL TR-01-66 29
tic acid is the major by-product. Many of the unidentified products are transforma-tions of the triacetin structure into smaller fragments containing ester, ether, and carbonyl groups. The common 43 amu peak is due to the CH3C=O fragment.
12.06.0 8.0 10.0 14.0
1 2
34
56 7
8
9
12.06.0 8.0 10.0 14.0
1 2
34
56 7
8
9
Abu
ndan
ce
Retention Time (min.)12.06.0 8.0 10.0 14.0
1 2
34
56 7
8
9
12.06.0 8.0 10.0 14.0
1 2
34
56 7
8
9
Abu
ndan
ce
Retention Time (min.)
Figure 13. HMW pyrogram of triacetin using Configuration B (Filename: triacta.d).
Table 10. Identification of numbered peaks in Figure 13 (HMW by-products from triacetin pyrolysis).
Peak # Compound Formula MW % Area 1 LMW gases - - 4.7 2 acetic acid C2H4O2 60 74.5 3 2,3-butanedione C4H6O2 86 0.4 4 acetic acid ethenyl ester C4H6O2 86 0.2 5 98, 68, 40 amu - - 3.9 6 116, 74, 43 amu - - 12.0 7 116, 115, 73, 61, 43 amu - - 3.7 8 116, 115, 73, 61, 43 amu - - 0.5 9 triacetin C9H14O6 218 - Total Area 100.0
Di-n-propyladipate
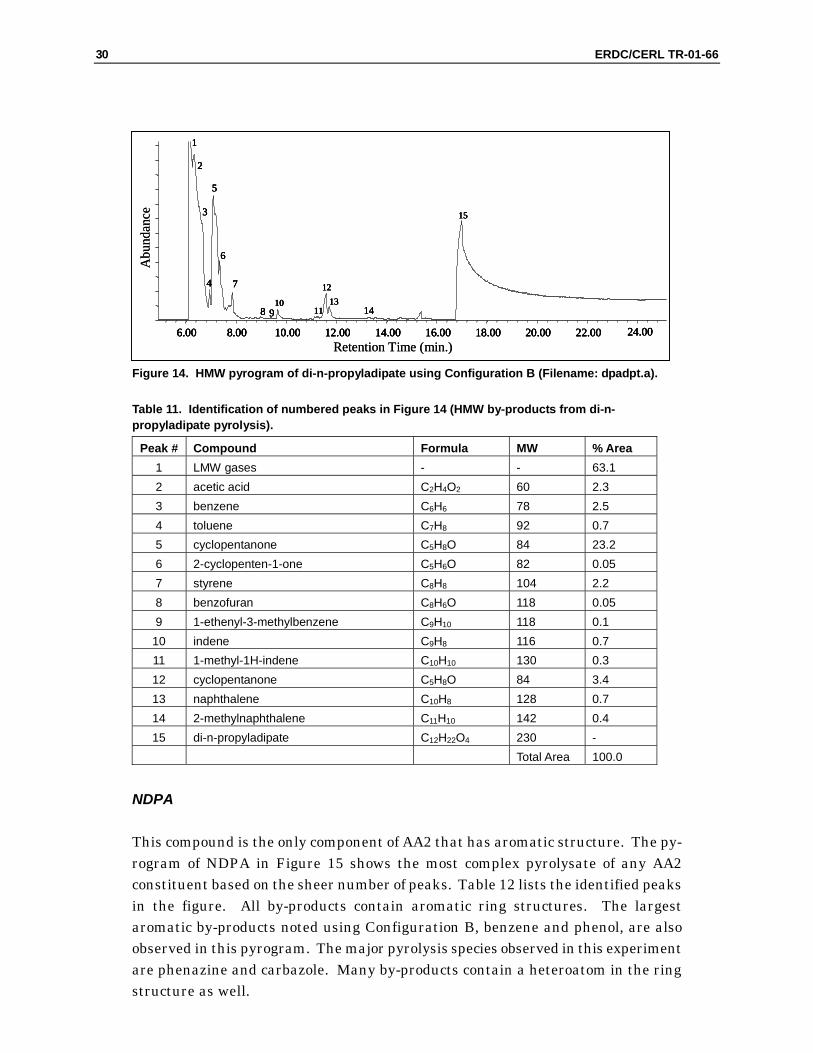
This compound behaves similarly to triacetin. The pyrogram is shown in Figure 14, and Table 11 identifies the numbered peaks. Peaks 1, 2, and 3 co-elute so the val-ues given for the % Area may not be accurate. Pyrolysis of di-n-propyladipate pro-duces a small amount of light gases, acetic acid, and cyclopentanone as major by-products and a large amount of the adipate as undegraded material. Di-n-propyladipate has a similar structure to triacetin with the presence of ester groups but, unlike triacetin, the adipate pyrolytically forms aromatic species such as naph-thalene and indene. This formation is likely a result of the adipate containing longer contiguous carbon-carbon bond chain lengths.
30 ERDC/CERL TR-01-66
A
bund
ance
Retention Time (min.)6.00 8.00 10.00 12.00 14.00 16.00 18.00 20.00 22.00 24.00
1
2
3
4
5
6
7
8 9 1410
11
1213
15
6.00 8.00 10.00 12.00 14.00 16.00 18.00 20.00 22.00 24.00
1
2
3
4
5
6
7
8 9 1410
11
1213
15
Abu
ndan
ce
Retention Time (min.)6.00 8.00 10.00 12.00 14.00 16.00 18.00 20.00 22.00 24.00
1
2
3
4
5
6
7
8 9 1410
11
1213
15
6.00 8.00 10.00 12.00 14.00 16.00 18.00 20.00 22.00 24.00
1
2
3
4
5
6
7
8 9 1410
11
1213
15
Figure 14. HMW pyrogram of di-n-propyladipate using Configuration B (Filename: dpadpt.a).
Table 11. Identification of numbered peaks in Figure 14 (HMW by-products from di-n-propyladipate pyrolysis).
Peak # Compound Formula MW % Area 1 LMW gases - - 63.1 2 acetic acid C2H4O2 60 2.3 3 benzene C6H6 78 2.5 4 toluene C7H8 92 0.7 5 cyclopentanone C5H8O 84 23.2 6 2-cyclopenten-1-one C5H6O 82 0.05 7 styrene C8H8 104 2.2 8 benzofuran C8H6O 118 0.05 9 1-ethenyl-3-methylbenzene C9H10 118 0.1
10 indene C9H8 116 0.7 11 1-methyl-1H-indene C10H10 130 0.3 12 cyclopentanone C5H8O 84 3.4 13 naphthalene C10H8 128 0.7 14 2-methylnaphthalene C11H10 142 0.4 15 di-n-propyladipate C12H22O4 230 -
Total Area 100.0
NDPA
This compound is the only component of AA2 that has aromatic structure. The py-rogram of NDPA in Figure 15 shows the most complex pyrolysate of any AA2 constituent based on the sheer number of peaks. Table 12 lists the identified peaks in the figure. All by-products contain aromatic ring structures. The largest aromatic by-products noted using Configuration B, benzene and phenol, are also observed in this pyrogram. The major pyrolysis species observed in this experiment are phenazine and carbazole. Many by-products contain a heteroatom in the ring structure as well.

ERDC/CERL TR-01-66 31
Abu
ndan
ce
Retention Time (min.)6.00 8.00 10.00 12.00 14.00 16.00 18.00 20.00 22.00 24.00
12
34
78 9 10
24 2526
27
28
29
30
333435 38 39
56
10.00 11.00 12.00 13.00 14.00 15.00
1213 14
1510
11
16 17 18
1920 21
2223
3132 36 3723
1
6.00 8.00 10.00 12.00 14.00 16.00 18.00 20.00 22.00 24.00
12
34
78 9 10
24 2526
27
28
29
30
333435 38 39
56
10.00 11.00 12.00 13.00 14.00 15.00
1213 14
1510
11
16 17 18
1920 21
2223
3132 36 3723
1A
bund
ance
Retention Time (min.)6.00 8.00 10.00 12.00 14.00 16.00 18.00 20.00 22.00 24.00
12
34
78 9 10
24 2526
27
28
29
30
333435 38 39
56
10.00 11.00 12.00 13.00 14.00 15.00
1213 14
1510
11
16 17 18
1920 21
2223
3132 36 3723
1
6.00 8.00 10.00 12.00 14.00 16.00 18.00 20.00 22.00 24.00
12
34
78 9 10
24 2526
27
28
29
30
333435 38 39
56
10.00 11.00 12.00 13.00 14.00 15.00
1213 14
1510
11
16 17 18
1920 21
2223
3132 36 3723
1
Figure 15. HMW pyrogram of NDPA using Configuration A (Filename: ndpa2.d).
Table 12. Identification of numbered peaks in Figure 15 (HMW by-products from NDPA pyrolysis).
Peak # Compound Formula MW % Area 1 LMW gases - - 27.7 2 benzene C6H6 78 3.4 3 isocyanatobenzene C7H5NO 119 0.3 4 phenol C6H6O 94 0.5 5 aniline C6H7N 93 0.4 6 benzonitrile C7H5NO 103 6.7 7 benzoxazole C7H5NO 119 0.03 8 nitrobenzene C6H5NO2 123 0.1 9 2-nitrophenol C6H5NO3 139 0.4
10 azulene C10H8 128 0.4 11 quinoxaline C8H6N2 130 0.6 12 isoquinoline C9H7N 129 0.3 13 2-aminobenzonitrile C7H6N2 118 0.1 14 4-methylquinoline C10H9N 143 0.1 15 indole C8H7N 117 0.2 16 3-isoquinolinamine C9H8N2 144 0.04 17 2-methylquinoline C10H9N 143 0.05 18 biphenyl C12H10 154 0.1 19 o-nitroaniline C6H6N2O2 138 0.3 20 4-phenylpyrimidine C10H8N2 156 0.3 21 2-ethenylquinoline C11H9N 155 0.2 22 2-naphthalenecarbonitrile C11H7N 153 1.2 23 dibenzofuran C12H8O 168 0.7 24 diphenylamine C12H11N 169 1.3 25 5H-indeno-[1,2-b]-pyridine C12H9N 167 1.3 26 9H-pyrido-[3,4-b]-indole C11H8N2 168 0.4 27 phenazine C12H8N2 180 18.4 28 2-aminodiphenyl ether C12H11NO 185 0.9
32 ERDC/CERL TR-01-66
Peak # Compound Formula MW % Area 29 carbazole C12H9N 167 30.7 30 NDPA C12H10N2O2 214 - 31 2-phenazinol C12H8N2O 196 0.1 32 phenazine-5-oxide C12H8N2O 196 0.3 33 phenoxazine C12H9NO 183 1.1 34 3-nitrocarbazole C12H8N2O2 212 0.9 35 4-dibenzofuranamine C12H9NO 183 0.1 36 9-phenyl-9H-carbazole C18H13N 243 0.05 37 benzo(a)phenazine C16H10N2 230 0.04 38 2,2’-biquinoline C18H12N2 256 0.1 39 9-phenyl-9H-carbazole C18H13N 243 0.1
Total Area 100.0
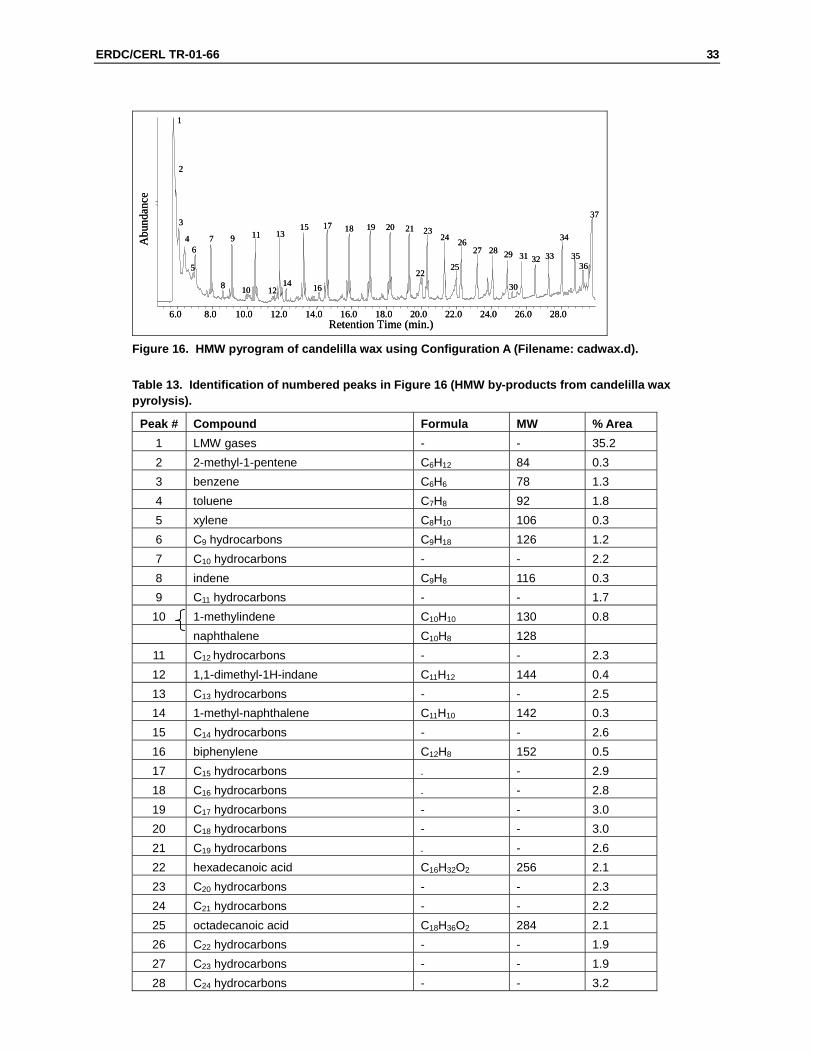
Candelilla Wax
Analysis of waxes has a history of application in the field of art and cultural materi-als. Use of wax as a media in these areas has necessitated development of tech-niques to analyze and characterize the wax (Wampler 1995). Due to its complex ar-ray of constituents, the pyrogram of a wax is complex. Figure 16 shows the pyrogram of candelilla wax. Table 13 gives a general identification of the numbered peaks. The shape and features of the pyrogram agree well with a pyrogram given for this wax in the literature (Wampler 1995, page 135). According to the Aldrich catalog, candelilla wax is a mixture of monoesters (C40 to C62) (28-29 wt %), alcohols, sterols, and resins (12-14 wt %), and hydrocarbons (C29 to C33) (50-60 wt %). A sub-stantial peak (#1) in the pyrogram is due to lighter weight species that would sepa-rate well under the conditions of Configuration A. The dominant recognizable fea-ture, however, is the regular series of triplets that are commonly observed during pyrolysis of polymers. The triplet comprises the diene, the alkene (the dominant peak), and the alkane for a particular carbon number (Wampler 1995). Candelilla wax produces peaks beginning at a carbon number of nine (nonene, peak 6) up to a carbon number of 30 (triacontane, peak 35). The triplet features are not well re-solved for the higher carbon number peaks. The percent area listed for a hydrocar-bon combines the area under all three peaks.
The large fraction of HMW by-products produced from pyrolysis of candelilla wax shows that caution is well served in omitting this material from analysis using Con-figuration A. Prolonged contamination, clogging, and perhaps irreversible degrada-tion of the PoraPLOT Q column may have occurred. Memory effects of the wax were persistent in this configuration for many blank runs despite elevated temperatures of all system components.
ERDC/CERL TR-01-66 33
6.0 8.0 10.0 12.0 14.0 16.0 18.0 20.0 22.0 24.0 26.0 28.0
1
2
3
Retention Time (min.)
Abu
ndan
ce
4
5
67
8
9
10
11
12
13
14
15
16
17 18 19 20 21
22
2324
25
2627 28 29
30
31 32 33
34
3536
37
6.0 8.0 10.0 12.0 14.0 16.0 18.0 20.0 22.0 24.0 26.0 28.0
1
2
3
Retention Time (min.)
Abu
ndan
ce
4
5
67
8
9
10
11
12
13
14
15
16
17 18 19 20 21
22
2324
25
2627 28 29
30
31 32 33
34
3536
37
Figure 16. HMW pyrogram of candelilla wax using Configuration A (Filename: cadwax.d).
Table 13. Identification of numbered peaks in Figure 16 (HMW by-products from candelilla wax pyrolysis).
Peak # Compound Formula MW % Area 1 LMW gases - - 35.2 2 2-methyl-1-pentene C6H12 84 0.3 3 benzene C6H6 78 1.3 4 toluene C7H8 92 1.8 5 xylene C8H10 106 0.3 6 C9 hydrocarbons C9H18 126 1.2 7 C10 hydrocarbons - - 2.2 8 indene C9H8 116 0.3 9 C11 hydrocarbons - - 1.7
10 1-methylindene C10H10 130 0.8 naphthalene C10H8 128
11 C12 hydrocarbons - - 2.3 12 1,1-dimethyl-1H-indane C11H12 144 0.4 13 C13 hydrocarbons - - 2.5 14 1-methyl-naphthalene C11H10 142 0.3 15 C14 hydrocarbons - - 2.6 16 biphenylene C12H8 152 0.5 17 C15 hydrocarbons - - 2.9 18 C16 hydrocarbons - - 2.8 19 C17 hydrocarbons - - 3.0 20 C18 hydrocarbons - - 3.0 21 C19 hydrocarbons - - 2.6 22 hexadecanoic acid C16H32O2 256 2.1 23 C20 hydrocarbons - - 2.3 24 C21 hydrocarbons - - 2.2 25 octadecanoic acid C18H36O2 284 2.1 26 C22 hydrocarbons - - 1.9 27 C23 hydrocarbons - - 1.9 28 C24 hydrocarbons - - 3.2

34 ERDC/CERL TR-01-66
Peak # Compound Formula MW % Area 29 C25 hydrocarbons - - 2.0 30 bis(2-ethylhexyl)phthalate C24H38O4 390 0.1 31 C26 hydrocarbons - - 1.7 32 C27 hydrocarbons - - 1.3 33 C28 hydrocarbons - - 1.2 34 C29 hydrocarbons - - 2.0 35 C30 hydrocarbons - - 1.3 36 408, 393 amu - - 0.6 37 436 amu - - 6.3
Total Area 100.0
Discussion
Table 14 summarizes and compares the pyrolytic products from AA2 and its con-stituents. All of the AA2 by-products are listed followed by the constituent that also produces this compound during pyrolysis. Out of nearly 60 AA2 pyrolytic byprod-ucts, only 6 are not produced by one or more of the constituents. These six may originate from homogeneous interactions between gaseous by-products of different constituents or may be a result of heterogeneous reactions between a gaseous by-product and unreacted solid residue left in the pyrolysis chamber. All six species are very minor and trace compounds based on the % Area values in Tables 1 and 7 with the largest being formamide at 0.2 percent of the total area of LMW products from AA2. Chemical interactions among the by-products are therefore not a major source of novel by-products during thermal degradation of AA2. This observation means that the set of by-products produced from AA2 has the following additive property:
[By-products from AA2 pyrolysis] = Sum [By-products from AA2 constituent pyrolysis]
It is possible that the rapid removal of the gaseous products from the pyrolysis chamber by the helium carrier gas prevents subsequent reactions. Furthermore, the organometallic salt is the only AA2 constituent not pyrolyzed individually. It apparently contributes no gaseous organic by-products and has no marked effect on the pyrolytic degradation mechanisms of any other AA2 constituents.
Most of the LMW pyrolytic by-products of AA2 are also produced by more than one of the constituents. The light permanent gases and water are common to the pyro-lysis of all five constituents but, surprisingly, 2-propanol and benzene are common as well. Pyrolysis of NC alone can duplicate most of the AA2 pyrolytic by-products, indicating this component of AA2 as the primary origin of the LMW fraction. The
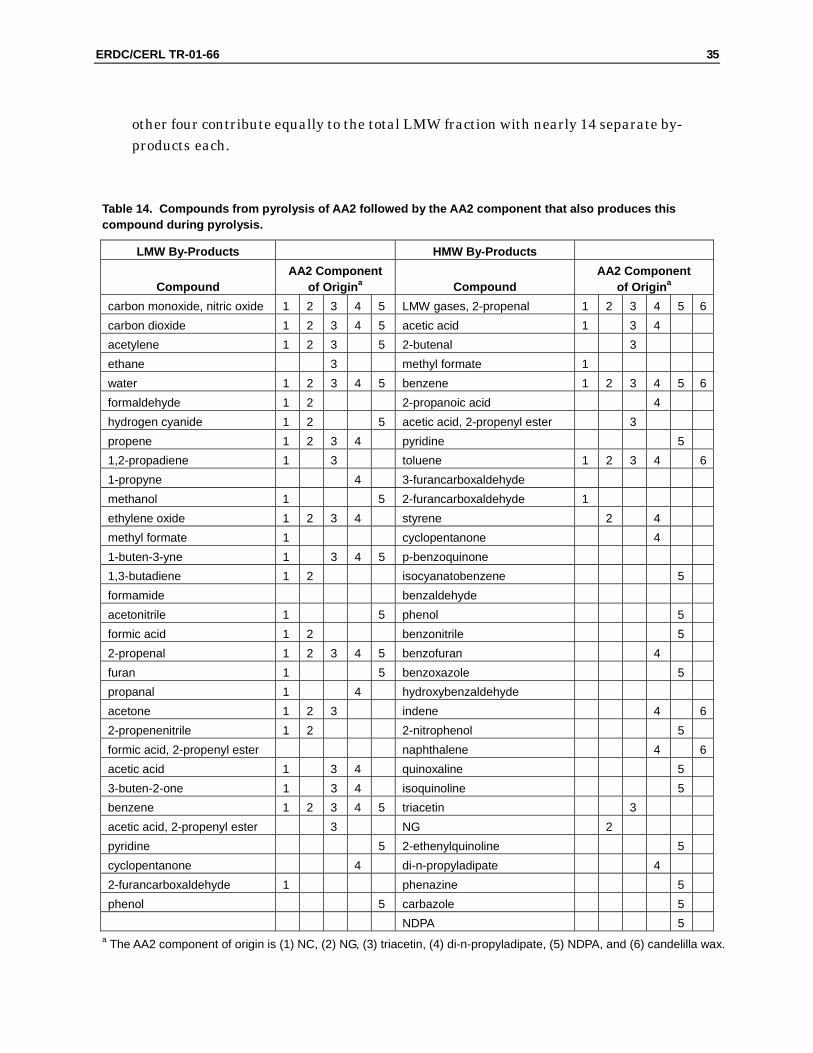
ERDC/CERL TR-01-66 35
other four contribute equally to the total LMW fraction with nearly 14 separate by-products each.
Table 14. Compounds from pyrolysis of AA2 followed by the AA2 component that also produces this compound during pyrolysis.
LMW By-Products HMW By-Products
Compound AA2 Component
of Origina Compound AA2 Component
of Origina
carbon monoxide, nitric oxide 1 2 3 4 5 LMW gases, 2-propenal 1 2 3 4 5 6carbon dioxide 1 2 3 4 5 acetic acid 1 3 4 acetylene 1 2 3 5 2-butenal 3 ethane 3 methyl formate 1 water 1 2 3 4 5 benzene 1 2 3 4 5 6formaldehyde 1 2 2-propanoic acid 4 hydrogen cyanide 1 2 5 acetic acid, 2-propenyl ester 3 propene 1 2 3 4 pyridine 5 1,2-propadiene 1 3 toluene 1 2 3 4 61-propyne 4 3-furancarboxaldehyde methanol 1 5 2-furancarboxaldehyde 1 ethylene oxide 1 2 3 4 styrene 2 4 methyl formate 1 cyclopentanone 4 1-buten-3-yne 1 3 4 5 p-benzoquinone 1,3-butadiene 1 2 isocyanatobenzene 5 formamide benzaldehyde acetonitrile 1 5 phenol 5 formic acid 1 2 benzonitrile 5 2-propenal 1 2 3 4 5 benzofuran 4 furan 1 5 benzoxazole 5 propanal 1 4 hydroxybenzaldehyde acetone 1 2 3 indene 4 62-propenenitrile 1 2 2-nitrophenol 5 formic acid, 2-propenyl ester naphthalene 4 6acetic acid 1 3 4 quinoxaline 5 3-buten-2-one 1 3 4 isoquinoline 5 benzene 1 2 3 4 5 triacetin 3 acetic acid, 2-propenyl ester 3 NG 2 pyridine 5 2-ethenylquinoline 5 cyclopentanone 4 di-n-propyladipate 4 2-furancarboxaldehyde 1 phenazine 5 phenol 5 carbazole 5 NDPA 5
a The AA2 component of origin is (1) NC, (2) NG, (3) triacetin, (4) di-n-propyladipate, (5) NDPA, and (6) candelilla wax.
36 ERDC/CERL TR-01-66
HMW by-products show a different behavior. Many of these AA2 by-products are produced by only one of the components. Therefore, the production of any one of these by-products during high temperature degradation can be eliminated by re-moving all presence of the originating constituent in AA2. NDPA produces a bulk of these HMW species. In fact, besides the presence of the POHC NG, all of the nitro-gen-containing HMW species from pyrolysis of AA2 originate from the NDPA. Sub-stituting a “greener” non-nitrogen-containing chemical for NDPA would alleviate production of these species.
It is not surprising that NC and NG contribute so many pyrolytic by-products and that the majority of these are in the LMW fraction. These two compounds comprise nearly 90 percent of AA2 with NC at 46.5 to 52.5 percent by weight and NG at ap-proximately 38.8 percent by weight. Triacetin (2.7 percent), NDPA (1.5 to 2.5 per-cent) and di-n-propyladipate (1.6 percent), however, are minor components that even so are the sole origin of many of the by-products in AA2. As expected, the can-delilla wax contributes little (only 0.1 percent by weight); the regular hydrocarbon series of wax pyrolysis was not observed.
Numerous pyrolytic products from the constituents are not observed in the AA2 py-rograms. As indicated earlier, this is most likely a concentration effect. A 2-mg sample of AA2 contains only 50 �g triacetin or NDPA and 2 �g candelilla wax. Py-rolysis of these minute amounts of sample will not produce appreciable peaks. Ex-amination of the LMW pyrograms indicates good agreement of by-products between AA2 and the constituents. For NC, any pyrolytic by-product larger than 0.5 percent area is also present in the AA2 pyrograms. The exception is ethyl acetate at 1.4 percent area. Similarly, even minor peaks in the pyrogram of NG are also present in the AA2 pyrogram except for ethylenediamine (0.4 percent area). The largest peak in the triacetin pyrogram not present in the AA2 pyrogram is 1-butene (1 per-cent area); for di-n-propyladipate, it is ethane (2.7 percent area); and for NDPA, it is pyridine (0.9 percent area).
The HMW pyrograms do not display the same quality agreement as the LMW pyro-grams. The broad unresolved envelope of peaks in the HMW pyrogram of NC (Fig-ure 11) appears to be reproduced in the HMW pyrogram of AA2 (Figure 10) but the peaks identified in Table 8 are not detected. Only the minor propanoic acid ester by-product of NG is not also produced by AA2. Many of the di-n-propyladipate are present, but most of the minor pyrolytic products for triacetin, NDPA, and cande-lilla wax are not detected in the pyrogram of AA2.
The number of LMW and HMW by-products can be added for each constituent of AA2. NC contributes 25 by-products that are present in the AA2 pyrograms; NG = 16, triacetin = 18, di-n-propyladipate = 20, NDPA = 23, and candelilla wax = 5.
ERDC/CERL TR-01-66 37
Perhaps more important is the unique contribution each constituent makes to the AA2 set of by-products. NC produces two compounds by pyrolysis that are also pro-duced by AA2 pyrolysis (methyl formate and 2-furancarboxaldehyde) and are not produced by any other constituent. Therefore, NC is clearly the origin for these two compounds when AA2 is pyrolyzed and, conversely, elimination of NC would elimi-nate the production of these two compounds. The numbers for the other constitu-ents are NG = 1, triacetin = 4, di-n-propyladipate = 5, NDPA = 12, and candelilla wax = 0. Clearly, the minor and trace constituents, and in particular, NDPA, play an inordinately important role in the production of pyrolysis products by AA2.
Pyrolysate Origins
Ideal incineration results in complete degradation of organic compounds; specifi-cally, complete oxidation to carbon dioxide and water. Zones close to burning areas can be heated by conduction, convection, or radiation and, together with a lack of oxidant, pyrolytic processes take over in these zones and lead to PIC. Pyrolysate and undecomposed small molecules (POHC) can escape by volatilization, distilla-tion, and aerosol formation (Moldoveanu 1998). Pyrolysis experiments can deter-mine the compounds that are likely to be present (POHC and PIC) and the origin of each compound.
At least seven primary reaction mechanisms are frequently observed during pyrolysis:
Elimination reactions eject a small component from the molecule and are fre-quently the mechanism by which water is produced from compounds contain-ing hydroxyl groups.
��
��
��
��
��
��
��
Fragmentation is the breakdown of the molecular main chain, usually a first step in polymer pyrolysis. Extrusion reactions are best described by the reaction M-A-B producing M-A + B. Eliminations involving free radicals again produces a small component from the molecule but the ejected fragment is a free radical capable of initiating further reactions. This mechanism can explain the formation of unsaturated bonds and aromatic species from aliphatic compounds. Bond rearrangements can occur (M-A-B to A-B-M) and are characterized by the lack of a leaving group. Oxidation and reduction chemistry is common, although with a lack of oxi-dant, reduction reactions are more likely. Substitutions (M-A + B to M-B + A) and additions (M + A to M-A) are possible.
38 ERDC/CERL TR-01-66
These types of reactions can form complex multi-ring structures and larger pyrolytic products from smaller initial compounds. Generally, however, these reactions are driven by the production of compounds that are more stable at higher temperatures. Other less common or specialized reactions are also observed. More detail on these pyrolytic reaction mechanisms can be found in Moldoveanu (1998). One key ele-ment leading to the further complexity of pyrolysis is that any of the by-products can become initial compounds in further pyrolytic breakdown by any of the mecha-nisms given earlier.
Using the available pyrolytic mechanisms, the production of nearly any observed by-product can be described. Many mechanistic pathways for the same product are common and numerous mechanisms are required to account for all products (Conley 1970). Comprehensive analysis of all observed by-products is beyond the scope of this report and would fall completely into the realm of conjecture. Rapid time-resolved experiments are required to uncover the evolution of reactions and the structure of intermediates. In addition, care must be taken to immediately separate the gaseous by-products from any remaining solid residue and the heat source to minimize interactions between by-products and eliminate the possibility of homoge-neous and heterogeneous secondary reactions (Phillips, Orlick, and Steinberger 1955). This care was not taken in these experiments, yet the results remain appli-cable to incineration conditions since the careful conditions described above clearly do not occur in the rotary kiln. In fact, the data shown earlier supports the state-ment that, when composite materials such as AA2 are pyrolyzed, each component can be considered to have started the pyrolysis process independently (Moldoveanu 1998). The components of AA2 and their by-products show little interaction during pyrolysis.
Nitrocellulose
Previous work on the thermal decomposition of NC produced the following gaseous by-products: NO, CO2, CO, N2O, N2, H2O, NO2, HCN, CH2O, HONO, CH4, C2H4O, C3H4O, and C3H6O (Urbanski 1964; Oyumi and Brill 1986; Wolfram et al. 1955; Kaur et al. 1986). The work reported here observed all of these components except N2, NO2, and HONO, which are either short-lived reactive species that do not sur-vive the chromatographic process, or not well separated from the other large perma-nent gas peaks. Many more products were observed in this work, possibly a result of other heterogeneous and secondary reactions that are not primary pyrolysis reactions. The NC polymer can undergo both fragmentation of the backbone and elimination reactions to produce many of the light gases listed earlier. Pyrolysis of cellulose shows more products than NC (Moldoveanu 1998) because the energetic nature of NC promotes rapid breakdown by the exothermic contribution of additional energy. Elimination and addition reactions produce polycyclic aromatic
ERDC/CERL TR-01-66 39
hydrocarbons (PAH) from cellulose, so the appearance of benzene and toluene from NC is not surprising. Production of any other by-product from NC can be explained by a combination of the mechanisms listed earlier. Furan, for instance, is a by-product of major concern. NC may first undergo rapid elimination of NO2 groups from the polymer followed by chain scission to monomer units. Oxidation followed by extrusion of CO2 groups can result in the five-membered unsaturated rings of furan, especially since the glucosidic rings already contain oxygen. The complexity of this mechanism is reflected in the low abundance of furan (Table 2).
Nitroglycerin
Thermal decomposition of NG results in NO, CO, CO2, N2, N2O, H2, and H2O (Ur-banski 1964). Only N2 and H2 are not observed in this work since N2 likely co-elutes with other light gases and the mass spectrometer cannot measure the low molecular mass of H2. For NG, rapid elimination of the nitrogen oxides is a likely first step, leaving the three-carbon chain. Fragmentation can produce the formic acid. Reduc-tion of the nitrogen oxides or the nitro groups to amine groups is required to pro-duce ethylenediamine followed by extrusion or elimination of a carbon. Again, addi-tion reactions can produce benzene and toluene from the three-carbon chains.
Triacetin and Di-n-propyladipate
Pyrolysis of triacetin produces acetic acid as the major product due to elimination reactions at three different positions on the molecule. Formation of two acetic acid molecules leaves a remainder of acetic acid, 2-propenyl ester. Elimination of acetal-dehyde from this remainder yields the 1-acetyloxy-2-propanone. Di-n-propyladipate can undergo fragmentation reactions to produce propene at two different positions on the molecule. The center portion of the molecule can then fragment and recom-bine to form propanol and cyclopentanone. It is important to note that neither tri-acetin nor di-n-propyladipate degrades to form a nitrogen-containing by-product. This observation lends credence to the mass spectral library matching to identify peaks, and it also indicates the integrity of the pyrolysis system from air leaks.
NDPA
NDPA results in the greatest number of pyrolytic by-products with all of the HMW products containing aromaticity. Fragmentation is the most logical first step for the monoaromatic ring compounds followed by radical attack, oxidation, or reduction to form compounds such as phenol, nitrophenol, aniline, and isocyanatobenzene. The primary mechanism, however, is a type of substitution reaction due to the proximity of either the nitro group or the two phenyl groups. A new ring is created between
40 ERDC/CERL TR-01-66
the phenyl groups that includes the amino nitrogen atom with the elimination of H2, NO2, or H2O to form the dominant species phenazine and carbazole.
Candelilla Wax
Candelilla wax comprises numerous compounds that contain long chains of carbon-carbon bonds. These long chains degrade by random scission to produce free radi-cals that frequently stabilize by forming terminal double bonds and a new radical species (Wampler 1995). An oligomeric pattern of triplets is observed in the pyro-gram in the order diene, alkene, and alkane for each chain of a particular carbon number. The remaining small pyrolytic species are likely the additional compo-nents present in the wax.
ERDC/CERL TR-01-66 41
4 Conclusion
Pyrolysis experiments comparing the behavior of AA2 with the behavior of individ-ual constituents of AA2 provide an excellent example of the additive property that sometimes exists during thermal degradation of composites. The origin of each py-rolytic by-product from AA2 can be deduced by examination of the set of pyrolysis products from each constituent. Many AA2 by-products have a unique constituent of origin, but more by-products originate from several sources. NDPA is the single source of most HMW species, most nitrogen-containing products, and most aromatic by-products. Elimination of NDPA from AA2 would have the greatest impact in re-ducing the number and toxicity of by-products from thermal degradation processes with AA2.
Previous work on PIC origin during incineration pinpointed pyrolytic pockets as the source of all PIC. This data set of degradation products from pyrolysis of AA2 may be viewed as the predicted list of PIC emanating from these pockets and POHC that have sufficient thermal stability to survive non-optimal incineration conditions. Fu-ture work will compare these data to incineration emission data to assess the value of bench-scale pyrolysis as a predictive method.
42 ERDC/CERL TR-01-66
References
Behrens, R., Jr., J. Phys. Chem., 94, (1990), p 6706.
Botcher, T.R. and C.A. Wight, J. Phys. Chem., 97 (1993).
Brill, T.B. and K.J. James, Chem. Rev., 93 (1993a).
Brill, T.B. and K.J. James, J. Phys. Chem., 97 (1993b).
Conley, R.T., Thermal Stability of Polymers, Volume 1, Marcel Dekker, Inc., NY, 1970.
Dellinger, B., D.L. Hall, J.L. Graham, S.L. Mazer, W.A. Rubey, and M. Malanchuk, EPA Project Summary, EPA/600/S2-86/006, July 1986.
Dellinger, B., P.H. Taylor, and D.A. Tirey, EPA Project Summary, EPA/600/S2-90/039, May 1991.
Duvall, D.S., W.A. Rubey, and J.A. Mescher, EPA Project Summary, EPA/600/9-80/011, March 1980.
Fisher, E.M. and C.P. Koshland, Combust. Flame, 90 (1992).
Graham, J.L., D.L. Hall, and B. Dellinger, Environ. Sci. Technol., 20 (1986).
Kaur, B., R.K. Jain, I.S. Gur, and H.L. Bhatnagar, J. Anal. Appl. Pyrol., 9 (1986).
Koshland, C.P. and M.J. Thomson, Combust. Sci. Technol., 85 (1992).
Kubota, N. and S. Sakamoto, Prop. Explos. Pyrotech., 14 (1989).
Lee, W-J., B. Cicek, and S.M. Senkan, Environ. Sci. Technol., 27 (1993).
Maksimov, Y.Y., Russ. J. Phys. Chem., 45 (1971), p 441.
Moldoveanu, S.C., Analytical Pyrolysis of Natural Organic Polymers, Techniques and Instrumentation in Analytical Chemistry – Volume 20, Elsevier, NY, 1998.
National Research Council (NRC), Prudent Practices for Disposal of Chemicals from Laboratories, National Academy Press Washington, DC, 1983, Chapter 9.
Oyumi, Y. and T. Brill, Combust. Flame, 66 (1986).
Oyumi, Y., Y. Mitarai, and H. Bazaki, Prop. Explos. Pyrotech., 18 (1993).
ERDC/CERL TR-01-66 43
Phillips, R.W., C.A. Orlick, and R. Steinberger, J. Phys. Chem., 59 (1955).
Sidhu, S., N. Kasti, P. Edwards, and B. Dellinger, Chemosphere, 42 (2001), p 499.
Smith, J.D., R. Vandell, and E.M. Hixson, Combust. Sci. Technol., 101 (1994).
Stratta, J.M. and Associates, Inc. and Life Systems, Inc., Open Burning-Open Detonation Waste Generation Survey and Alternatives Research Study, Report for the U.S. Army Construction Engineering Research Laboratory, August 1993.
Subsinsky, M.A. Life Systems, Inc., Identification and Quantification of Energetic Waste Incinerators and Air Emissions from Energetic Waste Incineration, Report for the U.S. Army Construction Engineering Research Laboratory, November 1993.
Tanada, T. N., J. Velazquez, N. Hemmi, and T.A. Cool, Combust. Sci. Technol., 101 (1994).
Taylor, P.H. and B. Dellinger, Environ. Sci. Technol., 22 (1988).
Taylor, P.H., B. Dellinger, and C.C. Lee, Environ. Sci. Technol., 24 (1990).
Taylor, P.H., B. Dellinger, and D.A. Tirey, Int. J. Chem. Kinet., 23 (1991).
Taylor, P.H., D.A. Tirey, W.A. Rubey, and B. Dellinger, Combust. Sci. Technol., 101 (1994).
Tirey, D.A., P.H. Taylor, J. Kasner, and B. Dellinger, Combust. Sci. Technol., 74 (1990).
Tirey, D.A., R.C. Striebich, B. Dellinger, and H.E. Bostian, Haz. Waste and Haz. Mat., 8, (1991).
Urbanski, T., Chemistry and Technology of Explosives, Volume 2, Pergamon Press, NY, 1964.
Vitovec, W., C.P. Koshland, D. Lucas, and R.F. Sawyer, Combust. Sci. Technol., 116-117 (1996).
Wampler, T.P., Applied Pyrolysis Handbook, Marcel Dekker, Inc., NY, 1995.
Wolfram, M.L., J.H. Frazer, L.P. Kuhn, E.E. Dickey, S.M. Olin, D.O. Hoffman, R. S. Bower, A. Chaney, E. Carpenter, and P. McWain, J. Am. Chem. Soc., 77 (1955).
Yinon, J. and S. Zitrin, Modern Methods and Applications in Analysis of Explosives, Wiley, NY, 1993.
Young, C.M. and K.J. Voorhees, Chemosphere, 23 (1991).
Young, C.M. and K.J. Voorhees, Chemosphere, 24 (1992).
44 ERDC/CERL TR-01-66
CERL Distribution
Chief of Engineers ATTN: CEHEC-IM-LH (2) U.S. Army Environmental Center ATTN: SFIM-AEC-TS Engineer Research and Development Center (Libraries) ATTN: ERDC, Vicksburg, MS ATTN: Cold Regions Research, Hanover, NH ATTN: Topographic Engineering Center, Alexandria, VA Defense Tech Info Center 22304 ATTN: DTIC-O 7 7/01
REPORT DOCUMENTATION PAGE Form Approved
OMB No. 0704-0188 Public reporting burden for this collection of information is estimated to average 1 hour per response, including the time for reviewing instructions, searching existing data sources, gathering and maintaining the data needed, and completing and reviewing this collection of information. Send comments regarding this burden estimate or any other aspect of this collection of information, including suggestions for reducing this burden to Department of Defense, Washington Headquarters Services, Directorate for Information Operations and Reports (0704-0188), 1215 Jefferson Davis Highway, Suite 1204, Arlington, VA 22202-4302. Respondents should be aware that notwithstanding any other provision of law, no person shall be subject to any penalty for failing to comply with a collection of information if it does not display a currently valid OMB control number. PLEASE DO NOT RETURN YOUR FORM TO THE ABOVE ADDRESS. 1. REPORT DATE (DD-MM-YYYY)
10-2001 2. REPORT TYPE
Final3. DATES COVERED (From - To)
5a. CONTRACT NUMBER 5b. GRANT NUMBER
4. TITLE AND SUBTITLE Pyrolytic Decomposition Studies of AA2, A Double-Base Propellant
5c. PROGRAM ELEMENT NUMBER 5d. PROJECT NUMBER 622720D048 5e. TASK NUMBER EP-UC5
6. AUTHOR(S) Donald M. Cropek, Patricia A. Kemme, and Jean M. Day
5f. WORK UNIT NUMBER 8. PERFORMING ORGANIZATION REPORT
NUMBER 7. PERFORMING ORGANIZATION NAME(S) AND ADDRESS(ES) U.S. Army Engineer Research and Development Center (ERDC) Construction Engineering Research Laboratory (CERL) P.O. Box 9005 Champaign, IL 61826-9005
ERDC/CERL TR-01-66
9. SPONSORING / MONITORING AGENCY NAME(S) AND ADDRESS(ES) 10. SPONSOR/MONITOR’S ACRONYM(S) U.S. Army Corps of Engineers
441 G Street, NW Washington, DC 20314-1000
11. SPONSOR/MONITOR’S REPORT NUMBER(S)
12. DISTRIBUTION / AVAILABILITY STATEMENT Approved for public release; distribution is unlimited.
13. SUPPLEMENTARY NOTES Copies are available from the National Technical Information Service, 5285 Port Royal Road, Springfield, VA 22161.
14. ABSTRACT
Pyrolysis is the thermal decomposition of a substance into a variety of by-products, usually in the absence of oxygen. This work de-tails pyrolytic studies on AA2, a double-base propellant, currently being incinerated during Army demilitarization operations.
Pyrolysis experiments comparing the behavior of AA2 with the behavior of individual constituents of AA2 provide an excellent exam-ple of the additive property that sometimes exists during thermal degradation of composites. The origin of each pyrolytic by-product from AA2 can be deduced by examining the set of pyrolysis products from each constituent. Good matching between pyrolytic and in-cineration data can support using laboratory pyrolysis to predict incineration behavior.
Samples of original AA2 from an Army installation were collected for analysis. In addition, chemical standards were obtained for the major components of AA2. All samples and standards were subjected to pyrolysis and the by-products were analyzed by gas chroma-tography/mass spectrometry.
15. SUBJECT TERMS demilitarization energetic materials (EM) pyrolysis AA2 hazardous waste disposal munitions waste
16. SECURITY CLASSIFICATION OF: 17. LIMITATION OF ABSTRACT
18. NUMBER OF PAGES
19a. NAME OF RESPONSIBLE PERSON Dr. Donald M. Cropek
a. REPORT Unclassified
b. ABSTRACT Unclassified
c. THIS PAGE Unclassified
SAR
46
19b. TELEPHONE NUMBER (in-clude area code)
(217) 373-7445 Standard Form 298 (Rev. 8-98) Prescribed by ANSI Std. 239.18