pvguard® supervision platform · the remote supervision and main- ... the pvguard® supervision...
TRANSCRIPT

PVGuard® SUPERVISION PLATFORMIntelligent SCADA Software for PV Power Plants

FREQUENCY MEAN
INVERTER STATE
GRID ENERGY
TOTAL YIELD
TEMPERATURE
VOLTAGE AC
FAULT STATEREACTIVE POWER
POWER FACTOR COS PHI
ACTIVE POWER
INVERTER FREQUENCY
RADIATION YIELDOPERATING HOURS PERFORMANCE RATIO
AC POWER
MAIN SWITCH
DC CURRENT STRING
AC CURRENTAC ACTIVE POWER
DC POWER
DC POWER TOTAL
SIGNAL CONTACT
DC VOLTAGE
ERROR CONDITION
3pioneers of energy
DO YOU REALLY KNOW WHAT YOUR PLANT IS DELIVERING?
4 skytron energy
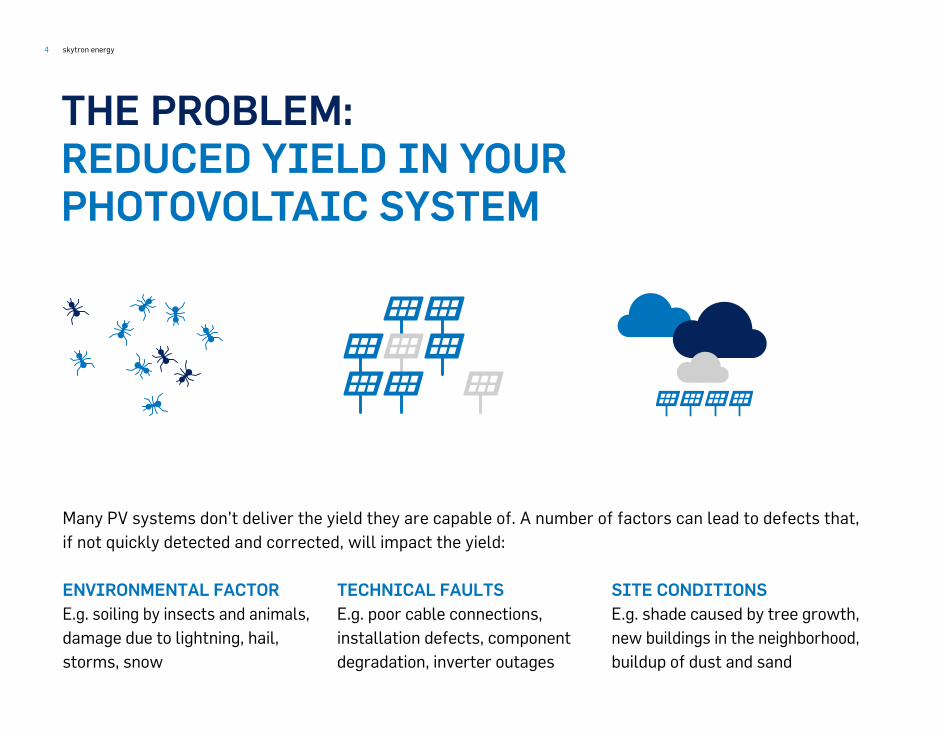
Many PV systems don’t deliver the yield they are capable of. A number of factors can lead to defects that, if not quickly detected and corrected, will impact the yield:
ENVIRONMENTAL FACTOR E.g. soiling by insects and animals, damage due to lightning, hail, storms, snow
TECHNICAL FAULTS E.g. poor cable connections, installation defects, component degradation, inverter outages
SITE CONDITIONS E.g. shade caused by tree growth, new buildings in the neighbor hood, buildup of dust and sand
THE PROBLEM: REDUCED YIELD IN YOUR PHOTOVOLTAIC SYSTEM

5pioneers of energy
THE SOLUTION: PROTECT YOUR INVESTMENT THROUGH MONITORING
The PVGuard® Supervision Platform continuously monitors your PV system, constantly updates your plant portfolio and promptly alerts you to problems. Its integrated alarm management simplifies fault tracking.
PVGuard® is a powerful tool for the remote supervision and main-tenance of your PV power plants. Specially designed for systems in the megawatt range, PVGuard® gives you fast access to all the operations data you need.
Through its clearly presented views – down to string level – and comprehensive alarm manage-ment including automatic alerts, PVGuard® offers you the best possible control of your plant management operations.

6 skytron energy
Full transparency for investors, plant operators and distribution network companies by means of detailed up-to-the-minute assessments and availability reports.
Yield maximization through fast and targeted fault localization, reduced downtime, together with automated logging to ensure your equipment is always running to specification.
Worldwide independence by being able to display your entire plant portfolio on a single platform, independent of its location, its time zone and the technologies used for its inverters and modules.
YOUR BENEFITS: INTELLIGENT SCADA SOFTWARE FROM SKYTRON ENERGY
01 FULL TRANSPARENCY 02 YIELD
MAXIMIZATION 03 WORLDWIDE INDEPENDENCE

7pioneers of energy
°F
°CKWH
0.95KWH
°F
°C
PVGuard® SUPERVISION PLATFORM 10 BENEFITS TO KEEP YOUR INVESTMENT INTACT

8 Vendor-independent PV Monitoring
01 | PVGuard® PROVIDES VENDOR-INDEPENDENT MONITORING› Inverters › Energy meters and environment sensors › Combiner boxes
The PVGuard® Supervision Platform supports all standard inverters, energy meters and envi-ronmental sensors. No matter whose equipment you have chosen, the acquisition and long-term storage of data from all monitored components
in your PV system is assured. Your entire plant portfolio can then be viewed through a single, uniform software platform, so increasing the efficiency of your plant supervision.

9pioneers of energy

10 Management of all your power plants, worldwide, in a single platform
02 | PVGuard® MANAGES ALL YOUR POWER PLANTS, WORLDWIDE› In a single platform › With definable areas of responsibility › Using consistent, user-configurable views
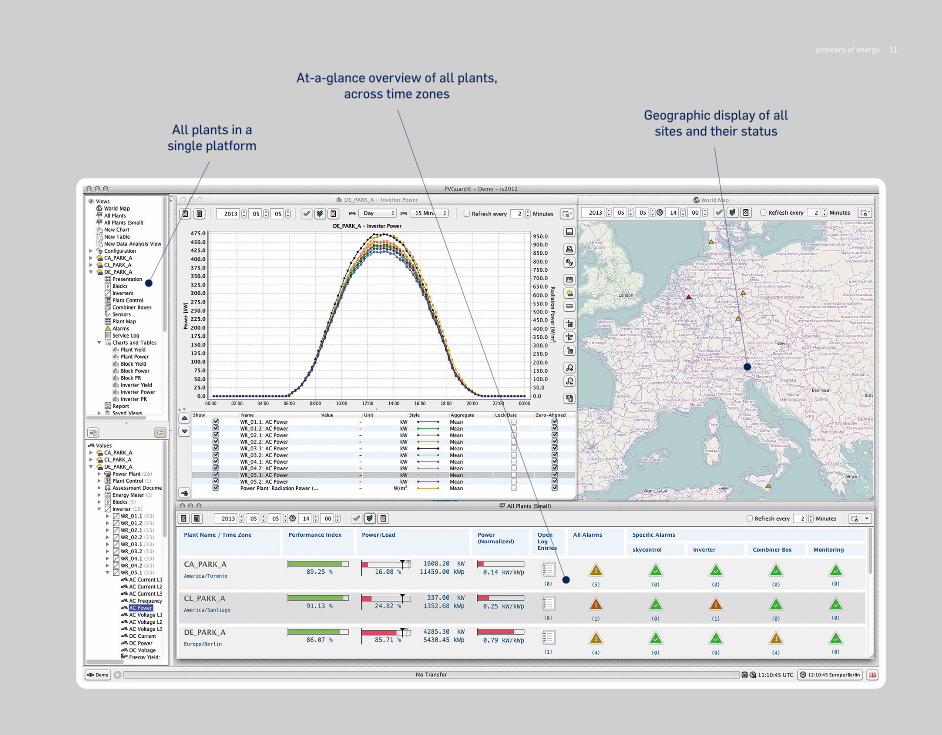
The PVGuard® Supervision Platform helps you demarcate areas of responsibility when managing your power plants. You can set login and access permissions across your entire, global portfolio of plants down to a measurement channel level. Additionally, access rights can be assigned across the available views, power plants, alarms, devices and measurement channels. The integrated Fleet Manager allows you to monitor the technical details
of all PV plants, inverters and alarms across your entire fleet in a single view; this can be filtered and sorted as you wish. Whether you display it on large-screen monitors in your control room or on a tablet PC, you get an at-a-glance picture of the crucial information on your plant fleet. A large choice of supported languages facilitates location- independent plant supervision. You can change the language at any time while you work.
11pioneers of energy
All plants in a single platform
Geographic display of all sites and their status
At-a-glance overview of all plants, across time zones

12 skytron energy
Technical information about all PV plants, inverters and alarms across an entire fleet,
displayed in a single summary view Filtering and sorting across power plants to show details
Optimized views adapted for large screens in a control room or for mobile devices

13pioneers of energy
Choice of languages
Tailored dashboard showing a plant portfolio Energy flow represented
as a plant mimic

14 Visualization of measurement data with a resolution down to a minute
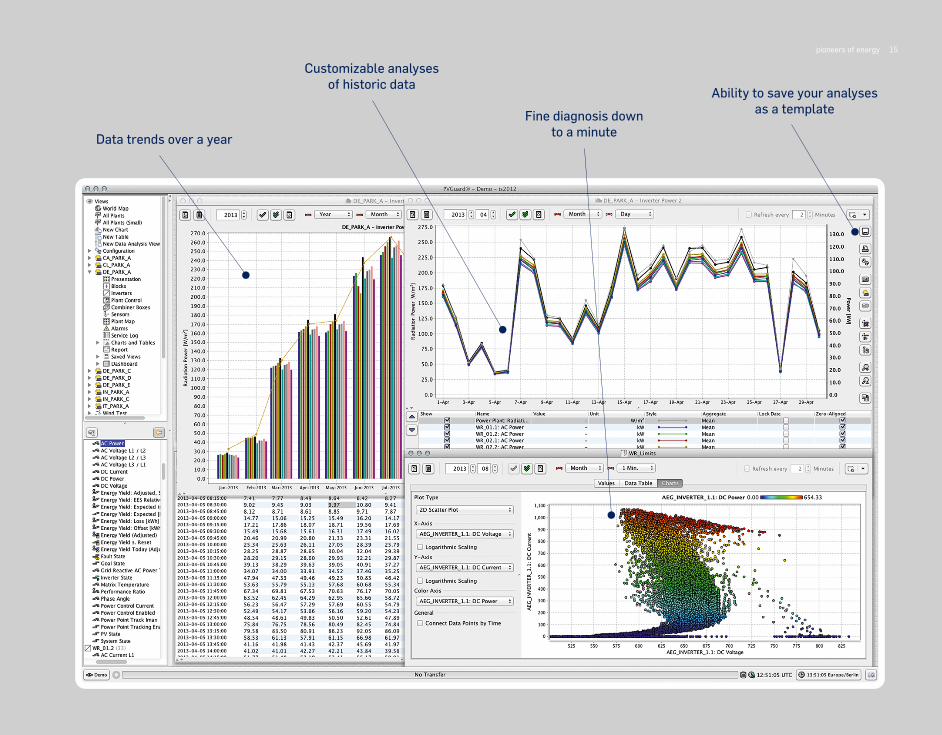
03 | PVGuard® VISUALIZES ALL ACQUIRED DATA ANDSTORES INDIVIDUAL TEMPLATES› In tables and charts according to your need › Optimized operation using color-coded heatmaps › Down to a one-minute resolution
The high resolution and accuracy of the data assists plant owners and operators during fine diagnosis. You can identify and plan any necessary maintenance in advance, thereby maximizing the availability and profitability of your solar plants. You can create your own specialized analyses at will, save them and then later recall them as a template, so that you have quick access to your most important metrics,
and can spot trends. The data from every component and plant can be brought together and evaluated according to your own wishes. Normalized and cumulative metrics are provided, derived from the raw data, and which continuously correct abnor-malities and fill in data gaps automatically. In this way, you are reliably kept aware about your PV system status at all times.
15pioneers of energy
Data trends over a year
Fine diagnosis down to a minute
Ability to save your analyses as a template
Customizable analysesof historic data

16 skytron energy
Early detection of abnormalities or malfunctioning devicesComparison of plant data, e.g. temperature
deviations of different inverters Heatmaps: At-a-glance visualization of large amounts of data

17pioneers of energy
Use of color coded widgets to create individualized dashboards
Quick identification of under-performing components using color coding

18 Visualization of different plants across time zones in comparative views
04 | PVGuard® COMPARES YOUR PV PLANT DATA› In consistent views with all relevant parameters › Regardless of location, with time zone correction › Across all components, providing a quick overview
Predefined views show the relevant components and metrics for each plant: blocks, inverters, combiner boxes, the plant control system and sensors. Data such as performance ratio, irradia- tion or the energy yield is displayed clearly and in a uniform way. This allows easy comparison, with irregularities being easy to spot. By using
consoli dated displays including derived parameters you can compare and assess plants at different locations or using different inverter concepts or module technologies. Time-zone adjusted charts assist when comparing day-by-day curves of plant data from around the world.

19pioneers of energy
Direct comparison of energy yield from different plants
Monitor down to block, inverter or sensor Comparisons of the performance
of different systems
Correlating irradiation data across timezones

20 Alarm management with integrated error logging and fault analysis
05 | PVGuard® REPORTS ALARMS › Automatically from all components › With detailed fault descriptions › Clearly displaying alarm processing status
Speed up your response to outages and achieve higher plant availability through continuous monitoring as part of a systematic and efficient operations management (O&M) strategy. Specify which faults are to be monitored, their criteria and limits, taking into account the plant topology and
site-specific factors such as string layouts, shading or inverter mode. The alarm status can be called up from different plant views. Alarm management provides you with the relevant information and can record the processing of alarms.

21pioneers of energy
Inverter alarms and status
Alarms depicted in site map for geographic orientation
Overview of alarms from all plants

22 skytron energy
List of current alarms with filter
Alarm details with processing history and fault log
Listing of historic alarms

23pioneers of energy
Charting of alarms for fine diagnosis

24 Optimized power plant control with logging and curtailment alerts
06 | PVGuard® CONTROLS YOUR FLEET› With a full supervision log incl. control and output curtailment› With calculation of expected yields› With alerts for curtailment events
Flexible PV systems are a prerequisite for integration into grid networks and markets. With skycontrol your PV power plants are prepared for the challenges of the future; the PVGuard® Supervision Platform lets you visualize their integration into the energy management systems. In this way you can ensure a solid connection with the network management system and obtain a visual display and documenta-tion of the curtailment.
Through its integrated control function RtSO (Real-time SCADA Operations), you can connect directly to your power plant via a customized dashboard and operate breakers. In this way, you can switch individual inverters, blocks or even the entire power station on and off. All operations are logged for later evaluation. Integrated authentication and encryption ensure a high level of security.

25pioneers of energy
Current state of active power limiting
Evaluation of daily output and quantification of losses due to
active power limiting
Integrated control functions allow remote switching
(Real-time SCADA Operations RtSO)Daily log of power limiting set against
received irradiation

26 Storage and archiving of all measured data over the entire plant lifecycle
07 | PVGuard® STORES HISTORIC DATA› Over the whole lifecycle › Allowing assessment against manufacturer warranty › Providing historical comparison of your data
You can get full access at any time to all historic data covering the entire lifespan of your plants. This allows you to identify any aging effects – such as module degradation – that affect the yield of your systems, and to assess this against
the manufacturer warranty. Flexible tables and charts are available to assist with visualization and analysis. All views allow you to see a plant’s actual status at any given time.

27pioneers of energy
Evaluation of historical data covering the entire plant operational life
Data analysis in a scatter plotIndividual configuration of
the way data is presented

28
08 | PVGuard® GENERATES FLEXIBLE PLANT REPORTS AND VIEWS› In templates created by yourself › Adapted to your requirements › With your own choice of plant data
The FlexReportXL report generator generates cus tomizable reports using any data from your entire portfolio of plants. Seamlessly integrated into PVGuard®, reports can access all its high-resolu tion data. The combination of freely laid-out report templates and extensive scheduling options, provide you with flexible, informative and accurate plant reports. Multiple reports, each with different content can be created and delivered automatically according to your defined schedule.
You can also tailor the way live data is depicted using PVGuard® Dashboards. Lay out your own views using the Dashboard Designer, with the arrangement and detail of the data meeting your specific needs. Any data channels that you can see in PVGuard® may be depicted in Dashboards. You can include your own graphics too – such as branding and symbols, maps and photos. In this way you can maximize the attractiveness and usability of PVGuard®.
Tailored plant reports and views, adapted to your requirements

29pioneers of energy
Tailored views
Gallery of predefined widgets
Canvas allowing free layout

30
09 | PVGuard® PRODUCES PRODUCTION FORECASTS› For today, tomorrow or a few days ahead › At an hourly resolution for up to 7 days in advance › Updated several times a day
PVGuard® uses a self-adaptive algorithm to predict the plant output, based on high-quality, current weather data, the plant’s characteristics and its output over recent weeks. Updated several times a day, projections are available worldwide at hourly intervals and for a period of up to seven days in advance. This allows you to maximize
revenues for your photovoltaic systems in direct marketing situations or, where necessary – such as in California, Puerto Rico, South Africa and Romania – to meet the grid network requirements. The forecast data may be integrated seamlessly into your own views, analyses or reports, allowing you to visualize and evaluate it as you wish.
Forecasts of your PV systems’ production for optimal integration into power grid and market

31pioneers of energy
Output forecast to hourly resolution and actual production
Clear display of the weather data

32 Complete documentation of operation and maintenance
10 | PVGuard® INCORPORATES AN INTEGRATED SERVICE LOG › For documenting operation, service and repair › With links to alarm management › Simplifying compliance with record keeping needs
The service log provides you with a chronological record of the operation, maintenance and repair of your plant. It allows you to link your records to any relevant alarms and device specifics, and add your
own notes. Records are stored centrally and can be fully recalled at any time. The service log helps you meet the necessary record keeping requirements of ISO 9001 and ISO 14001 certification.

33pioneers of energy
Chronological record of plant operation
Categories for classifying records
Links between log entries and associated alarms or components

35pioneers of energy
PVGuard® MOBILE YOUR MOST IMPORTANT PV PLANT METRICS ON-THE-GO, WORLDWIDE
°F
°CKWH
0.95KWH
°F
°C

36 skytron energy
With PVGuard® Mobile, you get worldwide fast access to the most important data across your plant portfolio. The interests of investors and
operators are catered for through customized views, with key data about performance and yield being clearly presented on your mobile device.
BENEFITS AT A GLANCE› Mobile access to your entire global power plant portfolio › Personalized plant overview with key performance data from your PV systems› Shows current status, device data and historic performance
PVGuard® MOBILEMOBILE ACCESS TO PV PLANT

37pioneers of energy

38 skytron energy
CONTACT DETAILS AND LEGAL NOTICE
(Status 5 / 2017)
COPYRIGHT & LEGAL NOTICE
Published by / responsible for content:
skytron® energy GmbH / Ernst-Augustin-Strasse 15 / 12489 Berlin, Germany
Management: Francisco Baraona
Concept, text, design: Frohe Zukunft Export – Kommunikation + Design, Berlin
Installation and user manuals, user handbooks and further information: www.pv-guard.com/en
MANUALS AND NEWS
skytron® energy GmbHErnst-Augustin-Strasse 15 12489 BerlinGermany
skytron energy corp.3145 E Chandler Blvd, Ste 110, PMB 440, Phoenix, AZ 85048, USA
skytron energy Japan K.K.Oak Minami Azabu Building 11c, 3-19-23 Minami Azabu Minato-ku, Tokyo, Japan 106-0047
T: +49 (0)30 33 84 30 - 0 / [email protected] / www.skytron-energy.com

TEST IT!PVGuard®DEMO-ACCESS

www.skytron-energy.com