p.v. viswanath for a first course in finance. p.v. viswanath 2 a borrowing arrangement where the...
Post on 19-Dec-2015
218 views
TRANSCRIPT
Introduction to Bonds Description and Pricing
P.V. V ISWA NAT H
F OR A F IRST COURSE IN F INA N CE
P.V. Viswanath
2
What are bonds?
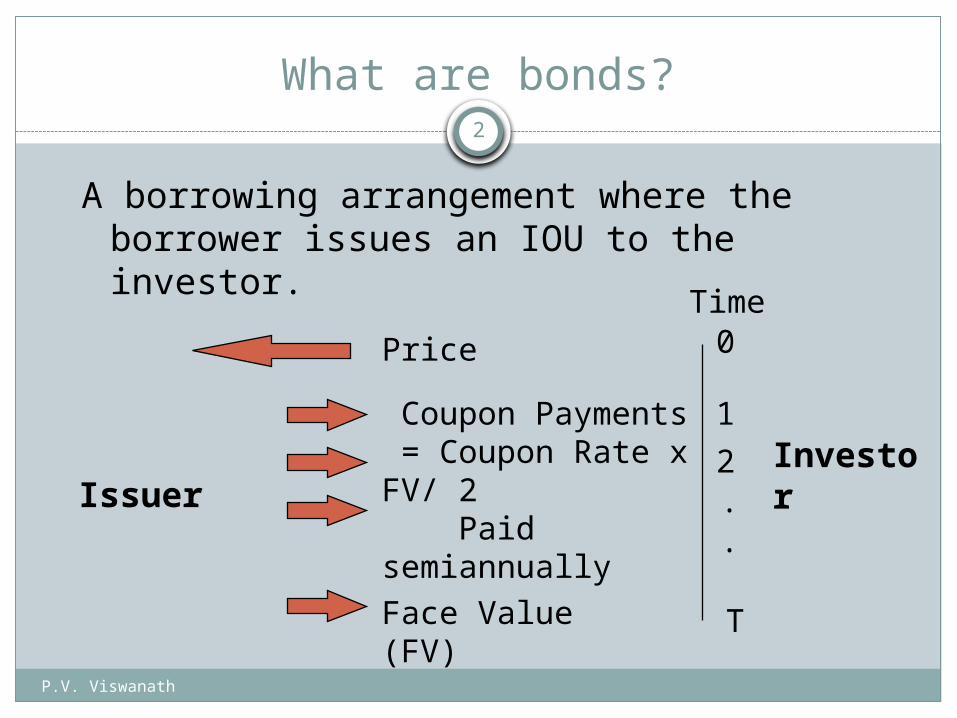
A borrowing arrangement where the borrower issues an IOU to the investor.
InvestorIssuer
Price 0
TFace Value (FV)
Coupon Payments = Coupon Rate x FV/ 2 Paid semiannually
1
2..
Time
P.V. Viswanath
3
Bond Pricing
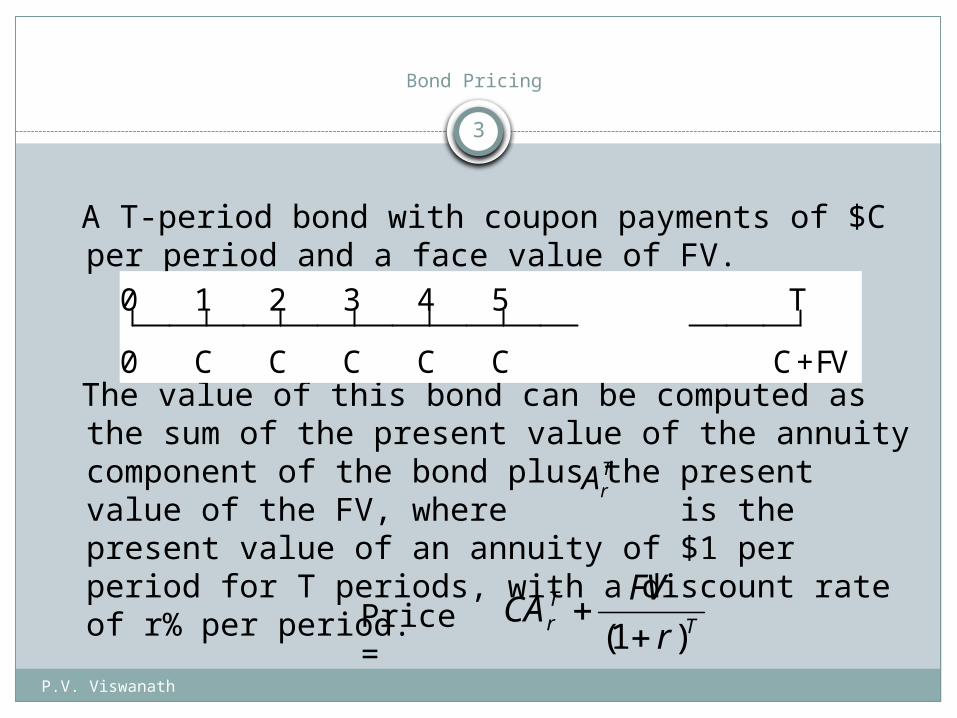
A T-period bond with coupon payments of $C per period and a face value of FV.
The value of this bond can be computed as the sum of the present value of the annuity component of the bond plus the present value of the FV, where is the present value of an annuity of $1 per period for T periods, with a discount rate of r% per period.
0 1 2 3 T
0 C C C
4 5
C + FVC C
TTr r
FVCA
)1(
TrA
Price =
P.V. Viswanath
4
Bonds with semi-annual coupons
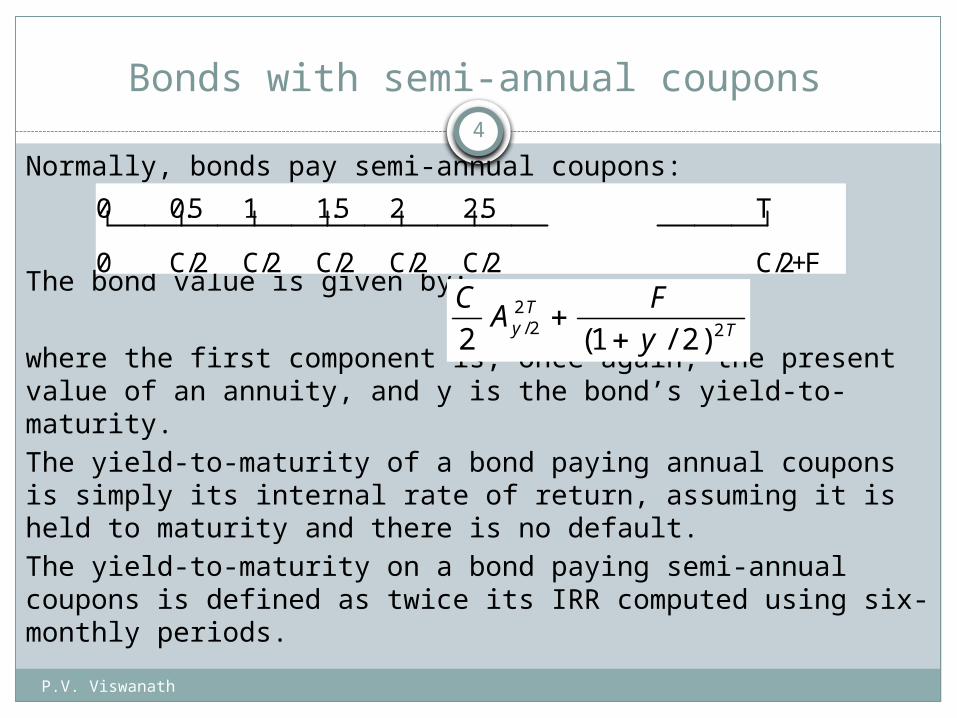
Normally, bonds pay semi-annual coupons:
The bond value is given by:
where the first component is, once again, the present value of an annuity, and y is the bond’s yield-to-maturity.The yield-to-maturity of a bond paying annual coupons is simply its internal rate of return, assuming it is held to maturity and there is no default.The yield-to-maturity on a bond paying semi-annual coupons is defined as twice its IRR computed using six-monthly periods.
0 0.5 1 1.5 T
0 C/2
2 2.5
C/2+FC/2 C/2 C/2 C/2
CA
F
yyT
T2 1 222
2/ ( / )
P.V. Viswanath
5
Bond Pricing Example
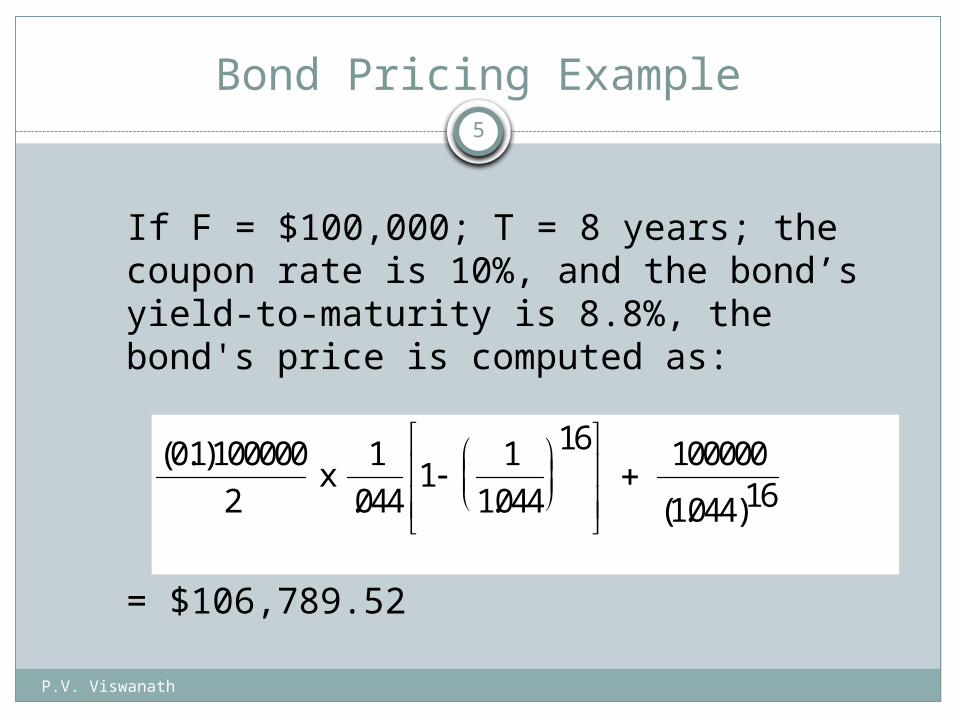
If F = $100,000; T = 8 years; the coupon rate is 10%, and the bond’s yield-to-maturity is 8.8%, the bond's price is computed as:
= $106,789.52
( . )
. . ( . )
01 100000
2
1
0441
1
1044
16 100000
1044 16 x
P.V. Viswanath
6The Relation between Bond Prices and Yields
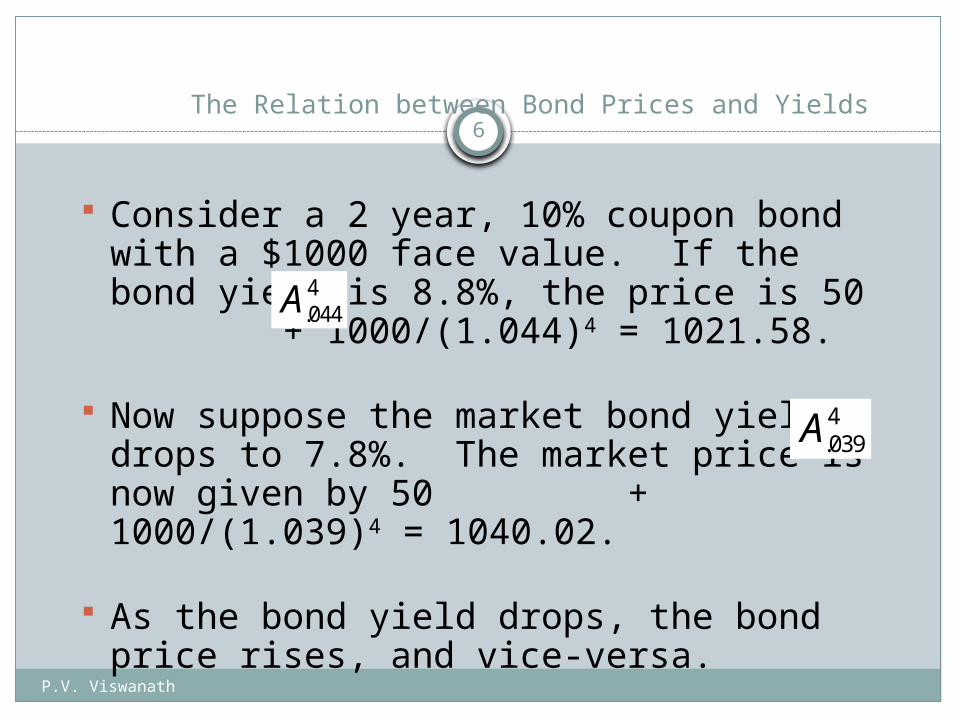
Consider a 2 year, 10% coupon bond with a $1000 face value. If the bond yield is 8.8%, the price is 50 + 1000/(1.044)4 = 1021.58.
Now suppose the market bond yield drops to 7.8%. The market price is now given by 50 + 1000/(1.039)4 = 1040.02.
As the bond yield drops, the bond price rises, and vice-versa.
A.0394
A.0444
P.V. Viswanath
7
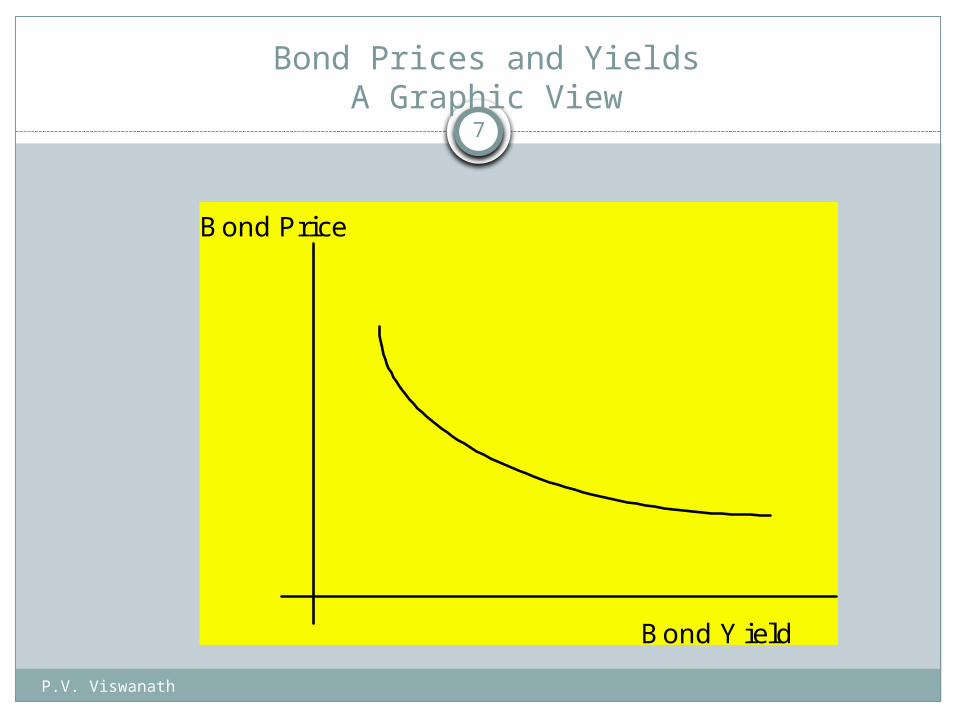
Bond Prices and YieldsA Graphic View
Bond Price
Bond Yield
P.V. Viswanath
8Bond Yield Measurement: Examples
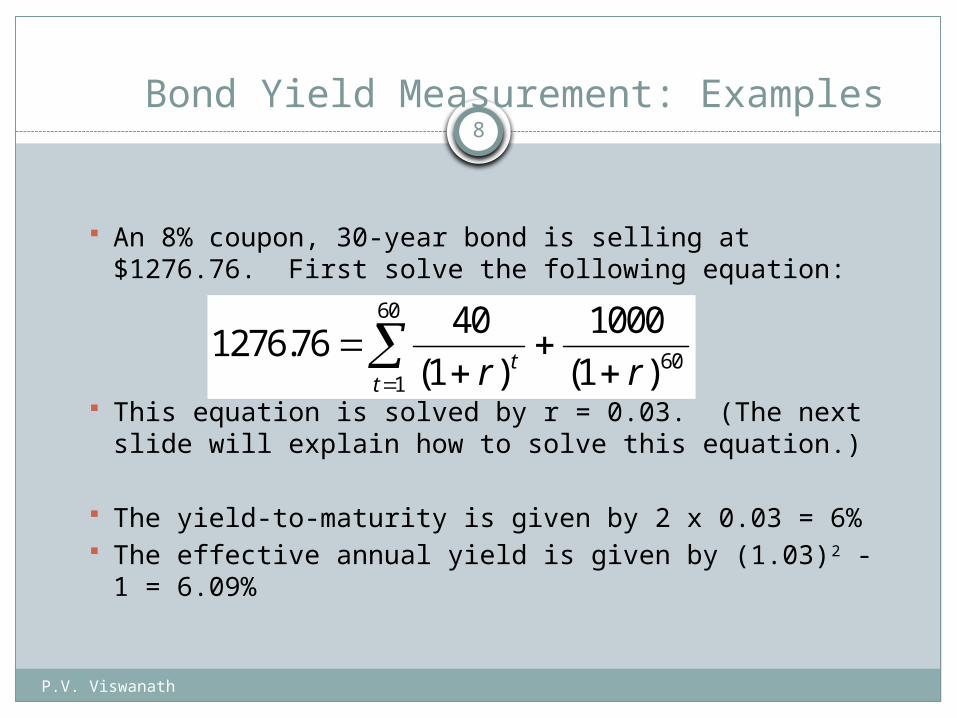
An 8% coupon, 30-year bond is selling at $1276.76. First solve the following equation:
This equation is solved by r = 0.03. (The next slide will explain how to solve this equation.)
The yield-to-maturity is given by 2 x 0.03 = 6% The effective annual yield is given by (1.03)2 - 1
= 6.09%
1276 7640
1
1000
11
60
60.
( ) ( )
r rtt
P.V. Viswanath
9
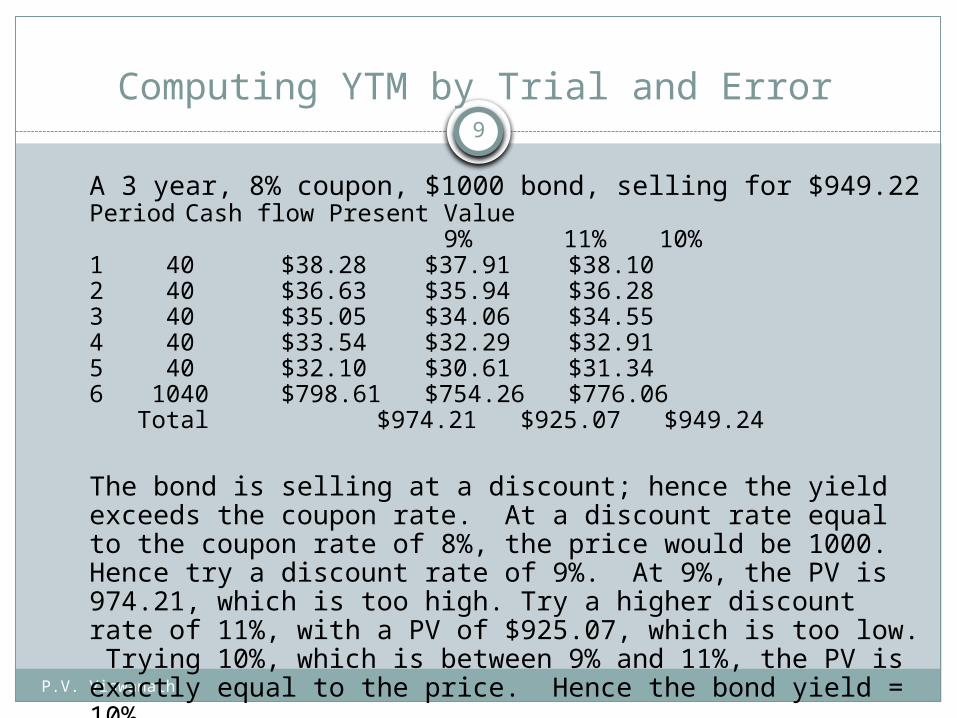
A 3 year, 8% coupon, $1000 bond, selling for $949.22Period Cash flow Present Value
9% 11% 10%1 40 $38.28 $37.91 $38.10 2 40 $36.63 $35.94 $36.28 3 40 $35.05 $34.06 $34.55 4 40 $33.54 $32.29 $32.91 5 40 $32.10 $30.61 $31.34 6 1040 $798.61 $754.26 $776.06
Total $974.21 $925.07 $949.24
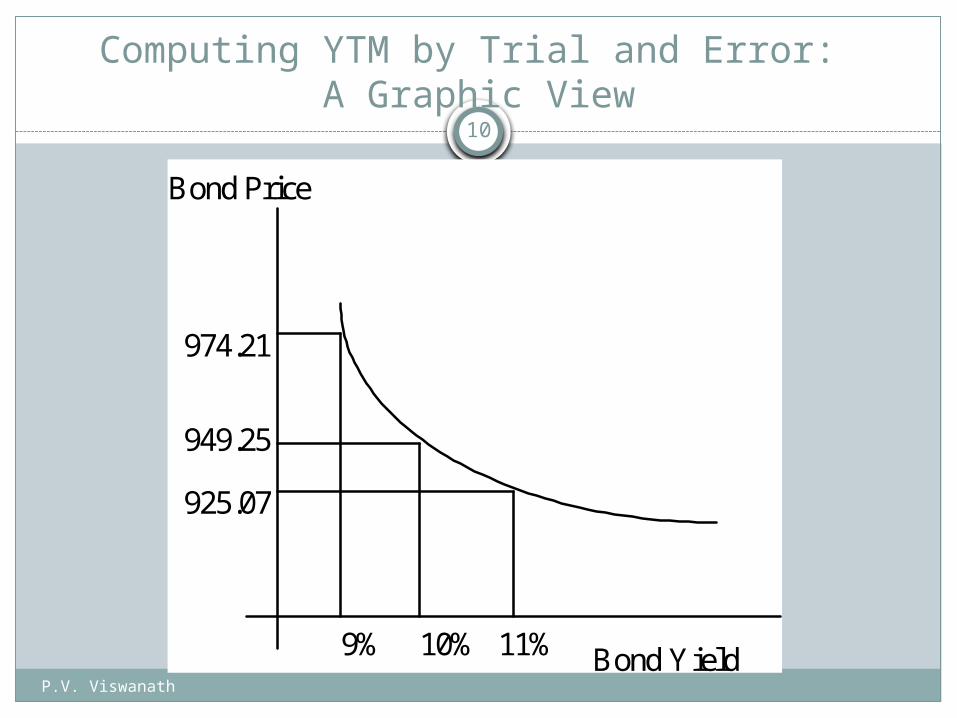
The bond is selling at a discount; hence the yield exceeds the coupon rate. At a discount rate equal to the coupon rate of 8%, the price would be 1000. Hence try a discount rate of 9%. At 9%, the PV is 974.21, which is too high. Try a higher discount rate of 11%, with a PV of $925.07, which is too low. Trying 10%, which is between 9% and 11%, the PV is exactly equal to the price. Hence the bond yield = 10%.
Computing YTM by Trial and Error
P.V. Viswanath
10
Computing YTM by Trial and Error: A Graphic View
Bond Price
Bond Yield
949.25
10%9% 11%
974.21
925.07
P.V. Viswanath
11
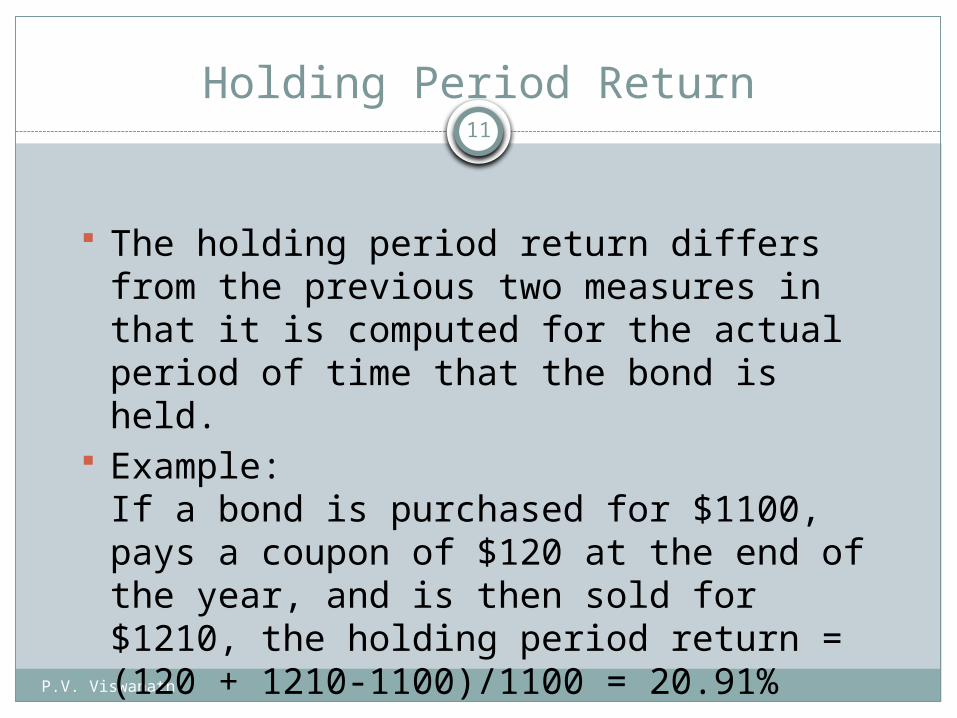
Holding Period Return
The holding period return differs from the previous two measures in that it is computed for the actual period of time that the bond is held.
Example:If a bond is purchased for $1100, pays a coupon of $120 at the end of the year, and is then sold for $1210, the holding period return = (120 + 1210-1100)/1100 = 20.91%
P.V. Viswanath
12
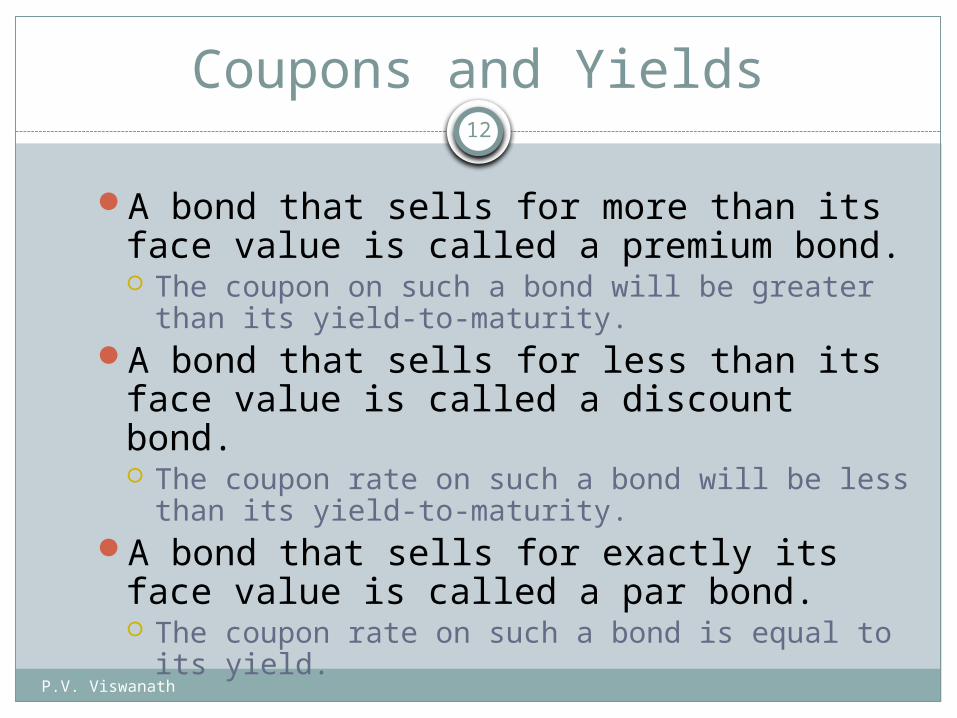
Coupons and Yields
A bond that sells for more than its face value is called a premium bond. The coupon on such a bond will be greater than its
yield-to-maturity.A bond that sells for less than its face
value is called a discount bond. The coupon rate on such a bond will be less than
its yield-to-maturity.A bond that sells for exactly its face value
is called a par bond. The coupon rate on such a bond is equal to its
yield.

P.V. Viswanath
13
Non-flat Term Structures
There is an implicit assumption made in the previous slide that the annualized discount rate is independent of when the cashflows occur.
That is, we assume that if $100 to be paid in year 1 are worth $94.787 today, resulting in an implicit discount rate of (100/94.787 -1 =) 5.5%, then $100 to be paid in year 2 are worth (in today’s dollars), 100/(1.055)2 = $89.845. However, this need not be so.
Demand and supply for year 1 dollars need not be subject to the same forces as demand and supply for year 2 dollars. Hence we might have the 1 year discount rate be 5.5%, the year 2 discount rate 6% and the year 3 discount rate 6.5%.
P.V. Viswanath
14
Non-flat Term Structures
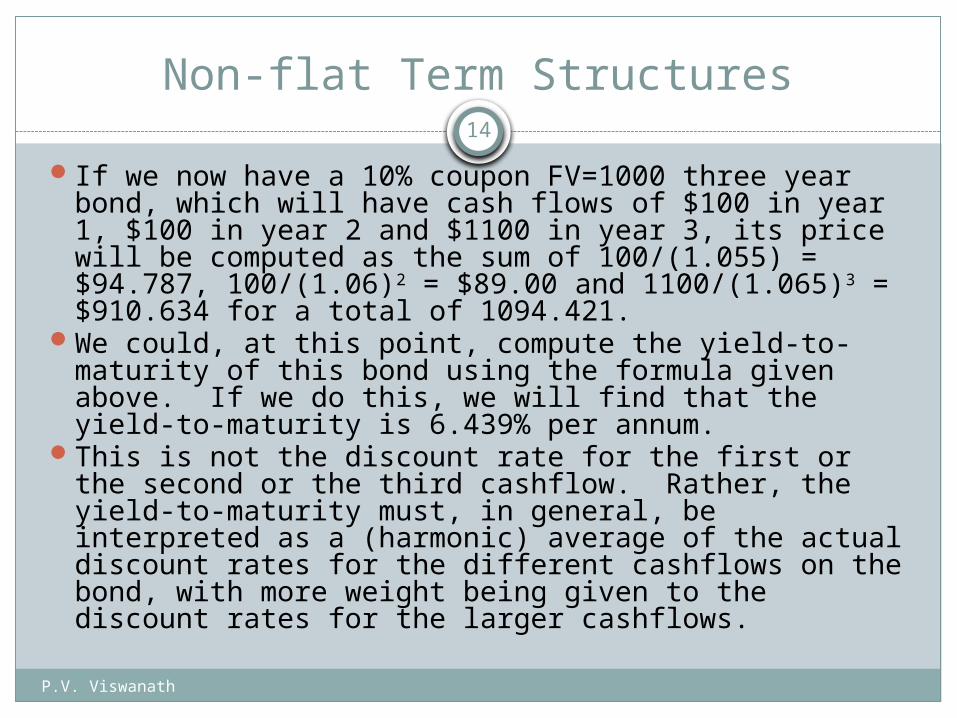
If we now have a 10% coupon FV=1000 three year bond, which will have cash flows of $100 in year 1, $100 in year 2 and $1100 in year 3, its price will be computed as the sum of 100/(1.055) = $94.787, 100/(1.06)2 = $89.00 and 1100/(1.065)3 = $910.634 for a total of 1094.421.
We could, at this point, compute the yield-to-maturity of this bond using the formula given above. If we do this, we will find that the yield-to-maturity is 6.439% per annum.
This is not the discount rate for the first or the second or the third cashflow. Rather, the yield-to-maturity must, in general, be interpreted as a (harmonic) average of the actual discount rates for the different cashflows on the bond, with more weight being given to the discount rates for the larger cashflows.
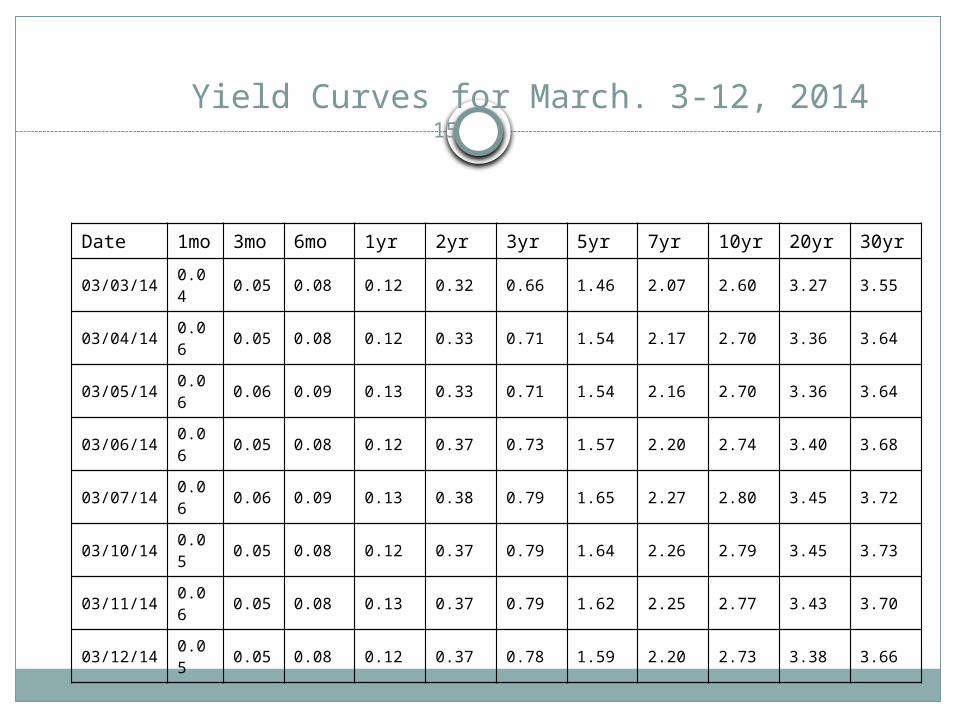
Yield Curves for March. 3-12, 2014
Date 1mo 3mo 6mo 1yr 2yr 3yr 5yr 7yr 10yr 20yr 30yr
03/03/14 0.04 0.05 0.08 0.12 0.32 0.66 1.46 2.07 2.60 3.27 3.55
03/04/14 0.06 0.05 0.08 0.12 0.33 0.71 1.54 2.17 2.70 3.36 3.64
03/05/14 0.06 0.06 0.09 0.13 0.33 0.71 1.54 2.16 2.70 3.36 3.64
03/06/14 0.06 0.05 0.08 0.12 0.37 0.73 1.57 2.20 2.74 3.40 3.68
03/07/14 0.06 0.06 0.09 0.13 0.38 0.79 1.65 2.27 2.80 3.45 3.72
03/10/14 0.05 0.05 0.08 0.12 0.37 0.79 1.64 2.26 2.79 3.45 3.73
03/11/14 0.06 0.05 0.08 0.13 0.37 0.79 1.62 2.25 2.77 3.43 3.70
03/12/14 0.05 0.05 0.08 0.12 0.37 0.78 1.59 2.20 2.73 3.38 3.66
15
16
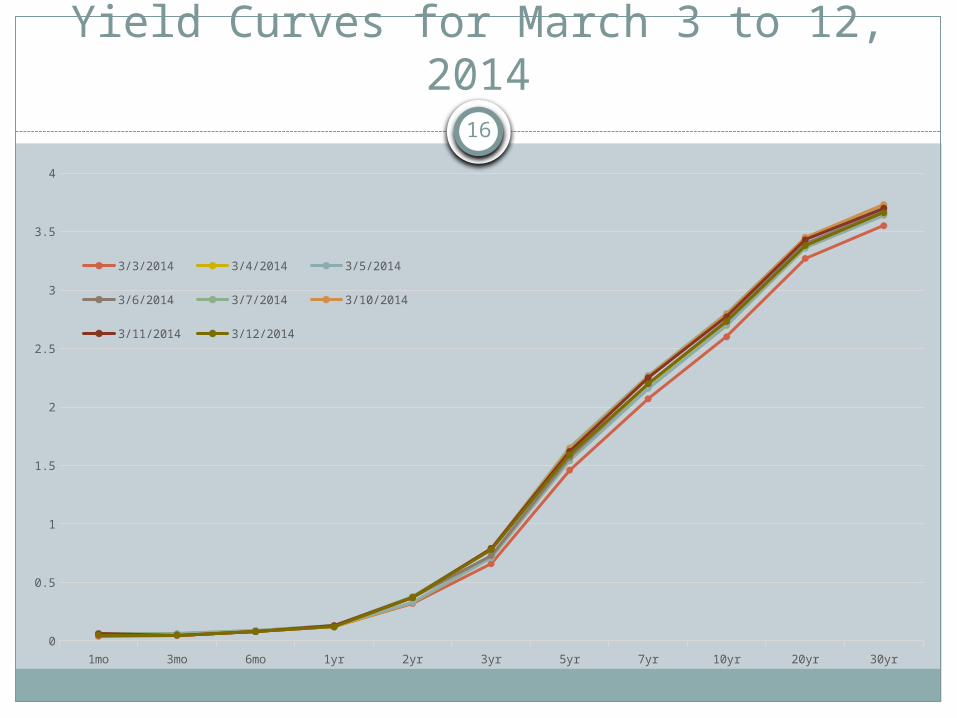
Yield Curves for March 3 to 12, 2014
1mo 3mo 6mo 1yr 2yr 3yr 5yr 7yr 10yr 20yr 30yr0
0.5
1
1.5
2
2.5
3
3.5
4
3/3/2014 3/4/2014 3/5/2014
3/6/2014 3/7/2014 3/10/2014
3/11/2014 3/12/2014
P.V. Viswanath
17
Time Pattern of Bond Prices
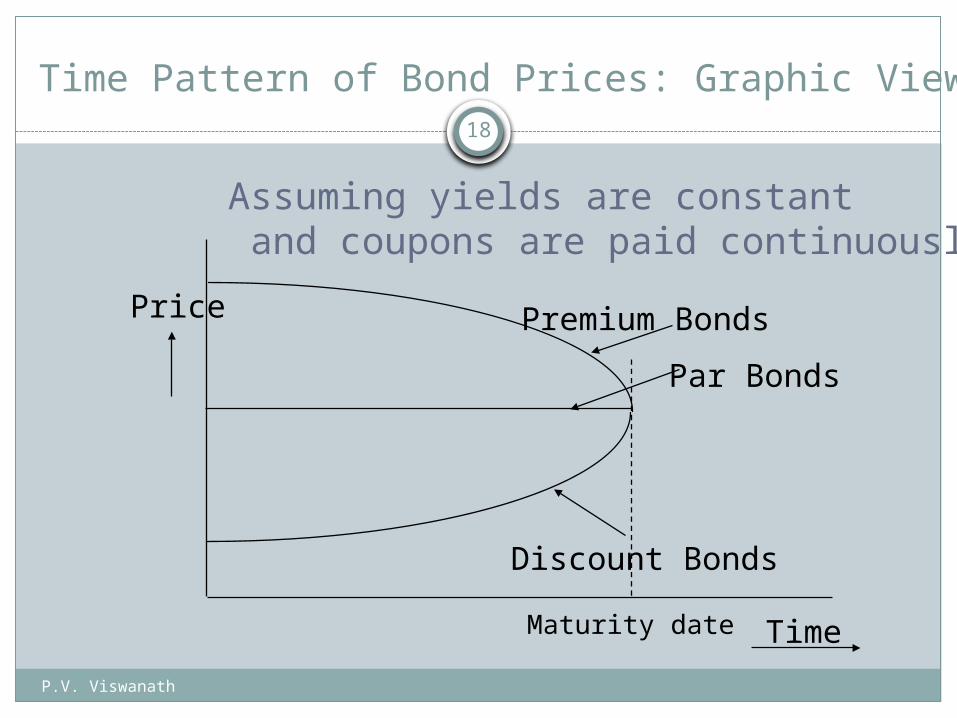
From the table and graph above, we saw that the yield curve need not be flat, and further that the yield curve, itself, can change over time.This means that bond prices change over time, as well.Bonds, like any other asset, represent an investment by the bondholder. As such, the bondholder expects a certain total return by way of capital appreciation and coupon yield. This implies a particular pattern of bond price movement over time.
P.V. Viswanath
18
Time Pattern of Bond Prices: Graphic View
Discount Bonds
Premium Bonds
Par Bonds
Maturity date Time
Price
Assuming yields are constant and coupons are paid continuously
P.V. Viswanath
19
Time Pattern of Bond Prices in Practice
Coupons are paid semi-annually. Hence the bond price would increase at the required rate of return between coupon dates, because the bondholder will want to get a positive return on his/her investment.
On the coupon payment date, the bond price would drop by an amount equal to the coupon payment.
To prevent changes in the quoted price in the absence of yield changes, the price quoted excludes the amount of the accrued coupon.
Example: An 8% coupon bond quoted at 96 5/32 on March 31, 2008, paying its next coupon on June 30, 2008 would actually require payment of 961.5625 + 0.5(80/2) = $981.5625.
Copyright © 2009 Pearson Prentice Hall. All rights reserved.
8-20
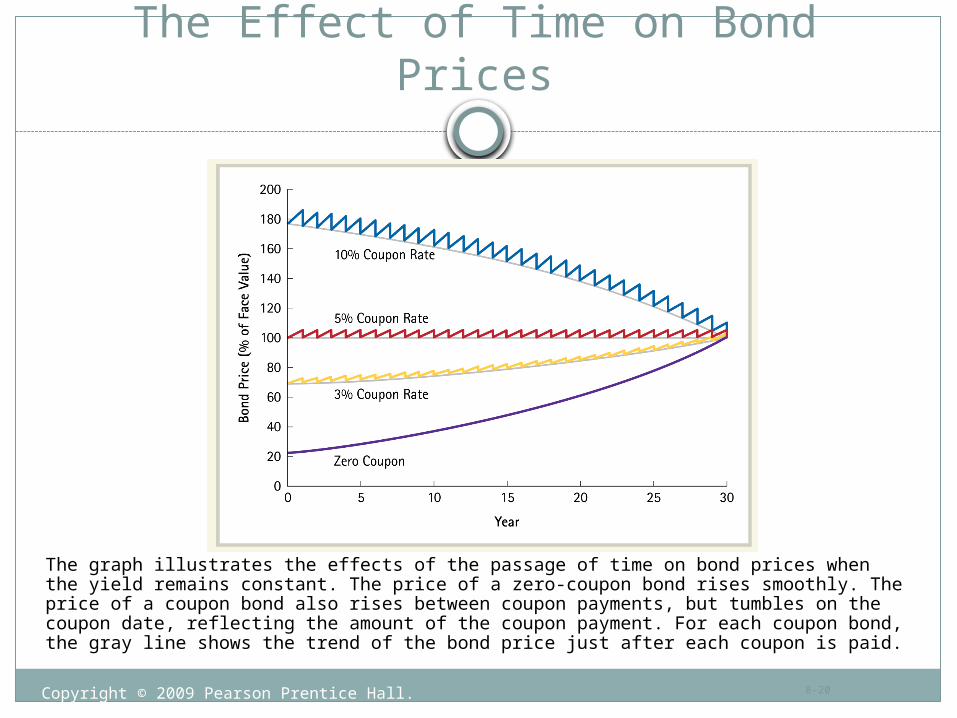
The Effect of Time on Bond Prices
The graph illustrates the effects of the passage of time on bond prices when the yield remains constant. The price of a zero-coupon bond rises smoothly. The price of a coupon bond also rises between coupon payments, but tumbles on the coupon date, reflecting the amount of the coupon payment. For each coupon bond, the gray line shows the trend of the bond price just after each coupon is paid.
P.V. Viswanath
21
Price changes due to yield changes
Of course, bond prices will also change because yields to maturity (or equivalently, the underlying discount rates) change. That is, because the supply and demand conditions for future resources change.
In general, the greater the maturity of a bond, the greater its price sensitivity to changes in the underlying yield.
If the yields on bonds of all maturities changed equally, then bond price sensitivities would be close to their maturities.
However, long-term yields change less than short-term yields.
Hence long-term bond prices are more volatile, but less than in proportion to their maturities.
Copyright © 2009 Pearson Prentice Hall. All rights reserved.
8-22
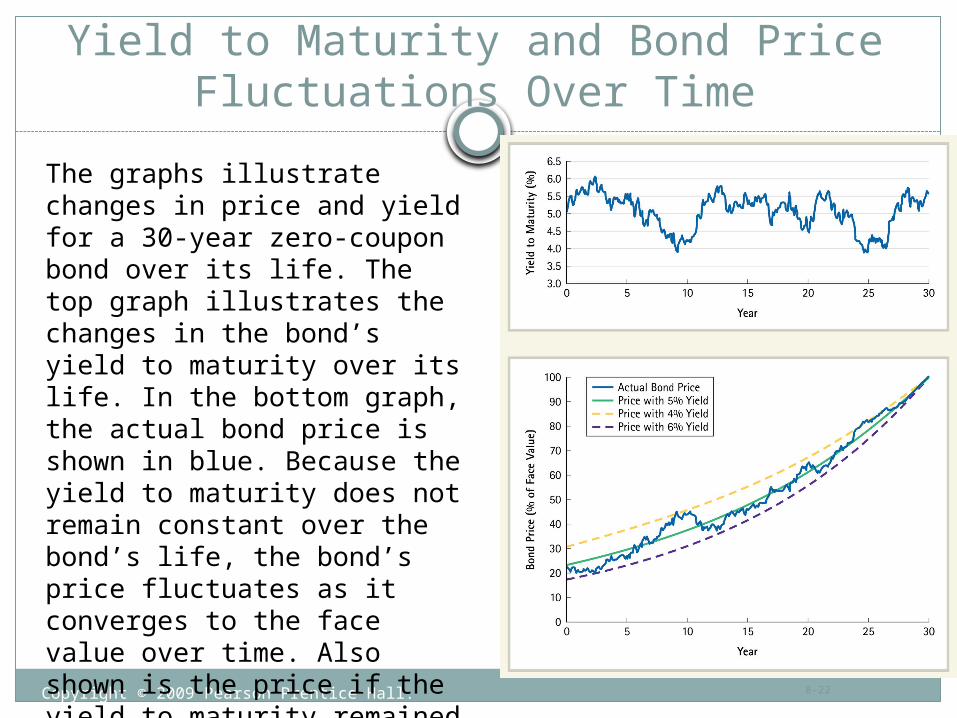
Yield to Maturity and Bond Price Fluctuations Over Time
The graphs illustrate changes in price and yield for a 30-year zero-coupon bond over its life. The top graph illustrates the changes in the bond’s yield to maturity over its life. In the bottom graph, the actual bond price is shown in blue. Because the yield to maturity does not remain constant over the bond’s life, the bond’s price fluctuates as it converges to the face value over time. Also shown is the price if the yield to maturity remained fixed at 4%, 5%, or 6%.
P.V. Viswanath
23
Types of Bond Issuers
Treasury Bonds and Notes Corporate Bonds Other Issuers
State and Local Governments (Munis) Government Agencies
P.V. Viswanath
24
Credit Risk
Corporate bonds are subject to potential default. Therefore, the promised yield is the maximum possible yield to maturity of the bond, not necessarily the actual yield to maturity.
To compensate investors for the possibility of bankruptcy, a corporate bond must offer a default premium, a differential between the promised yield and the expected yield to maturity.
The default premium depends on : o the probability of defaulto the likely loss in the event of default.
P.V. Viswanath
25
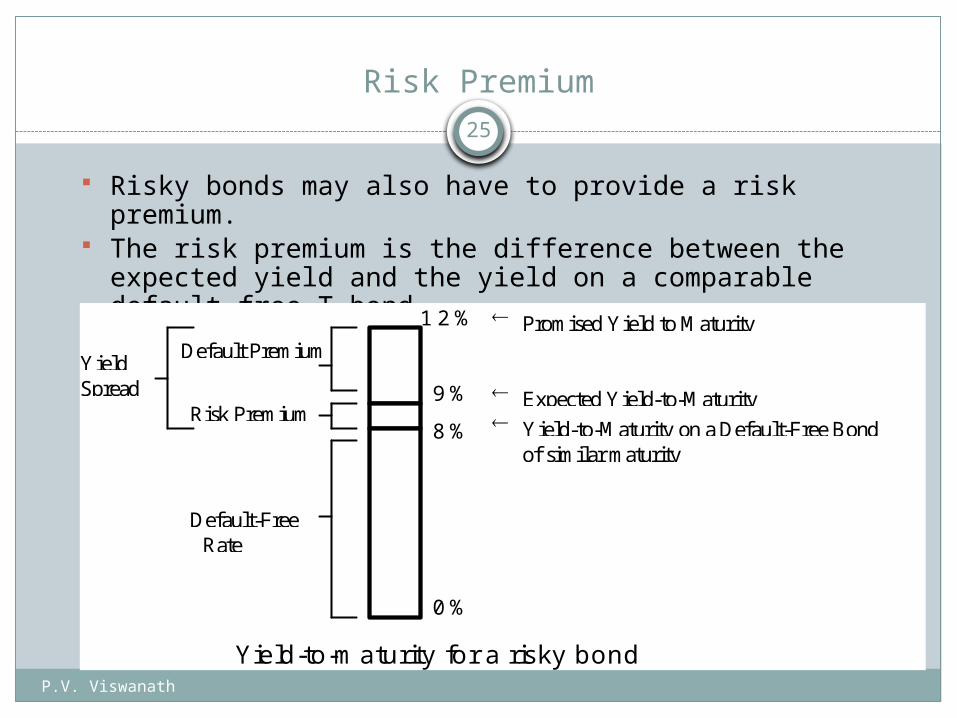
Risk Premium
Risky bonds may also have to provide a risk premium. The risk premium is the difference between the expected
yield and the yield on a comparable default-free T-bond. A risk premium is needed only if the bond risk is not
diversifiable. 1 2 %
9 %
8 %
0 %
Promised Yield to Maturity
Expected Yield-to-Maturity
Yield-to-Maturity on a Default-Free Bondof similar maturity
Default-FreeRate
Risk Premium
Default PremiumYieldSpread
Yield-to-maturity for a risky bond
Copyright © 2009 Pearson Prentice Hall. All rights reserved.
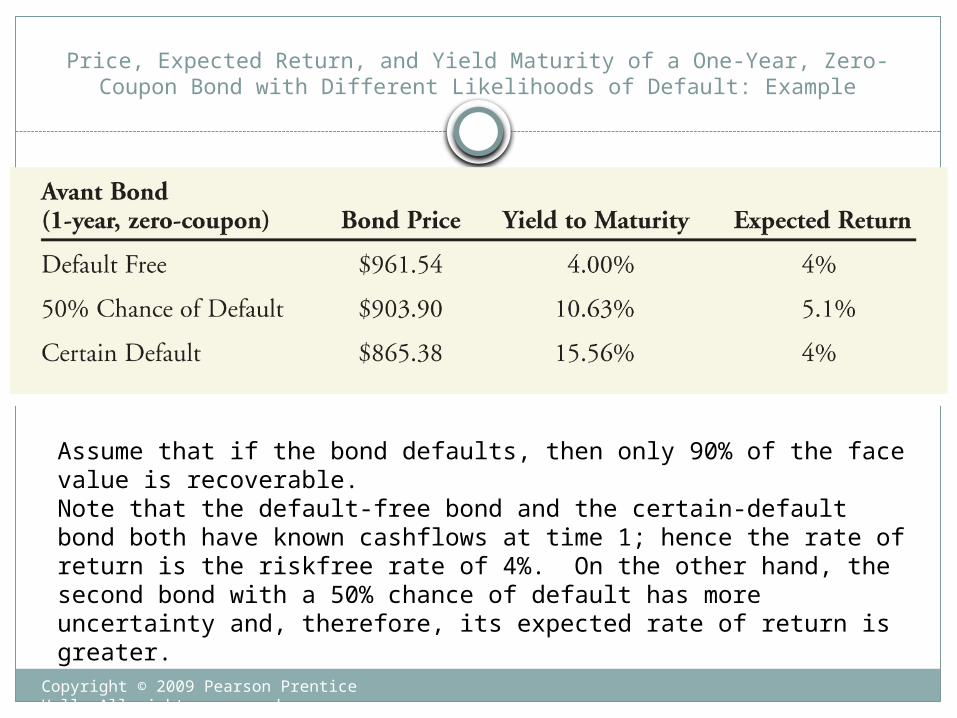
Price, Expected Return, and Yield Maturity of a One-Year, Zero-Coupon Bond with Different Likelihoods of Default: Example
Assume that if the bond defaults, then only 90% of the face value is recoverable.Note that the default-free bond and the certain-default bond both have known cashflows at time 1; hence the rate of return is the riskfree rate of 4%. On the other hand, the second bond with a 50% chance of default has more uncertainty and, therefore, its expected rate of return is greater.
Copyright © 2009 Pearson Prentice Hall. All rights reserved.
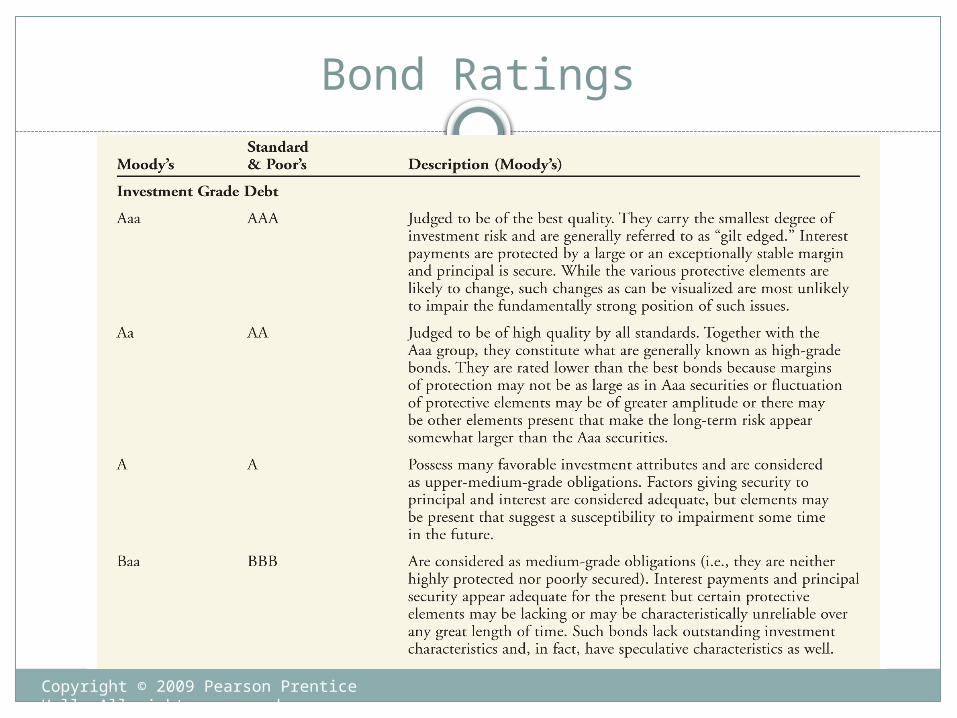
Bond Ratings
Copyright © 2009 Pearson Prentice Hall. All rights reserved.
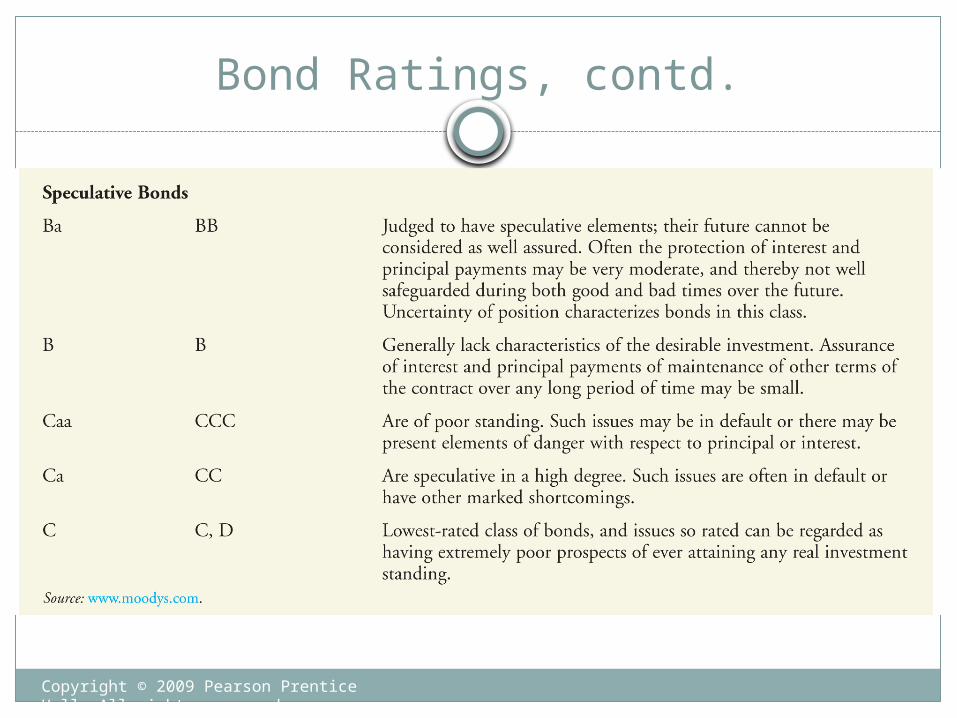
Bond Ratings, contd.
Copyright © 2009 Pearson Prentice Hall. All rights reserved.
8-29
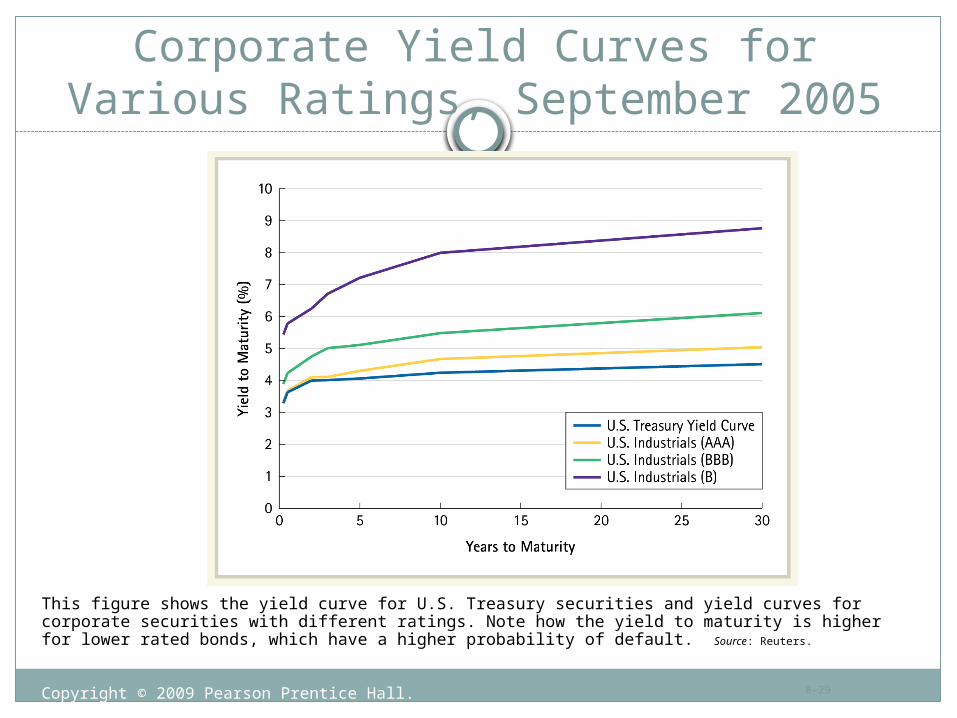
Corporate Yield Curves for Various Ratings, September 2005
This figure shows the yield curve for U.S. Treasury securities and yield curves for corporate securities with different ratings. Note how the yield to maturity is higher for lower rated bonds, which have a higher probability of default. Source: Reuters.