pulsed fluorescence measurements of trapped molecular … detection.pdfpulsed fluorescence...
TRANSCRIPT
Pulsed Fluorescence Measurements of TrappedMolecular Ions with Zero BackgroundDetection
Joseph T. Khoury, Sandra E. Rodriguez-Cruz, and Joel H. ParksThe Rowland Institute for Science, Cambridge, Massachusetts, USA
Sensitive methods have been developed to measure laser-induced fluorescence from trappedions by reducing the detection of background scattering to zero levels during the laserexcitation pulse. The laser beam diameter has been reduced to �150 �m to eliminate scatteringon trap apertures and the resulting laser–ion interaction is limited to a volume of �10�5 cm3
which is �0.03–0.15 of the total ion cloud volume depending on experimental conditions. Thedetection optics collected fluorescence only from within the solid angle defined by laser–ioninteraction volume. Rhodamine 640 and Alexa Fluor 350 ions, commonly used as fluorescenceresonance energy transfer (FRET) fluorophores, were generated in the gas phase by usingelectrospray ionization and injected into a radiofrequency Paul trap where they were storedand exposed to Nd:YAG laser pulses at 532 and 355 nm for times up to 10 m. Fluorescenceemitted by these ions was investigated for several trap qz values and ion cloud temperatures.Analysis of photon statistics indicated an average of �10 photons were incident on the PMTdetector per 15 ns pulse for �103 trapped ions in the interaction volume. Fluorescencemeasurements displayed a dependence on trapped ion number which were consistent withcalculations of the space charge limited ion density. To investigate the quantitative capabilityof these fluorescence techniques, the laser-induced fragmentation of trapped Alexa Fluor 350ions was measured and compared with a rate equation model of the dynamics. Decay of thefluorescence signal as well as the parent ion number compared closely with quantitativepredictions of the photofragmentation model. (J Am Soc Mass Spectrom 2002, 13, 696–708) ©2002 American Society for Mass Spectrometry
Ion traps provide a controlled environment in whichfluorescence measurements can be performed on anensemble of ions over timescales sufficient to con-
sider small ion numbers and slow reaction rates. Laser-induced fluorescence measurements of trapped ionshave been used in spectroscopic studies of atomicstructure [1–4], the vibrational spectra of small mole-cules [5–8], as well as to characterize the dynamiccooling [9] and crystallization of atomic ions [10–12].
This paper introduces techniques that eliminate thedetection of laser background scattering on trap aper-tures and internal surfaces allowing measurements toachieve both high sensitivity and large dynamic range.In previous pulsed laser measurements of molecularfluorescence collected from trapped species (discussedin references [5–8]), the radiative lifetimes were suffi-ciently long to allow collection of fluorescence radiationafter the laser pulse. This greatly simplified methods toreduce the detection of background resulting fromscattered laser radiation. However, experiments de-
scribed in this paper apply the Nd:YAG pulsed laser toexcite strongly emitting molecules having fluorescencelifetimes shorter than the laser pulse. This required thereduction of background laser scattering during laserexcitation, a more demanding constraint.
Techniques described in this paper will help toextend fluorescence measurements as an in situ probeof trapped ion properties including chemical identity,the growth and decay of specific ion populations, ionspectroscopy. Fluorescence emission from trapped ionsalso present an opportunity to quantify conformationalchanges of biopolymer species in the gas phase [13]. Theextension of FRET, widely used in solution studies [14]to measure trapped biopolymer ions can provide thecapability to directly correlate changes in fluorescenceintensity with changes in the average conformation ofbiopolymer molecules. For example, FRET methodsmight be applied to further investigate gas phase dis-sociation dynamics of double strand oligonucleotideanions [15]. In this case, the rf trap offers a uniquecapability to correlate the in situ fluorescence data withion mass spectra which could lead to a new approach tostudy the intermediate states preceding dissociation ofthe double strand.
Fluorescence measurements were performed on
Published online April 23, 2002Address reprint requests to Dr. J. H. Parks, Rowland Institute for Science,100 Edwin H. Land Boulevard, Cambridge, MA 02142, USA. E-mail:[email protected]
© 2002 American Society for Mass Spectrometry. Published by Elsevier Science Inc. Received November 28, 20011044-0305/02/$20.00 Revised January 28, 2002PII S1044-0305(02)00364-1 Accepted January 28, 2002
Rhodamine 640 and Alexa Fluor 350 cations in an rfquadrupole trap. These molecules exhibit strong radia-tive transitions having short lifetimes of �f � 3 nscharacteristic of FRET candidate species. A pulsed lasersource was used to excite fluorescence in these experi-ments; however, the excitation/detection optical config-urations would be applicable for excitation by continu-ous sources as well. These experiments have achievedhigh sensitivity, zero background measurements offluorescence through a design of excitation and detec-tion optics configurations that optimized the laser-induced fluorescence from the trapped ion cloud. Mea-surements were conducted as a function of trapparameters and ion cloud temperature to understandthe fluorescence intensity dependence on ion number.In addition, the photofragmentation [16, 17] of AlexaFluor 350 ions was studied to evaluate the capability ofthese techniques to obtain quantitative measurementsof ion dynamics.
Experimental
ESI-rf Trap Instrumentation
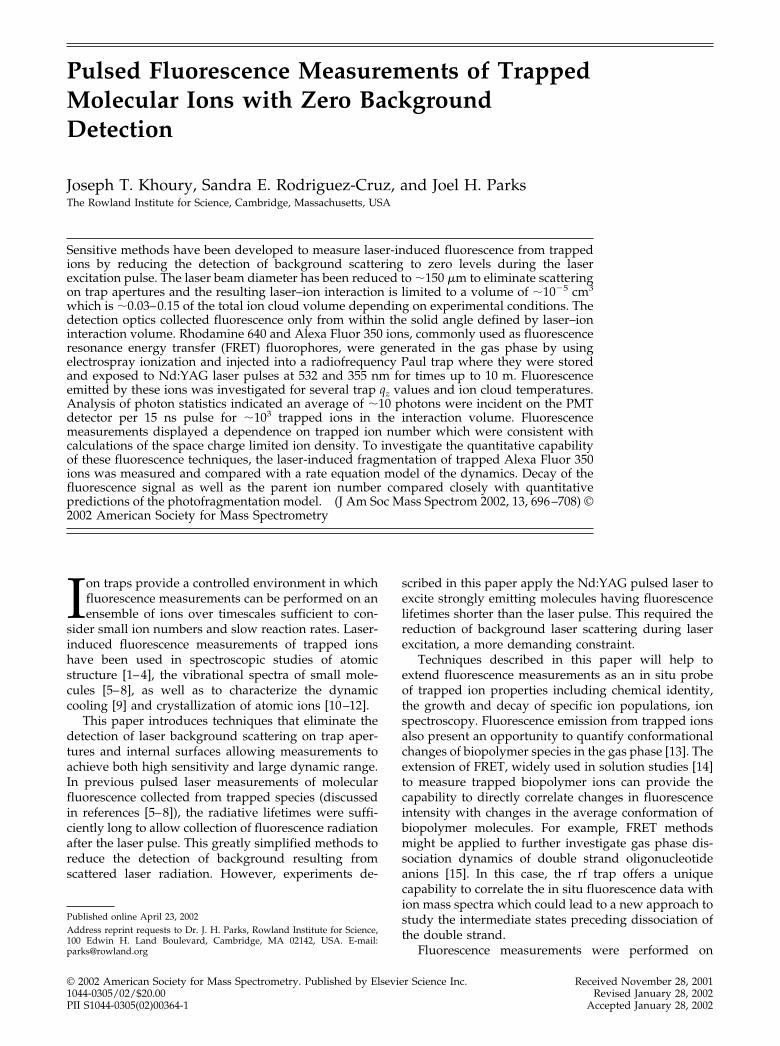
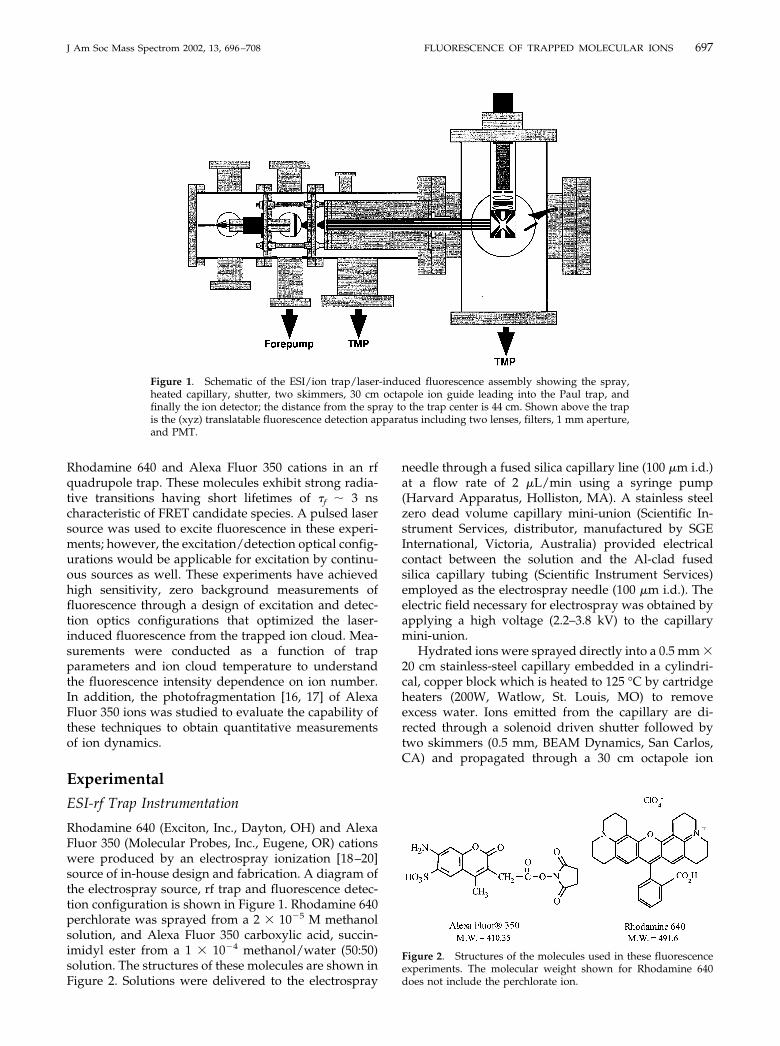
Rhodamine 640 (Exciton, Inc., Dayton, OH) and AlexaFluor 350 (Molecular Probes, Inc., Eugene, OR) cationswere produced by an electrospray ionization [18–20]source of in-house design and fabrication. A diagram ofthe electrospray source, rf trap and fluorescence detec-tion configuration is shown in Figure 1. Rhodamine 640perchlorate was sprayed from a 2 � 10�5 M methanolsolution, and Alexa Fluor 350 carboxylic acid, succin-imidyl ester from a 1 � 10�4 methanol/water (50:50)solution. The structures of these molecules are shown inFigure 2. Solutions were delivered to the electrospray
needle through a fused silica capillary line (100 �m i.d.)at a flow rate of 2 �L/min using a syringe pump(Harvard Apparatus, Holliston, MA). A stainless steelzero dead volume capillary mini-union (Scientific In-strument Services, distributor, manufactured by SGEInternational, Victoria, Australia) provided electricalcontact between the solution and the Al-clad fusedsilica capillary tubing (Scientific Instrument Services)employed as the electrospray needle (100 �m i.d.). Theelectric field necessary for electrospray was obtained byapplying a high voltage (2.2–3.8 kV) to the capillarymini-union.
Hydrated ions were sprayed directly into a 0.5 mm �20 cm stainless-steel capillary embedded in a cylindri-cal, copper block which is heated to 125 °C by cartridgeheaters (200W, Watlow, St. Louis, MO) to removeexcess water. Ions emitted from the capillary are di-rected through a solenoid driven shutter followed bytwo skimmers (0.5 mm, BEAM Dynamics, San Carlos,CA) and propagated through a 30 cm octapole ion
Figure 1. Schematic of the ESI/ion trap/laser-induced fluorescence assembly showing the spray,heated capillary, shutter, two skimmers, 30 cm octapole ion guide leading into the Paul trap, andfinally the ion detector; the distance from the spray to the trap center is 44 cm. Shown above the trapis the (xyz) translatable fluorescence detection apparatus including two lenses, filters, 1 mm aperture,and PMT.
Figure 2. Structures of the molecules used in these fluorescenceexperiments. The molecular weight shown for Rhodamine 640does not include the perchlorate ion.
697J Am Soc Mass Spectrom 2002, 13, 696–708 FLUORESCENCE OF TRAPPED MOLECULAR IONS
guide (r0 � 2.4 mm) to the grounded endcap electrodeof an rf ion trap assembly. Ions are injected through a1.2 mm diameter aperture in the end-cap. The volumeafter the capillary is pumped by a 10 L/s forepump(Leybold, Vacuum, Cologne, Germany) and a 170 L/sturbomolecular pump (Varian Vacuum Technologies,Torino, Italy) evacuates the volume between the skim-mers.
The rf ion trap [21] was designed and fabricatedin-house with an end-cap electrode spacing of 6 mm(z0 � 3 mm) and operates at an rf drive frequency of600 kHz. All experiments were performed without biasvoltage on the ring electrode (az � 0). The trap vacuumchamber is pumped by a 600 L/s turbomolecular pump(Pfeiffer Vacuum, Nashua, NH). Helium was admitteddirectly into the trap to maintain a constant chamberpressure of 5 � 10�6 torr during ion storage. The Hepressure was pulsed to 2 � 10�4 torr during ioninjection which varied between 0.25 s–5 s. The trapassembly and He background gas are both temperaturecontrolled to enable collisional cooling of the trappedions to �140 K and heating to �150 °C. After exposureto laser excitation, the mass spectrum and number ofthe stored ions was obtained by ejecting the ionsthrough the endcap electrode into an external dynodeelectron multiplier (model 7596M, KM Electronics,Tucker, GA). Electronics were designed to measure therate of ions detected which is then converted into thenumber of ions incident on the electron multiplierduring the ion ejection time. The number of trappedions are estimated to be a factor of �2 times the numberof detected ions. In these experiments the trapped ionnumber was varied over the range 103 � N � 6 � 104.Trap voltages required for ion manipulation and dataacquisition were controlled by LabView software (Na-tional Instruments Corp., Austin, TX).
The trapped ion cloud is excited with the higherharmonics of a pulsed Nd:YAG laser (�15 ns pulse-length, 10 Hz repetition rate) which have been gener-ated by a KD*P nonlinear crystal (Inrad, Northvale, NJ)at 532, 355, or 266 nm. The beam is spatially filtered byf � 3.2 cm lenses and a 50 �m pinhole before beingfocused to a waist size of �150 �m by a 50 cm focallength UV grade quartz lens. Since the Rayleigh range ismuch longer than the distance between ring apertures,the waist size closely estimates the interaction crosssection with the ion cloud. The overlap or interactionvolume of the focused laser beam and the ion cloud isestimated to be �3–15% of the total volume of the ioncloud depending on experimental conditions such asion cloud temperature, trap operating point (qz), andnumber of trapped ions.
The laser beam entered and exited the trap through1.2 mm apertures in the ring electrode and fluorescencewas detected at 90° to the beam axis. The laser polar-ization was maintained perpendicular to the detectionaxis for each harmonic used to optimize fluorescencedetection. Both the exit and entrance windows of thehigh-vacuum chamber were positioned at Brewster’s
angle to minimize reflections and scattering of laserlight into the detection solid angle. The window portswere also baffled to reduce the laser light scattered bythe last optical element from entering the chamber.Laser pulse energies of �3 �J (intensity of �1 MW/cm2) were used to excite ion fluorescence in theseexperiments. The fluorescence intensity was measuredfor each molecule as a function of laser intensity; andfor pulse energies �3 �J the fluorescence increasedapproximately linearly.
As shown in Figure 1, the fluorescence emission wascollected through a third 1.2 mm aperture in the ringelectrode by a pair of optical grade quartz lenses thatfocused the cloud emission on a 1 mm pinhole placed infront of the photomultiplier (R1463, Hamamatsu Pho-tonics, Hamamatsu, Japan). This arrangement imagedthe center of the ion cloud fluorescence on the detectionaperture which reduced the amount of scattered lightreaching the PMT which originated outside the laser–cloud interaction volume. The detection solid angle waslimited by the trap aperture to ��/4� � 5 � 10�3. Forlaser excitation of Rhodamine 640 at 532 nm and AlexaFluor350 at 355 nm, background scattering was furtherreduced by using two dielectric high reflectors having R� 99% at the laser wavelength, and several Schott glasslong-pass filters (OG550 and GG395 respectively) whichtransmit throughout the fluorescence bandwidth. Exci-tation at 355 nm required an additional dichroic long-pass filter (o.d. �6 at the laser wavelength). The choiceof bandpass filters used to isolate the fluorescence ofinterest requires an appreciation that the fluorescencecan blue shift in vacuum relative to solution measure-ments. In particular, this shift is considerable (�30 nm)for Xanthene dyes [22] and completely prevented theobservation of Rhodamine 6G fluorescence with a filterset based on solution wavelengths.
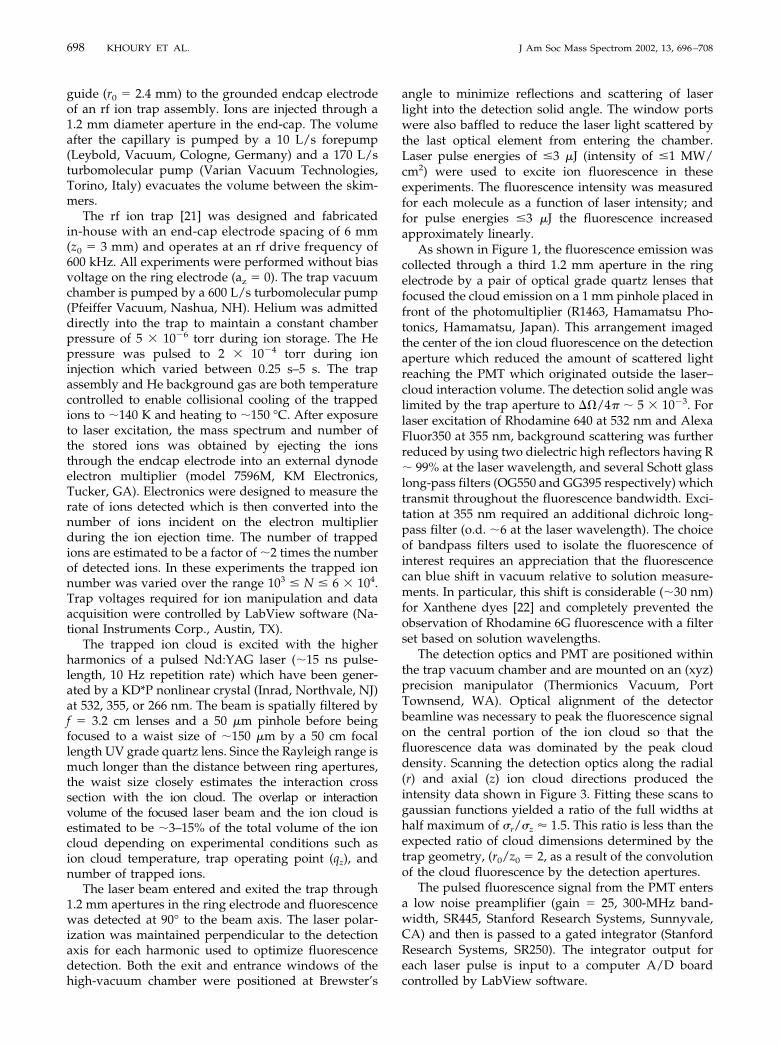
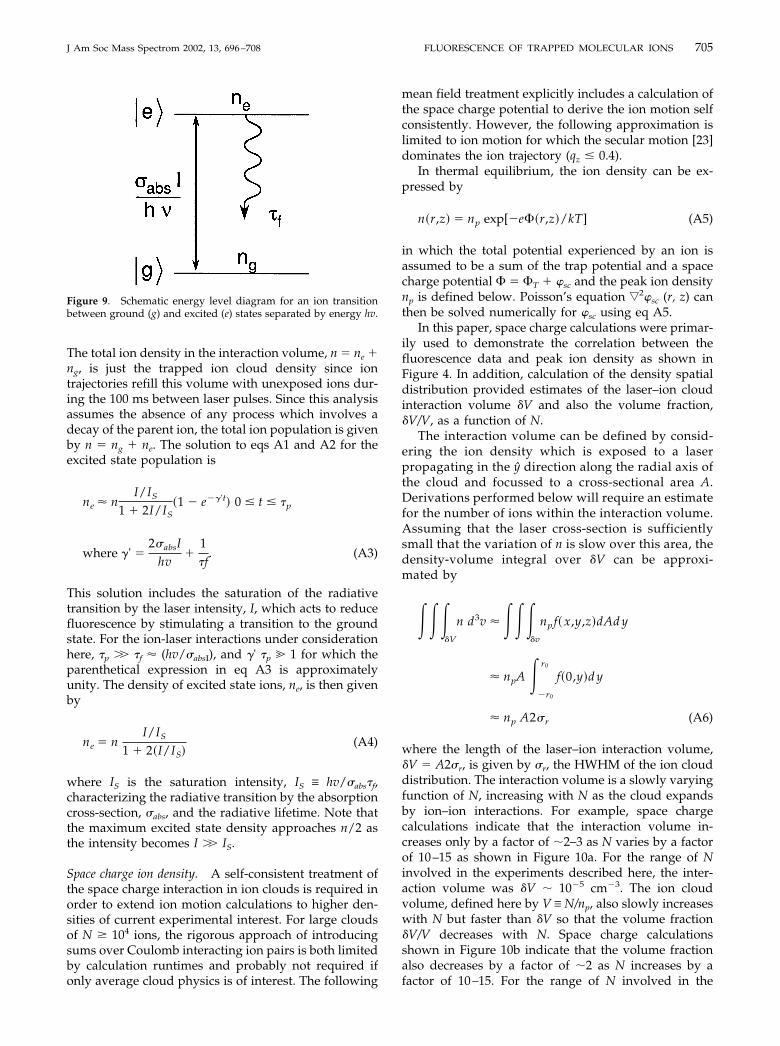
The detection optics and PMT are positioned withinthe trap vacuum chamber and are mounted on an (xyz)precision manipulator (Thermionics Vacuum, PortTownsend, WA). Optical alignment of the detectorbeamline was necessary to peak the fluorescence signalon the central portion of the ion cloud so that thefluorescence data was dominated by the peak clouddensity. Scanning the detection optics along the radial(r) and axial (z) ion cloud directions produced theintensity data shown in Figure 3. Fitting these scans togaussian functions yielded a ratio of the full widths athalf maximum of �r/�z � 1.5. This ratio is less than theexpected ratio of cloud dimensions determined by thetrap geometry, (r0/z0 � 2, as a result of the convolutionof the cloud fluorescence by the detection apertures.
The pulsed fluorescence signal from the PMT entersa low noise preamplifier (gain � 25, 300-MHz band-width, SR445, Stanford Research Systems, Sunnyvale,CA) and then is passed to a gated integrator (StanfordResearch Systems, SR250). The integrator output foreach laser pulse is input to a computer A/D boardcontrolled by LabView software.
698 KHOURY ET AL. J Am Soc Mass Spectrom 2002, 13, 696–708
Results and Discussion
Photon Statistics
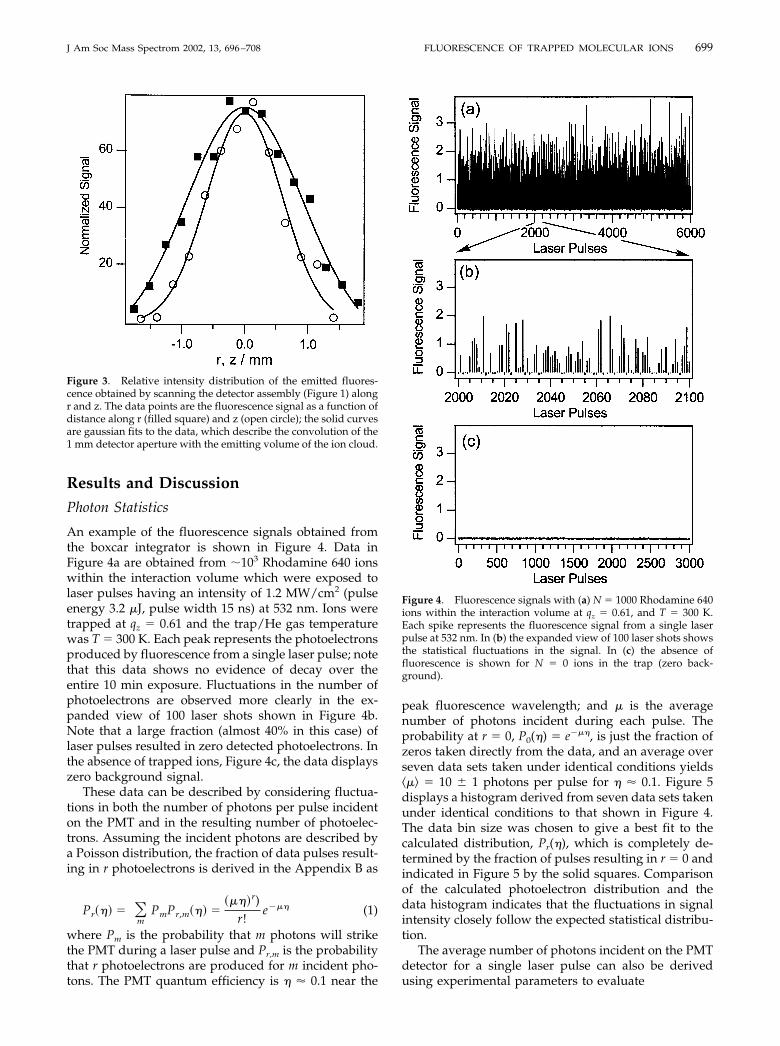
An example of the fluorescence signals obtained fromthe boxcar integrator is shown in Figure 4. Data inFigure 4a are obtained from �103 Rhodamine 640 ionswithin the interaction volume which were exposed tolaser pulses having an intensity of 1.2 MW/cm2 (pulseenergy 3.2 �J, pulse width 15 ns) at 532 nm. Ions weretrapped at qz � 0.61 and the trap/He gas temperaturewas T � 300 K. Each peak represents the photoelectronsproduced by fluorescence from a single laser pulse; notethat this data shows no evidence of decay over theentire 10 min exposure. Fluctuations in the number ofphotoelectrons are observed more clearly in the ex-panded view of 100 laser shots shown in Figure 4b.Note that a large fraction (almost 40% in this case) oflaser pulses resulted in zero detected photoelectrons. Inthe absence of trapped ions, Figure 4c, the data displayszero background signal.
These data can be described by considering fluctua-tions in both the number of photons per pulse incidenton the PMT and in the resulting number of photoelec-trons. Assuming the incident photons are described bya Poisson distribution, the fraction of data pulses result-ing in r photoelectrons is derived in the Appendix B as
Pr�� � �m
PmPr,m�� ����r)
r!e��� (1)
where Pm is the probability that m photons will strikethe PMT during a laser pulse and Pr,m is the probabilitythat r photoelectrons are produced for m incident pho-tons. The PMT quantum efficiency is � � 0.1 near the
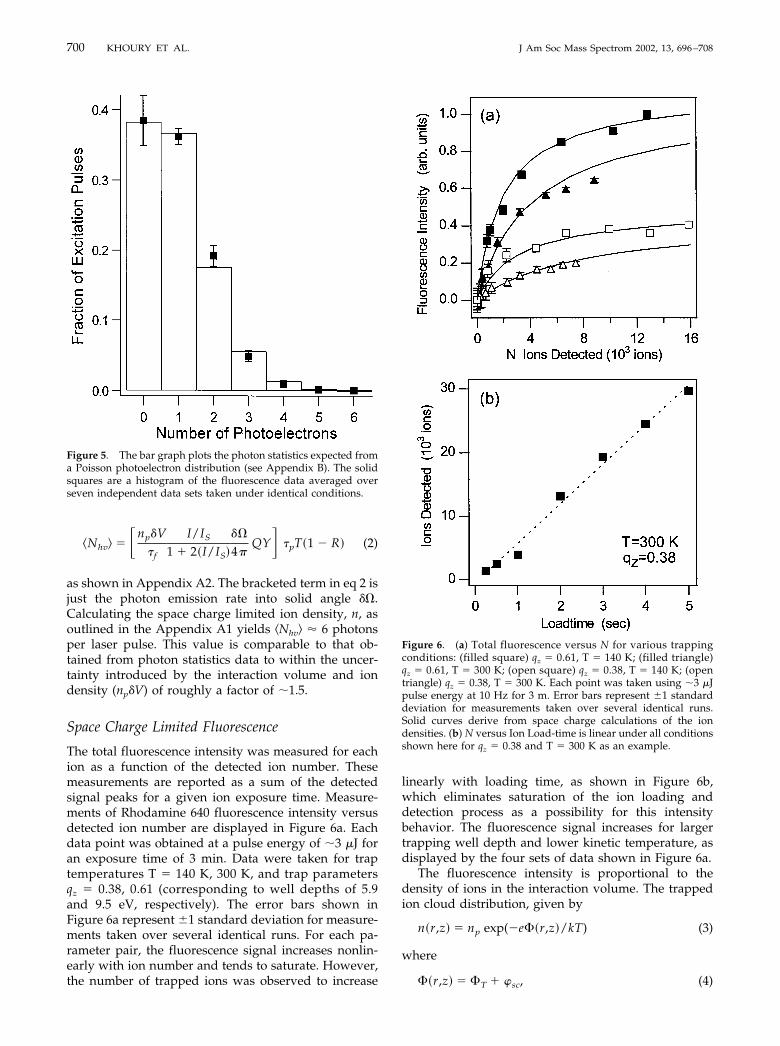
peak fluorescence wavelength; and � is the averagenumber of photons incident during each pulse. Theprobability at r � 0, P0(�) � e���, is just the fraction ofzeros taken directly from the data, and an average overseven data sets taken under identical conditions yields�� � 10 � 1 photons per pulse for � � 0.1. Figure 5displays a histogram derived from seven data sets takenunder identical conditions to that shown in Figure 4.The data bin size was chosen to give a best fit to thecalculated distribution, Pr(�), which is completely de-termined by the fraction of pulses resulting in r � 0 andindicated in Figure 5 by the solid squares. Comparisonof the calculated photoelectron distribution and thedata histogram indicates that the fluctuations in signalintensity closely follow the expected statistical distribu-tion.
The average number of photons incident on the PMTdetector for a single laser pulse can also be derivedusing experimental parameters to evaluate
Figure 3. Relative intensity distribution of the emitted fluores-cence obtained by scanning the detector assembly (Figure 1) alongr and z. The data points are the fluorescence signal as a function ofdistance along r (filled square) and z (open circle); the solid curvesare gaussian fits to the data, which describe the convolution of the1 mm detector aperture with the emitting volume of the ion cloud.
Figure 4. Fluorescence signals with (a) N � 1000 Rhodamine 640ions within the interaction volume at qz � 0.61, and T � 300 K.Each spike represents the fluorescence signal from a single laserpulse at 532 nm. In (b) the expanded view of 100 laser shots showsthe statistical fluctuations in the signal. In (c) the absence offluorescence is shown for N � 0 ions in the trap (zero back-ground).
699J Am Soc Mass Spectrom 2002, 13, 696–708 FLUORESCENCE OF TRAPPED MOLECULAR IONS
Nhv� � �np�V�f
I/IS
1 2�I/IS
��
4�QY� �pT�1 R (2)
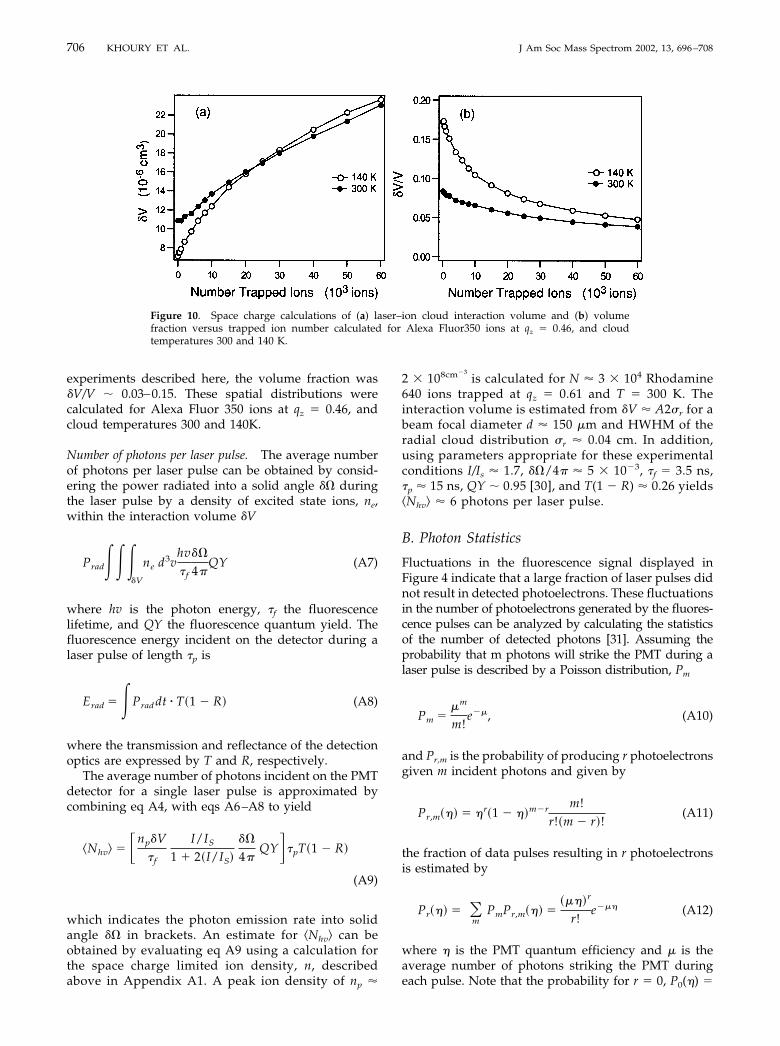
as shown in Appendix A2. The bracketed term in eq 2 isjust the photon emission rate into solid angle ��.Calculating the space charge limited ion density, n, asoutlined in the Appendix A1 yields Nhv� � 6 photonsper laser pulse. This value is comparable to that ob-tained from photon statistics data to within the uncer-tainty introduced by the interaction volume and iondensity (np�V) of roughly a factor of �1.5.
Space Charge Limited Fluorescence
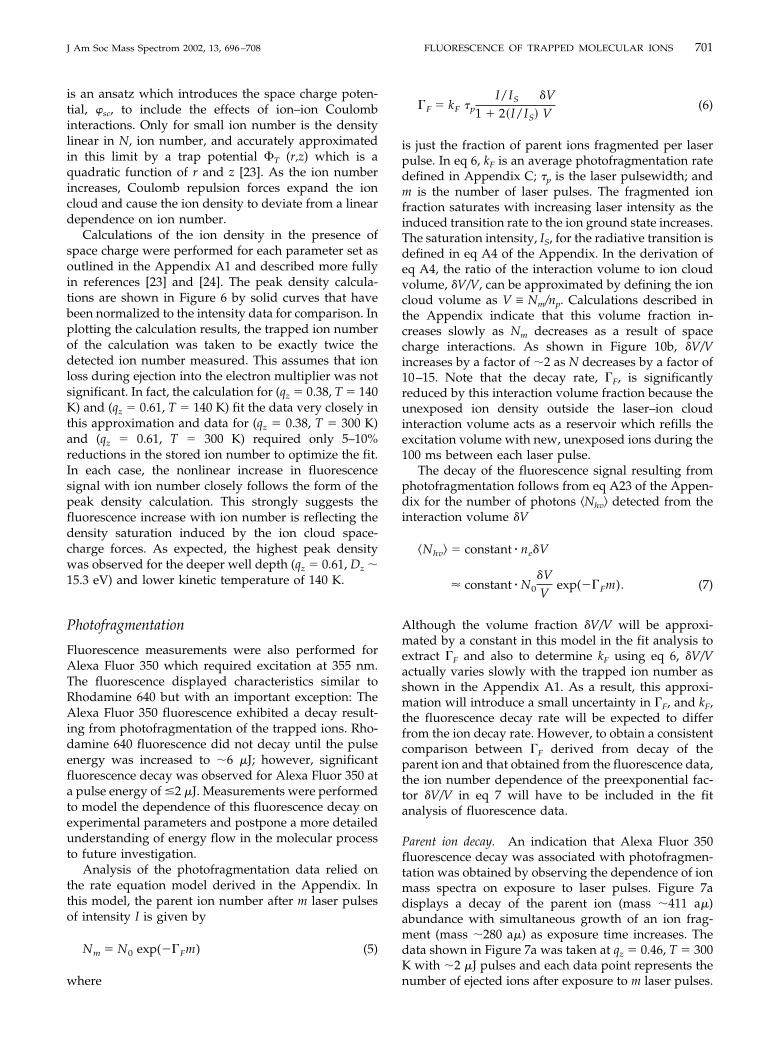
The total fluorescence intensity was measured for eachion as a function of the detected ion number. Thesemeasurements are reported as a sum of the detectedsignal peaks for a given ion exposure time. Measure-ments of Rhodamine 640 fluorescence intensity versusdetected ion number are displayed in Figure 6a. Eachdata point was obtained at a pulse energy of �3 �J foran exposure time of 3 min. Data were taken for traptemperatures T � 140 K, 300 K, and trap parametersqz � 0.38, 0.61 (corresponding to well depths of 5.9and 9.5 eV, respectively). The error bars shown inFigure 6a represent �1 standard deviation for measure-ments taken over several identical runs. For each pa-rameter pair, the fluorescence signal increases nonlin-early with ion number and tends to saturate. However,the number of trapped ions was observed to increase
linearly with loading time, as shown in Figure 6b,which eliminates saturation of the ion loading anddetection process as a possibility for this intensitybehavior. The fluorescence signal increases for largertrapping well depth and lower kinetic temperature, asdisplayed by the four sets of data shown in Figure 6a.
The fluorescence intensity is proportional to thedensity of ions in the interaction volume. The trappedion cloud distribution, given by
n�r,z � np exp(�e �r,z/kT) (3)
where
�r,z � T �sc, (4)
Figure 5. The bar graph plots the photon statistics expected froma Poisson photoelectron distribution (see Appendix B). The solidsquares are a histogram of the fluorescence data averaged overseven independent data sets taken under identical conditions.
Figure 6. (a) Total fluorescence versus N for various trappingconditions: (filled square) qz � 0.61, T � 140 K; (filled triangle)qz � 0.61, T � 300 K; (open square) qz � 0.38, T � 140 K; (opentriangle) qz � 0.38, T � 300 K. Each point was taken using �3 �Jpulse energy at 10 Hz for 3 m. Error bars represent �1 standarddeviation for measurements taken over several identical runs.Solid curves derive from space charge calculations of the iondensities. (b) N versus Ion Load-time is linear under all conditionsshown here for qz � 0.38 and T � 300 K as an example.
700 KHOURY ET AL. J Am Soc Mass Spectrom 2002, 13, 696–708
is an ansatz which introduces the space charge poten-tial, �sc, to include the effects of ion–ion Coulombinteractions. Only for small ion number is the densitylinear in N, ion number, and accurately approximatedin this limit by a trap potential T (r,z) which is aquadratic function of r and z [23]. As the ion numberincreases, Coulomb repulsion forces expand the ioncloud and cause the ion density to deviate from a lineardependence on ion number.
Calculations of the ion density in the presence ofspace charge were performed for each parameter set asoutlined in the Appendix A1 and described more fullyin references [23] and [24]. The peak density calcula-tions are shown in Figure 6 by solid curves that havebeen normalized to the intensity data for comparison. Inplotting the calculation results, the trapped ion numberof the calculation was taken to be exactly twice thedetected ion number measured. This assumes that ionloss during ejection into the electron multiplier was notsignificant. In fact, the calculation for (qz � 0.38, T � 140K) and (qz � 0.61, T � 140 K) fit the data very closely inthis approximation and data for (qz � 0.38, T � 300 K)and (qz � 0.61, T � 300 K) required only 5–10%reductions in the stored ion number to optimize the fit.In each case, the nonlinear increase in fluorescencesignal with ion number closely follows the form of thepeak density calculation. This strongly suggests thefluorescence increase with ion number is reflecting thedensity saturation induced by the ion cloud space-charge forces. As expected, the highest peak densitywas observed for the deeper well depth (qz � 0.61, Dz �15.3 eV) and lower kinetic temperature of 140 K.
Photofragmentation
Fluorescence measurements were also performed forAlexa Fluor 350 which required excitation at 355 nm.The fluorescence displayed characteristics similar toRhodamine 640 but with an important exception: TheAlexa Fluor 350 fluorescence exhibited a decay result-ing from photofragmentation of the trapped ions. Rho-damine 640 fluorescence did not decay until the pulseenergy was increased to �6 �J; however, significantfluorescence decay was observed for Alexa Fluor 350 ata pulse energy of �2 �J. Measurements were performedto model the dependence of this fluorescence decay onexperimental parameters and postpone a more detailedunderstanding of energy flow in the molecular processto future investigation.
Analysis of the photofragmentation data relied onthe rate equation model derived in the Appendix. Inthis model, the parent ion number after m laser pulsesof intensity I is given by
Nm � N0 exp(��Fm) (5)
where
�F � kF �p
I/IS
1 2�I/IS
�VV
(6)
is just the fraction of parent ions fragmented per laserpulse. In eq 6, kF is an average photofragmentation ratedefined in Appendix C; �p is the laser pulsewidth; andm is the number of laser pulses. The fragmented ionfraction saturates with increasing laser intensity as theinduced transition rate to the ion ground state increases.The saturation intensity, IS, for the radiative transition isdefined in eq A4 of the Appendix. In the derivation ofeq A4, the ratio of the interaction volume to ion cloudvolume, �V/V, can be approximated by defining the ioncloud volume as V § Nm/np. Calculations described inthe Appendix indicate that this volume fraction in-creases slowly as Nm decreases as a result of spacecharge interactions. As shown in Figure 10b, �V/Vincreases by a factor of �2 as N decreases by a factor of10–15. Note that the decay rate, �F, is significantlyreduced by this interaction volume fraction because theunexposed ion density outside the laser–ion cloudinteraction volume acts as a reservoir which refills theexcitation volume with new, unexposed ions during the100 ms between each laser pulse.
The decay of the fluorescence signal resulting fromphotofragmentation follows from eq A23 of the Appen-dix for the number of photons Nhv� detected from theinteraction volume �V
Nhv� � constant � ne�V
� constant � N0
�VV
exp(��Fm). (7)
Although the volume fraction �V/V will be approxi-mated by a constant in this model in the fit analysis toextract �F and also to determine kF using eq 6, �V/Vactually varies slowly with the trapped ion number asshown in the Appendix A1. As a result, this approxi-mation will introduce a small uncertainty in �F, and kF,the fluorescence decay rate will be expected to differfrom the ion decay rate. However, to obtain a consistentcomparison between �F derived from decay of theparent ion and that obtained from the fluorescence data,the ion number dependence of the preexponential fac-tor �V/V in eq 7 will have to be included in the fitanalysis of fluorescence data.
Parent ion decay. An indication that Alexa Fluor 350fluorescence decay was associated with photofragmen-tation was obtained by observing the dependence of ionmass spectra on exposure to laser pulses. Figure 7adisplays a decay of the parent ion (mass �411 a�)abundance with simultaneous growth of an ion frag-ment (mass �280 a�) as exposure time increases. Thedata shown in Figure 7a was taken at qz � 0.46, T � 300K with �2 �J pulses and each data point represents thenumber of ejected ions after exposure to m laser pulses.
701J Am Soc Mass Spectrom 2002, 13, 696–708 FLUORESCENCE OF TRAPPED MOLECULAR IONS
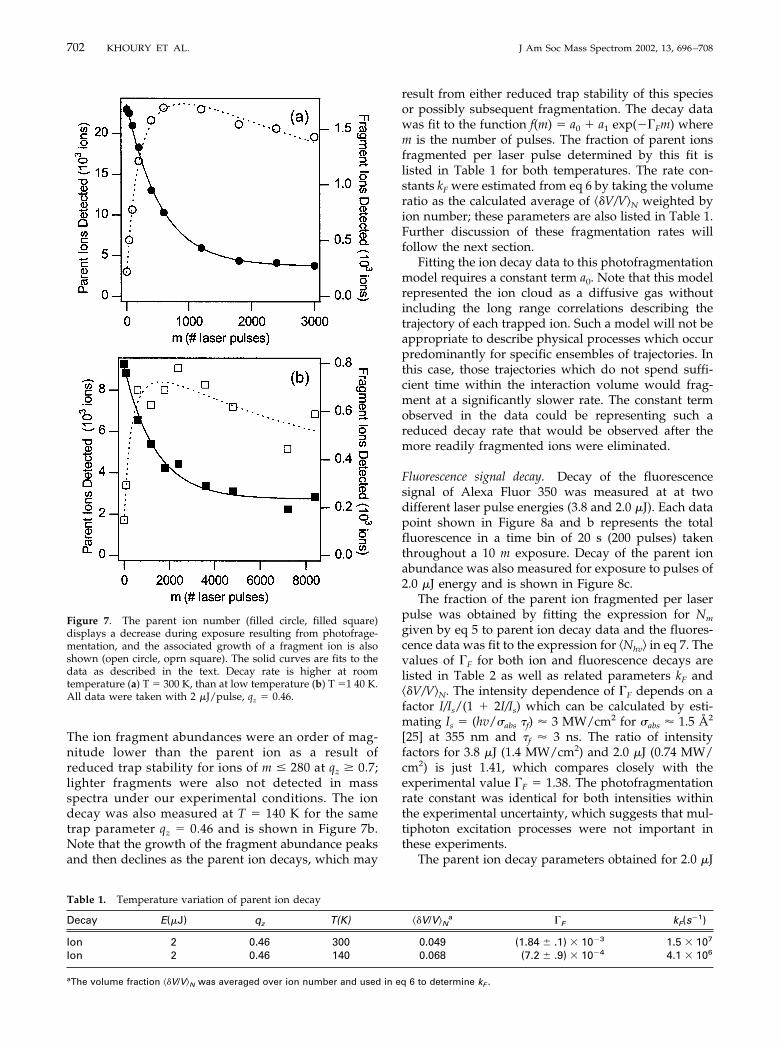
The ion fragment abundances were an order of mag-nitude lower than the parent ion as a result ofreduced trap stability for ions of m � 280 at qz � 0.7;lighter fragments were also not detected in massspectra under our experimental conditions. The iondecay was also measured at T � 140 K for the sametrap parameter qz � 0.46 and is shown in Figure 7b.Note that the growth of the fragment abundance peaksand then declines as the parent ion decays, which may
result from either reduced trap stability of this speciesor possibly subsequent fragmentation. The decay datawas fit to the function f(m) � a0 � a1 exp(��Fm) wherem is the number of pulses. The fraction of parent ionsfragmented per laser pulse determined by this fit islisted in Table 1 for both temperatures. The rate con-stants kF were estimated from eq 6 by taking the volumeratio as the calculated average of �V/V�N weighted byion number; these parameters are also listed in Table 1.Further discussion of these fragmentation rates willfollow the next section.
Fitting the ion decay data to this photofragmentationmodel requires a constant term a0. Note that this modelrepresented the ion cloud as a diffusive gas withoutincluding the long range correlations describing thetrajectory of each trapped ion. Such a model will not beappropriate to describe physical processes which occurpredominantly for specific ensembles of trajectories. Inthis case, those trajectories which do not spend suffi-cient time within the interaction volume would frag-ment at a significantly slower rate. The constant termobserved in the data could be representing such areduced decay rate that would be observed after themore readily fragmented ions were eliminated.
Fluorescence signal decay. Decay of the fluorescencesignal of Alexa Fluor 350 was measured at at twodifferent laser pulse energies (3.8 and 2.0 �J). Each datapoint shown in Figure 8a and b represents the totalfluorescence in a time bin of 20 s (200 pulses) takenthroughout a 10 m exposure. Decay of the parent ionabundance was also measured for exposure to pulses of2.0 �J energy and is shown in Figure 8c.
The fraction of the parent ion fragmented per laserpulse was obtained by fitting the expression for Nm
given by eq 5 to parent ion decay data and the fluores-cence data was fit to the expression for Nhv� in eq 7. Thevalues of �F for both ion and fluorescence decays arelisted in Table 2 as well as related parameters kF and�V/V�N. The intensity dependence of �F depends on afactor I/Is/(1 � 2I/Is) which can be calculated by esti-mating Is � (hv/�abs �f) � 3 MW/cm2 for �abs � 1.5 Å2
[25] at 355 nm and �f � 3 ns. The ratio of intensityfactors for 3.8 �J (1.4 MW/cm2) and 2.0 �J (0.74 MW/cm2) is just 1.41, which compares closely with theexperimental value �F � 1.38. The photofragmentationrate constant was identical for both intensities withinthe experimental uncertainty, which suggests that mul-tiphoton excitation processes were not important inthese experiments.
The parent ion decay parameters obtained for 2.0 �J
Figure 7. The parent ion number (filled circle, filled square)displays a decrease during exposure resulting from photofrage-mentation, and the associated growth of a fragment ion is alsoshown (open circle, oprn square). The solid curves are fits to thedata as described in the text. Decay rate is higher at roomtemperature (a) T � 300 K, than at low temperature (b) T �1 40 K.All data were taken with 2 �J/pulse, qz � 0.46.
Table 1. Temperature variation of parent ion decay
Decay E(�J) qz T(K) �V/V�Na �F kF(s�1)
Ion 2 0.46 300 0.049 (1.84 � .1) � 10�3 1.5 � 107
Ion 2 0.46 140 0.068 (7.2 � .9) � 10�4 4.1 � 106
aThe volume fraction �V/V�N was averaged over ion number and used in eq 6 to determine kF .
702 KHOURY ET AL. J Am Soc Mass Spectrom 2002, 13, 696–708
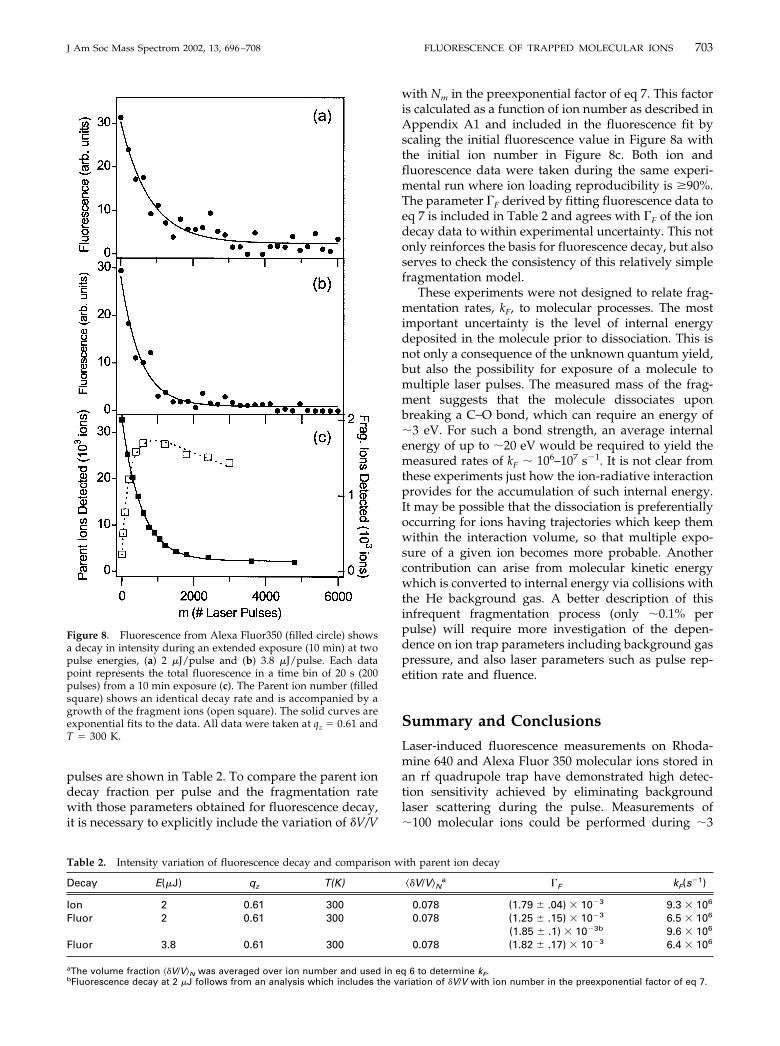
pulses are shown in Table 2. To compare the parent iondecay fraction per pulse and the fragmentation ratewith those parameters obtained for fluorescence decay,it is necessary to explicitly include the variation of �V/V
with Nm in the preexponential factor of eq 7. This factoris calculated as a function of ion number as described inAppendix A1 and included in the fluorescence fit byscaling the initial fluorescence value in Figure 8a withthe initial ion number in Figure 8c. Both ion andfluorescence data were taken during the same experi-mental run where ion loading reproducibility is �90%.The parameter �F derived by fitting fluorescence data toeq 7 is included in Table 2 and agrees with �F of the iondecay data to within experimental uncertainty. This notonly reinforces the basis for fluorescence decay, but alsoserves to check the consistency of this relatively simplefragmentation model.
These experiments were not designed to relate frag-mentation rates, kF, to molecular processes. The mostimportant uncertainty is the level of internal energydeposited in the molecule prior to dissociation. This isnot only a consequence of the unknown quantum yield,but also the possibility for exposure of a molecule tomultiple laser pulses. The measured mass of the frag-ment suggests that the molecule dissociates uponbreaking a C™O bond, which can require an energy of�3 eV. For such a bond strength, an average internalenergy of up to �20 eV would be required to yield themeasured rates of kF � 106–107 s�1. It is not clear fromthese experiments just how the ion-radiative interactionprovides for the accumulation of such internal energy.It may be possible that the dissociation is preferentiallyoccurring for ions having trajectories which keep themwithin the interaction volume, so that multiple expo-sure of a given ion becomes more probable. Anothercontribution can arise from molecular kinetic energywhich is converted to internal energy via collisions withthe He background gas. A better description of thisinfrequent fragmentation process (only �0.1% perpulse) will require more investigation of the depen-dence on ion trap parameters including background gaspressure, and also laser parameters such as pulse rep-etition rate and fluence.
Summary and Conclusions
Laser-induced fluorescence measurements on Rhoda-mine 640 and Alexa Fluor 350 molecular ions stored inan rf quadrupole trap have demonstrated high detec-tion sensitivity achieved by eliminating backgroundlaser scattering during the pulse. Measurements of�100 molecular ions could be performed during �3
Figure 8. Fluorescence from Alexa Fluor350 (filled circle) showsa decay in intensity during an extended exposure (10 min) at twopulse energies, (a) 2 �J/pulse and (b) 3.8 �J/pulse. Each datapoint represents the total fluorescence in a time bin of 20 s (200pulses) from a 10 min exposure (c). The Parent ion number (filledsquare) shows an identical decay rate and is accompanied by agrowth of the fragment ions (open square). The solid curves areexponential fits to the data. All data were taken at qz � 0.61 andT � 300 K.
Table 2. Intensity variation of fluorescence decay and comparison with parent ion decay
Decay E(�J) qz T(K) �V/V�Na �F kF(s�1)
Ion 2 0.61 300 0.078 (1.79 � .04) � 10�3 9.3 � 106
Fluor 2 0.61 300 0.078 (1.25 � .15) � 10�3 6.5 � 106
(1.85 � .1) � 10�3b 9.6 � 106
Fluor 3.8 0.61 300 0.078 (1.82 � .17) � 10�3 6.4 � 106
aThe volume fraction �V/V�N was averaged over ion number and used in eq 6 to determine kF.bFluorescence decay at 2 �J follows from an analysis which includes the variation of �V/V with ion number in the preexponential factor of eq 7.
703J Am Soc Mass Spectrom 2002, 13, 696–708 FLUORESCENCE OF TRAPPED MOLECULAR IONS
min exposures. Photon statistics were determined froman analysis of 10 m exposures of �1000 ions within theion cloud volume overlapped by the laser beam. Thisanalysis indicated that under these conditions, an aver-age of �10 photons were incident on the PMT duringeach 15 ns laser pulse. This result was consistent withan estimate of the detected fluorescence from theknown radiative parameters, solid angle and interactionvolume.
The variation of fluorescence intensity with trappedion number clearly displayed a nonlinear dependencethat was consistent with saturation of the ion density asa result of space charge electrostatic repulsion. Scanningthe detection optics across the trap output apertureprovided a method to optimize the detected signalalong both cloud directions. As a result, the fluores-cence intensities obtained were sensitive to the peak ioncloud density. The ion density was calculated self-consistently within a mean field approximation andthese calculations accurately reproduce the ion numberdependence exhibited by the fluorescence data taken atdifferent trap well depths and ion kinetic temperatures.These experimental trap parameters, together with ionnumber, characterized the competition between thetrapping potential and the space charge potential whichdetermines the cloud density.
Photofragmentation of Alexa Fluor 350 was mea-sured by the decay of fluorescence emission and also bythe decay of the parent ion number at different temper-atures and trapping parameters. The data were fit to arate equation model that accounted for the small inter-action volume within a reservoir of unexposed mole-cules. These data were described remarkably well bythe dynamic processes incorporated in the model anddemonstrate the quantitative capability of these fluores-cence techniques when the effects of space chargeeffects are accounted for.
In summary, these fluorescence measurements pre-sented clear evidence of emission from an ion cloudhaving a space charge limited density. Aside from thisimportant characteristic, fluorescence measurementswere straightforward and readily interpreted. Theseresults suggest that the techniques described here willbe useful to apply fluorescence measurements as an insitu probe of trapped ion properties including speciesidentity, ion spectroscopy, and the growth and decaydynamics of specific ion populations. We have recentlystarted experiments to monitor changes in the confor-mation of biopolymer ions by measuring the FRETbetween fluorophores attached to the ends of a DNAdouble strand. These experiments will measure thecorrelation between in situ fluorescence data and ionmass spectra as a function of temperature to investigateintermediate states leading to dissociation of the doublestrand.
Improvements of the detection optical configurationwill replace glass filters by dielectric filters (ChromaTechnology Corp., Brattleboro, VT) which attenuate byo.d. 6 at the laser wavelength. In addition, the lens
system will be changed to a confocal design that willgreatly reduce aberration losses at the PMT aperture.Various different trap technologies are also being con-sidered. Fluorescence detection of ions stored in a linearquadrupole [26] would reduce the laser scattering fromtrap electrodes yet provide fluorescence collection froma larger laser–cloud interaction volume. Cylindrical iontraps [27, 28] offer the possibility to detect through aring electrode formed from highly transparent (�80%)Ni screen. This design would also provide fluorescencecollection from a significantly greater solid angle asshown in reference [29] and increase the trap dimen-sions to reduce laser background scattering.
AcknowledgmentsThis work is supported by The Rowland Institute for Science. Theauthors acknowledge helpful discussions with Dr. James Foley,Dr. Detlef Schooss, and Dr. Michael Burns and thank Dr. StefanKruckeberg for helping with the data acquisition software.
Appendix: Fluorescence Analysisfor Trapped Ions
A. Fluorescence from Space Charge LimitedIon Density
The following fluorescence model is derived under theassumption that the ion cloud can be represented as adiffusive gas without including the long range correla-tions describing the trajectory of each trapped ion. Thismodel will not be appropriate to describe physicalprocesses which occur predominantly for specific en-sembles of trajectories. For example, measurements ofthe photofragmentation of trapped ions will probe onlythose ions which have trajectories which spend suffi-cient time within the laser–ion cloud interaction vol-ume. As will be shown below, such considerations canbe important for interpretation of photofragmentationdata.
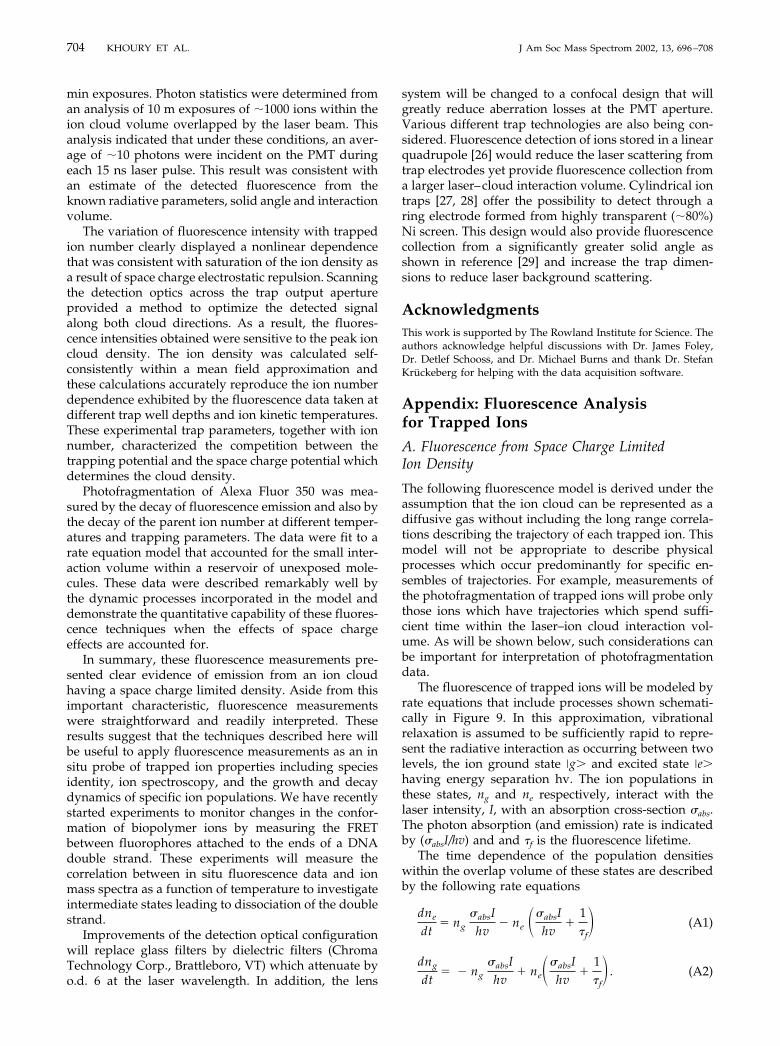
The fluorescence of trapped ions will be modeled byrate equations that include processes shown schemati-cally in Figure 9. In this approximation, vibrationalrelaxation is assumed to be sufficiently rapid to repre-sent the radiative interaction as occurring between twolevels, the ion ground state �g� and excited state �e�having energy separation hv. The ion populations inthese states, ng and ne respectively, interact with thelaser intensity, I, with an absorption cross-section �abs.The photon absorption (and emission) rate is indicatedby (�absI/hv) and and �f is the fluorescence lifetime.
The time dependence of the population densitieswithin the overlap volume of these states are describedby the following rate equations
dne
dt� ng
�absIhv
ne ��absIhv
1�f� (A1)
dng
dt� ng
�absIhv
ne��absIhv
1�f� . (A2)
704 KHOURY ET AL. J Am Soc Mass Spectrom 2002, 13, 696–708
The total ion density in the interaction volume, n � ne �ng, is just the trapped ion cloud density since iontrajectories refill this volume with unexposed ions dur-ing the 100 ms between laser pulses. Since this analysisassumes the absence of any process which involves adecay of the parent ion, the total ion population is givenby n � ng � ne. The solution to eqs A1 and A2 for theexcited state population is
ne � nI/IS
1 2I/IS�1 e� 't 0 � t � �p
where ' �2�absI
hv
1�f
. (A3)
This solution includes the saturation of the radiativetransition by the laser intensity, I, which acts to reducefluorescence by stimulating a transition to the groundstate. For the ion-laser interactions under considerationhere, �p �� �f � (hv/�absI), and ' �p � 1 for which theparenthetical expression in eq A3 is approximatelyunity. The density of excited state ions, ne, is then givenby
ne � nI/IS
1 2�I/IS(A4)
where IS is the saturation intensity, IS § hv/�abs�f,characterizing the radiative transition by the absorptioncross-section, �abs, and the radiative lifetime. Note thatthe maximum excited state density approaches n/2 asthe intensity becomes I �� IS.
Space charge ion density. A self-consistent treatment ofthe space charge interaction in ion clouds is required inorder to extend ion motion calculations to higher den-sities of current experimental interest. For large cloudsof N � 104 ions, the rigorous approach of introducingsums over Coulomb interacting ion pairs is both limitedby calculation runtimes and probably not required ifonly average cloud physics is of interest. The following
mean field treatment explicitly includes a calculation ofthe space charge potential to derive the ion motion selfconsistently. However, the following approximation islimited to ion motion for which the secular motion [23]dominates the ion trajectory (qz � 0.4).
In thermal equilibrium, the ion density can be ex-pressed by
n�r,z � np exp[�e �r,z/kT] (A5)
in which the total potential experienced by an ion isassumed to be a sum of the trap potential and a spacecharge potential � T � �sc and the peak ion densitynp is defined below. Poisson’s equation ƒ2�sc (r, z) canthen be solved numerically for �sc using eq A5.
In this paper, space charge calculations were primar-ily used to demonstrate the correlation between thefluorescence data and peak ion density as shown inFigure 4. In addition, calculation of the density spatialdistribution provided estimates of the laser–ion cloudinteraction volume �V and also the volume fraction,�V/V, as a function of N.
The interaction volume can be defined by consid-ering the ion density which is exposed to a laserpropagating in the y direction along the radial axis ofthe cloud and focussed to a cross-sectional area A.Derivations performed below will require an estimatefor the number of ions within the interaction volume.Assuming that the laser cross-section is sufficientlysmall that the variation of n is slow over this area, thedensity-volume integral over �V can be approxi-mated by
����V
n d3v � ����v
np f� x,y,zdAd y
� npA ��r0
r0
f�0,yd y
� np A2�r (A6)
where the length of the laser–ion interaction volume,�V � A2�r, is given by �r, the HWHM of the ion clouddistribution. The interaction volume is a slowly varyingfunction of N, increasing with N as the cloud expandsby ion–ion interactions. For example, space chargecalculations indicate that the interaction volume in-creases only by a factor of �2–3 as N varies by a factorof 10–15 as shown in Figure 10a. For the range of Ninvolved in the experiments described here, the inter-action volume was �V � 10�5 cm�3. The ion cloudvolume, defined here by V § N/np, also slowly increaseswith N but faster than �V so that the volume fraction�V/V decreases with N. Space charge calculationsshown in Figure 10b indicate that the volume fractionalso decreases by a factor of �2 as N increases by afactor of 10–15. For the range of N involved in the
Figure 9. Schematic energy level diagram for an ion transitionbetween ground (g) and excited (e) states separated by energy hv.
705J Am Soc Mass Spectrom 2002, 13, 696–708 FLUORESCENCE OF TRAPPED MOLECULAR IONS
experiments described here, the volume fraction was�V/V � 0.03–0.15. These spatial distributions werecalculated for Alexa Fluor 350 ions at qz � 0.46, andcloud temperatures 300 and 140K.
Number of photons per laser pulse. The average numberof photons per laser pulse can be obtained by consid-ering the power radiated into a solid angle �� duringthe laser pulse by a density of excited state ions, ne,within the interaction volume �V
Prad����V
ne d3vhv�f
��
4�QY (A7)
where hv is the photon energy, �f the fluorescencelifetime, and QY the fluorescence quantum yield. Thefluorescence energy incident on the detector during alaser pulse of length �p is
Erad � �Prad dt � T�1 R (A8)
where the transmission and reflectance of the detectionoptics are expressed by T and R, respectively.
The average number of photons incident on the PMTdetector for a single laser pulse is approximated bycombining eq A4, with eqs A6–A8 to yield
Nhv� � �np�V�f
I/IS
1 2�I/IS
��
4�QY��pT�1 R
(A9)
which indicates the photon emission rate into solidangle �� in brackets. An estimate for Nhv� can beobtained by evaluating eq A9 using a calculation forthe space charge limited ion density, n, describedabove in Appendix A1. A peak ion density of np �
2 � 108cm�3is calculated for N � 3 � 104 Rhodamine
640 ions trapped at qz � 0.61 and T � 300 K. Theinteraction volume is estimated from �V � A2�r for abeam focal diameter d � 150 �m and HWHM of theradial cloud distribution �r � 0.04 cm. In addition,using parameters appropriate for these experimentalconditions I/Is � 1.7, ��/4� � 5 � 10�3, �f � 3.5 ns,�p � 15 ns, QY � 0.95 [30], and T(1 � R) � 0.26 yieldsNhv� � 6 photons per laser pulse.
B. Photon Statistics
Fluctuations in the fluorescence signal displayed inFigure 4 indicate that a large fraction of laser pulses didnot result in detected photoelectrons. These fluctuationsin the number of photoelectrons generated by the fluores-cence pulses can be analyzed by calculating the statisticsof the number of detected photons [31]. Assuming theprobability that m photons will strike the PMT during alaser pulse is described by a Poisson distribution, Pm
Pm ��m
m!e��, (A10)
and Pr,m is the probability of producing r photoelectronsgiven m incident photons and given by
Pr,m�� � �r�1 �m�r m!r!�m r!
(A11)
the fraction of data pulses resulting in r photoelectronsis estimated by
Pr�� � �m
PmPr,m�� ����r
r!e��� (A12)
where � is the PMT quantum efficiency and � is theaverage number of photons striking the PMT duringeach pulse. Note that the probability for r � 0, P0(�) �
Figure 10. Space charge calculations of (a) laser–ion cloud interaction volume and (b) volumefraction versus trapped ion number calculated for Alexa Fluor350 ions at qz � 0.46, and cloudtemperatures 300 and 140 K.
706 KHOURY ET AL. J Am Soc Mass Spectrom 2002, 13, 696–708
e���, is directly determined from the fraction of zeroamplitude pulses ocurring in the data. For the exampleshown in Figure 4, P0(�) � 0.38, and this yields anaverage number of photons per pulse incident on thePMT, of � � 10 photons for � � 0.1 at the fluorescencepeak of Rhodamine 640. Having determined the prod-uct ��, the photoelectron distribution Pr(�) can becalculated as a function of photoelectron number and isshown in Figure 5.
C. Reservoir Photofragmentation Model
The following model is derived under the assumptionthat the ion cloud can be represented as a diffusive gaswithout including the long range correlations describ-ing the trajectory of each trapped ion. This model willnot be appropriate to describe physical processes whichoccur predominantly for specific ensembles of trajecto-ries. The photofragmentation of trapped ions will bemodeled by rate equations that include the processesshown schematically in Figure10 but including an ad-ditional excited state decay channel characterizing pho-tofragmentation with a rate kF. Although this rateusually characterizes a unimolecular dissociation pro-cess following the deposition of a known energy intothe internal degrees of freedom, we use this rate here todescribe an average dissociation rate which depends onthe laser parameters and also the ion trap parameters.
In the prescence of photofragmentation, the timedependence of the population densities within theoverlap volume are described by the following rateequations
dne
dt� ng
�absIhv
ne��absIhv
1�f
kF� (A13)
dng
dt� ng
�absIhv
ne ��absIhv
1�f� . (A14)
Ion trajectories refill the overlap region in a time (�10�s) short compared to the 100 ms between laser pulses.In addition, the fragment ions do not contribute to thetrapped ion density since they are unstable under ouroperating conditions. As a result, the total ion density,n(t) � ne � ng, within the interaction volume is equal tothe trapped density at any time. Although the rates ofchange of ne and ng are dominated by radiative rates,(�abs I/hv) �� kF, photofragmentation accounts for theslow decay the trapped density
dndt
�dne
dt
dng
dt��kFne. (A15)
A solution for ne is obtained from eq A13 by substitut-ing Ng � n � ne and assuming that n is approximatelyconstant during the radiative interaction. The solutionfor the excited state population is
ne � nI/IS
1 2�I/IS�1 e� 't 0 � t � �p (A16)
where ' � 2�absIhv � 1�f � kF . For the ion–laserinteractions under consideration here, �p �� �f � (hv/�absI), and 'p �� 1 for which the final parentheticalexpression in eq A16 is approximately unity.
To consider the rate of change of the total number oftrapped parent ions, N, it will be necessary to consideronly those ions in the interaction volume given by thevolume integrals
dNdt
�ddt ���n d3v � �kF ���
�V
ne�Nd3v. (A17)
The last integral is limited to the interaction volumesince the excited state ions will decay (�f � 3 ns) beforetheir trajectories leave this volume. Expressing thedensity of excited state ions, ne, by eq A16 yields thechange in ion number caused by the mth laser pulse
�N � Nm�1 Nm
� �kF
I/IS
1 2�I/IS�p ���
�V
n�Nmd3v. (A18)
The laser–ion interaction volume is sufficiently smallthat the variation of n(Nm) is slow over �V and thevolume integral in eq A18 can be approximated similarto eq A6 as
����V
n d3v � np �V � Nm
�VV
(A19)
where the interaction volume and the ion cloud volumeare defined above. In this approximation, the differenceequation governing the ion decay for �m � 1
�N � Nm�1 Nm � �kF
I/IS
1 2�I/IS�p Nm
�VV
(A20)
characterizes an exponential decay of the parent iongiven by
Nm � N0 exp(��Fm) (A21)
where
�F � kF�p
I/IS
1 2�I/IS
�VV
(A22)
is just the fraction of the parent ion fragmented per laserpulse. For experiments described here, �F � 10�3 de-
707J Am Soc Mass Spectrom 2002, 13, 696–708 FLUORESCENCE OF TRAPPED MOLECULAR IONS
pending on trapping parameters and ion cloud temper-ature.
The decay of the fluorescence signal resulting fromphotofragmentation follows from eq A9 giving thenumber of photons detected from the interaction vol-ume �V
Nhv� � constant � ne�V � constant � Nm
�VV
. (A23)
The decay of the fluorescence is then given by
Nhv� � constant � N0
�VV
exp(��Fm). (A24)
In order to extract the decay parameter �F by fittingdata with eqs A21 and A24, the volume fraction �V/Vwill be approximated by a constant average value. Sincethe volume fraction increases slowly as the trapped ionnumber decreases as shown above in Figure 10b, thisapproximation will introduce a small uncertainty in �F.However, to obtain a consistent comparison between �F
derived from decay of the parent ion and that obtainedfrom the fluorescence data, the ion number dependenceof the preexponential factor �V/V in eq A24 will have tobe included in fitting fluorescence data.
References1. Bialas, J.; Blatt, R.; Neuhauser, W.; Toschek, P. E. Ultrasensi-
tive Detection of Light Absorption by Few Ions. Opt. Commun.1986, 59, 27–30.
2. Bergquist, J. C.; Wineland, D. J.; Itano, W. M.; Hemmati, H.;Daniel, H.-U.; Leuchs, G. Energy and Radiative Lifetime of the5d96s2 2D5/2 state in Hg ii by Doppler-Free Two-Photon LaserSpectroscopy. Phys. Rev. Lett. 1985, 55, 1567–1570.
3. Plumelle, F.; Desaintfuscien, M.; Duchene, J. L.; Audoin, C.Laser Probing of Ions Confined in a Cylindrical Radiofre-quency Trap. Opt. Commun. 1980, 34, 71–76.
4. Blatt, R.; Werth, G. Precision Determination of the Ground-State Hyperfine Splitting in 137Ba� Using the Ion-StorageTechnique. Phys. Rev. 1982, A25, 1476–1482.
5. Danon, J.; Mauclaire, G.; Govers, T. R.; Marx, R. Laser InducedFluorescence of Ions Trapped in an Ion Cyclotron ResonanceCell: Excitation of CO� �2�, �� � 0 and relaxation of CO22 A2�,�' � 1. J. Chem. Phys. 1982, 76, 1255–1262.
6. Grieman, F. J.; Mahan, B. H.; O’Keefe, A. The Laser InducedFluorescence Spectrum of Trapped CD�. J. Chem. Phys. 1980,72, 4246–4247.
7. Martner, C. C.; Pfaff, J.; Rosenbaum, N. H.; O’Keefe, A.;Saykally, R. J. Radiative Lifetimes of Trapped Molecular Ions:HCl� and HBr�. J. Chem. Phys. 1983, 78, 7073–7076.
8. Wang, Y.; Hendrickson, C. L.; Marshall, A. G. Direct OpticalSpectroscopy of Gas-Phase Molecular Ions Trapped and Mass-Selected by Ion Cyclotron Resonance: Laser-Induced Fluores-cence Excitation Spectrum of Hexafluorobenzene (C6F6
�).Chem. Phys. Lett. 2001, 334, 69–75.
9. Neuhauser, W.; Hohenstatt, M.; Toschek, P.; Dehmelt, H.Optical-Sideband Cooling of Visible Atom Cloud Confined inParabolic Well. Phys. Rev. Lett. 1978, 41, 233–236.
10. Diedrich, F.; Peik, E.; Chen, J. M.; Quint, W.; Walther, H.Observation of a Phase Transition of Stored Laser-CooledIons. Phys. Rev. Lett. 1987, 59, 2931–2934.
11. Wineland, D. J.; Bergquist, J. C.; Itano, W. M.; Bollinger, J. J.;Manney, C. H. Atomic Ion Coulomb Clusters in an Ion Trap.Phys. Rev. Lett. 1987, 59, 2935–2938.
12. Hornekær, L.; Kjærgaard, N.; Thommesen, A. M.; Drewsen,M. Structural Properties of Two-Component Coulomb Crys-tals in Linear Paul Traps. Phys. Rev. Lett. 2001, 86, 1994–1997.
13. Jarrold, M. F. Peptides and Proteins in the Vapor Phase. Annu.Rev. Phys. Chem. 2000, 51, 179–207.
14. Selvin, P. R. The Renaissance of Fluorescence ResonanceEnergy Transfer. Nature Struct. Biol. 2000, 7, 730–734.
15. Schnier, P. D.; Klassen, J. S.; Strittmatter, E. F.; Williams, E. R.Activation Energies for Dissociation of Double Strand Oligo-nucleotide Anions: Evidence for Watson-Crick Base Pairing inVacuo. J. Am. Chem. Soc. 1998, 120, 9605–9613.
16. Gabryelski, W.; Li, L. Photo-Induced Dissociation of Electros-pray Generated Ions in an Ion Trap/Time-of-Flight MassSpectrometer. Rev. Sci. Instrum. 1999, 70, 4192–4199.
17. Creaser, C. S.; O’Neill, K. E. Photodissociation and Collision-ally Activated Dissociation Tandem Mass Spectrometric Stud-ies of Difluoro[triazol-1-ylmethyl]Benzhydrols and RelatedCompounds in a Quadruple Ion trap. Int. J. Mass Spectrom. IonProcesses 1997, 165, 13–23.
18. Fenn, J. B.; Mann, M.; Meng, C. K.; Wong, S. F.; Whitehouse,C. M. Electrospray Ionization for Mass Spectrometry of LargeBiomolecules. Science 1989, 246, 64–71.
19. Kebarle, P.; Tang, L. From Ions in Solution to Ions in the GasPhase: The Mechanism of Electrospray Mass Spectrometry.Anal. Chem. 1993, 65, 972A–986A.
20. Fenn, J. B.; Mann, M.; Meng, C. K.; Wong, S. F.; Whitehouse,C. M. Electrospray Ionization—Principles and Practice. MassSpectrom. Rev. 1990, 9, 37–70.
21. Parks, J. H.; Pollack, S.; Hill, W. Cluster Experiments in RadioFrequency Paul traps: Collisional Relaxation and Dissociation.J. Chem. Phys. 1994, 101, 6666–6685.
22. Ferreira, J. A. B.; Costa, S. M. B. Rhodamine 3B� ClO4�Electronic Transitions: Reaction Field and Vibrational Struc-ture. Chem. Phys. 2001, 273, 39–49.
23. Parks, J. H.; Szoke, A. Simulation of Collisional Relaxation ofTrapped Ion Clouds in the Presence of Space Charge Fields.J. Chem. Phys. 1995, 103, 1422–1439.
24. Guan, S.; Marshall, A.G. Equilibrium Space Charge Distribu-tion in a Quadrupole Ion Trap. J. Am. Soc. Mass Spectrom. 1994,5, 64–71.
25. Molecular Probes Home Page. http://www.probes.com/media/pis/mp10168.pdf, (accessed October, 2001).
26. Welling, M.; Schuessler, H. A.; Thompson, R. I.; Walther, H.Ion/Molecule Reactions, Mass Spectrometry, and OpticalSpectroscopy in a Linear Ion Trap. Int. J. Mass Spectrom. IonProcesses 1998, 172, 95–114.
27. Wells, J. M.; Badman, E. R.; Cooks, R. G. A Quadrupole IonTrap with Cylindrical Geometry Operated in the Mass-Selec-tive Instability Mode. Anal. Chem. 1998, 70, 438–444.
28. Arkin, C. R.; Goolsby, B.; Laude, D. A. Characterization of aHybrid Ion Trap. Int. J. Mass Spectrom. 1999, 190, 47–57.
29. Mahan, B. H.; O’Keefe, A. Rotational Excitation and RadiativeLifetimes of N2
�. J. Chem. Phys. 1981, 74, 5606–5612.30. Beaumont, P. C.; Johnson, D. G.; Parsons, B. J. Photophysical
Properties of Laser Dyes: Picosecond Laser Flash PhotolysisStudies of Rhodamine 6G, Rhodamine B, and Rhodamine 101.J. Chem. Soc. Faraday Transactions 1993, 89, 4185–4191.
31. Engstrom, R. W. Photomultiplier Handbook. RCA Solid StateDivision, Electro Optics and Devices: Lancaster, 1980; 160–163.
708 KHOURY ET AL. J Am Soc Mass Spectrom 2002, 13, 696–708