public opinion on welfare the bedrock of public policies? · public opinion on welfare – the...
TRANSCRIPT
1
Public opinion on welfare – the bedrock of public policies?
Biased perceptions, limited knowledge and measurement of welfare attitudes.
Ursula Dallinger – University of Trier/Germany
Contribution ESPAnet conference Rotterdam Sept. 2016
"As good democrats, we like to think, that government policy stems, directly or indirectly,
from the Will of the people. If it stems instead from such irrelevant quirks of voter psychology
as myopia, misperceptions, and responsiveness to campaign spending, the warm glow
seems distinctly diminished." (Bartels 2008: 127)
1. Introduction
Most research on public opinions towards the welfare state or its single programs is motivat-
ed by the belief, that the preferences of the citizens are the "bedrock" of policy-making in
democratic systems. Social policy reacts to "what the people want". Governments are re-
sponsive to gain the acceptance of the electorate. Only if social policies match to the prob-
lems the people perceive and their notions of social justice or fairness, governments are re-
elected or parties attain a majority. Without such a basis in public support, politicians not only
risk to be blamed by the voter, but also their social programs lack legitimacy and find no ac-
ceptance (Brooks/Manza 2006, 2007). The argument is familiar that welfare states persist in
spite of liberal retrenchment attempts because of citizen's demand for social security in old
age and in the case of illness or unemployment, or that certain reforms are necessary to
meet the demands of the people. In times of rising inequality, redistribution is demanded by
the median voter, leading to policies that partly correct the unequal distributive outcomes of
markets (Iversen 2010). As in democracy theory in general, also in social policy research the
policy preferences function as "bedrock" of the ensuing political process.
However, such a role of the mass attitudes was criticized (Bartels 2003a). Firstly, it is argued
that the preferences of citizens themselves are not particularly reflected or stable enough to
qualify such attitudes to form the (legitimatory) basis of democratic political decisions or so-
cial policy legislation. Secondly, the claim that government legislation responds to the de-
mands of citizens was criticized to be overly optimistic. Representation may be limited, as
currently being debated in the US with regard to unequal income distribution, which can
hardly be explained by the preferences of the broad majority of citizens (Hacker/Pierson
2010). Rather, representation would appear to be unequal (Gilens 2005; 2010).
2
The present article picks up the first of these arguments which claims that preference for-
mation itself needs more scrutinity. What can social policy research contribute to this skepti-
cal view of the role of preferences in democratic social policy process? The paper observes
directions in public opinion and welfare attitudes research that focus on how preferences
themselves react to information, to political discourses, to implemented reforms and to the
media. It is argued that this re-orientation is combined with a change in research methods,
where (survey) experiments are becoming more common, which can more easily test prefer-
ence formation and effects of framing. Another innovation, the use of online surveys and the
opportunities they offer in investigating preference formation, are discussed.
The next chapter reconstructs the arguments in comparative welfare state theory and politi-
cal economy which repeat the democratic ideal of an enlightened voter that demands those
programs that help solve his problems. Chapter 3 gives an overview of approaches to a
closer examination of preference formation like experimental designs and describes the wid-
ening use of online surveys. Chapter 4 introduces different online-surveys and tests, if the
survey mode matters by comparing distribution and correlation structures of a few variables,
i.E. support for redistribution. The analysis draws on publicly available data of random prob-
ability online surveys in Germany.
2. The relevance of preferences – bottom up and top town perspective
The introduction of the democratic right to vote, with one vote per citizen, has distributed po-
litical power equally (Burstein 1986). Now, only policies accepted by citizens can be pushed
through. Therefore, explanations of social policy research and political economy consider
governmental policies as being the result of demands by citizens, to which politicians react
accordingly (Offe 1987). Already the power-resources approach in welfare state theory gives
preferences such a fundamental role. Under the heading of "politics against markets"
(Esping-Andersen 1985) it started from the self-interests of "workers" as the decisive factor
on which the implementation of different social policy programs depended. The power-
resources approach soon realized that the political influence of workers is too small, and
therefore redirected its attention to "cross-class-coalitions" between the middle and poorer
classes (Esping-Andersen 1990, Korpi 1983; Huber/Stephens 2001; Manow 2009). Because
of different social structures in different countries with specific cleavages – socio-economic
groups with their respective organization and representatives – different coalitions emerged
in history. These coalitions shaped the varying arrangement of social security systems (wel-
fare regimes). Research on social policy preferences initially analyzed whether the social
political preferences actually converge with regime-specific policy patterns. However, this
could never be firmly established empirically, and is still contested (Svallfors 1997; Gelissen
2000; Linos West 2003; Jaeger 2006). The power-resources approach represents a bottom-
up perspective on the causal relationship between voter demands and political reactions
which very clearly follows the democratic ideal mentioned above.
Later approaches from an institutional perspective switched to a top-down perspective. They
conceive regime-specific differences in attitudes as a result of the incentives which the wel-
fare state institutions set. Their institutional design shapes the preferences of citizens. Institu-
3
tions define the group of beneficiaries, the preconditions and size of benefits, and thus the
self-interests, the rights and duties of the citizens and the political elites. Social political insti-
tutions structure the field in which bargaining and political conflict takes place. In part, the
institutions rather are seen as expressions of certain ideals, not just as an incentive for the
interest formation. The institutional design is kind of message to the citizens on who should
get what and why (Pierson 1993; Rothstein 1998; Mau 2004; Larsen 2008; Kum-
lin/Stadelmann-Steffen 2014). Here, individual interests are not an independent "demand" of
voters as in political economy or power resources approaches, but shaped by the welfare
state institutions. The question of how the values embedded in institutions get transformed
into subjective preferences, however, is unresolved.
In the New Politics-approach again the citizens’ preferences are the basis of the political pro-
cess; now they serve as a break against retrenchment. The widespread self-interest among
the population to be protected against social risks made the welfare state resilient against
cuts – even in times of general austerity (Page/Shapiro 1983; Burstein 1998; Brooks/Manza
2006a und b, 2007). Politicians who want to get re-elected cannot neglect the social security
interests of citizens. Governments get blamed for retrenchment, and seek strategies of
blame avoidance or cease making necessary reforms at all (Pierson 1996; Krömmelbein et
al. 2007). However, recent studies have shown that retrenchment policy is possible. It does
not always result in vote loss of the governing parties in the next election. Rather, parties are
also honored for pushing through reforms. "Blame" only occurs if the media make cuts a top-
ic (Armingeon/Giger 2008; Giger 2012). The way a problem is presented in the media
shapes awareness about its causes and solutions. Analysis on policy change asks which
framing strategies make blame avoidance successful. Now, more and more the public policy
preferences themselves are conceived as instable, mediated by political communication,
arguments and frames, and exploited and designed deliberately by political elites and the
media in order to convince voters.
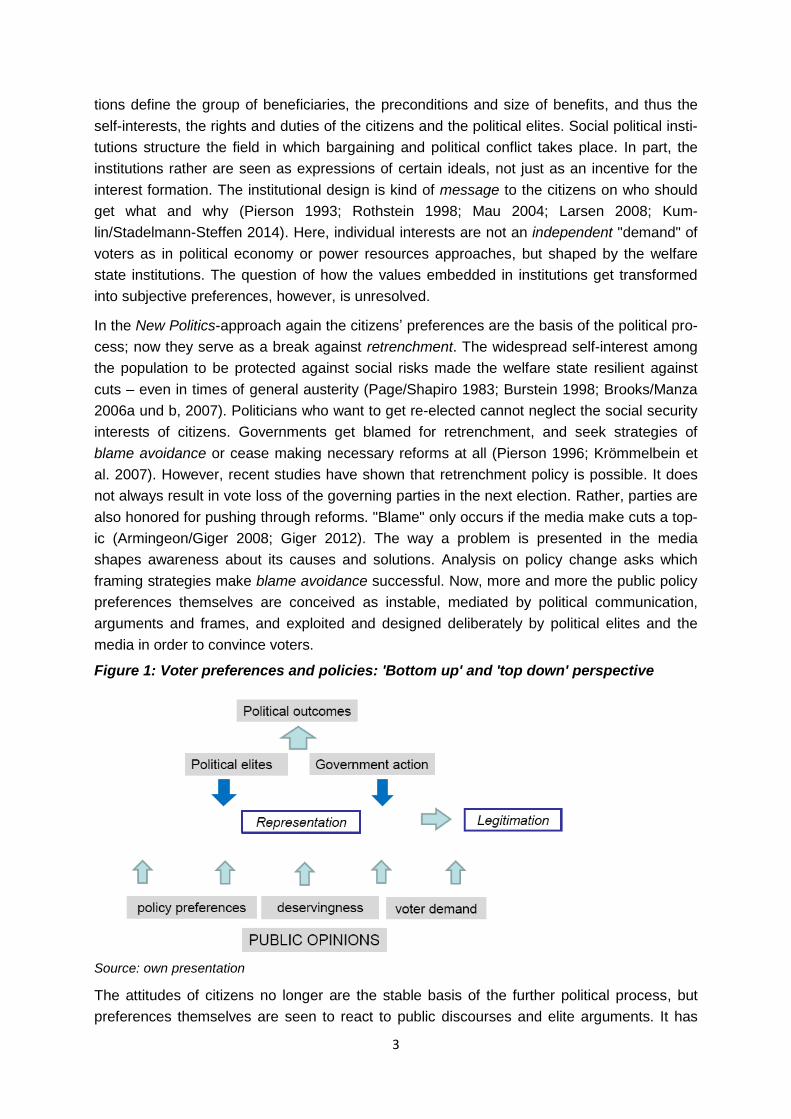
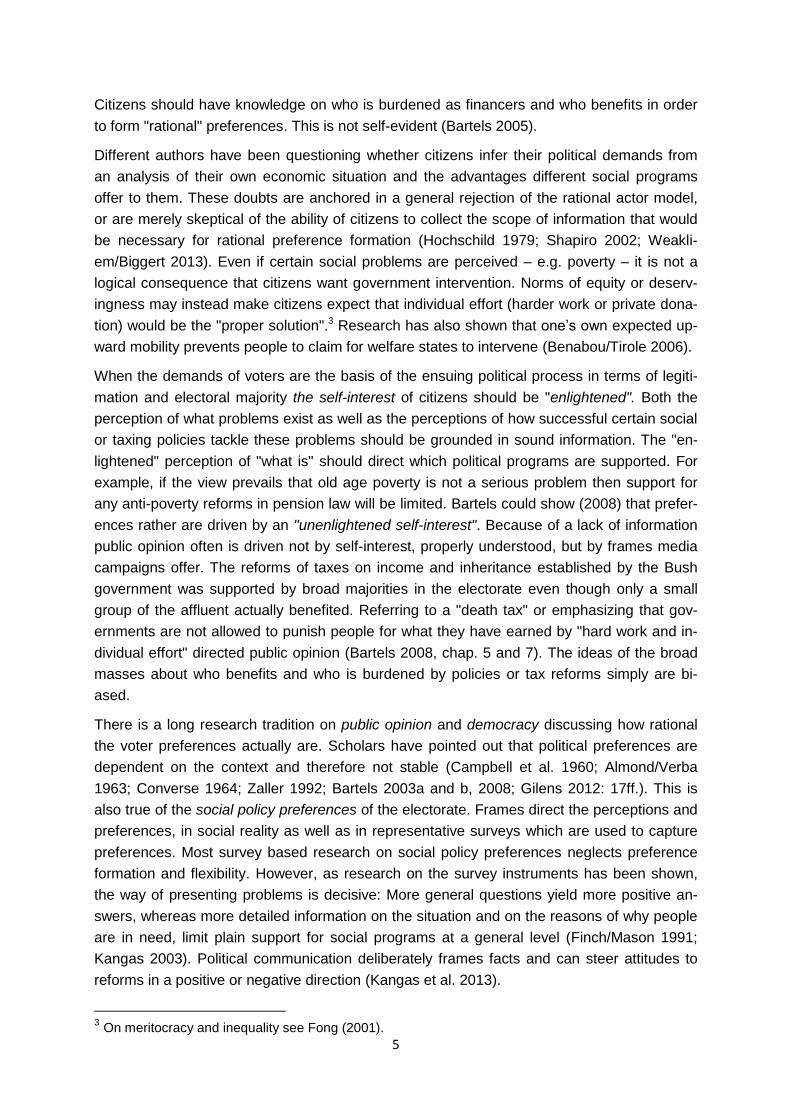
Figure 1: Voter preferences and policies: 'Bottom up' and 'top down' perspective
Source: own presentation
The attitudes of citizens no longer are the stable basis of the further political process, but
preferences themselves are seen to react to public discourses and elite arguments. It has
4
been examined under which conditions citizens adapt their "attitudes" to reforms, even if they
mean retrenchment. Framing effects were analyzed indirectly by drawing conclusions from
electoral results (vote gains and losses of parties that retrench; see Armingeon/Giger 2008;
Elmelund-Praestekaer/Emmenegger 2012; Giger/Nelson 2010) and also by means of survey
data. Not surprisingly, retrenchment gets electoral support when the welfare state is per-
ceived as an economic burden (Giger 2011; Giger/Nelson 2013). Preferences adapt to the
"new realities" which reforms create, as Naumann (2014) shows in a study on opinion
change in the context of increased retirement age in some European countries. This reform
to make pension systems more sustainable was very unpopular. Nevertheless resistance
decreased after laws to increase legal retirement age were passed. The awareness of the
untenability of pension systems seems to rise due to public discourses on the appropriate
retirement age.
Experimental designs are becoming more common to show how public opinion is shaped by
different ways to present a certain issue. Kangas et al. (2013) tested how different frames,
understood as the ideational devices which were developed in the earlier political reform de-
bates, influence the preferences of for a centralization of social assistance in Finland.1 In a
representative telephone survey, four different frames were presented to treatment groups.
Goerres et al. (2015) conducted framing experiments on different arguments of welfare state
reform pressures with national representative survey experiments fielded in three countries
(Germany, Norway, Denmark).2 Treatment groups are offered different considerations on
why "reform pressures" make the status quo untenable and force governments to retrench
pensions.
2.2 Political economy
In the political economy of redistribution a similar trend to that seen in the new politics ap-
proach towards a dynamic relationship between preferences and policy rather than a model
in which public opinion is the starting point of the ensuing political process is visible. Basical-
ly, political economy stipulates that citizens demand social policy programs according to their
self-interests in certain material benefits, and governments act accordingly to get (re-
)elected. The median voter approach, a common explanation of how the mass preferences
change when the income gaps widen, sees a political majority emerging for redistributive
programs (like taxes, social insurances) if the economic situation also of the middle layers of
society erodes and the distance to the rich widens. Now, the political demands also of a mid-
dle majority for social policy or taxes as measures to reduce this gap, forces politicians to
react and establish corresponding policies that correct the outcome of the markets (Melt-
zer/Richard 1981; Kenworthy/McCall 2008). This political economy explanation also requires
citizens who are able to perceive the scope of inequality or the size of unemployment or pov-
erty and who are able to judge, which social reforms are helpful and benefit those in need.
1 a) Social work frame: connect transfers and advice easier at local level. b) Income transfer machine:
control of recipients weak at state level, misuse. c) Rightfulness frame: people must get the benefits that the state entitles them to. d) Equal treatment for all by administration at state level. 2 Treatments consisted in sustainability threads in 6 fields: demographic change and ageing; too few
people working; western immigration; non-western immigration; economic crisis; favorable situation.
5
Citizens should have knowledge on who is burdened as financers and who benefits in order
to form "rational" preferences. This is not self-evident (Bartels 2005).
Different authors have been questioning whether citizens infer their political demands from
an analysis of their own economic situation and the advantages different social programs
offer to them. These doubts are anchored in a general rejection of the rational actor model,
or are merely skeptical of the ability of citizens to collect the scope of information that would
be necessary for rational preference formation (Hochschild 1979; Shapiro 2002; Weakli-
em/Biggert 2013). Even if certain social problems are perceived – e.g. poverty – it is not a
logical consequence that citizens want government intervention. Norms of equity or deserv-
ingness may instead make citizens expect that individual effort (harder work or private dona-
tion) would be the "proper solution".3 Research has also shown that one’s own expected up-
ward mobility prevents people to claim for welfare states to intervene (Benabou/Tirole 2006).
When the demands of voters are the basis of the ensuing political process in terms of legiti-
mation and electoral majority the self-interest of citizens should be "enlightened". Both the
perception of what problems exist as well as the perceptions of how successful certain social
or taxing policies tackle these problems should be grounded in sound information. The "en-
lightened" perception of "what is" should direct which political programs are supported. For
example, if the view prevails that old age poverty is not a serious problem then support for
any anti-poverty reforms in pension law will be limited. Bartels could show (2008) that prefer-
ences rather are driven by an "unenlightened self-interest". Because of a lack of information
public opinion often is driven not by self-interest, properly understood, but by frames media
campaigns offer. The reforms of taxes on income and inheritance established by the Bush
government was supported by broad majorities in the electorate even though only a small
group of the affluent actually benefited. Referring to a "death tax" or emphasizing that gov-
ernments are not allowed to punish people for what they have earned by "hard work and in-
dividual effort" directed public opinion (Bartels 2008, chap. 5 and 7). The ideas of the broad
masses about who benefits and who is burdened by policies or tax reforms simply are bi-
ased.
There is a long research tradition on public opinion and democracy discussing how rational
the voter preferences actually are. Scholars have pointed out that political preferences are
dependent on the context and therefore not stable (Campbell et al. 1960; Almond/Verba
1963; Converse 1964; Zaller 1992; Bartels 2003a and b, 2008; Gilens 2012: 17ff.). This is
also true of the social policy preferences of the electorate. Frames direct the perceptions and
preferences, in social reality as well as in representative surveys which are used to capture
preferences. Most survey based research on social policy preferences neglects preference
formation and flexibility. However, as research on the survey instruments has been shown,
the way of presenting problems is decisive: More general questions yield more positive an-
swers, whereas more detailed information on the situation and on the reasons of why people
are in need, limit plain support for social programs at a general level (Finch/Mason 1991;
Kangas 2003). Political communication deliberately frames facts and can steer attitudes to
reforms in a positive or negative direction (Kangas et al. 2013).
3 On meritocracy and inequality see Fong (2001).
6
Political economy of redistribution starts from an enlightened voter. Hence, people may be
mistaken regarding the degree of income inequality and their own relative position in the in-
come structure. By comparing the subjective perceptions of the income distribution the resi-
dents of different countries have and the actual distribution in these countries, it has been
shown that country-typical misperceptions exist (Niehues 2014).4 While in some countries,
such as Germany or France, the populations overestimate inequality compared to real distri-
bution, believing that most parts of the population belong to the bottom strata, while the ob-
jective distribution or Gini indices indicate a different reality. Other populations underestimate
inequality, such as the people in the US. They have a positive bias of the real inequalities.
Engelhardt and Wagener (2014) have shown that perceived inequality can explain the de-
mand by people for redistribution, while many attempts to explain preferences for redistribu-
tion based on actual income inequality measures failed. Subjectively perceived inequality –
not the actual distribution of incomes – is strongly linked to demand for government income
redistribution. This study not only "rescues" the median voter hypothesis, but also under-
scores the role of subjective perceptions in political economy models.
Biased perceptions of the income distribution and their consequences for the concomitant
social policy preferences are of upmost practical importance and the political economy of
redistribution-approach. To analyze the critical connection between perceived inequality and
the subsequent policy preferences, research on redistribution too (as in research on re-
trenchment) conducts experiments, often embedded in surveys (Cruces et al. 2013; Karadja
et al. 2014;) or in online surveys (Norton/Ariel 2011; Kuziemko et al. 2015; Gallego 2016).
The experimental results underscore that the perceived inequality is sensible to the infor-
mation respondents get on the income distribution and on their own position within it. Moreo-
ver, the impact of these (biased) perceptions on the ensuing preferences for redistributive or
other social programs was confirmed.
Research that is aiming to a more precise analysis of preference formation and deviates from
the creed that citizens rationally perceive the facts like income inequality or certain social
deficits and then come to logical political demands must consider the role of information by
the media. It is straightforward to assume that people usually receive information on inequali-
ty, on social spending, on the effectiveness of certain policies from the media. The political
reactions of people to inequality should widely depend on the media representation of a top-
ic. To date, welfare opinion research, considering how the media guides preferences is
scarce (but see Duch/Sagarzazu 2014; Dupuy/van Ingelgom 2014; Kumlin 2014).
3. Trends in the analysis of preference formation
3.1 Framing experiments
4 This study is based on the ISSP 2009 module on social inequality and the question 14a on the per-
ceived type of society: "These five diagrams show different types of society: Please read the descrip-tions and look at the diagrams and decide which you think best describes your country." Five diagrams are shown, representing different ways the income distribution is shaped. The wording for type A f.e. is: "A small elite at the top, very few people in the middle and the great mass of people at the bottom", or type D "A society with most people in the middle", etc..
7
Research on social policy preferences is beginning to deviate from the bottom-up model and
to consider that preferences themselves are no stable, unbiased starting point, but may re-
sult from selective information, from framing, or simply follow the existing institutional set-up.
In order to show this, research on (social) policy preferences increasingly integrates experi-
mental designs. This means testing the effects of "treatments", which are the "causes" that
may alter attitudes. A treatment can be information, frames, media reports on reforms, expert
opinions, a discussion group on a related topic before certain questions are asked and more.
An experimental design is based on randomly drawn groups, which receive a "treatment".
The randomization of treatment and control groups is the main instrument of experiments. By
randomly assigning people to control and treatment groups there can be no other variable
that causes the change of the dependent variable, except the treatment one group receives
(Slothuus 2007). Drawing random groups avoids the problem of the uncontrolled effects of
omitted variables, while the usual regression design needs to include all the relevant varia-
bles into the models to avoid biased results. The second main advantage of experiments is
that the causal order is controlled, which otherwise can be problematic in cross-sectional
regression models. Since the treatment is placed before the items that measure the "effects",
it is quite simple to state the causal effects.
Experimental designs can be conducted in a "laboratory" setting or embedded in a (repre-
sentative) survey. In the first case, the results possess high internal validity, but lower exter-
nal validity. Results from experiments conducted with students or other selective groups and
a small N sample (Slothuus 2007; Wenzelburger/Hörisch 2015; Vössing 2015) risk to be
questioned, if the group involved and the experimental topic do not fit. Since the treatment
groups are randomly assigned, they can still claim internal representativeness, but external
validity is a problem.5 When embedded in a representative survey, experiments combine the
external validity of a random sample of respondents with the advantage of experiments (e.g.
Frech et al. 2015; I shall return to representativeness in the next chapter, when the online
surveys are discussed.)
Frames are "alternative descriptions or interpretations of the same information, problem or
solution. Frames guide our understanding of a problem's origins and offer suggestions about
how to evaluate solutions." (Nelson 2004:582) There is a difference between equivalence
framing, where the same fact is presented from different aspects, and issue framing, where
different aspects or context information are highlighted, in order to evoke different considera-
tions on a topic (Druckman 2004).
Framing is not simply the indoctrination of voters. Opinion formation does not conceive the
actor as an empty mind that can be deliberately influenced by communicating certain infor-
mation, views and judgements. Framing experiments therefore should copy reality, where
value conflicts or conflicting arguments are common in the public arena. Part of realistic pref-
erence formation is that people already possess information, convictions and values. Typical-
5 Slothuus (2007) conducted experiments on the dependency of support for cutting unemployment
benefits on perceptions of deservingness by setting frames with fictional newspaper articles (student sample of 291); Wenzelburger’s and Hörisch’s (2015) voluntary access online survey examines the varying support for cutting public pensions when framed as a demographic necessity, or when gov-ernment subsidies for private pensions saving schemes are promised.
8
ly, in public policy controversies different reform policy propositions compete with each other.
At the same time this means a value conflict, since reforms often refer to different values. For
example, the question of whether universities should be obliged to install affirmative action
plans is linked to a conflict between the goals of academic excellence on the one hand and
equal opportunities for women or ethnic minorities on the other.6
Of course, settings of conflicting goals or attitudes can be modeled within the survey and
laboratory experiments (Nelson 2004). To get reliable results, framing experiments try to
mimic real political controversies by including conflicting points of view and conflicting argu-
ments. Experiments use "counter framing" – a frame that contradicts another frame in the
experiment – to make the participants in an experiment aware that different views and modes
exist as to how to perceive the "facts" (Druckman 2004).7 Another tool to model real situa-
tions of political contest are experiments on preference formation conducted with discussion
groups with either homogeneous or heterogeneous members. Moreover, experimental de-
signs can test whether the treatment effect is mediated by information acquired from the me-
dia.
Framing effects due to the alternated wording or phrasing of the same facts demonstrate that
voters are not just rational observers of facts and information, but are guided by the views
and valuation that political and other public elites transmit (Druckman 2004). Experiments are
interested in the mediators of framing effects: Are framing effects especially strong in certain
groups and why? For example, this may be the case among people very interested in politics
or among those, to whom an issue is salient. Mediators of the treatment effect can be reli-
giousness of the interviewee, previous information, or the possibility to discuss before an-
swering questions. Another class of mediating effects asks under which contextual conditions
framing effects occur. As in multilevel analyses, level 2 information is required.
3.2 Online surveys
A second trend in public opinion research is the growing importance of online surveys. These
internet surveys are often criticized as being selective, since people must have internet ac-
cess. This restriction is a true problem, but different options (see below) are tested to handle
it. Another severe criticism aims at the problem of representativeness of a survey sample.
Representativeness is achieved when the participants are randomly selected from a popula-
tion. Commercial public opinion research offers online surveys as opt-in internet panels (or
access panels), where participants are not recruited by a random probability selection pro-
cess. But exactly this is a sine qua non-condition for representativeness, or the ability to
6 Nelson describes some usual communicative strategies that try to resolve conflicts when values compete: Ranking policy goals or the values behind different suggestions; policy categorization ("this conflict belongs to category x and therefore is important"); institutional role assignment (underscore the "proper" goal of an institution; e.g.: universities are not obliged to conduct affirmative action since their institutional goal is the selection of the best). 7 To mimic real life controversies, empirical studies allow different persons with different points of view
to act. In Vössing's (2015) experiments, elite discourses on European integration were modeled by competing expert opinions. Interestingly, this design attained no framing results.

9
generalize results from a sample to the general population (Yeager et al. 2011). Without
probability samples the accuracy of the results to be drawn from the data is seen as shaky.
If households without internet access are excluded, selectivity bias per se exists. Therefore,
in some European countries online panels were established, recruiting the survey-
participants offline initially, by means of a probability sampling process, and equipping se-
lected offline households, who are willing to participate, with internet access and computers
or user-friendly tablets: The Dutch LISS, the French ELIPSS and the German GIP.8 The
German GESIS Panel is a mixed panel since households without Internet or not willing to
participate via Internet are interviewed by postal paper questionnaires. For these various
national official online panels, households to be interviewed are randomly drawn by different
methods (for details see Blom 2015, p. 5, tab. 2). After random selection, the households are
contacted first by mail, then by face-to-face interviewers or by telephone to check their will-
ingness to participate and to give information on an online panel. Later these members of
pre-recruited panels are invited to fill in online questionnaires (self-completion mode) at cer-
tain time intervals. Offline recruitment is the tool to achieve representativeness.
The different survey modes – face-to-face, telephone or online survey - vary in more charac-
teristics than just the sampling procedure: The interview situation differs, the panel attrition
patterns may differ, etc.. The main question is, whether these differences produce results
that are not representative. Data from the "official" internet surveys are used in the final chap-
ter of this paper to compare the results of different survey modes (chap. 3.3).9 Opt-in internet
panels are not considered since I have no access to the data. However, some remarks may
be helpful.
Commercial online access panels do not result from probability sampling, nevertheless the
recruitment strategies differ with severe consequences for data quality. The crudest method
is to place a survey on online platforms (such as Mechanical Turk, a platform for paid work
by Amazon), which of course provides no control over the sample. However, commercial
providers usually offer active recruitment, a more elaborate mode of sample selection. A
large pool of potential panelists is collected by participants of earlier surveys or by online
marketing. Another method is used by Infratest dimap who recruits participants offline on the
basis of payback providers.10 From this pool, a sample of participants is drawn according to
quota, along the criteria age, education, sex or income (quota sampling is also done by
Yougov, Respondi). Nevertheless, households without internet access do not participate.
Self-recruitment is seen as inacceptable in terms of accuracy and representativeness
(Faas/Schoen 2006). Ansolabehere and Schaffner (2012) compared data from an opt-in in-
ternet panel11, telephone interviews and mail questionnaire with identical items. They found
8 More countries of course are experimenting with online surveys to test this new method: "Under-standing Society - Innovation Panel" in the UK with a mixed mode design. A pure opt-in panel is the SoSci Panel: https://www.soscisurvey.de/panel/index.php. 9 When discussing different modes of surveying we have to keep in mind that selectivity and bias also
exist in telephone and face-to-face-interviews. Telephone interviews actually seem to be even more biased (Bieber/Bytzek 2012). 10
Yougov actively and passively recruits a pool of 160,000 panelists. 11 It was the opt-in panel by Yougov. Within panel response rate 43% (RR1).
10
that results hardly differ because internet penetration and use are already high (log.cit. tab.
3). The view that survey mode does not matter, is overly optimistic.
Online panels which all collect a random probability sample offline in a first step are the LISS
(Longitudinal Internet Studies for the Social Sciences)12 in the Netherlands, the ELIPSS
(Longitudinal Study by Internet for the Social Sciences) Panel in France, the GIP (German
Internet Panel) within the SFB "Political Economy of Reforms" and the German GESIS Panel
(actually a mixed survey). The modes13 of drawing the sample, the incentives for participants
and the age limits of the population differ (see Blom et al. 2015: 5, tab. 2 for a detailed over-
view; also Blom et al. 2016). These many differences in the detail and country-specific cul-
ture yield different response rates for panel registration: The LISS reports 48%, GIP 18%,
and ELIPSS and GESIS about 26% (for details see Blom et al. 2015, p.9, tab. 3 and p.11).
About 10% of the panel were previously without computer and internet access. Participants
of online panels tend to be younger, more educated and more interested in politics than par-
ticipants of other survey modes.
4. Does survey mode matter for the results?
To answer this question, data from different German surveys are compared.14 In April/May
2014 LISS, ELIPSS, GESIS Panel (wave bb) and GIP15 fielded a joint wave with common
questions in all four panels. This wave contains selected variables identical to the ESS (Eu-
ropean Social Survey) wave 2008/9 and to the European Election Study 2009. Below, I pre-
sent just a few corresponding variables. The variables from the ESS which conducts face-to-
face interviews serve as a baseline.16
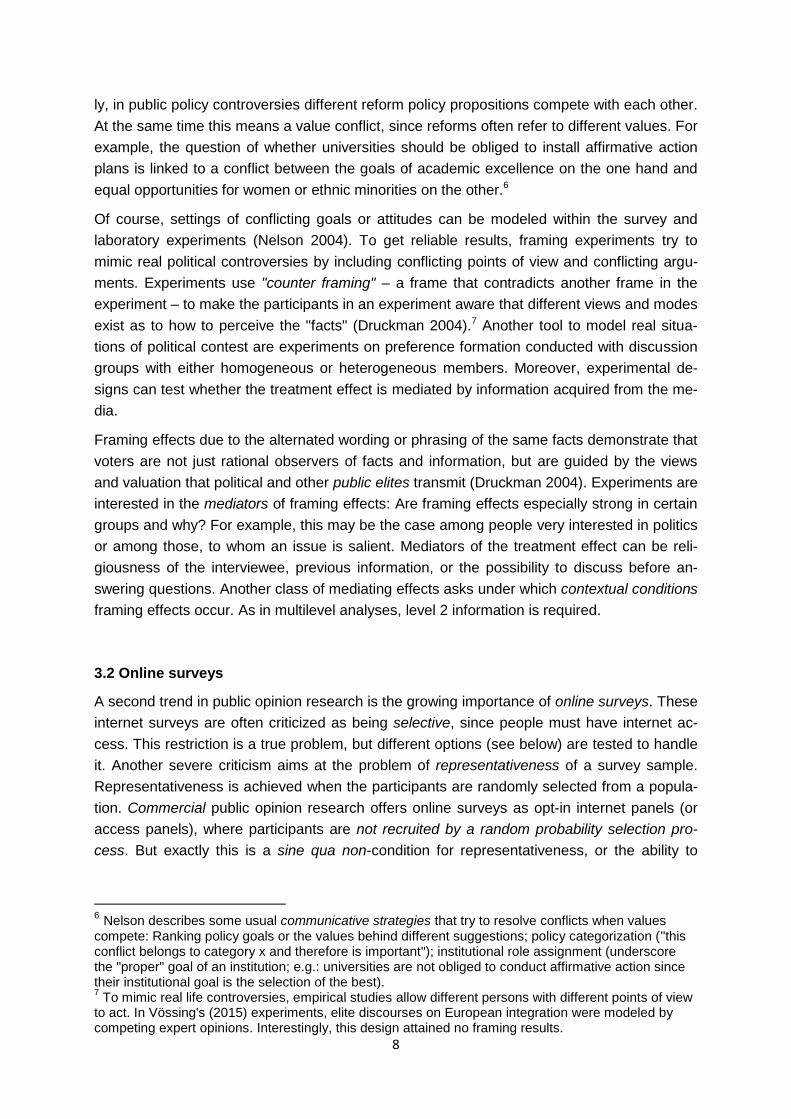
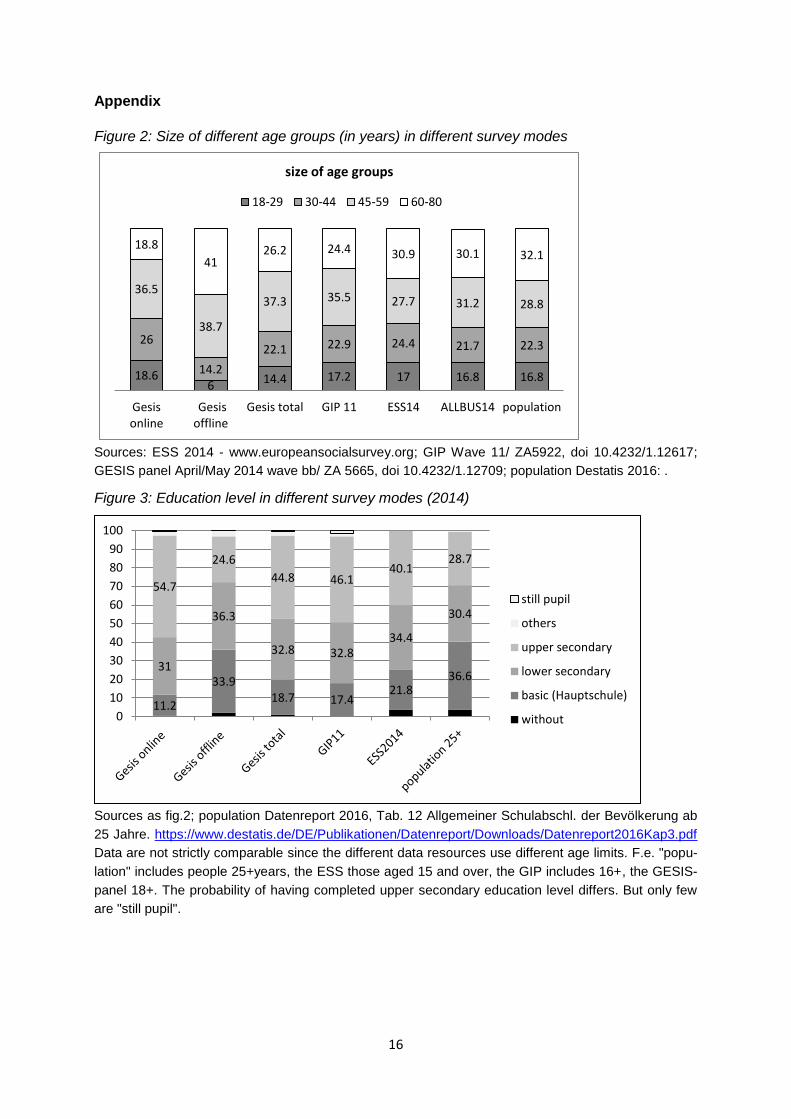
Figures 2 and 3 in the appendix show differences in the composition by age and education in
different survey modes. Especially the upper middle age group (45-59) is overrepresented
compared to the population, not that much the younger (18-29) or the middle (30-44) age
groups. In the samples of online surveys the higher education level is overrepresented. The
groups with upper secondary education level are just 28,7% of the German population
(above 24 years), but 46,1% of the GIP or 54,7% of the GESIS online. Combined with the
paper and pencil interviews, the GESIS Panel reaches a share of 44,8%. The ESS with
about 40% of those with at least upper secondary education also is biased. The figures are
not strictly comparable since the lower age limits used in the different data bases, differ.
Nevertheless they testify an overrepresentation of the higher educated people. It is contest-
ed, whether the bias in favour of the higher educated (with presumably higher income) poses
a problem. Of course, a survey does not just aim to describe age or educational structures,
12 http://www.centerdata.nl/en/LISSpanel 13
Some use national or municipal population registers, some use area probability samples. 14 Other comparisons of survey modes see Blom 2015; Bieber/Bytzek 2012, Ansolabehere/Schaffer 2012. 15 Data from GIP wave 11 (ZA5922), release 1.0, doi 10.4232/1.12617 (Blom et al., 2014). A study description can be found in Blom et al. (2015). 16 The ESS is representative for the population above 15 years in private households irrespective of nationality, the ALLBUS (Allgemeine Bevölkerungsumfrage der Sozialwissenschaften) covers the adult population over 18 years, GESIS the population from 18 to 70 years, GIP from 16 to 75 years.
11
but is interested in other characteristics. When these are connected to education, a bias mat-
ters. And welfare attitudes are connected to education and income. The ESS corrects
overrepresentation of certain demographic groups by weighting variables.
Do researchers risk biased results when working with variables on (social) policy opinion
because of possible biases of the online (or mixed) survey mode? To answer this question a
variable widely used in welfare attitudes and political economy research is analyzed: "Gov-
ernment should reduce the difference in income between the poor and the rich." I begin with
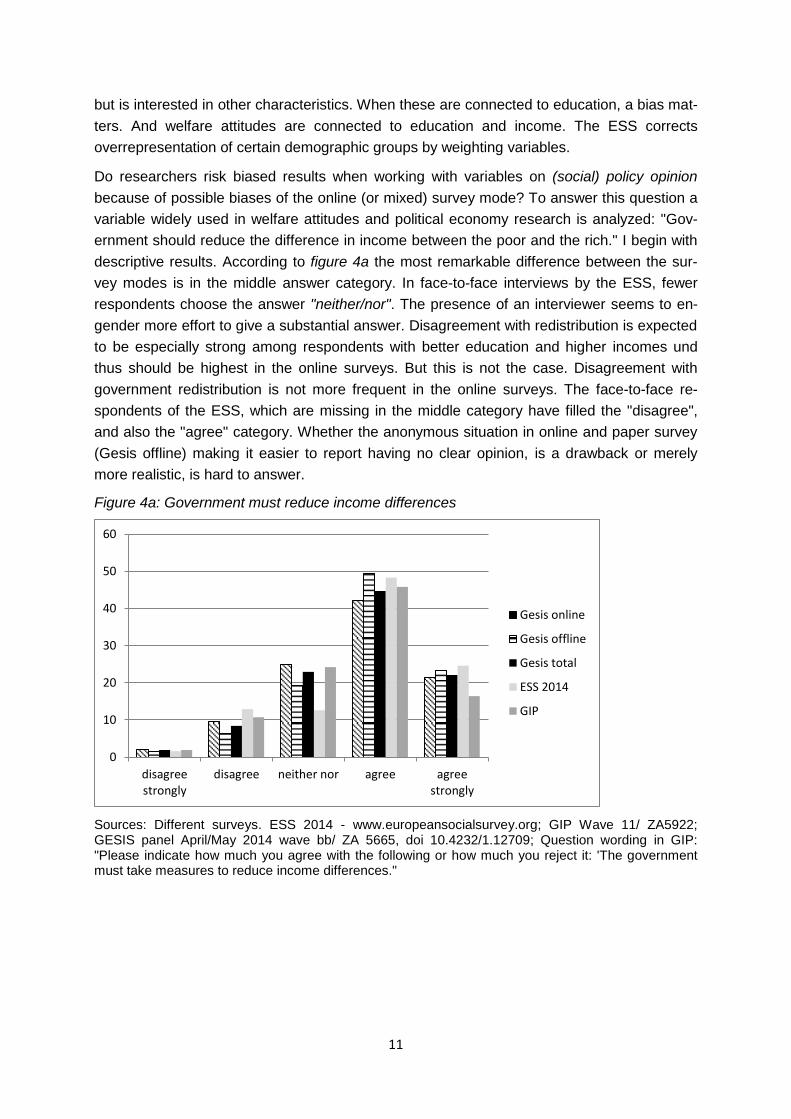
descriptive results. According to figure 4a the most remarkable difference between the sur-
vey modes is in the middle answer category. In face-to-face interviews by the ESS, fewer
respondents choose the answer "neither/nor". The presence of an interviewer seems to en-
gender more effort to give a substantial answer. Disagreement with redistribution is expected
to be especially strong among respondents with better education and higher incomes und
thus should be highest in the online surveys. But this is not the case. Disagreement with
government redistribution is not more frequent in the online surveys. The face-to-face re-
spondents of the ESS, which are missing in the middle category have filled the "disagree",
and also the "agree" category. Whether the anonymous situation in online and paper survey
(Gesis offline) making it easier to report having no clear opinion, is a drawback or merely
more realistic, is hard to answer.
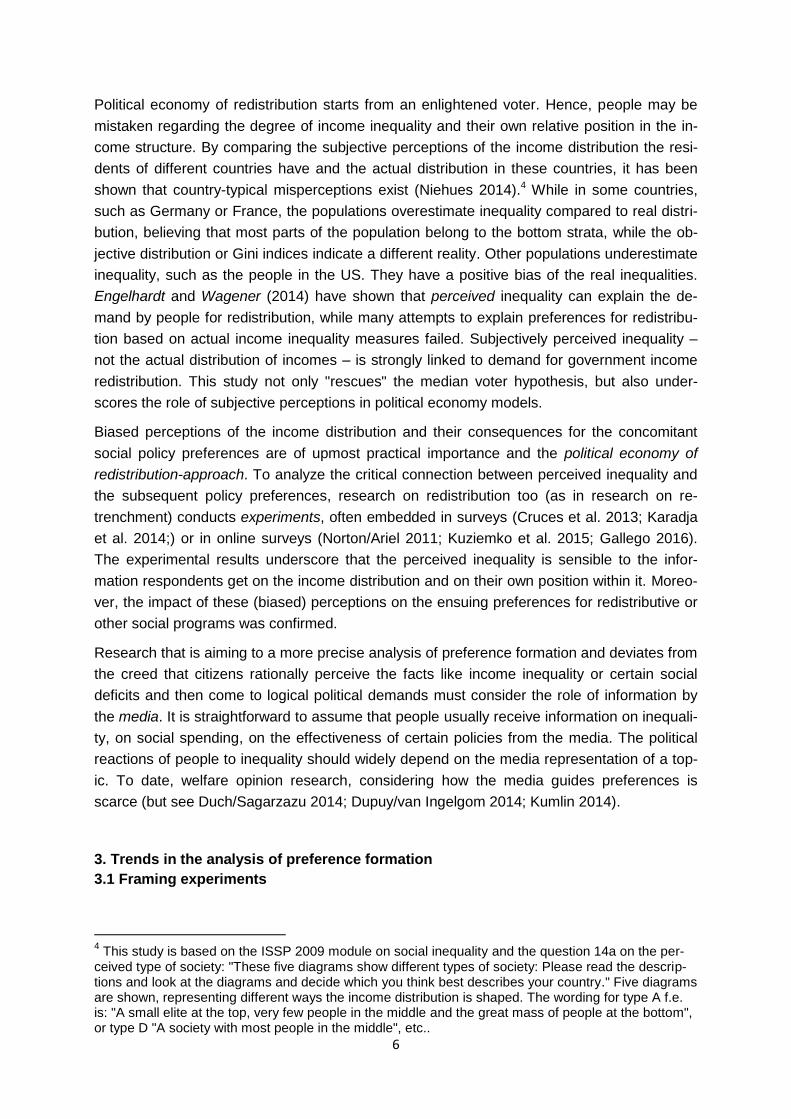
Figure 4a: Government must reduce income differences
Sources: Different surveys. ESS 2014 - www.europeansocialsurvey.org; GIP Wave 11/ ZA5922; GESIS panel April/May 2014 wave bb/ ZA 5665, doi 10.4232/1.12709; Question wording in GIP: "Please indicate how much you agree with the following or how much you reject it: 'The government must take measures to reduce income differences."
0
10
20
30
40
50
60
disagreestrongly
disagree neither nor agree agreestrongly
Gesis online
Gesis offline
Gesis total
ESS 2014
GIP
12
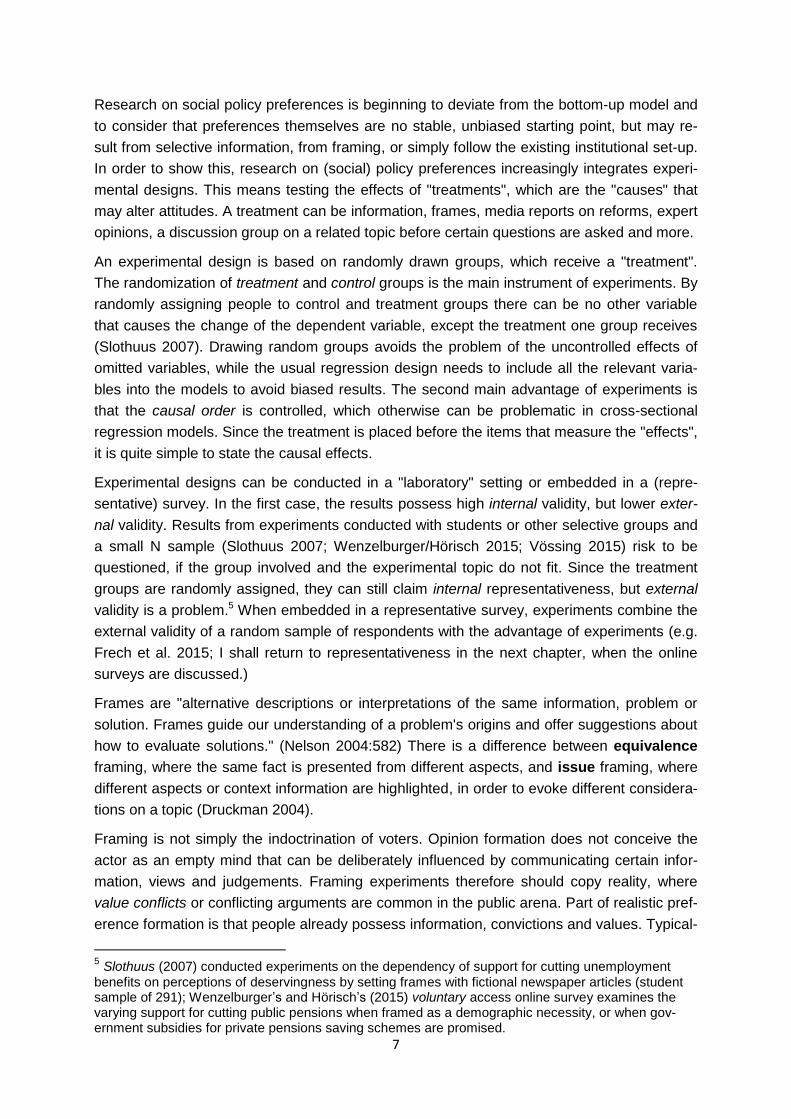
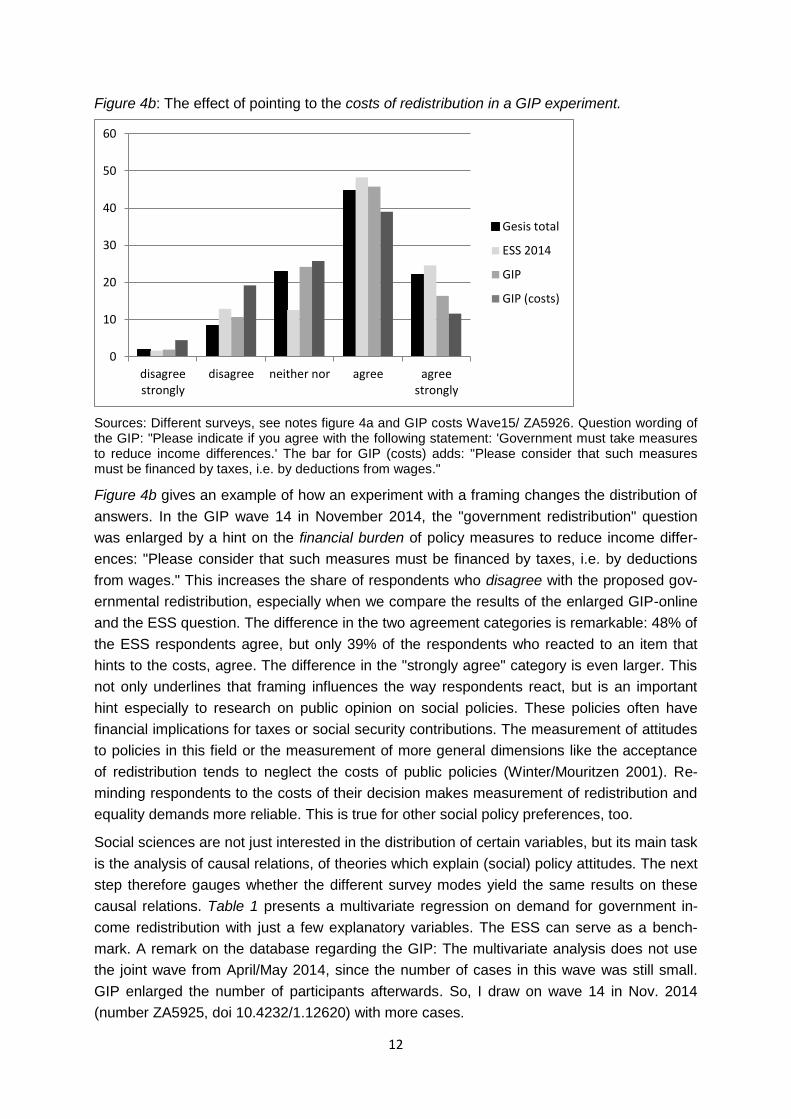
Figure 4b: The effect of pointing to the costs of redistribution in a GIP experiment.
Sources: Different surveys, see notes figure 4a and GIP costs Wave15/ ZA5926. Question wording of the GIP: "Please indicate if you agree with the following statement: 'Government must take measures to reduce income differences.' The bar for GIP (costs) adds: "Please consider that such measures must be financed by taxes, i.e. by deductions from wages."
Figure 4b gives an example of how an experiment with a framing changes the distribution of
answers. In the GIP wave 14 in November 2014, the "government redistribution" question
was enlarged by a hint on the financial burden of policy measures to reduce income differ-
ences: "Please consider that such measures must be financed by taxes, i.e. by deductions
from wages." This increases the share of respondents who disagree with the proposed gov-
ernmental redistribution, especially when we compare the results of the enlarged GIP-online
and the ESS question. The difference in the two agreement categories is remarkable: 48% of
the ESS respondents agree, but only 39% of the respondents who reacted to an item that
hints to the costs, agree. The difference in the "strongly agree" category is even larger. This
not only underlines that framing influences the way respondents react, but is an important
hint especially to research on public opinion on social policies. These policies often have
financial implications for taxes or social security contributions. The measurement of attitudes
to policies in this field or the measurement of more general dimensions like the acceptance
of redistribution tends to neglect the costs of public policies (Winter/Mouritzen 2001). Re-
minding respondents to the costs of their decision makes measurement of redistribution and
equality demands more reliable. This is true for other social policy preferences, too.
Social sciences are not just interested in the distribution of certain variables, but its main task
is the analysis of causal relations, of theories which explain (social) policy attitudes. The next
step therefore gauges whether the different survey modes yield the same results on these
causal relations. Table 1 presents a multivariate regression on demand for government in-
come redistribution with just a few explanatory variables. The ESS can serve as a bench-
mark. A remark on the database regarding the GIP: The multivariate analysis does not use
the joint wave from April/May 2014, since the number of cases in this wave was still small.
GIP enlarged the number of participants afterwards. So, I draw on wave 14 in Nov. 2014
(number ZA5925, doi 10.4232/1.12620) with more cases.
0
10
20
30
40
50
60
disagreestrongly
disagree neither nor agree agreestrongly
Gesis total
ESS 2014
GIP
GIP (costs)
13
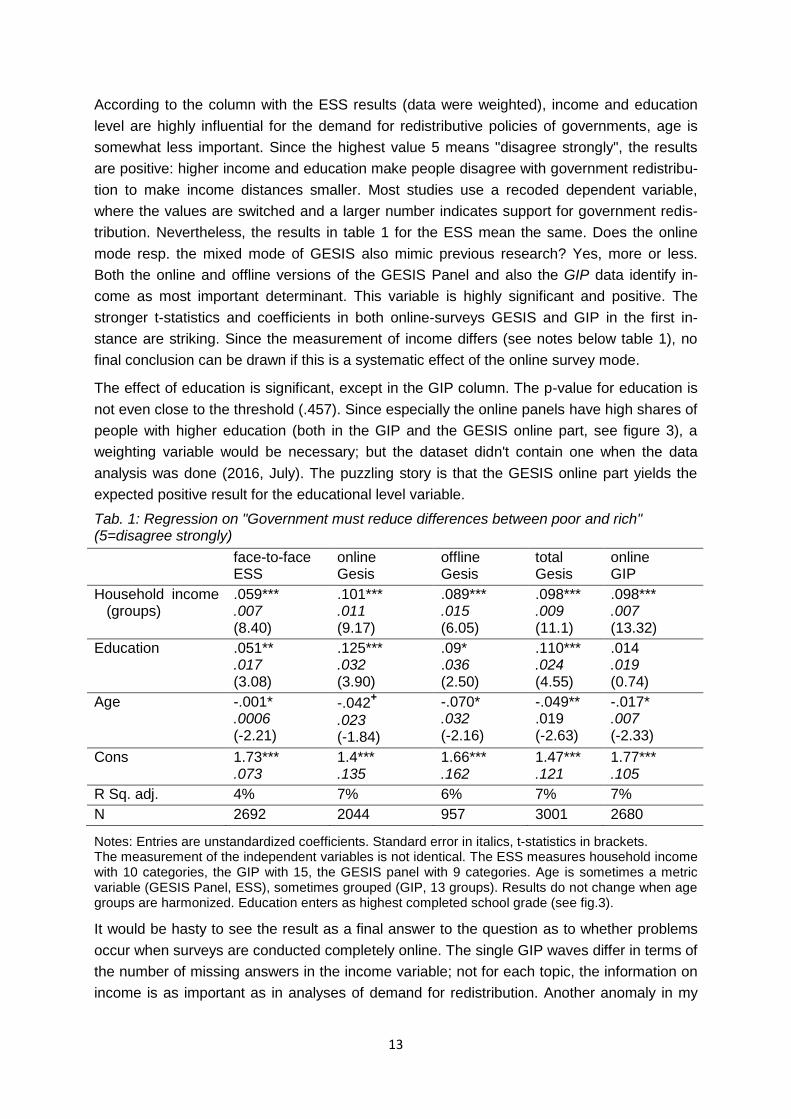
According to the column with the ESS results (data were weighted), income and education
level are highly influential for the demand for redistributive policies of governments, age is
somewhat less important. Since the highest value 5 means "disagree strongly", the results
are positive: higher income and education make people disagree with government redistribu-
tion to make income distances smaller. Most studies use a recoded dependent variable,
where the values are switched and a larger number indicates support for government redis-
tribution. Nevertheless, the results in table 1 for the ESS mean the same. Does the online
mode resp. the mixed mode of GESIS also mimic previous research? Yes, more or less.
Both the online and offline versions of the GESIS Panel and also the GIP data identify in-
come as most important determinant. This variable is highly significant and positive. The
stronger t-statistics and coefficients in both online-surveys GESIS and GIP in the first in-
stance are striking. Since the measurement of income differs (see notes below table 1), no
final conclusion can be drawn if this is a systematic effect of the online survey mode.
The effect of education is significant, except in the GIP column. The p-value for education is
not even close to the threshold (.457). Since especially the online panels have high shares of
people with higher education (both in the GIP and the GESIS online part, see figure 3), a
weighting variable would be necessary; but the dataset didn't contain one when the data
analysis was done (2016, July). The puzzling story is that the GESIS online part yields the
expected positive result for the educational level variable.
Tab. 1: Regression on "Government must reduce differences between poor and rich" (5=disagree strongly)
face-to-face ESS
online Gesis
offline Gesis
total Gesis
online GIP
Household income (groups)
.059***
.007 (8.40)
.101***
.011 (9.17)
.089***
.015 (6.05)
.098***
.009 (11.1)
.098***
.007 (13.32)
Education .051** .017 (3.08)
.125***
.032 (3.90)
.09*
.036 (2.50)
.110***
.024 (4.55)
.014
.019 (0.74)
Age -.001* .0006 (-2.21)
-.042+
.023 (-1.84)
-.070* .032 (-2.16)
-.049** .019 (-2.63)
-.017* .007 (-2.33)
Cons 1.73*** .073
1.4*** .135
1.66*** .162
1.47*** .121
1.77*** .105
R Sq. adj. 4% 7% 6% 7% 7%
N 2692 2044 957 3001 2680
Notes: Entries are unstandardized coefficients. Standard error in italics, t-statistics in brackets. The measurement of the independent variables is not identical. The ESS measures household income with 10 categories, the GIP with 15, the GESIS panel with 9 categories. Age is sometimes a metric variable (GESIS Panel, ESS), sometimes grouped (GIP, 13 groups). Results do not change when age groups are harmonized. Education enters as highest completed school grade (see fig.3).
It would be hasty to see the result as a final answer to the question as to whether problems
occur when surveys are conducted completely online. The single GIP waves differ in terms of
the number of missing answers in the income variable; not for each topic, the information on
income is as important as in analyses of demand for redistribution. Another anomaly in my
14
regression is the small effect of education, which is usually an important determinant for sup-
port for governmental redistribution.
5. Discussion
Public opinion is an important element in many theories of welfare policies, as this paper has
demonstrated by gauging arguments from political economy and new politics approaches.
Therefore, a long research tradition has analyzed citizens’ preferences resp. public opinion
directed to social policies. The perspective prevails that public opinion is the democratic
"bedrock" of legitimated and accepted social policies. The paper pointed to other trends in
research on (social) policy attitudes that criticize this bottom-up model and rather consider a
more complex process of preference formation in which attitudes themselves are influenced
top-down. What kind of social policy the citizens prefer or what voters want is also directed
by frames, the media and political communication. Parallel to this conceptual shift, I observed
a development towards the use of (survey) experiments and surveys conducted via internet.
Both allow greater flexibility in testing the effects of framing, of biased information on income
distribution and other features or the feedback effects of social policy institutions.
The paper deals with new methods in the analysis of political preferences, which develop in
the research on public opinion, and discusses how social policy research can benefit from it.
To check the data quality of internet panels and to get indications on how typical variables of
welfare attitude research fare, the paper compared results of different survey modes. It se-
lected Germany as a country for which baseline results on certain demographics are availa-
ble from official statistics and were different types of internet surveys, the GIP and the
GESIS-Panel as a mixed panel survey, are conducted. The European Social Survey data for
Germany served as a point of reference, because the study is a high quality probability sam-
ple and conducts face to face interviews which are conceived as most accurate. The select-
ed online surveys are based on probability samples and offline participant selection, methods
to yield representativeness. Online access panels as offered by commercial providers could
not be considered in this comparison of survey modes because data are not publicly availa-
ble as the online panels of different European countries are.17
Commercial providers usually use non-probability sampling procedures which are criticized
to yield no accurate data (Yeager et al. 2011). Even quota sampling and post-stratification
weights would not achieve satisficing data quality. However, further research has to explore
the proper weighting methods for these non-probability samples to improve their quality. In
the respective comparative test of commercial online panels by Yeager et al. (2011) the
weighting procedures of commercial companies were quite intransparent. At this point im-
provements are possible. It seems consent, that non-probability samples are appropriate to
test relations, conduct experiments and scrutinize theories, not to make point estimate
(Faas/Schoen 2006; Bieber/Bytzek 2012; Ansolabehere/Schaffner 2012).
This comparison of data gathered by different survey modes is not as systematic and elabo-
rated as the one by Yeager et al. (2011). It is no straightforward contribution to method-
17
And this paper had no budget to commission commercial online surveys to get the material for a wider comparison as other studies did. See Yeager et al. 2011.
15
development but wants to direct the attention of researchers on (social) policy preference to
new developments in their field. Yet, even this restricted aim gives valuable indications on
the quality of online panels. Also those based on a probability sample must be used carefully,
since selectivity of participants occurs. More analyses are necessary with variables that can
be compared to benchmarks and users need weighting variables in the datasets. The offline
recruitment of panel members and strict probability methods for the selection of cases does
not preclude any bias. As the example of the higher educated showed, bias should be cor-
rected by weighting. Corresponding variables are still not in the publicly available data.
The interview situation, the lack of an interviewer, incorporates differences: It is easier to ex-
press attitudes which are not socially desirable and it is easier to report a non-attitude. Both
is an advantage and makes data more reliable. Whether giving offline households internet
access (as the internet panels mentioned in the paper like the Dutch LISS, the French
ELIPSS and the GIP) helps to improve the representativeness of online surveys is an open
question. The mixed methods approach of the GESIS Panel showed robust results. The
combination of paper and pencil method with a probability online sample yields accuracy
compared to the ESS. The distribution of demographic variables like education or age are
highly biased in the online part, but balanced by the paper and pencil-part.
Further research in public opinion and welfare state attitudes should pick up the opportunities
by experiments and online surveys to test standard variables and often used measurements.
The present paper gave just a short impression of the change an altered measurement of a
classical construct, redistribution demand, yields. Prizing the option the interviewee has to
rate, makes peoples generosity shrink remarkably. Experimenting with frames, information,
expert opinion and "media stories" offers a wide range of possibilities for social policy attitude
research to test reliable measurement methods and to come closer to what the "people really
think".
Recent trends like populism, the electoral success of the Brexit- campaign or of politicians
like Trump who aim at the emotions of voters ("Make America great again") create doubts as
to the correctness of the assumed public opinion as bedrock of democracy. More complex
models of political preferences are required. The paper tried to work in this direction.
16
Appendix
Figure 2: Size of different age groups (in years) in different survey modes
Sources: ESS 2014 - www.europeansocialsurvey.org; GIP Wave 11/ ZA5922, doi 10.4232/1.12617;
GESIS panel April/May 2014 wave bb/ ZA 5665, doi 10.4232/1.12709; population Destatis 2016: .
Figure 3: Education level in different survey modes (2014)
Sources as fig.2; population Datenreport 2016, Tab. 12 Allgemeiner Schulabschl. der Bevölkerung ab
25 Jahre. https://www.destatis.de/DE/Publikationen/Datenreport/Downloads/Datenreport2016Kap3.pdf
Data are not strictly comparable since the different data resources use different age limits. F.e. "popu-
lation" includes people 25+years, the ESS those aged 15 and over, the GIP includes 16+, the GESIS-
panel 18+. The probability of having completed upper secondary education level differs. But only few
are "still pupil".
18.6 6
14.4 17.2 17 16.8 16.8
26
14.2
22.1 22.9 24.4 21.7 22.3
36.5
38.7
37.3 35.5 27.7 31.2 28.8
18.8
41 26.2 24.4 30.9 30.1 32.1
Gesisonline
Gesisoffline
Gesis total GIP 11 ESS14 ALLBUS14 population
size of age groups
18-29 30-44 45-59 60-80
11.2
33.9 18.7 17.4
21.8 36.6
31
36.3
32.8 32.8 34.4
30.4
54.7
24.6
44.8 46.1 40.1
28.7
0
10
20
30
40
50
60
70
80
90
100
still pupil
others
upper secondary
lower secondary
basic (Hauptschule)
without
17
References
Almond, Gabriel A./ Verba, Sidney (1963): The Civic Culture. Political Attitudes and Democracy in Five Nations. Princeton: Princeton University Press.
Ansolabehere, S./ Schaffner, B.F. 2012. Does Survey Mode still matter? Findings From a 2010 Multi Mode Comparison. http://ssrn.com/abstract=1868229
Armingeon, Klaus/ Giger, Nathalie. 2008. Conditional Punishment: A Comparative Analysis of Elec-toral Consequences of Welfare State Retrenchment in OECD Nations, 1980-2003. West European Politics 31(3): 558-580.
Bartels, L.. 2003a. Is "popular rule" possible? Polls, political psychology, and democracy. Brookings Review summer 2003.
Bartels, L.. 2003b. Democracy with Attitudes. S. 48-82. In: MacKuen, M./ Rabinowitz, G. (Hrsg.), Elec-toral Democracy. University of Michigan Press.
Bartels, L.. 2005. Homer gets a tax cut. Inequality and Public Policy in the American Mind. Perspec-tives on Politics 3: 15-32.
Bartels, L.. 2008. Unequal Democracy. The Political Economy of The New Gilded Age. Princeton Uni-versity Press.
Benabou, Roland/ Tirole, Jean (2006). Belief in a Just World and Redistributive Politics. Quarterly Journal of Economics 212: 699-746.
Bieber, I. E./ Bytzek, E.. 2012. Online-Umfragen: Eine geeignete Erhebungsmethode für die Wahlfor-schung? Ein Vergleich unterschiedlicher Befragungsmodi am Beispiel der Bundestagswahl (2009). Methoden-Daten-Analysen 6(2): 185-211.
Blom, A. 2015 in Al Baghal, Tarek (ed.) Understanding Society. Results from Methodological Experi-ments. Working Paper Series 2015-03.
Blom, Annelies G.; Bossert, Dayana; Funke, Frederik; Gebhard, Franziska; Holthausen, Annette; Krieger, Ulrich; SFB 884 'Political Economy of Reforms' Universität Mannheim (2014): German In-ternet Panel, Wave 1 - Core Study (September 2012). GESIS Data Archive, Cologne. ZA5866 Data file Version 1.0.0, doi: 10.4232/1.12107
Blom, A. G./ Bosnjak, M./ Cornilleau, A./ Cousteaux. A.-S./ Das, M./ Douhou, S./ Krieger, U.. 2016. A Comparison of Four Probability-Based Online and Mixed-Mode Panels in Europe. Social Science Computer Review February 34(1): 8-25.
Brooks, Clem/ Manza, Jeff. 2006. Social Policy Responsiveness in Developed Democracies. American Sociological Review 71: 474-494.
Brooks, Clem/ Manza, Jeff. 2007. Why Welfare States Persist. Chicago. University of Chicago Press. Burstein, P.. 1998. Bringing the Public Back In: Should Sociologists Consider the Impact of Public
Opinion on Public Policy? Social Forces 77(1): 27-62.
Campbell et al. (1960): The American voter. New York: John Wiley & Sons, Inc..
Chong, D./ Druckman, J.N. (2007), ‘Framing theory’, Annual Review of Political Science 10: 103–126.
Converse, Philip E. (1964). The nature of belief systems in mass politics. In D. E. Apter (ed.), Ideology,
and discontent (Vol. 5, pp. 206–261). New York: Glencoe Free Press.
Cruces, G./ Perez-Truglia, R./ Tetaz, M.. 2013. Biased perceptions of income distribution and prefer-ences for redistribution: Evidence from a survey experiment. Journal of Public Economics 98(C): 100–112.
Druckman, J. N. 2004. ‘Political Preference Formation: Competition, Deliberation and the (Ir)relevance of Framing Effects’, American Political Science Review 98, 671–86.
Duch, R. M./ Sagarzazu, I.. 2014. Crisis Perceptions and Economic Voting Among the Rich and The Poor. S. 224-265. In: Bartels, L./ Bermeo, N. (eds.). Mass Politics in Tough Times. Oxford UP.
Dupuy, C./ Van Ingelgom, V.. 2014. Social Policy, Legitimation, and Diverging Regional Paths in Bel-gium. 198-222. In: Kumlin, S./ Stadelmann-Steffen, I. (Hrsg.). How Welfare States Shape the Demo-cratic Public. Policy Feedbacks, Participation, Voting and Attitudes. Cheltenham.
Emmenegger, P./ Marx, P./ Schraff, D.. 2015. Labour market disadvantage, political orientations and voting: How adverse labour market experiences translate into electoral behavior. Socio Economic Review 13 (2): 189-213.
Engelhardt, C./ Wagener, A.. 2014. Biased Perceptions of Income Inequality and Redistribution. CE-Sifo WP 4838.
Elmelund-Præstekær, Christian/ Emmenegger, Patrick. 2013. Strategic re-framing as a vote winner: Why vote-seeking governments pursue unpopular reforms. Scandinavian Political Studies 36: 23–42.
Faas, Torsten/ Schoen, Harald. 2006. Putting a Questionnaire on the Web is not Enough: A Compari-son of Online and Offline Surveys Conducted in the Context of the German Federal Election 2002.
18
Journal of Official Statistics 22(2): 177-190. Finch, J./ Mason, J.. 1991. Obligations of Kinship in Contemporary Britain: Is there normative agree-
ment? British Journal of Sociology 42 (3): 345-367. Fong, C.. 2001. Social preferences, self-interest, and the demand for redistribution. Journal of Public
Economics, 82(2):225-246. Frech, E./ König, T./ Osnabrügge, M.. 2015. Öffentliche Unterstützung für Reformen und ihre Stabilität
in Zeiten der Eurokrise – eine experimentelle Untersuchung der Wirksamkeit von Gegenargumen-ten. Zeitschrift für Politikwissenschaften 25: 219-245.
Gallego, Aina. 2016. Inequality and the erosion of trust among the poor: experimental evidence. So-cio-Economic Review .
Gelissen, J. (2000): Popular support for institutionalised solidarity: a comparison between European welfare states. International Journal of Social Welfare 9: 285-300.
Giger, Nathalie/ Nelson Moira. 2010. The Electoral Consequences Of Welfare State Retrenchment: Blame Avoidance Or Credit Claiming in The Era of Permanent Austerity? European Journal of Politi-cal Research 50: 1-23
Giger, N.. 2011. Is Social Policy Retrenchment Unpopular? How Welfare Reforms Affect Government Popularity. European Sociological Review 28(5), 691-700.
Giger, Nathalie/ Nelson, Moira 2013: Welfare or the Economy? Preferences, Constituencies and Strategies for Retrenchment. European Sociological Review 29(5): 1083-1094.
Gilens, Martin. 2005. Inequality and Democratic Responsiveness. Public Opinion Quarterly 69 (5): 778-796.
Gilens, Martin. 2012. Affluence and Influence. Economic Inequality and Political Power in America. Princeton N.J. Princeton UP and Russell Sage Foundation.
Goerres, Achim and Karlsen, Rune and Kumlin, Staffan. 2016. Under Pressure: Argumentative Pat-terns of Pressures and Opportunities for Welfare State Reforms in Three Affluent Welfare States. Available at SSRN: http://ssrn.com/abstract=2330897 or http://dx.doi.org/10.2139/ssrn.2330897
Green-Pedersen 2001: The Puzzle of Dutch Welfare State Retrenchment. West European Politics 24(3)135-50.
Hochschild, J. L.. 1979. Why the dog didn't bark. Income, Attitudes, and the Redistribution of Wealth. Polity 11 (4): 478-511.
Huber, Evelyn/ Stephens, John D. (2001): Development and Crisis of the Welfare State: Parties and Policies in Global Markets. Chicago: University of Chicago Press.
Jaeger, M.M. (2006a) ‘Welfare Regimes and Attitudes towards Redistribution: The Regime Hypothesis Revisited.’ European Sociological Review 22, 157-170.
Kangas, O.E. (2003): The grasshopper and the ants: popular opinions of just distribution in Australia and Finland. The Journal of Socio-Economics 31:721-743.
Kangas, O.E./ Niemelä, M./ Varjonen, S.. 2013. When and Why do Ideas Matter? Influence of Framing on Opinion Formation and Policy Change. European Political Science Review: 1-20.
Karadja, M./ Mollerstrom, J./ Seim, David (2014): Richer (and Holier) than Thou? The Effect of Rela-tive Income Improvements on Demand for Redistribution. IFN Working Paper No. 1042, Research Institute of Industrial Economics.
Kitschelt, H. 2001: Partisan Competition and Welfare State Retrenchment: When Do Politicians choose unpopular Policies? Pp. 365-302 in Pierson (ed). The New Politics of the Welfare State. Oxford UP.
Krömmelbein, S., Bieräugel, R., Nüchter, O., Glatzer, W., & Schmid, A. (2007). Einstellungen zum Sozialstaat. Opladen/Farmington Hills.
Kuklinski, James H., Paul J. Quirk, Jennifer Jerit, David Schwieder, and Robert F. Rich. 2003. “Misin-formation and the Currency of Democratic Citizenship.” Journal of Politics 62 (3): 790–816.
Kumlin, Staffan/ Steffen-Stadelmann, Isabell. 2014. How Welfare States Shape the Democratic Public. Policy Feedback, Participation, Voting, and Attitudes. Northampton.
Kuziemko, I./ Norton, M.I./ Saez, E./ Stantcheva S.. 2015. How Elastic are Preferences for Redistribu-tion? Evidence from Randomized Survey Experiments. American Economic Review 105 (4): 1478-1508.
Larsen, Christian Albrekt. 2008. The political logic of labour market reforms and popular images of target groups. In: Journal of European Social Policy 18(1): 50-63.
Linos, K./ West, M. (2003) ‘Self-interest, Social Beliefs, and Attitudes to Redistribution. Re-addressing the Issue of Cross-National Variation.’ European Sociological Review 19, 393-409.
Mau, Steffen (2004) ‘Welfare Regimes and the Norms of Social Exchange.’ Current Sociology 52, Meltzer, Allan H./ Richard, Scott F. (1981). A Rational Theory of the Size of Government. In: The
Journal of Political Economy 89 (5). 914-927.
19
Naumann, Elias (2014): Raising the retirement age: retrenchment, feedback and attitudes. Pp. 223-243 in Kumlin/ Stadelmann-Steffen (eds.).
Nelson, Thomas E. 2004. Policy Goals, Public Rhetoric and Political Attitudes. The Journal of Politics 66(2): 581-605.
Niehues, Judith (2014): Subjective Perceptions of Inequality and Redistributive Preferences: An Inter-
national Comparison. Paper IZA Bonn.
Norton, Michael I./ Ariel, Dan. 2011. Building a Better America – One Wealth Quintil at a Time. Per-spectives on Psychological Science.
Manow, Philip. 2009. Electoral rules, class coalitions and welfare state regimes, or how to explain Esping-Andersen with Stein Rokkan. Socio-Economic-Review 7: 101-121.
Offe, C. 1987: Democracy against the Welfare State? Structural Foundations of Neoconservative Polit-ical Opportunities. Political Theory 15 (4): 501-537.
Pierson, Paul (1996): The New Politics of the Welfare State. World Politics 48: 143-179.
Rothstein, Bo. 1998. Just Institutions Matter. The Moral and Political Logic of the Universal Welfare State. Cambridge: Cambridge University Press.
Shapiro, Ian. 2002. Why the Poor don't Soak the Rich. Daedalus 131(1): 118-128.
Slothuus, Rune 2007: Framing Deservingness to Win Support for Welfare State Retrenchment. Scan-dinavian Political Studies 30 (3): 323-344.
Svallfors, Stefan (1997) ‘Worlds of Welfare and Attitudes to Redistribution: A Comparison of Eighth Western Nations.’ European Sociological Review 13, 283-304.
Vössing, Konstantin 2015. Transforming Public Opinion about European integration. Elite influence and its limits. European Union Politics 16: 157-175.
Weakliem, David L., Biggert, Robert. 2013. Not asking for much. Public Opinion and Redistribution
from the Rich. Comparative Sociology 12: 66-94.
Wenzelburger, Georg/ Hörisch, Felix 2015: Framing Effects and Comparative Social Policy Reform: Comparing Blame Avoidance Evidence from Two Experiments.
Winter, S./ Mouritzen P.E.. 2001. Why People want something for nothing: The role of asymmetric illusions. European Journal of Political Research 39: 109-143.
Yeager, D., Krosnick, J., Chang, L.C., Javitz, H.S., Levendusky, M.S., Simpser, A., & Wang, R. (2011). Comparing the accuracy of RDD telephone surveys and internet surveys conducted with probability and non-probability samples. Public Opinion Quarterly, 75, 709-747.
Zaller, John R. 1992: The Nature and Origins of Mass Opinion. Cambridge UP.