public disclosure authorized afro-descendants in latin america
TRANSCRIPT

Afro-descendantsin Latin AmericaToward a Framework of Inclusion
Afro
-des
cend
ants
in L
atin
Am
eric
a
Pub
lic D
iscl
osur
e A
utho
rized
Pub
lic D
iscl
osur
e A
utho
rized
Pub
lic D
iscl
osur
e A
utho
rized
Pub
lic D
iscl
osur
e A
utho
rized

Afro-descendantsin Latin AmericaToward a Framework of Inclusion
Latin America and the Caribbean RegionSocial, Urban, Rural and Resilience Global Practice
Poverty and Equity Global Practice
Afro-descendantsin Latin AmericaToward a Framework of Inclusion
Prepared by:Germán Freire
Carolina Díaz-BonillaSteven Schwartz Orellana
Jorge Soler LópezFlavia Carbonari

Afro-descendantsin Latin AmericaToward a Framework of Inclusion
Latin America and the Caribbean RegionSocial, Urban, Rural and Resilience Global Practice
Poverty and Equity Global Practice
Afro-descendantsin Latin AmericaToward a Framework of Inclusion
Prepared by:Germán Freire
Carolina Díaz-BonillaSteven Schwartz Orellana
Jorge Soler LópezFlavia Carbonari

© 2018 International Bank for Reconstruction and Development / The World Bank1818 H Street NWWashington DC 20433Telephone: 202-473-1000Internet: www.worldbank.org
This work was originally published by The World Bank in English as Afro-descendants in Latin America: Toward a Framework of Inclusion, in 2018. In case of any discrepancies, the original language will prevail.
This work is a product of the staff of The World Bank with external contributions. The findings, interpretations, and conclusions expressed in this work do not necessarily reflect the views of The World Bank, its Board of Executive Directors, or the governments they represent.
The World Bank does not guarantee the accuracy of the data included in this work. The boundaries, colors, denominations, and other information shown on any map in this work do not imply any judgment on the part of The World Bank concerning the legal status of any territory or the endorsement or acceptance of such boundaries.
Rights and Permissions
The material in this work is subject to copyright. Because The World Bank encourages dissemination of its knowledge, this work may be reproduced, in whole or in part, for noncommercial purposes as long as full attribution to this work is given.
Attribution—The World Bank. 2018. Afro-descendants in Latin America: Toward a Framework of Inclusion. Washington, DC: World Bank. License: Creative Commons Attribution CC BY 3.0 IGO.
Any queries on rights and licenses, including subsidiary rights, should be addressed to World Bank Publications, The World Bank Group, 1818 H Street NW, Washington, DC 20433, USA; fax: 202-522-2625; email: [email protected].
Editor: John DawsonGraphic Design: Shinny MontesPhotos: Kike Arnal

I was just seven years old,Barely seven years.
Not even seven!I wasn’t even five!
And some voices in the streetYelled at me “black!”
Black! Black! Black! Black! Black! Black! Black!
Am I black? - I asked myself“Yes!”
What is it to be black?
Victoria Santa Cruz
6 | The World Bank
ContentsForeword
Acknowledgments
Abbreviations
Executive Summary
Introduction
Who Is Afro-descendant?
Historical Roots of Race Relations in Latin America
Political, Policy, and Analytic Implications of Being (or Not Being) Afro-descendant Today
Where Do They Live?
Country-Level Distribution of and Access to Services
Afro-descendant Regions
Afro-descendants in Cities
Poverty and Access to Markets
Monetary Poverty
Left Behind
Participation in the Job Market
Yet Optimistic …
Access to Education
Educational Attainment and School Attendance
Discrimination in Educational Settings
Change toward Ethno-racial Inclusion in Education Is Possible
Toward a Framework for Ethno-racial Inclusion
Start with a Good Diagnosis
Design Policies with Clear, Specific, and Measurable Goals
Change the Mental Models that Drive Afro-descendants’ Exclusion
10
12
13
14
27
31
34
45
53
54
60
63
67
68
75
78
82
85
86
90
93
97
99
101
105
106
107
112
114
120
121
122
126
128
130

Afro-descendants in Latin America | 7
Strengthen Afro-descendants’ Voice and Participation
Deepen Regional Knowledge on Critical Areas of Development and Build Repositories of Good Practices and Experience
Appendix A. Visibility of Afro-descendants in Latin American Censuses
Appendix B. LAC Equity Lab Dashboards on Afro-descendants
Appendix C. Confidence Intervals of the Latinobarómetro 2015 for the Subset between Afro-descendant and Non-Afro-descendant (95% CI)
Appendix D. Construction of Afro-descendant Variables from Opinion Surveys
Appendix E. Ethnicity Questions in Censuses
Appendix F. Poverty in Brazil, Ecuador, Peru, Uruguay, Panama, and Colombia, at US$3.2 and US$5.5 a Day
Appendix G. Chronic Poor in Brazil, Ecuador, Peru, and Uruguay, circa 2009–12 and circa 2012–15
Appendix H. Conditional Transition in Brazil, Ecuador, Peru, and Uruguay
106
107
112
114
120
121
122
126
128
130

8 | The World Bank
Figures
19 Figure ES1. Share of Urban Population Living in Slums, by Race
20 Figure ES2. Poverty in 2015, by Race (US$5.5 a Day, 2011 PPP)
22 Figure ES3. Afro-descendant Share of Population Aged 25 Years and Above (General) versus Afro-descendant Share of Population Aged 25 Years and Above with Tertiary Degree
28 Figure 1. Framework for Social Inclusion
37 Figure 2. Racial Fluidity in Colonial Latin America
40 Figure 3. Hernán Cortés y la Malinche, by José Clemente Orozco (1926)
46 Figure 4. Countries Reporting Afro-descendants in Their Censuses
58 Figure 5. Access to Sewerage, Water, and Electricity among Afro-descendant and Non-Afro-descendant Populations
59 Figure 6. Access to Computer, Telephone, and TV by Race (Afro-descendant versus Non-Afro-descendant)
64 Figure 7. Share of Urban Population Living in Slums, by Ethnicity
69 Figure 8. Figure 8. Average Annual Decrease in Poverty between 2005 and 2015
70 Figure 9. Poverty in 2015 by Race (US$5.5 a Day, 2011 PPP)
70 Figure 10. Poverty Trends in Brazil, Ecuador, Peru, and Uruguay (2005–15)
71 Figure 11. Brazil Poverty: Negro and Pardo Populations
73 Figure 12. Increase in Probability of Being Poor if the Household Head Is Afro-descendant Instead of Non-Afro-descendant, Holding All Else Constant
73 Figure 13. Increase in Probability of Being Poor if Afro-descendant Household Head Lives in Rural Area
74 Figure 14. Increase in Probability of Being Poor if Household Is Rural; Separately for Afro-descendant and Non-Afro-descendant Households
74 Figure 15. Decrease in Probability of Being Poor if Afro-descendant Household Is Headed by Male instead of Female
75 Figure 16. Decrease in Probability of Being Poor if Male-Headed Household, for Both Afro-descendants and Non-Afro-descendants
76 Figure 17. Chronic Poverty in Afro-descendant and Non-Afro-descendant Households

Afro-descendants in Latin America | 9
77 Figure 18. Poverty Transitions among Afro-descendants and Non-Afro-descendants
78 Figure 19. Decrease in the Probability of Being Poor if the Afro-Descendant Household Head Completes Primary, Secondary, or Tertiary School
79 Figure 20. Employment Status and Type of Employment among Afro-descendants and Non-Afro-descendants
79 Figure 21. Probability of Working in the Informal Sector Is Higher if the Person is Afro-descendant in Brazil, Colombia, or Uruguay
80 Figure 22. Decrease in Income per Hour for Members of Urban Afro-descendant Households Relative to Urban Non-Afro-descendant Households
81 Figure 23. Decrease in Income per Hour for Members of Rural Afro-descendant Households Relative to Rural Non-Afro-descendant Households
83 Figure 24. Perceptions of Future Economic Situation: Afro-descendants versus Non-Afro-descendants
83 Figure 25. Perceptions of Country’s Economic Situation in Three Years: Afro-descendants versus Non-Afro-descendants
87 Figure 26. Educational Attainment among Afro-descendant and Non-Afro-descendant Household Members
87 Figure 27. Decrease in the Probability of Completing Primary Education if a Person Belongs to an Afro-descendant Household
88 Figure 28. Decrease in Probability of Completing Secondary Education if a Person Belongs to an Afro-descendant Household versus a Non-Afro-descendant Household
89 Figure 29. School Attendance of Afro-descendants in Age Group 6 to 12 Years by Gender
89 Figure 30. Secondary School Attendance of Afro-descendants in Age Group 13 to 17 Years
90 Figure 31. Afro-descendant Share of Population Aged 25 Years and Above (General) versus Afro-descendant Share of Population Aged 25 Years and Above with Tertiary Degree
92 Figure 32. “El Origen de las Razas”
95 Figure 33. Population Aged 18 to 26 in Brazil (Left) and Population Aged 18 to 26 Enrolled in Tertiary Education (Right), by Race, 2002–15
100 Figure 34. “Proudly Afro-Peruvian”—part of a photo and video campaign prepared by the Ministry of Culture of Peru and the World Bank in 2013
103 Figure 35. Certified Quilombolas

10 | The World Bank
24 Table ES1. Ethno-racial Policies Implemented in the Region
35 Table 1. Afro-descendant Population, circa 1800, by Country (% and Total)
38 Table 2. Abolition of Slavery in Latin American Countries
47 Table 3. Approaches for Identifying Afro-descendants, 1980s–2010s
49 Table 4. Aspects Used by Brazilians Aged 15 and Over to Define Their Own Color or Race
55 Table 5. Afro-descendant Population in Latin America (Projected to 2015)
77 Table 6. Average Annual Declines in Poverty Gap Index (FGT1) circa 2005–2015
102 Table 7. Ethno-racial Policies Implemented in the Region
32 Box 1. Morenos
34 Box 2. Creoles, Garifuna, and Miskito
40 Box 3. Racial Democracy
42 Box 4. Blackness and Mexico
44 Box 5. The Changing Meaning of Blackness in Colombia
48 Box 6. Skin Color and Race in Brazil
49 Box 7. Class and Race
56 Box 8. Panama
93 Box 9. Ethno-education
100 Box 10. Fighting Statistical Invisibility in Peru
103 Box 11. Quilombolas’ Long Road to Recognition
61 Map 1. Regions with High Concentrations of Afro-descendants
Tables
Boxes
Map


12 | The World Bank
Foreword
The last two decades have seen a positive shift in the relationship between Latin American societies and their most vulnerable members. Between 2002 and 2012, more than 80 million people were lifted out of poverty, many of them belonging to historically excluded minorities. Afro-descendants represent one of the minority groups that benefited during this period: The historical income gap separating them from other Latin Americans narrowed across the region, and the number of Afro-descendant households living in poverty was drastically reduced. A mix of tailwinds in the region’s economy and the implementation of progressive policies of social inclusion explain much of this change.
Since 2012, however, the region has been going through an economic slowdown that has highlighted the importance of consolidating the social gains of the previous decade. It has also exposed the urgency to take stock of the lessons of the previous decade, to better prepare for the future and to renew the efforts in closing the persisting gaps. One of the lessons learned is that, even amidst times of economic growth, some groups continue to benefit less than others. People may be systematically excluded because of their gender, sexual orientation, race, religion, disabilities, languages, or ethnicity, among others. These are groups typically branded by stigmas and stereotypes, and confronted with structural barriers that prevent their full social and economic inclusion. This hurts not only them, but also the societies and economies of the countries where they live.
Despite the gains of the past decades, Afro-descendants remain one such excluded group – the largest excluded minority in the region.
They account for about one-quarter of Latin America’s population, and are overrepresented among the poor in every country. In Brazil, with the largest Afro-descendant population in the world outside Africa, they are still twice as likely to be poor as white Brazilians. In Uruguay, one of the most egalitarian countries in the region, Afro-Uruguayans are three times more likely to be poor.
Another lesson learned is that Afro-descendants have fewer chances for social mobility. Regionally, they are over 2.5 times more likely to live in chronic poverty than whites or mestizos. Their children are therefore born with unequal opportunities and have disadvantaged access to services and spaces, which limit the development of their full potential and predetermine much of their life. Despite these differences, for much of the 20th century, the association between race and poverty in the region was ignored or neglected. Consciously or not, Latin Americans saw themselves as societies living in different versions of what came to be romantically described by Gilberto Freyre as “racial democracies.”
Owing mostly to the determined work of Afro-descendants, as well as the governments’ growing recognition of the multicultural make-up of their countries, it is increasingly clear today that ethno-racial discrimination exists. Although it most often manifests itself in imperceptible, structural ways, it also does have very palpable consequences for Afro-descendants. Those groups born in households most deprived of economic opportunities and human capital are less likely to escape poverty. That is why excluded groups need special consideration and support, beginning with giving them the necessary space

Afro-descendants in Latin America | 13
Jorge Familiar CalderónVice-PresidentLatin America and the Caribbean Region
Laura TuckVice-PresidentSustainable Development Practice Group
to voice their concerns and needs. It is becoming more and more evident that if we fail to address the causes of structural discrimination, we will not only be perpetuating injustice, but we will also be missing a huge opportunity for all. Eliminating the conditions that limit the full inclusion of Afro-descendants will make Latin American societies more just and egalitarian, as well as more prosperous and resilient. This realization is slowly bringing about change.
One of the first signs of change has been the incremental inclusion of ethno-racial variables in national statistics, which were excluded during the first half of the 20th century. Other important signs include the adoption of numerous policies, including affirmative action, reserved quotas in the job market and educational institutions, awareness campaigns, antidiscrimination legislation, and the emergence of a political class of Afro-descendants. These changes may be too recent to show definitive results or allow for a thorough assessment, but the signs are certainly encouraging. This report would not have been possible even fifteen years ago, as there were not the data to present the reader with an overview of Afro-descendants’ situations and needs.
We, therefore, believe this report comes at the right time. It aspires to make a modest contribution to the discussions that are taking place – and will continue to take place – on this long road to reversing decades of analytic and policy neglect. From the onset, this study was conceived as a first step to better understand the conditions in which Afro-descendants live, taking special care to account for the complexities intrinsic to their study, to consider their heterogeneous situations, and to avoid making sweeping or prescriptive recommendations.
The report is cast within a framework of social inclusion, which is at the heart of the World Bank’s efforts to level the playing field for excluded groups. In this framework, we pay particular attention to improving the opportunities and access to services and markets for excluded groups, in ways that respect their views and aspirations for development. We thus hope the findings of this report will help further the dialogue with governments, academia, multilateral institutions, and, above all, Afro-descendants themselves, to include them as active partners in the development of the region.

14 | The World Bank
Acknowledgments
This study is the joint product of the Latin America and the Caribbean Vice-Presidency, the Social, Urban, Rural and Resilience Global Practice, and the Poverty and Equity Global Practice. The study was conducted by Germán Freire, Carolina Díaz-Bonilla, Steven Schwartz Orellana, and Jorge Soler López. Flavia Carbonari contributed with inputs on crime and violence prevention, and Andrés Castañeda contributed with the design of the datasets used throughout the report. Santiago Scialabba supported the team at various moments over the past year. Leonardo Lucchetti contributed with the estimations of mobility and chronic poverty.
The team worked under the supervision of Jan Weetjens and Oscar Calvo-González, and the guidance of a steering committee composed of Ede Ijjasz-Vásquez, Maitreyi Das, Abel Caamano, Kinnon Scott, Dianna Pizarro, and Jorge Araujo. We thank them for their invaluable advice and support. The Latin America and the Caribbean Vice-Presidency provided the funding for the study; we thank, in particular, Jorge Familiar for his personal involvement and backing.
Judith Morrison and Markus Kostner provided invaluable insights on earlier versions of this work. Harry Patrinos, María Beatriz Orlando, María Dávalos, Erwin De Nys, and Jorge Villegas provided comments and feedback as part of the internal review process. Comments and advice were also received from Gabriela Inchauste, Jesko Hentschel, Humberto López, Carole Megevand, Renata Gukovas, and Alberto Coelho Gomes Costa, which helped improve the document.
The report benefited from a number of activities and an ongoing dialogue between the World Bank and several governments and Afro-descendant organizations. In particular, the team wishes to thank the Platform for the World Conference on Afro-descendants and the Organization for Community Ethnic Development (Organización para el Desarrollo Étnico Comunitario; ODECO), for helping us understand their research priorities in an exchange facilitated by Fabio Pittaluga, in Washington DC, in 2014.
In November 2017, the Bank was invited to participate in the Third International Afro-descendant Colloquium, in Cali, Colombia, where the preliminary findings of the study were presented. We thank Marcia Santacruz and Gilberto Amaya for providing the space to have an open and frank discussion, and to Edwin Álvarez, Cristian Baez, Ariel Tolentino, Sonia Viveros, Karen Vargas, Roberto Rojas, Antonio Yelpi, Carlos Álvarez, Plashka Meade Webster, Miriam Gómez, Jorge Ramírez, Gustavo Lugo, and Yimene Calderón for their comments and feedback.
The photos used throughout this report were taken by Kike Arnal, and form part of the museum exhibition Afro-Peru, prepared jointly by the World Bank and the Ministry of Culture of Peru.
Finally, this study benefited from the outstanding assistance of Ana Gabriela Strand and Erika Salamanca.

Afro-descendants in Latin America | 15
Abbreviations
DANE National Administrative Department of Statistics (Departamento Administrativo Nacional de Estadística)
GDP Gross Domestic Product
IFE Federal Electoral Institute (Instituto Federal Electoral)
ILO International Labour Organization
INCRA National Institute for Colonization and Agrarian Reform (Instituto Nacional de Colonização e Reforma Agrária)
INE National Statistics Institute of Chile (Instituto Nacional de Estadística de Chile)
INM National Institute of Migration (Instituto Nacional de Migración)
IPUMS Integrated Public Use Microdata Series
LAPOP Latin American Public Opinion Project
NSO National Statistical Office
ODECO Organization for Community Ethnic Development (Organización para el Desarrollo Étnico Comunitario)
PCMA Platform for the World Summit on Afro-descendants (Plataforma de la Cumbre Mundial de Afrodescendientes)
pp Percentage Point
PPP Purchasing Power Parity
SEDLAC Socio-Economic Database for Latin America and the Caribbean
SEPPIR Special Office for the Promotion of Racial Equality (Secretaria de Políticas de Promoção da Igualdade Racial)

16 | The World Bank
Executive Summary
About one in four Latin Americans identify themselves as Afro-descendants. They comprise a highly heterogeneous population and are very unevenly distributed across the region. Many of them have little in common today, but they all share a long history of displacement and exclusion. Until a couple of decades ago, they were not regularly included in the statistics of most countries, so their situations and needs remained mostly unknown or ignored. The past two decades, however, have marked the beginning of a remarkable shift from this past. After decades of invisibility, Afro-descendants have been gaining greater recognition and voice, owing to the persistent work of their leaders and representative organizations. This work has translated into the incremental adoption of ethno-racial reforms in many countries, and the increasing inclusion of Afro-descendants in national records and policy debates. The growing recognition of Afro-descendants represents a dramatic break from a past that began with one of the darkest chapters of Latin American history: slavery and its egregious legacy of social exclusion.
The inclusion of Afro-descendants is important in itself, to make Latin American societies more just and equitable, but it is also important for the region. Afro-descendants are disproportionately represented among the poor. In Brazil, Colombia, Ecuador, Panama, Peru, and Uruguay combined, Afro-descendants represent 38 percent of the total population, but about half of all the people living in extreme poverty.1 They also have fewer years of education, and are more often victims of crime and violence. Despite their growing visibility, they are still vastly underrepresented in decision-
making positions, both in the private and in the public sector. They also have fewer chances of social mobility, as they are 2.5 times more likely to be chronically poor. The extent to which Latin America will be able to end extreme poverty and boost shared prosperity will therefore depend, to a very large degree, on their social inclusion. To do so, the region must first understand and visualize Afro-descendants’ needs and agendas, reversing decades of policy and analytic neglect.
The objective of this report is to contribute to this much-needed diagnosis. It offers a first assessment of the data available and a synthesis of some messages in the literature that we think are relevant to move the agenda forward. The region has made tremendous progress over the past two decades in this sense, inserting ethno-racial variables in several statistical tools and producing a rich stock of literature. The report aspires to help connect some of these sources, contributing to create a space for knowledge exchange to better include Afro-descendants.
Who Is Afro-descendAnt?
The study of Afro-descendants faces many challenges, beginning with the lack of agreement on who is and who is not Afro-descendant across and even within countries. The term was first adopted by regional Afro-descendant organizations in the early 2000s, and describes people united by a common ancestry but living in very dissimilar conditions, from Afro-indigenous communities, such as the Garifuna of Central America, to very large segments of mainstream
1 ExtremepovertyisdefinedinthisreportaspeoplelivingonlessthanUS$3.2adayatpurchasingpowerparity(PPP)valuesof2011.

Afro-descendants in Latin America | 17
society, such as the pardos of Brazil. Negro, moreno, pardo, preto, zambo, creole, among many others, are terms much closer to Latin Americans’ understanding of race and race relations. More often than not, these categories have associated stigmas and biases derived from a long history of discrimination and racism. In most countries, the adoption of the term Afro-descendant is still only partial, if at all. In Venezuela,2 the majority moreno (mixed-race) population often rejects the term and its implications, while in the Dominican Republic most mixed-race Afro-descendants prefer to identify themselves as indios.
There are also challenges related to the way African ancestry has been collected and reported in statistical tools. Until recent years, many countries in Latin America rejected the existence of ethno-racial discrimination and discouraged demographic institutes from collecting data on Afro-descendants. This self-imposed color blindness is rooted in liberal ideas of the late nineteenth and early twentieth centuries, according to which the ethno-racial constitution of Latin American societies prevented them from achieving development—a la europea. These views not only stimulated an open-door policy to attract white European migrants across the region, embedded in contemporary theories of eugenics and blanqueamiento (whitening), but also encouraged a bias against reporting the indigenous and African component of their population.
These views blended in during the twentieth century with ideas of mestizaje and racial democracy, which sustained that, owing to the preeminently
mixed-race composition of the population and the anecdotic presence of non-whites in positions of power, Latin American societies had achieved racial equality. As a result, many countries viewed the reporting of Afro-descendants in their statistical records as an encouragement to racism. The practical interpretation of these ideas produced a gradual blackout on the demographic and socioeconomic situation of Afro-descendants regionally, so that by the 1960s only two countries (Brazil and Cuba) still included racial variables in their censuses.
The last 15 years, however, have seen an important shift in this trend, which has gone hand in hand with a greater recognition of the challenges and rights of the Afro-descendant population. Owing mainly to the persistent work of Afro-descendant organizations, many countries have included constitutional provisions concerning discrimination, land rights, and recognition of ethno-racial groups. Others have ratified legal instruments that directly or indirectly safeguard the rights of persons of African descent. Meanwhile, Afro-descendant organizations have started to emerge or become more visible and relevant in national and regional debates.
This greater recognition can be seen in the reappearance of ethno-racial variables in regional censuses. In the 2000s, nearly 50 percent of the region reinserted ethno-racial variables in their censuses, while for the current round of censuses it is estimated that the majority of countries will include them. Though this wave of statistical inclusion and recognition represents a
2 Fullofficialname:RepúblicaBolivarianadeVenezuela.

18 | The World Bank
positive break from decades of invisibility, Afro-descendants still face many political and practical barriers that prevent them from gaining voice and recognition.
The definition of who is and who is not Afro-descendant has become increasingly relevant and contentious in the wake of new legal frameworks protecting Afro-descendants’ rights. These changes spur realignments that can produce new forms of exclusion. With the creation of quotas for Afro-descendants in the job market or the education system, for example, people who were disadvantaged in the past for not being “white enough” now run the risk of being excluded for not being “black enough.”
Given this fluid, context-sensitive, and changing character of ethnic and racial identifications, the safest methodological strategy to study racial inequalities is to assess Afro-descendants’ situations from a variety of angles, using alternative sources and methods to explain the observable patterns. This approach should begin with a nuanced treatment of the data available, and a clear understanding of who is and who is not being reported in official statistics, and why.
In this report, we use the term Afro-descendant to refer to both black and mixed-race Afro-descendants. The quantitative analysis is based on census data from—depending on the analysis—12 to 16 countries, harmonized household survey data from 6 countries, and opinion survey data from 18 countries.3 The report also incorporates quantitative results found in the literature, for example specialized studies on violence and labor participation. The combination of these different sources of data provides a wider array of information and possible cross-validation, and takes advantage of the recent wave of statistical inclusion and recognition.
Based on the latest census data of 16 countries, there were about 133 million Afro-descendants in the Latin America region in 2015, close to 24 percent of the total population. However, their distribution is highly uneven across the region. Over 91 percent are concentrated in Brazil and Venezuela, and a further 7 percent in Colombia, Cuba, Ecuador, and Mexico. The narrative of the region is therefore strongly influenced by countries in the Caribbean rim (Cuba, Venezuela), the Pacific coast (Colombia, Ecuador), and, above all, Brazil. Even if we exclude mixed-race categories, such as pardo and moreno, in Brazil and Venezuela respectively, these areas would still contribute to more than 80 percent of the Afro-descendant population in the region. Brazil, with a projected Afro-descendant population of 105 million people in 2015, has not only the largest share of Afro-descendants in the region, but the second largest in any country in the world (after Nigeria).
The report takes into account that Afro-descendant organizations do not always agree with the official estimates, and countries where Afro-descendant variables have not been included in the census have calculated their own estimates. To the extent possible, these additional sources are included or referenced in the report.
the socIAl InclusIon frAmeWork
We approach the study of Afro-descendants within a framework of social inclusion developed by the World Bank in 2013.4 The interest of the World Bank in social inclusion derives from the empirical evidence that development investment and economic growth produce unequal benefits, with some groups persistently benefiting less than others, or even being adversely impacted. On closer inspection, these groups often share common traits that set them apart from the majority society. People tend to be systematically excluded
3 UsingtheLatinobarómetrodatabaseandtheLatinAmericanPublicOpinionProject(LAPOP).4 WorldBank,Inclusion Matters: The Foundation for Shared Prosperity(Washington,DC:WorldBank,2013).

Afro-descendants in Latin America | 19
because of their gender, sexual orientation, race, religion, disabilities, languages, or ethnicity, among others. These are groups excluded on the basis of their identity. They are typically branded by stigmas and stereotypes, and confront structural barriers that preclude their full participation in their country’s political and economic life. Afro-descendants, in Latin America, are one such group.
Our report starts with the recognition that social exclusion is a complex and multilayered problem. Like other excluded groups, Afro-descendants face cumulative disadvantages, unequal opportunities, and lack of respect and recognition, which produce differentiated social and economic outcomes. Afro-descendant households fare, on average, worse than white ones, for example, but Afro-descendant households headed by women fare worse than those headed by men. Afro-descendants are also presented with unequal opportunities at birth, predetermining much of their life trajectories and setting glass ceilings on their individual and group development.
Lack of recognition or dignity is another crucial layer of exclusion. Latin America has a strong body of laws and international agreements protecting Afro-descendants’ rights, as well as an important number of targeted policies and programs. Yet, discriminatory attitudes and outcomes persist. This is because discrimination is ingrained in informal expressions of everyday life that naturalize ethno-racial hierarchies and reinforce their associated biases—from humor and hiring practices to police and judicial profiling—without individuals even realizing their existence or effects. Thus, while ethno-racial discrimination may appear intangible to most people, it has very palpable consequences for Afro-descendants, penetrating institutions and impairing their access to markets, services, and spaces. Discriminatory representations of Afro-descendants in school textbooks and class dynamics contribute to higher dropout rates, for example, limiting their career choices and employment opportunities later in life.
Social inclusion thus refers to the process of improving the ability, opportunity, and dignity of excluded groups to take part in society. This approach requires going beyond mere poverty or statistical analyses and identifying the underlying causes of exclusion. It is an analytic framework focused on why certain outcomes persist or remain ignored, and why certain groups are overrepresented among the poor or lack equal access to education, health, or job opportunities. Though social inclusion is often related to poverty reduction, it might also be needed in the absence of poverty. Afro-descendants holding tertiary degrees are confronted with glass ceilings that impair their career development, but their exclusion may not necessarily put them at risk of poverty. Social inclusion hence looks at exclusion from a broader, multidimensional perspective. The policy implication of this approach is that the laws and programs aimed at improving the inclusion of Afro-descendants should have an integral understanding of their situations, and be tailored to their specific needs. Narrowly focused or single-minded solutions often fail to account for the multiple factors that preclude the social inclusion of Afro-descendants. The creation of quotas for employment, for instance, can fail to level the playing field in the labor market if the conditions holding back Afro-descendants in the education system are not resolved.
The first step of this approach is, therefore, to have an accurate diagnosis of the needs and aspirations of Afro-descendants. This study seeks to contribute to this much-needed diagnostic by analyzing the existing data and synthesizing some of the relevant messages in the available literature. The study focuses on the areas where Afro-descendants have shown the least progress over the past decade, or where the evidence suggests there is more potential for improving their abilities and opportunities. The main areas singled out for this study—in line with the social inclusion framework of access to spaces, markets, and services—are their territorial distribution at the national,

20 | The World Bank
subnational, and urban levels; their insertion in the labor market; and their inclusion in the education system.
Where do they lIve?
The distribution of Afro-descendants is remarkably similar to that of the rest of the population in most countries. That is, Afro-descendants are predominantly urban, at nearly 82 percent, slightly above the regional average of 80 percent. Thus, in highly urbanized countries such as Argentina, Uruguay, and Venezuela, Afro-descendants show similarly high levels of urbanization. The most outstanding cases are Nicaragua and Panama, where Afro-descendants show a much larger proportion of urban residents than their conationals.
One of the positive outcomes of this high urban concentration is that national disparities in access to basic services (water, sanitation, electricity) are not as pronounced as those of indigenous peoples or other rural vulnerable people, though the situation varies widely across services and between and within countries. These differences, however, cannot be attributed a priori to racial discrimination.
At the subnational level, Afro-descendants tend to be concentrated in some regions and cities more than in others. In most countries, a small number of regions are strongly associated with Afro-descendant culture, even if the majority of Afro-descendants do not necessarily live in these regions. These areas are, invariably, those with the lowest levels of development. They are typically
regions with poor interconnection with the rest of the country and the market, and in general with lower access to public services. Notable examples include northern Brazil, the Pacific coast of Colombia, Esmeraldas in Ecuador, Barlovento in Venezuela, and the Atlantic coasts of Costa Rica, Honduras, Nicaragua, and Panama.
This geographic segregation responds to historical processes of isolation and neglect, but contributes to perpetuating contemporary forms of social exclusion. In Brazil’s northern state of Pará, for instance, where Afro-descendants compose over three-quarters of the population, illiteracy is three times higher than in Santa Catarina, where Afro-descendants represent only 16 percent of the population. Also, while in Santa Catarina access to water is almost universal, in Pará one in four households lack this service.
In cities, Afro-descendants also tend to be relegated to poor neighborhoods. Though a majority of Afro-descendants lives in areas with privileged macroeconomic conditions, such as Caracas, Lima, Montevideo, or Rio de Janeiro, they do not necessarily profit from these conditions. In fact, they are often relegated to areas with poor access to services and jobs, and exposed to higher levels of pollution, crime, violence, and natural disasters. Afro-descendants are about twice as likely to live in slums than non-Afro-descendants in countries such as Brazil, Colombia, Costa Rica, Ecuador, Mexico, and Uruguay (figure ES1). This urban segregation can be much higher at the subnational level—for example, the proportion of the urban population of Pará living in slums is three times that of Santa Catarina.

Afro-descendants in Latin America | 21
In slums, Afro-descendants not only have poorer access to basic services and appropriate housing, but are also more exposed to violence and crime. There are few ethno-racial data on violence outside Brazil, but in Brazil alone up to three in four homicide victims are Afro-descendants.
Poverty And Access to mArkets
The past decade saw a remarkable improvement in the living conditions of many Afro-descendants. They benefited significantly from the general poverty reduction trend of the region. Over 50 percent of Afro-descendant households living on less than US$5.5 a day were lifted out of poverty in Brazil and Uruguay, and more than 20 percent of them in Ecuador and Peru. Also, the probability of being poor, if compared with people living in households with similar socioeconomic conditions, declined significantly across the region.
Yet, the benefits of the so-called “golden decade” were not evenly distributed, and Afro-descendants
benefited less than whites and mestizos, leading to the perpetuation of several gaps and higher-than-average rates of poverty. Thus, although Afro-Peruvians and Afro-Uruguayans saw extraordinary annualized poverty decreases of 7 percent and 10 percent respectively in the 2005–15 period, non-Afro-descendants experienced annualized decreases of 9 percent and 14.5 percent respectively, widening the relative distance between the two groups in each country. The current gaps are in fact considerable. Poverty is over twice as high for Afro-descendants in Brazil and three times higher in Uruguay, and over 10 percentage points higher in Colombia, Ecuador, and Peru (figure ES2).
Being born to Afro-descendant parents in fact increases notably the probability of a child being poor, giving Afro-descendant children an uneven start in life. In Brazil, for example, comparing two households with similar socioeconomic conditions, the probability of being poor increases by about 7 percent if the household head is Afro-
Figure ES1 Share of Urban Population Living in Slums, by Race
Source: National censuses.
Note: The definition of slums is a simplified version of the UN-Habitat definition, determined by the absence of at least one basic public service (water, electricity, sanitation) in urban areas and/or the presence of dirt floors in the household as a proxy for poor construction materials.
“Non-Afro-descendant” does not include indigenous people.
11
34
22
7
30
50
1610
93
1318
13 1512
19
84
16
40
22
5
59
2217
711
0%
10%
20%
30%
40%
50%
60%
70%
80%
90%
100%
Afro-descendant Non-Afro-descendant
2010 2010 2005 2011 2010 2007 2013 2015 2005 2010 2015 2011 2011Argentina Brazil Colombia Costa Rica Ecuador El Salvador Honduras Mexico Nicaragua Panama Peru Uruguay Venezuela

22 | The World Bank
descendant (whether male or female), and 16 percent if the household is rural. Though slightly lower, in Colombia, Ecuador, and Uruguay the probability of a household being poor, for the mere fact that the household head is Afro-descendant, is between 4 percent and 6 percent higher.
Afro-descendants also have lower chances of social mobility. They are 2.5 times more likely to be chronically poor—that is, they were poor at the beginning and at the end of the period under study. In Ecuador, for example, 27 percent of all Afro-descendant households were chronically poor between 2009 and 2012, a period of generalized growth, and 26 percent between 2013 and 2015, a period of economic slowdown. Also, Afro-descendant households experienced smaller transitions out of poverty and larger transitions into poverty than whites and mestizos during both periods.
The poverty trap afflicting many Afro-descendants is further exacerbated by other dimensions, such as the prevailing disparities between rural and urban settings, or those associated with the gender of the household head. Male-headed households are 7 percent less likely to be poor than female-headed households in Brazil, and this probability increased in the past decade (up from 5 percent in 2005).
The persistence of poverty gaps between Afro-descendants and non-Afro-descendants, and the higher tendency of Afro-descendant households to remain poor over time, can be partially attributed to the way Afro-descendants are joining the labor market, where educational attainment and the return they are getting on their investment in education play, of course, crucial roles. Overall, Afro-descendants have higher levels of unemployment in all countries, and among those employed, a larger share of them work in low-skilled occupations.
One of the biggest gaps between Afro-descendants and non-Afro-descendants is in income levels. In many countries, the wage gap actually increases with educational attainment. Comparing workers with the same level of education, age, gender, marital status, experience, sector of work, and household characteristics, but different race, Afro-descendants tend to earn 16 percent less for the same types of jobs in Brazil, 11 percent less in Uruguay, and 6.5 percent less in Peru. They are also confronted with glass ceilings in their career development, representing as little as 0.8 percent of the managers in Uruguay and under 6 percent in Brazil.
Notwithstanding the above, the probability of being poor for Afro-descendant households has been
Figure ES2 Poverty in 2015, by Race (US$5.5 a Day, 2011 PPP)
Source: Authors’ calculations using SEDLAC (CEDLAS and the World Bank).
Afro-descendant Non-Afro-descendant
41
34
29 26
13
2722
18
12
4
0%
10%
20%
30%
40%
50%
Colombia Ecuador Peru Brazil Uruguay

Afro-descendants in Latin America | 23
decreasing over time, and education seems to hold the key to understanding this positive trend. Completing primary education can reduce the likelihood of Afro-descendants being poor by over 9 percent in Brazil, while completing secondary and tertiary education can reduce it by 16 percent and 23 percent respectively. In Colombia, Ecuador, Peru, and Uruguay, completing tertiary education can reduce the likelihood of Afro-descendants being poor by between 21 percent and 31 percent. These results are highly significant, as they hint at the urgency of investing in racially minded policies of educational inclusion, to break the cycle of chronic poverty afflicting a disproportionate number of Afro-descendant households.
Access to educAtIon
Over the last few years, Latin America has made tremendous progress in expanding the coverage of the education system—primary and secondary education in particular—to all corners of the continent. Access to primary education is practically universal in much of the region, and access to secondary education has more than doubled since the 1980s. Afro-descendants have benefited substantially from this expansion. The number of Afro-descendants who had not completed primary and secondary education dropped between the last two rounds of censuses. Some countries created or strengthened existent affirmative action programs for higher education, yielding positive outcomes in enrollment and performance. Others passed antidiscrimination laws for education, as well as other measures aimed at incorporating contents of Afro-descendant history, language, and culture into the national curricula. Yet, despite these positive steps, many gaps persist, and education systems continue to exclude Afro-descendants on many levels.
Afro-descendants still have significantly lower levels of educational attainment—64 percent of Afro-descendants versus 80 percent of non-Afro-descendants at primary level. Comparing households with similar socioeconomic conditions,
Afro-descendant children have a lower probability of completing formal education. In Uruguay, for instance, they are 14 percent less likely to complete primary education, and 24 percent less likely to complete secondary education. On the other hand, in Brazil, although the probability of not completing primary education remains high for Afro-Brazilian children compared to non-Afro-descendant children, the gap has been decreasing over time (from 17 percent in 2005 to 9 percent in 2015).
In contrast, the results for secondary education did not undergo strong improvements in the past decade in any country. On the contrary, today the gaps are more pronounced and the probability of completion is much lower (holding all else constant). This is due to the fact that Afro-descendants generally have higher dropout rates. In Colombia, for instance, Afro-descendant children have a higher probability of being below the age-appropriate grade and face a higher likelihood of dropping out. In Uruguay, while the national average of dropouts (ages under 18) is one in three, for Afro-Uruguayans it is two in three.
At tertiary level, the gaps are even wider, and Afro-descendants are underrepresented in every country across the region. Overall, Afro-descendants represent 25 percent of the population aged 25 years and above, yet they account for only 12 percent of those with a tertiary-level degree (figure ES3).
Discrimination plays an important role in explaining some educational gaps and outcomes. Education systems across the region fail to promote the recognition of Afro-descendant identities; on the contrary, they contribute to promoting stereotypical and folklore-driven representations. Lack of public funding, inadequate facilities and class materials, and unsupported faculty are other factors that have been found to limit the performance of Afro-descendant youths and children. Afro-descendant families also face obstacles in covering school-related expenses, including tuition, transportation, and school supplies.

24 | The World Bank
Afro-descendant population 25+ with tertiary degree Afro-descendant population 25+
0%
5%
10%
15%
20%
25%
30%
35%
40%
45%
50%
Argentina Brazil Colombia Costa Rica Ecuador El Salvador Mexico Nicaragua Panama Peru Uruguay
In sum, despite the important improvements of the past decade, the region is not realizing the full potential of education in terms of ethno-racial inclusion.
toWArd A regIonAl frAmeWork for ethno-rAcIAl InclusIon
Throughout this report, we highlight that the social exclusion of Afro-descendants is a complex problem. They constitute a heterogeneous population, so the solutions to their situations cannot be the same everywhere. Policies need to be tailored to the specific conditions of each country, each subregion within a country, and, often, each situation. Consequently, rather than providing specific policy recommendations, the final section of the report focuses on recommendations that we believe should help analyze the situation and design appropriate solutions.
start with a good diagnosisThe design of policies aimed at fostering the inclusion of Afro-descendants must begin with
a good diagnosis. This should account for overlapping disadvantages that prevent the full development of their potential in every setting, situation, and moment of time. The growing disaggregation of data along ethnic and racial lines has been key to developing a sense of the impacts of structural discrimination on Afro-descendants, the areas where they lag behind, and the opportunities and lessons available to close these gaps. The data used throughout this report are only a small fraction of the data compiled and processed by the World Bank in the context of this study. As part of the overall project, the World Bank also created a set of tools (databases and dashboards for data visualization) that provide a wealth of additional information to facilitate further and deeper analysis. These tools are publicly available on the website of the World Bank’s LAC Equity Lab (see appendix B).
Having statistical data is only a first step toward understanding social exclusion. The analysis must go beyond metrics and ask why poor outcomes persist. Innovative and integral
Figure ES3 Afro-descendant Share of Population Aged 25 Years and Above (General) versus Afro-descendant Share of Population Aged 25 Years and Above with Tertiary Degree
Source: National censuses.

Afro-descendants in Latin America | 25
approaches will be needed to disentangle the series of interconnected factors and look for hidden forms of exclusion in the data, such as the statistical distortions produced by underreporting disadvantaged racial categories; or, inversely, the higher adherence among politically motivated youths to darker skin-color categories in the wake of Afro-descendant movements. Shifts in adscription and identity often overturn the expected outcomes. The diagnostic of Afro-descendants’ situations must consider these nonmetric aspects and acknowledge the fluid and context-dependent nature of racial identities.
design policies with clear, specific, and measurable goalsBased on the right diagnosis, countries must focus on the policies that help tackle the specific situations identified. Ethno-racial policies dogmatically adopted tend to yield poor results, because they fail to account for the multiple layers of exclusion holding back Afro-descendant households, or fail to make all the right connections. Affirmative action policies can result in commendable results at tertiary educational levels, but if the gaps affecting Afro-descendant children and youths at primary and secondary levels are not attended to, quota systems have a very low ceiling. Worse, they might fail to benefit the poorest or the most vulnerable. At the primary and secondary levels, more integral approaches are needed to address the causes behind Afro-descendant children’s
exclusion. Very often, the sort of interventions required to help children break the cycle of exclusion do not entail substantial additional government spending, or targeted programs, but rather small modifications or changes in scope in preexisting programs.
The region has experimented over the past three decades with policies that directly or indirectly benefit Afro-descendants, framed within three distinct development and legal sets of policies: (a) policies aimed at asserting the right to cultural difference and self-determination; (b) policies asserting racial equality and nondiscrimination; and (c) policies of general territorial development (nontargeted), which are not usually framed within a discourse on racial equality, but are implemented in underserved areas with high concentrations of Afro-descendants (table ES1). These sets of policies are not mutually exclusive—they often complement each other—but the region needs to have more clarity as to what situations these different policies are meant to address and what can be the expected results. Having a clear framework for ethno-racial policies will help better focus decision making and tailor social inclusion strategies to tackle the real issues holding back Afro-descendants. To achieve that, it is important to first understand the specific situations affecting Afro-descendants, in order to then identify the changes that need to be promoted, and the policies available to achieve them.

26 | The World Bank
ethno-policies Policies of racial equality
territorial development
Referent international frameworks
ILO Indigenous and Tribal Peoples Convention, 1989 (No. 169)
Committee on the Elimination of Racial Discrimination, Durban Programme of Action
Intersectoral policies and agreements
Dominant discourse
Ethnicity, right to difference
Race, right to equal treatment
Development of lagging regions
Target population
Rural Afro-descendant communities, enclaves, and Afro-indigenous minorities
General Afro-descendant population facing structural disadvantages
Afro-descendants living in lagging regions
Type of reforms promoted
Protection and promotion of collective rights
Policies of social inclusion and equal treatment
Multisectoral development
Examples of policies promoted
Territorial rights, political autonomy, community-driven development, ethno-education, consultation and consent in decision making (inclusion of free, prior, and informed consent), cultural recognition, recovery and protection of historical memory, safeguards from development, protection of traditional livelihoods, political quotas for representation, etc.
Affirmative action in education and labor, political engagement and representation, revalorization of Afro-descendant contributions to society, awareness raising, enforcement of antiracist legislation, statistical visibility, access to justice, crime and violence prevention, etc.
Development of infrastructure, inclusion in national education and health systems, connection to markets, housing, etc. (policies aimed at better integrating lagging regions irrespective of race)
Table ES1 Ethno-racial Policies Implemented in the Region
change the mental models that drive Afro-descendants’ exclusionThe region must also address the beliefs and mental models that drive the exclusion of Afro-descendants. There is growing evidence that mental models shape individuals’ perceptions of themselves and the world, influencing not only how they perceive and recognize opportunities,
but also how they act on them (or not). Mental models therefore contribute to social exclusion, and should be the target of policy interventions.
Studies of race relations in schools have shown that the school setting in many Latin American countries duplicates and reinforces traditional asymmetries between whites and Afro-descendants. Racial

Afro-descendants in Latin America | 27
hierarchies existing in the school environment are manifested in myriad ways, including differential probability of receiving verbal praise or criticism, nonverbal practices demonstrating or withholding affection, and pedagogical practices that—consciously or not—reinforce racial stereotypes or the invisibility of Afro-descendants. Tackling these mental models is essential to give content to the expansion of primary and secondary education. A big part of the impact that formal education has on excluded communities lies in the hopes and aspirations that it instills—or fails to instill—in children.
strengthen Afro-descendants’ voice and participationIncreasing Afro-descendants’ voice and participation in decision making is an effective way to fight negative mental models and stereotypes. Recognition rarely happens without pressure from organizations representing excluded social groups. Afro-descendants have a long history of negotiations and political engagement. Pro-Afro-descendant legislation approved throughout the region has been possible only due to the tenacity of Afro-descendant movements. However, to this date, they remain vastly underrepresented in decision-making arenas, in both the private and public spheres, as they encounter numerous obstacles for exercising their political, economic, and cultural rights. The region must make special efforts to erase these obstacles.
The region must also invest more in strengthening the technical and organizational capacities of Afro-descendants through their representative organizations. This is fundamental to help Afro-descendants elaborate and convey a common view of their development needs and aspirations, locally, nationally, and regionally. Latin America has accumulated sufficient experience and knowledge to address many of the gaps described in this study, and do it in ways that respect the identities and dignity of Afro-descendants. But to take advantage of these lessons and knowledge, the region must recognize that Afro-descendants are
indispensable partners on the path of sustainable growth and inclusive prosperity.
deepen regional knowledge on critical areas of development and build repositories of good practices and experienceThe rapid increase in the statistical inclusion of Afro-descendants has been accompanied by an equally rapid expansion of the specialized research and literature. However, much of the relevant research is still limited in scope and breadth to specific countries or populations, and important data and analytic gaps persist in areas critical for Afro-descendants today, such as their health status or the strategies available to fight the wave of crime and violence that afflicts Afro-descendant youths in many countries.
The study of Latin American Afro-descendants is also disconnected from discussions and lessons on social inclusion learned elsewhere, related to the wider African diaspora and other groups excluded on the basis of their ethno-racial identity. A common comparator for Afro-descendant development and policy analyses are indigenous peoples. But this often translates into policy discussions and studies narrowly focused on issues relevant to a minority of rural Afro-descendant communities, which are important arguments in themselves, but fail to account for the needs and views of the majority Afro-descendant population, which is neither rural nor defined by ethnicity. More research is needed to understand the multiple aspects of exclusion that affect Afro-descendants on a broader scale, and draw from experiences elsewhere.
Throughout this report we have highlighted persistent gaps in education and the labor market. Education is the most powerful tool available today to change the terms of inclusion of Afro-descendants in the region, but most countries are failing to take full advantage of its potential. Wage differentials can be largely attributed to discriminatory biases. Yet, the reasons why these glass ceilings persist, despite the progressive legal and policy changes of the last decades, require further attention. Latin America should profit from

28 | The World Bank
the experience accumulated in other regions to incorporate diversity programs and best practices for inclusion in the workplace.
Another aspect of great concern, which was only slightly touched upon in this report, is the much higher incidence of crime and violence among Afro-descendant youths. Although much of the violence experienced by Afro-descendants might be explained by their underprivileged geographic location and their socioeconomic conditions, there is abundant evidence from other regions—especially North America—that racial biases exacerbate these predisposing factors to be victimized by both criminals and institutions (for example, through tougher judicial treatment and excessive use of force by security forces).
Finally, multilateral organizations need to better understand and integrate Afro-descendants’ needs and voices in their operations and policy agendas. Over the past decades, multilateral
development banks, such as the World Bank and the Inter-American Development Bank, have built robust policies and guidelines to safeguard indigenous communities, which not only protect them against the undesired effects of development but seek to mainstream their inclusion—from design through the life cycle of projects—as key partners for development. The same is not true for many Afro-descendant communities, despite representing a large proportion of the most vulnerable people in many countries. Development banks lack a repository of knowledge regarding best practices and critical information on the impact of their portfolios on Afro-descendant communities, as these are not regularly included under safeguards supervision. This not only hampers the banks’ ability to align this segment of the population with their development goals, but also misses the opportunity to profit from the potential contributions of over one-quarter of the Latin American population to their development agenda.

Afro-descendants in Latin America | 29
After a decade of impressive social and economic gains in Latin America, during which more than 80.5 million people were lifted out of poverty and the middle class expanded to over one-third of the population, poverty reduction came to a halt in 2015.5 Income growth even turned negative for households at risk of falling back into poverty (the vulnerable), and increases in unemployment hit poorer households harder.6 In this context, boosting economic growth and protecting the poor and the vulnerable have become regional priorities, to avoid reversals in the social gains of the last decade. The need to better understand who are the poor and the vulnerable also became apparent, and to know why so many Latin Americans were left behind during a decade of exceptional growth.
Part of the challenge the region faces is that poverty and exclusion do not affect all Latin Americans in the same way. Despite benefiting significantly from the gains of the past decade, Afro-descendants still experience higher rates of poverty than the white and mestizo population, have lower levels of education and higher rates of unemployment, and are confronted with glass ceilings in the job market. Politically, too, Afro-descendants remain the most underrepresented minority in the region.7
Together with indigenous peoples, who were the focus of a previous study,8 Afro-descendants give a predominantly ethno-racial face to Latin America’s exclusion. They not only share a common history of subjugation and displacement, but also face enduring forms of discrimination and exclusion.
The inclusion of Afro-descendants is important in itself, to build more equitable, just, and prosperous societies, but it is also important for Latin America as a whole, as they represent almost one-quarter of the regional population (circa 133 million) and a disproportionate share of the poor in many countries. After controlling for education, socioeconomic background, and other factors, Afro-descendants are in fact among the poorest in the region, excluding the indigenous population. In six countries for which there are racially disaggregated income data, they represent 47 percent of the poor and 49 percent of the extreme poor,9 despite comprising only 38 percent of the total population.10 They are also 2.5 times more likely to be chronically poor than whites and mestizos. As shown in a recent World Bank report, the chronically poor have limited income opportunities and smaller returns to assets, so economic growth alone is not sufficient to lift them out of poverty.11
Introduction
5 WorldBank,Social Gains Show Signs of Stagnation in Latin America: Poverty and Inequality Monitoring in Latin America and Caribbean (Washington,DC:WorldBank,2017).The80.5millionpeopleisestimatedfor2002-12usingtheUS$5.5-a-dayglobalpovertyline(2011PPP).
6 Ibid.7 SeeInter-AmericanCommissiononHumanRights,The Situation of People of African Descent in the Americas,11;EdwardTelles,“RaceandEthnicityandLatin
America’sUnitedNationsMillenniumDevelopmentGoals,”Latin American and Caribbean Ethnic Studies2,no.2(2007):185–200;JudithA.Morrison,“SocialMovementsinLatinAmerica:ThePowerofRegionalandNationalNetworks,”inComparative Perspectives on Afro-Latin America,eds.JohnBurdickandDixonKwame(Gainesville,FL:UniversityPressofFlorida,2012).
8 WorldBank,Indigenous Latin America in the Twenty-First Century: The First Decade(Washington,DC:WorldBank,2015).9 PovertyismeasuredinthisreportusingaUS$5.5perdayglobalpovertylineforreference(2011PPP),andextremepovertyusingaUS$3.2perdayglobalpoverty
line(2011PPP).HouseholdsareconsideredpooriftheirpercapitaincomeisbelowUS$5.5perdayandareconsideredinextremepovertyiftheirpercapitaincomeislessthanUS$3.2perday(2011PPP).
10 ThesixcountriesareBrazil,Colombia,Ecuador,Panama,Peru,andUruguay.Althoughlimitedinnumber,thesecountriesaccommodatealmost85percentofthetotalAfro-descendantpopulationintheregion.
11 RenosVakis,JameleRigolini,andLeonardoLucchetti,Left Behind: Chronic Poverty in Latin America and the Caribbean(Washington,DC:WorldBank,2016).

30 | The World Bank
and dignity of Afro-descendants, to enable them to have access to markets, services, and spaces (figure 1).
To bring about change, the first step must be to have an accurate diagnostic of the needs and aspirations of Afro-descendants. Change toward social inclusion needs to go beyond the study of poverty or statistical trends and ask why certain outcomes persist. Asking why “exposes the interlocking, multidimensional nature of chronic deprivation arising from social exclusion, such as discrimination, peer effects, and adverse incorporation, which plays a key role in driving the simple and more readily observable correlates of poverty (lack of schooling, poor health, and constrained labor market returns).”13
The objective of the present study is to contribute to this much-needed diagnostic by analyzing existing
Moreover, the inclusion of Afro-descendants represents a unique opportunity for the region. Afro-descendant households are a large segment of the population in several countries, and they tend to be younger, have more members, and, according to several studies and opinion surveys, hold a more optimistic outlook on the future. The optimism of Afro-descendants is an invaluable asset for the region, as it reflects a desire to improve their situations if provided with the right conditions. It also signals a greater capacity for resilience, acquired through a long history of collective work and struggle, which has contributed to the development of strong community safety nets and a greater sense of hope and progress. Afro-descendants also hold untapped potential to contribute to the technological, cultural, social, and economic growth of their nations, which is hampered by glass ceilings and structural barriers that limit the development of the regional economies where they live.
We approach the study of Afro-descendants through the lens of social inclusion, building on an analytic framework proposed by the World Bank in 2013.12 Like other excluded groups, Afro-descendants face cumulative disadvantages, unequal opportunities, and lack of respect and recognition. They are simultaneously affected by multiple social structures, which interact in complex ways to produce different experiences, social relations, and outcomes. They are also presented with unequal opportunities, which constrain the realization of their full human potential. These inequalities give Afro-descendants an unfair start in life and an unequal footing throughout the life cycle, as opportunities and needs change with age. Lack of recognition or dignity, for its part, creates barriers in access to services, rendering Afro-descendants statistically “invisible,” for example, or exposing them to discriminatory representations of themselves in school systems and health services, among others. Social inclusion therefore refers to the processes of improving the ability, opportunity,
12 WorldBank,Inclusion Matters: The Foundation for Shared Prosperity (Washington,DC:WorldBank,2013),4.13 WorldBank,Inclusion Matters,52.
Figure 1 Framework for Social Inclusion
Source: World Bank, Inclusion Matters.
Ability Opportunity Dignity
Markets
Spaces
LandHousing
LaborCredit
PoliticalPhysicalCultural
Social
Social protectionInformation
ElectricityTransportEducation
HealthWater
Services

Afro-descendants in Latin America | 31
data and synthesizing some relevant messages of the literature on Afro-descendants in Latin America. The study focuses, in particular, on the areas where Afro-descendants have showed least advance over the past decade, or where the evidence suggests there is more potential for improving their abilities and opportunities. The main areas identified for this study are their territorial distribution at the national, subnational, and urban levels (referred to in the social inclusion framework as spaces), their insertion in the labor market (markets), and their inclusion in the education system (services).
The study profits from the tremendous progress made by the region over the past two decades with regard to the visualization of Afro-descendants’ situations and needs. Many national statistical institutes have inserted ethno-racial variables in their censuses and household surveys, and many specialized studies have helped get clarity on the different situations faced by Afro-descendants in every country. This report aspires to help structure the regional debate by connecting some of these sources, thereby creating a space for knowledge exchange to better understand and include Afro-descendants in the development agenda. The final section proposes some analytic and policy areas that may require further work and consideration. This report is hence a first step toward developing strategies tailored to the specific needs and conditions of every country.
The study builds on various activities initiated in 2013, as part of analytic work aimed at updating the World Bank’s understanding of the special needs and points of view of ethno-racial minorities in Latin America. From the outset, this study was
conceived as an opportunity to bring to the fore Afro-descendants’ own goals and strategies of development. Consequently, between 2014 and the present, the World Bank has engaged with Afro-descendant representatives and scholars, governments, and international organizations.14 In these exchanges, Afro-descendant represen-tatives have highlighted over and over the need to increase the visibility and understanding of Afro-descendants’ situations and special needs, particularly with regard to their exclusion from critical policy debates.
This work coincides with the United Nations International Decade for People of African Descent 2015–2024 (hereafter the International Decade) and aims to inform the policy debates that will contribute to achieving recognition, justice, and development, as proclaimed by the United Nations General Assembly. The data analyzed here cover the period 2005–15, matching the results of the study with the beginning of the International Decade. We hope the findings of this study will serve as a point of reference for subsequent assessments of progress toward the objectives of the decade.
This study follows the publication of a previous report on the status of indigenous peoples in Latin America, which showed important and persistent welfare and opportunity gaps between them and the rest of the population.15 Here, we show that Afro-descendants also face lower levels of well-being, access to basic services, and opportunities across the region. In this report, we attempt to determine the size of these gaps and some of the drivers behind them. Most comparisons are drawn against the white and mestizo16 population,
14 Severalknowledgeexchangeandengagementactivitiesinformthisreport.InMay2014,theWorldBankmetwiththePlatformfortheWorldSummitonAfro-descendants(PlataformadelaCumbreMundialdeAfrodescendientes;PCMA)andtheOrganizationforCommunityEthnicDevelopment(OrganizaciónparaelDesarrolloÉtnicoComunitario;ODECO),todesignacommonagendaforcooperation.InApril2015,ahigh-levelexchangewithgovernmentrepresentativesfromColombia,CostaRica,PanamaandUruguaywasorganizedinWashington,DC,chairedbytheregionalvicepresidentoftheLatinAmericaandtheCaribbeanRegion. InDecember 2015, theWorld Bank participated in a symposium on the state ofAfro-descendantmovements in LatinAmerica, hosted byHarvardUniversity.Inparallel,in2014,theWorldBankdevelopedaseriesofactivitiesaimedatimprovingthevisibilityoftheAfro-descendantpopulationinPeru,andiscurrentlydevelopingasimilaragendawiththeAfro-descendantDirectorateoftheHumanRightsSecretariatofArgentina.Finally,inNovember2017,theBankparticipated in theThird InternationalAfro-descendantDialogue, inCali,Colombia,where representatives of 21 LatinAmerica and theCaribbean countries,threeAfricancountries,Spain,andFrancedebatedontheprogressandchallengesfortheremainderoftheInternationalDecadeforPeopleofAfricanDescent.At this event, theBank presented the preliminary results of this study,whichwere discussedand commented on byAfro-descendant representatives.Theirrecommendationsareincorporatedinthisreport.Aseriesoffollow-upexchangeshasbeenscheduledfor2018.
15 WorldBank,Indigenous Latin America in the Twenty-First Century.16 MestizoisgenerallyunderstoodinLatinAmericaasapersonofwhiteandindigenousdescent,acategoryrelevanttodescribealargesegmentofthepopulationin
countriessuchasEcuador,Guatemala,MexicoorPeru.ThetermislessrelevantandmightcreateconfusionincountriessuchasBrazilorVenezuela,wheremostmiscegenationtookplacebetweenwhitesandpeopleofAfricanorigin.Followingconventionalwisdom,throughoutthisreportweusethetermmestizotorefertopeopleofmixedwhiteandindigenousdescent,andmixed-racetorefertopeopleofmixedAfricandescent.

32 | The World Bank
which is, in general, the wealthier segment of Latin American societies. We have also excluded anglophone and francophone Caribbean countries for two main reasons: the first is the lack of disaggregated or accurate data along racial lines in many Caribbean islands; the second is the relative composition of several island states, such as Haiti and St. Lucia, which makes the status of Afro-descendants in those countries more dependent on national and international processes than on race relations or internal dynamics of social exclusion, which are the focus of this study. Also, the histories and sociocultural formation of Caribbean island states make them very different from most Latin American countries, including Spanish-speaking Caribbean islands, which established very different relations with slavery and with race after emancipation.17 The authors are aware of the importance of the Caribbean for understanding the historical and current patterns of Afro-descendants in Latin America, but also recognize that the situation of Afro-descendants in non-Spanish Caribbean countries merits a more robust undertaking. We hope this first assessment centered on Latin America can set the groundwork for future work in the Caribbean.
The study of Afro-descendants faces several challenges that have been taken into account in this report, not least a statistical blackout between the 1940s and the beginning of the current century, during which time racial variables were excluded from all but two national censuses (Brazil and Cuba). The term Afro-descendant is in itself complex (adopted by regional Afro-descendant organizations in the early 2000s), as it describes social groups living in conditions as dissimilar as Afro-indigenous societies, such as the Garifuna in Central America, and large social groups, such as the pardos of Brazil. It also describes people living in historically secluded rural enclaves, such as the Palenque de San Basilio in Colombia, and large and well-integrated urban populations, such as those of Salvador de Bahía in Brazil or Esmeraldas in Ecuador.
The study pays special attention to this diversity of situations, as well as to the differential weight Afro-descendants have in each country and across the region. Although Afro-descendants are present in every country in Latin America, over 98 percent of them are concentrated in Brazil, Colombia, Cuba, Ecuador, Mexico, and Venezuela. The narrative of the region is strongly influenced by countries in the Caribbean rim (Cuba, Venezuela), on the Pacific coast (Colombia, Ecuador), and, above all, by Brazil, which concentrates the second-largest Afro-descendant population in the world (after Nigeria) and, therefore, often drives the results of the statistical analysis. For this reason, the study focuses on country-specific data and attempts to show a range of findings from several alternative perspectives.
Knowing that the social exclusion of Afro-descendants is a multilayered problem, and that they are a highly heterogeneous population, the study proposes that the solutions to their situations cannot be the same everywhere, and rather need to be tailored to the specific conditions of each country, each subregion within a country, and, often, each situation in particular. Given the scope of our research, the report proposes a framework to organize and think of the myriad options available, rather than making specific recommendations, based on the experience accumulated by the region to date and the data available.
Regardless of the solutions devised by each country, the participation of Afro-descendants themselves in the design, implementation, and assessment of the policies aimed at closing racial gaps in the region is essential. Experience at the World Bank and elsewhere shows that only through strong voice and participation can ethno-racial minorities establish a productive dialogue with the majority society, which will help the region reverse the egregious legacy of decades of neglect and centuries of oppression.
17 Besideslanguagedifferences,colonial islandstateswerenotgovernedbythecasta systemofsocialstratification,forexample,andmiscegenationwasnotadeterminantforsocialmobilitytotheextentthatitwasforSpanishandPortuguesecolonies.HistoricallandmarksinSpanish-andPortuguese-speakingcountries(forexample, independence, federalwars,spreadofmestizo ideologies,consolidationofdemocracies)havealsofolloweddifferentcyclesandpatterns intheCaribbean.

Who Is Afro- descendant?

34 | The World Bank
The term Afro-descendant is of relatively recent use in Latin America. It was first adopted in an official declaration in 2000, by Latin American and Caribbean representatives gathered at the Regional Conference against Racism, in Santiago, Chile. The conference was convened to articulate the regional agenda in advance of the World Conference against Racism, held in Durban, South Africa, the following year. Although Afro-descendant refers to people of the African diaspora, in general, in the Americas it is primarily associated with the descendants of Africans brought to the continent from the sixteenth to the late nineteenth centuries to serve as slave labor in plantations, mines, factories, and houses of the white and mestizo elites.
The term Afro-descendant encompasses a variety of other terms, which describe local and national perceptions of race. Negro, moreno, pardo, zambo, cimarrón, mulato, tercerón, preto, and creole, among many others, are terms much closer to Latin Americans’ understanding of race and race relations. Most of these racial categories denote people’s perceptions of race and miscegenation, rather than group identities, and more often than
not have attached stigmas and biases derived from a protracted history of discrimination and racism. These perceptions are not only (or primarily) informed by physical appearance or skin color. Identifying with, or being ascribed to, a specific category is driven by many social factors, such as social class, culture, family origin, personal choice, life history, and discrimination, among others.18 The palette of terms describing different gradations of miscegenation is the result of a complex history of racial relations in the region, which began during the colonial period but continued to evolve to present times.
In this report, we use the term Afro-descendant to refer to both black and mixed-race Afro-descendants. However, the authors are aware that the term Afro-descendant itself has taken on different interpretations across the region. In Venezuela, for example, the majority moreno population does not usually recognize itself as Afro-descendant, an association locally reserved to describe people with the darkest skin tones (negros) or people living in black enclaves along the Caribbean coast, such as the coastal region of Barlovento (box 1).
18 PeterWade,Race and Ethnicity in Latin America(London:PlutoPress,1997).
Box 1 | Morenos
Venezuela is a good example of the challenges the study of Afro-descendants faces in terms of finding unified or comparable criteria of identification across national borders. According to the last census (2011), about 50 percent of Venezuelans identify themselves as morenos, a racial category describing a person of African descent with lighter skin pigmentation than those considered negro/negra or afrodescendiente. Moreno is a category often used to soften the discriminatory implications of identifying a person as black or Afro-descendant.
Though unambiguously Afro-descendants in origin and in many cultural traits, morenos have in fact a long history of participation and influence in Venezuelan politics, which began with their decisive involvement in the independence war—contributing to shattering the colonial social order—and peaked with the beginning of the current democratic period (1959), when the vote of the moreno majority became crucial in decision making and electoral processes. Late President Hugo Chávez identified himself as moreno regularly, and Acción Democrática, a dominant political party throughout the second half of the twentieth century, was often led by and regularly identified as a party of the moreno majority, “the party of the people.”
As such, though whites enjoy a privileged socioeconomic position in Venezuelan society,19 morenos are not necessarily a social minority, as they have historically had ample access to instances of power and decision making. This is not the case for negros and afrodescendientes, who are in general in a much more disadvantaged position and tend to be relegated to poor enclaves along the Caribbean coast. In this sense, morenos do not have many equivalents among the Afro-descendant population of Latin America, in terms of their social and political influence.

Afro-descendants in Latin America | 35
19 WinthropR.Wright,Café con Leche: Race, Class, and National Image in Venezuela(Austin:UniversityofTexasPress,1990).20 ComisiónEconómicaparaAméricaLatinayelCaribe,Situación de las personas afrodescendientes en América Latina y desafíos de políticas para la garantía de
sus derechos(SantiagodeChile:ComisiónEconómicaparaAméricaLatinayelCaribe,2017),57.21 OthersliveontheColombianislandsofSanAndrésandProvidencia.22 Universidad de lasRegionesAutónomasde laCostaCaribeNicaragüense,Pueblos originarios y afrodescendientes de Nicaragua. Etnografía, ecosistemas
naturales y áreas protegidas(nodate).23 MarkAnderson,“WhenAfroBecomes(like)Indigenous:GarifunaandAfro-IndigenousPoliticsinHonduras,”Journal of Latin American and Caribbean Anthropology
12,no.2(2007):384–413.24 Since1995,theGarifunahavebeengrantedindigenousstatusinGuatemalaundertheAgreementonIdentityandRightsofIndigenousPeoples(AcuerdoSobre
IdentidadyDerechosdelosPueblosIndígenas).SeeJudithMorrison,AdamRatzlaff,MarcoRojas,MiguelJaramillo,CesarLins,andMaríaOlgaPeña,Counting Ethnicity and Race: Harmonizing Race and Ethnicity Data in Latin America (2000–2016) (Washington,DC:Inter-AmericanDevelopmentBank,2017).
Box 2 | Creoles, Garifuna, and Miskito
In Nicaragua, about 88 percent of the Afro-descendant population is located in the autonomous regions of the north and south Caribbean coast (mostly in the latter). The high concentration of Afro-descendants is the result of different processes of colonial occupation of the Caribbean during the seventeenth and eighteenth centuries. The Afro-descendant population of the autonomous regions is not homogeneous, but can rather be divided into three main groups: Creoles, Garifuna, and Miskito.
Creoles are descendants of Anglo-Caribbean immigrants (mainly from the West Indies). The British occupation of Jamaica (1655) and St. Vincent and the Grenadines (1763) led to an influx of enslaved African workers to support the sugar economy, many of whom fled to the Nicaraguan and Honduran coasts, where they established autonomous communities.20 The current Creole population is located along the coastal zone of Nicaragua and Honduras,21 where they speak a form of Creole English. About half of Creole Nicaraguans live in the city of Bluefields, working in agriculture, fisheries, and salaried positions in the public and private sectors.22
The Garifuna are a culturally distinct Afro-descendant group that has a similar status to the indigenous population, and occupy an area spread through Belize, Guatemala, Honduras, and Nicaragua. The Garifuna are descendants of runaway slaves who occupied the island of St. Vincent (after a shipwreck), where they mixed with the Kalinago indigenous population (Caribs) and adopted many indigenous practices—including a Creole Amerindian language (taking a high number of words from Carib/Arawakan languages and a number of European languages), techniques of manioc cultivation, and land tenure systems. Although they initially coexisted with French colonists, they engaged in a series of revolts in the late eighteenth century against British colonial authorities. After losing the war, the Garifuna were resettled by British forces on the island of Roatán (off the coast of Honduras), from where they migrated to the Atlantic coasts of Belize, Guatemala, Honduras, and Nicaragua. Since the 1970s, the Garifuna have mobilized alongside indigenous movements and pressed for the adoption of the International Labour Organization (ILO) Indigenous and Tribal Peoples Convention, 1989 (No. 169), in their countries.23 Currently, they are recognized as an “ethnic group” in Guatemala, Honduras, and Nicaragua.24
There are, also, ethnic groups of African descent in Latin America—that is, people who recognize themselves as Afro-descendants by means of their ethnic identity and not only by their perceived racial characteristics. These societies often descend from runaway slaves who settled in remote areas (such as the palenques or quilombolas) to escape from the abhorrent conditions of slavery. Some of these people mixed with indigenous populations, developing hybrid and unique languages and cultures, such as the Garifuna and the Miskito in Central America (box 2).
Most ethno-racial categories are relational and situational, however, so the boundaries between them are blurred and permeable to various degrees. A person’s social network, economic status, and educational background, among other factors, can determine their own race perception or the way they are perceived by others. Specific situations can make a person shift between one or another category. Categories describing lighter skin color or mixed-race origin, for instance, are often used to soften the discriminatory implications of identifying a person as black or Afro-descendant.

36 | The World Bank
Box 2 | Creoles, Garifuna, and Miskito (continued)
The Miskito are an Afro-Amerindian group resulting from the mixture of Macro-Chibchan indigenous peoples and runaway slaves who settled along the northern Nicaraguan coast.25 Currently, approximately 200,000 people self-identify as Miskito in Honduras and Nicaragua in their respective national censuses. Most Miskito members are English speakers, working in agriculture and fishing (especially in the lobster industry). The Miskito have also mobilized for the protection of their indigenous rights, the promotion of bilingual intercultural education, and the creation of programs for environmental conservation.26
Ethno-racial categories change with social interaction because they refer to perceptions, and context affects perceptions.27
However permeable, throughout this report we will show that ethno-racial categories contribute to creating boundaries between people and groups on the basis of their perceived race, which have lasting effects on their opportunities, ability, and dignity. These boundaries contribute to form hierarchies that can effectively impose limits on or (in the case of whites) boost personal and group development. This is because racial categories have attached ideals, connotations, and rules of interaction that guide individuals in everyday life.28 These boundaries, and the effects they have on the social and economic opportunities of people, are the subject of this report.
hIstorIcAl roots of rAce relAtIons In lAtIn AmerIcA
In his analysis of Afro-Caribbean societies, anthropologist Sydney Mintz noted that the relations different Caribbean societies had established with slavery, the moment when these relations were established, and the intersection between local processes and the global economy
gave rise not only to diverse forms of exploitation, but also to diverse types of societies. The consequences of these histories are visible today in terms of their economic development as well as their current social arrangements, gender relations, worldviews, cultures, and identities.29 This is, of course, also true for Latin America. The processes that began during the colonial era are highly relevant for understanding the heterogeneous configuration of racial relations in the region, the role Afro-descendants play in the national economies and societies, and the way they have been represented and visualized (or not) in national statistics. These are also important to understand the policies of social inclusion targeted at them in recent decades, or the lack thereof.
The historical configuration of race relations is therefore important for understanding the current patterns and perceptions not only of race, but also of racial discrimination. People, after all, interact and create sociality on the basis of past experience and received values.30 In this sense, in the following pages we will review briefly four periods that were particularly formative for race relations in the region, with the intention of unpacking the complexities behind the study of Afro-descendants today, as well as the process
25 UniversidaddelasRegionesAutónomasdelaCostaCaribeNicaragüense,Pueblos originarios y afrodescendientes de Nicaragua.26 ValerieSmith,“HondurasandNicaragua:MiskitoIndians,”inEncyclopedia of the African Diaspora: Origins, Experiences, and Culture,vol.2, ed.CaroleE.Boyce
Davies(SantaBarbara,CA:ABC-CLIO,2008),539–40.27 PeterWade,Race and Ethnicity in Latin America,39;LivioSansone,Blackness without Ethnicity: Constructing Race in Brazil(NewYork:Palgrave,2003).28 TeunA.vanDijk,“RacismandDiscourse,”inRacism and Discourse in Spain and Latin America (Philadelphia:JohnBenjaminsPub.Co.,2005).29 SidneyW.Mintz,“TheCaribbeanasaSocio-CulturalArea,”Journal of World History9,no.4(1966):911–32;SidneyW.MintzandRichardPrice,The Birth of
African-American Culture: An Anthropological Perspective (Boston:BeaconPress,1992).30 WorldBank,Inclusion Matters.

Afro-descendants in Latin America | 37
by which they were erased from statistical records and policy debates until recent times, and the implications of this process for their current struggle for recognition.
slaveryOne of the first traits of Afro-descendants for which to find explanation in the colonial past of the region is their proportion and uneven distribution. It has been estimated that between 5 million and 10 million Africans were forcefully brought to the Spanish and Portuguese colonies between the sixteenth and nineteenth centuries.31 They were brought early on to the colonies to make up for the rapidly decaying indigenous population of Hispaniola (today the Dominican Republic and Haiti), where African slaves were forced to work on sugar plantations. As the colonies expanded to
Mexico, New Granada (Colombia and Venezuela), and Peru from the 1520s onward they were taken there too, to replace an indigenous population affected by the massive impact that Old World diseases had in the New World.32
The scale of the slave trade was such that only fifty years after the establishment of the Spanish colony in Mexico whites were already outnumbered, not only by the native indigenous population but also by the Africans they brought with them.33 Colonial Latin America was, thus, a predominantly nonwhite society, brutally ruled by a small white elite. This trend continued throughout the colony, so that three centuries later, by the early 1800s, Afro-descendants still constituted 67 percent of the population in Brazil, 66 percent in Panama, and 61 percent in Venezuela (table 1).
Table 1 Afro-descendant Population, circa 1800, by Country (% and Total)
country Afro-descendants
free blacks slaves total Ad
Brazil30% 37% 67%
587,000 718,000 1,305,000
Mexico10% >1% ~10%
625,000 10,000 635,000
Venezuela49% 12% 61%
440,000 112,000 552,000
Cuba19% 35% 54%
114,000 212,000 326,000
Colombia31% 8% 39%
245,000 61,000 306,000
Peru3% 3% 6%
41,000 40,000 81,000
31 Duringtheperiodofslavery,Andrewsestimatesthat10timesmoreAfricanswerebrought toLatinAmerica(circa5.7million) thantotheUnitedStates(circa560,000).SeeGeorgeReidAndrews,Afro-Latin America, 1800–2000(NewYork:OxfordUniversityPress,2004).
32 GeorgeReidAndrews,Afro-Latin America; GermánFreire,ed.,Perspectivas en salud indígena: Cosmovisión, enfermedad y políticas públicas(Quito:EdicionesAbya-Yala,2011).
33 ClaudioLomnitz-Adler,Exits from the Labyrinth: Culture and Ideology in the Mexican National Space (Berkeley:UniversityofCaliforniaPress,1992).
continued

38 | The World Bank
country Afro-descendants
free blacks slaves total Ad
Argentina — —37%
69,000
Panama60% 6% 66%
37,000 4,000 41,000
Ecuador7% 1% 8%
28,000 5,000 33,000
Chile — —8%
31,000
Paraguay7% 4% 11%
7,000 4,000 11,000
Costa Rica — —16%
9,000
Uruguay — —23%
7,000
Although not all regions received a proportional number of slaves, they were all subjected to colonial laws of social stratification, known as sistema de castas, which placed nonwhites on an inferior legal and social status. Driven by European ideas of racial purity and blood descent, whiteness was an index of honor and value, which entitled individuals to public office, recognition, and wealth. While racial laws in Spanish and Portuguese colonies tended to be more flexible in practice than in theory, which increased the number of “free blacks” and mixed-race descendants, Afro-descendants were systematically relegated to the bottom of the social scale. They experienced little social mobility and faced extreme forms of deprivation. Ascription to a casta implied not only civil and religious rights, but also determined
aspects of taxation, limits on public and religious office, travel restrictions, and property, among others.
In principle, however, the blood-based ideology allowed certain mobility by means of miscegenation. Individuals of lower castas could “whiten” their descent through intermarriage, watering down their blood-related ascription to lower castas. However, there was a noticeable difference between the mix with Amerindians and that with Afro-descendants. The mix with indigenous blood could result in white descent after three generations, while the same did not hold true for people of African origin. A well-known transformation formula within the casta system prescribed is shown in figure 2.
Source: George Reid Andrews, Afro-Latin America.
AD = Afro-descendant.
— not available.

Afro-descendants in Latin America | 39
Although there was variation across the colonies, the general rule was that, while indigenous admixture leaned toward whitening, black miscegenation leaned back toward mulatto or torna atrás (turn back), so the cycle of subordination was unbreakable. In the attempt to regulate the ever-growing complexity of racial relations, up to 53 such racial categories have been recounted in eighteenth-century Mexico alone, most of them describing the result of miscegenation with several generations of mixed-blood Afro-descendants.34
Interracial unions also took place in the United States of America,35 but in Spanish and Portuguese colonies mixed-race individuals were publicly acknowledged and could move more easily across ethno-racial boundaries. Thus, while racial social hierarchies were never eliminated, there was a higher degree of acceptance of racial mixing.36 The high number of mixed-race categories that
developed during this period explains part of the difficulties of defining ethno-racial groups in the region today, and is the source of most of the folk nomenclature currently used for referring to people of African and mixed-race descent.
The legacy of slavery is manifested today in the intergenerational dimensions of chronic poverty that affect Afro-descendants. While the linkages between slavery and contemporary forms of inequality are not always explicit, it is possible to trace some historical continuity between past forms of oppression and current patterns of territorial segregation and their systematic exclusion in areas such as education, health, housing, employment, and political participation, among others.37 There is, evidently, a link between the point of entry of Africans into the Americas, at the bottom of the social scale, as slaves, and their history of exclusion thereafter.
Figure 2 Racial Fluidity in Colonial Latin America
Source: Mara Loveman, National Colors.
34 MaraLoveman,National Colors: Racial Classification and the State in Latin America(NewYork:OxfordUniversityPress,2014).35 Mixed-racepeoplewererecognizedintheU.S.censusfrom1850to1910—untiltheenactmentofracialsegregationlawsandthewideadoptionofthehypodescent
rule(theso-called“one-droprule”).36 PeterWade,Race and Ethnicity in Latin America.37 InNorthAmerica,somestudieshaveevencomparedthenumerousinstancesofpoliceabuseanddisproportionatenumberofblackpersonswhoareimprisoned
asa“racializedsocialorder,”whoseeffectsareincontinuitywithpriorlawsofracialsegregationandslaverymorebroadly.SeeMichelleAlexander,The New Jim Crow: Mass Incarceration in the Age of Colorblindness(NewYork:NewPress,2010),17.InLatinAmerica,similarparallelscanalsobefoundintermsofAfro-descendants’disproportionateexposuretocrimeandviolence.
Indio Blanco
Mestizo Blanco
BlancoCastizo
Negro Blanco
Mulato Blanco
BlancoMorisco
Torna atrás
Albino
Blanco

40 | The World Bank
theories of blanqueamiento (whitening)By the 1830s, most countries in Latin America had gained independence from the Spanish and Portuguese empires, and the new nations progressively dismantled the colonial system of castas. White elites, however, strove to preserve their privileged status. In most early republics, political participation was reserved for literate wealthy men, for example, which virtually left out of the decision-making process nonwhites and women.38 Blanqueamiento—the set of policies, discourses, and practices built on the idea that white and European elements were superior to African or indigenous ones—was widely adopted during the second half of the century. Influenced by contemporary
theories of eugenics and biological supremacy, blanqueamiento regarded black and mixed-race populations as “inferior races” and, therefore, as impediments for development and progress a la europea. In Brazil, social policies aimed at improving sanitation and working conditions, and regulating access to education and the military, implicitly intended to protect whites from racial “contamination.”39
Even after the abolition of slavery, the negative image of blacks persisted throughout the nineteenth century, even if it was never formally written into law, as in the United States or South Africa. The subjugation of Afro-descendants changed little with the end of slavery (table 2).
Table 2 Abolition of Slavery in Latin American Countries
Source: George Reid Andrews, Afro-Latin America.
country Prohibition of slave trade free womb law final abolition
Dominican Republic 1822 – 1822
Chile 1811 1811 1823
Mexico 1824 – 1829
Uruguay 1825 (1838) 1825 1842
Ecuador 1821 1821 1851
Colombia 1821 1821 1852
Argentina 1813 (1838) 1813 1853
Peru 1821 1821 1854
Venezuela 1821 1821 1854
Bolivia 1840 1831 1861
Paraguay 1842 1842 1869
Cuba 1820, 1835 (1866) 1870 1886
Brazil 1830, 1850 (1852) 1871 1888
38 GeorgeReidAndrews,Afro-Latin America.39 DainBorges,“‘Puffy,Ugly,SlothfulandInert:’DegenerationinBrazilianSocialThought,1880–1940,”Journal of Latin American Studies 25,no.2(1993):235–56.

Afro-descendants in Latin America | 41
The impact of blanqueamiento ideologies on policy making was clearly visible in the immigration policies of the time, which encouraged European migrants to settle in the continent as a means of progressively whitening the population. From 1880 to 1930, Argentina, Brazil, Cuba, and Uruguay received over 11 million European immigrants. By 1925, the Uruguayan government proudly announced that the country was now “totally of European origin,” despite its large Afro-descendant population.40 Other countries, such as Chile, Colombia, Costa Rica, Mexico, Peru, and Venezuela, also passed laws to encourage white immigration with various degrees of success.
Mestizaje and the myth of racial democracyTheories of blanqueamiento started falling into disuse from the 1930s onward, as a result of the emergence of a new paradigm in the racial ideologies sustaining the status quo across the region. Spearheaded by postrevolutionary Mexico, national elites began shifting from ideologies of whitening in favor of narratives that emphasized harmonious race relations, epitomized in the celebration of the mestizo (mixed-blood) composition of the nation. The mestizo identity was adopted as a way of parting from the colonial past and the racial antagonisms of the early republican period. Mestizos combined the alleged liberal and forward-thinking traits of white Europeans, along with the rooted traditions embodied in the indigenous component of the country. Mestizaje spread rapidly across the region, and most countries promoted national mestizo identities as a solution to class and race tensions accumulated after the young republics failed to deliver on their promises to the majority,
mixed-race working population. Mestizaje hence subverted the ideologies that positioned whiteness as a superior category by redefining the mestizo as the quintessential Latin American.
However, national projects of mestizaje were not the same everywhere. Brazil and Cuba incorporated African culture as a central element of their mixed-race identity, while Colombia, Mexico, and Peru emphasized the legacy of their indigenous ancestors. Other countries, such as Argentina, Costa Rica, Panama, and Uruguay, did not adopt mestizaje as national projects.
But mestizaje was not simply a top-down, elite-driven project. It also influenced ethno-racial identities among the common people.41 Public perceptions in Latin America increasingly embraced the notion that all citizens were mixed race. The absence of United States-like segregation laws and the lack of institutionalized racial categories created the sense that Latin American societies lived in racial harmony. Politicians, intellectuals, and artistic elites reiterated the value of racial mixing, synthesized in popular books such as The Cosmic Race,42 The Mansions and the Shanties,43 and Cuban Counterpoint,44 as well as in artistic expressions and the exaltation of hybrid religious expressions, such as Maria Lionza in Venezuela and the Virgin of Guadalupe in Mexico.
By shifting the public perceptions on race and revaluing African or indigenous cultural expressions, mestizaje and ideas of “racial democracy,” as synthesized for the Brazilian case by Gilberto Freyre, marked the beginning of a process of “browning” in Latin America (box 3).45
40 TanyaKateríHernández,Racial Subordination in Latin America: The Role of the State, Customary Law, and the New Civil Rights Response(NewYork:CambridgeUniversityPress,2013),26.
41 PeterWade,“RethinkingMestizaje:IdeologyandLivedExperience,”Journal of Latin American Studies37,no.2(2005):239–57.42 JoséVasconcelos,The Cosmic Race: A Bilingual Edition(Baltimore,MD:JohnsHopkinsUniversityPress,1997).43 GilbertoFreyre,The Mansions and the Shanties (Sobrados e Mucambos): The Making of Modern Brazil (NewYork:Knopf,1963).44 FernandoOrtíz,Cuban Counterpoint: Tobacco and Sugar(NewYork:A.A.Knopf,1947).45 TiannaPaschel,Becoming Black Political Subjects: Movements and Ethno-Racial Rights in Colombia and Brazil(Princeton,NJ:PrincetonUniversityPress,2016).

42 | The World Bank
Mestizaje was not free of contradictions. In some countries, it tended to favor the selective inclusion of indigenous attributes while downplaying African elements. In Mexico, for example, the emphasis on the historical value of white-indigenous miscegenation, and the glorification of an idealized indigenous past, ignored the fact that during the early seventeenth century Mexico was the main importer of slaves in the world.46 Still today, Mexico has a population of about a million and a half Afro-descendants. In the Dominican Republic, with a high concentration of Afro-descendants, the state celebrated European and indigenous Taino cultures, while disavowing blackness as something foreign and associated with neighboring, poorer Haiti.47 This idea still has important consequences in the identification of Afro-Dominicans today, most of whom are counted as indio in the national census, but not as Afro-descendant.
On the other hand, mestizaje was imagined as a path that would lead toward a future of progress and modernity, but that future continued to be associated with whiteness and European-style development. Indigenous peoples and Afro-descendants were routinely associated with the past, the tradition, and the folklore, while whiteness continued to symbolize the modern world to which Latin American societies aspired.
In Mexico, for example, the mix of races was invariably represented by postrevolutionary artists and thinkers as that between an indigenous
Box 3 | Racial Democracy
Gilberto Freyre coined the term racial democracy as a way of depicting Brazil’s racial relations. In his book The Mansions and the Shanties (1936), Freyre claimed that in Brazil segregation was absent, slavery had been more benign, and racial mixing was publicly celebrated. Influenced by renowned anthropologist Franz Boas, Freyre’s book challenged the negative view on miscegenation and made it into a positive, national symbol. He argued that Brazil was deeply divided by class, but not by race. Although subsequent studies debunked many of his claims, his work has been deeply influential in shaping public perceptions about ethno-racial groups and Afro-descendants to the present.
46 TiannaPaschel,Becoming Black Political Subjects;ChristinaA.Sue,Land of the Cosmic Race: Race Mixture, Racism, and Blackness in Mexico(NewYork:OxfordUniversityPress,2013).
47 SeeDavidHoward,Coloring the Nation: Race and Ethnicity in the Dominican Republic(Boulder,CO:LynneRiennerPublishers,2001);KimberlyE.Simmons,Reconstructing Racial Identity and the African Past in the Dominican Republic(Gainesville,FL:UniversityPressofFlorida,2009).
48 MaraLoveman,National Colors.
Figure 3 Hernán Cortés y la Malinche, by José Clemente Orozco (1926)

Afro-descendants in Latin America | 43
woman and a white conquistador (figure 3), a representation that underscores the status of whiteness in a male-dominated view of social and political order. Knowingly or not, theories of mestizaje were emphasizing the higher status of whiteness over other racial contributions to national projects.
In this context, attempts to visualize racial differentiation were increasingly seen as counter to the national discourse of progress and unity, and were often characterized as inciting racism. In accordance, statistical institutes throughout the region started dropping race variables in their censuses and other statistical tools, to the point that by the 1960s only two countries kept reporting on their Afro-descendant population (Brazil and Cuba).48
By promoting color blindness, the idealized worldview of racial democracies contributed to silencing or discrediting critiques of rampant racial inequality.49 For this, Stutzman has called mestizaje the “all-inclusive ideology of exclusion.”50 Mestizaje reinforced the idea that ethno-racial relations in Latin America did not require attention or reform, a view that is still dominant today and constitutes one of the major obstacles hindering the endorsement of policies targeted at Afro-descendants. A recurrent narrative among those opposing affirmative action or Afro-centric policies of development is that these policies create racial divisions where they did not exist before. In 2006, over 114 academics in Brazil signed a “manifesto” opposing race-based affirmative action in Brazilian universities, denouncing it as unconstitutional and an invitation to conflict and intolerance.51 As data presented in this report and in many other studies
show, however, racial mixing did not eliminate racial inequality. At best, it created a space in which racial hierarchies are manifested more subtly, making it harder to identify and challenge them explicitly.
At the bottom end, this process had statistical consequences still palpable in the data analyzed in this report. Afro-descendants living in countries that adopted mestizaje ideologies started ascribing to mixed-race categories, such as moreno and pardo, because these categories offered them a space to escape the stigma of belonging to racial categories that were historically discriminated against, such as negro or preto. Thus, from the 1930s onward, to be a person of African ancestry in Latin America increasingly meant to be “brown,” rather than black.52 In Brazil, for example, the population identifying themselves as blacks in the census declined steadily after the 1940s, while the number of people identifying as mixed race grew in similar proportions. From 1950 to 1980 there was a flux of about 38 percent between the two categories.53
However, if it is true that mestizaje invisibilized social groups that were historically discriminated against (box 4), it also created new spaces and opportunities for change and social mobility. One study found that countries that embraced mestizaje as part of the national project express more tolerance to interracial relations.54 Ideas of mestizaje may in fact support greater awareness of structural discrimination. Hence, mestizaje ideologies can be used as a milieu to imagine equality across ethno-racial boundaries and set goals for racial inclusion.
49 TiannaPaschel,Becoming Black Political Subjects.50 RonaldStutzman,“ElMestizaje:AnAll-InclusiveIdeologyofExclusion,”inCultural Transformations and Ethnicity in Modern Ecuador,ed.NormanE.WhittenJr.
(Urbana,IL:UniversityofIllinoisPress,1981),citedinPeterWade,“RethinkingMestizaje:IdeologyandLivedExperience,”Journal of Latin American Studies 37,no.2(2005),241.
51 TanyaKateríHernández,Racial Subordination in Latin America,154.52 GeorgeReidAndrews,Afro-Latin America,157.53 Ibid.,15754 EdwardTellesandDeniaGarcia,“‘Mestizaje’andPublicOpinioninLatinAmerica,”Latin American Research Review 48,no.3(2013):130–52.

44 | The World Bank
Box 4 | Blackness and Mexico
Mexico is a good example of how mestizo national projects have contributed to invisibilizing Afro-descendants. By the eighteenth century, Mexico had received the largest number of slaves in the Americas (around 200,000), mainly through the port of Veracruz (along the Gulf of Mexico). In colonial Mexico, black communities exceeded the number of white.55 But in spite of the large African diaspora, postrevolutionary Mexican governments promoted an ideology of mestizaje centered on the glorification of the precolonial, indigenous past, and its contributions to the character and potential for development of modern-day Mexico. Blackness was erased from the Mexican national image, both as a separate racial category and as a component of the mestizo population. These notions persisted throughout the twentieth century and, even in 1996, reports submitted on behalf of the Mexican state to the United Nations claimed that racism was nonexistent in the country and that the majority of the Mexican population was mestizo (indigenous and white mixture).56
The current residents of Veracruz, while recognizing the legacy of slavery, struggle with “the reality of the state’s multifaceted connection to blackness with the national narrative, which minimizes and sometimes even erases blackness from the image of the Mexican nation.”57 Given that blackness and Mexicanness have had a contradictory relation, most residents make ambivalent claims over their ethno-racial identities, since “asserting a strong black identity would place their national identity in jeopardy.”58
Therefore, although some residents might identify as black—or recognize their African cultural heritage—they might avoid relating themselves directly to Africa. Analogously, for other veracruzanos, blackness is associated with something foreign (largely with Cuba or African-Americans).
In 2015, the Mexican Intercensal Survey documented 1.38 million Afro-Mexicans, accounting for 1.2 percent of the population. Still, the notion that blackness is somewhat foreign still affects Afro-Mexicans in their everyday lives. Some Afro-Mexican organizations from the state of Oaxaca, another state with a meaningful black population, have reported that Mexican customs officers of the National Institute of Migration (Instituto Nacional de Migración; INM) have detained Afro-descendants and deported them to third countries—Cuba, Haiti, and Honduras—under the suspicion that they were carrying false passports.59 Mexico’s National Commission for Human Rights (Comisión Nacional de los Derechos Humanos), in its recommendation 58/2015, reported 15 cases in which Afro-Mexicans had been mistreated by migration authorities.60
In one incident, two brothers from Santo Domingo Armenta (Oaxaca) were detained by Mexican customs officers in Tijuana. Even though both brothers had their electoral IDs from the Federal Electoral Institute (Instituto Federal Electoral; IFE), which is the most commonly used form of identification in Mexico, the police threatened to deport them to Santo Domingo, Dominican Republic. Both brothers were detained for 15 days in Tijuana before being released to their parents.61
55 ChristinaA.Sue,Land of the Cosmic Race.56 Ibid.,16.57 Ibid.,115.58 Ibid.,125.59 “LosnegrosdeMéxicoquehansido‘borradosdelahistoria,’”BBCMundo,April11,2016.60 “Afromexicanos:Ladiscriminaciónvisible,”Proceso,April1,2017.61 Ibid.

Afro-descendants in Latin America | 45
multiculturalism and the return of blacknessBy the 1980s, as democracies spread through Latin America, Afro-descendant social movements and indigenous organizations pushed for the recognition of their rights as distinct and neglected segments of the population. Pressed by these movements, states began adopting aspects of multicultural citizenship, which favored the recognition of cultural difference and the rights of ethno-racial groups. Even if the gains of the Afro-descendant community have been more modest than those of indigenous peoples,62 the shift to multiculturalism was a watershed for Afro-descendants, because it marked the first time in history that the region engaged them not just as individuals but as a social group bearing collective rights and a common history of displacement and exclusion.63
In the years that followed, the work of Afro-descendant movements led many countries to approve laws protecting the rights of people of African descent, including laws to protect them from all forms of racism and discrimination, as well as the recognition of their land rights and cultural heritage. Meanwhile, new Afro-descendant organizations started to emerge, or became more visible and relevant, in national and regional debates. Together, these realignments began changing the public perception of ethno-racial identities and, especially, the meaning of being black in Latin America. Afro-descendant social movements have challenged negative stereotypes
around blackness and have encouraged mixed-race people to recognize their African roots and heritage. Some governments started acknowledging the disadvantages of ethno-racial groups, while making efforts to counter those asymmetries.64
This reaffirmation of Afro-descendant identities and rights also had a statistical impact on the number of people identifying as mixed race or black. In Brazil, while the population identifying as black had declined steadily since the 1940s, dropping from 15 percent to 5 percent from 1940 to 1991, it has grown back to 7.5 percent in the last decades. Though these demographic fluctuations can be due to changes in data collection techniques, one study argues it is more likely that they indicate a “changing racial classification with growing preferences for the polar categories of black and white.”65
The multicultural turn has not escaped criticism, however, regarding the type of black populations that are recognized versus those that are not, and the policies promoted in light of those perceptions. For example, the creation of reserved quotas for tertiary education in Brazil has prompted disputes over who is entitled—that is, “black enough”—to benefit from the quotas.66 In any case, who is and who is not an Afro-descendant has mutated with these realignments, gradually changing the meaning of being black and Afro-descendant throughout the region (box 5).
62 JulietHooker,“IndigenousInclusion/BlackExclusion:Race,EthnicityandMulticulturalCitizenshipinLatinAmerica,”Journal of Latin American Studies37,no.2(2005):285–310;JulietHooker,“Afro-descendantStrugglesforCollectiveRightsinLatinAmerica:BetweenRaceandCulture,”Souls 10,no.3(2008):279–91.
63 TiannaPaschel,Becoming Black Political Subjects,8.64 TiannaPaschelandMarkQ.Sawyer,“ContestingPoliticsasUsual:BlackSocialMovements,Globalization,andRacePolicyinLatinAmerica,”Souls10,no.3
(2008):197–214.65 EdwardTelles,Race in Another America: The Significance of Skin Color in Brazil(Princeton,NJ:PrincetonUniversityPress,2006),52.66 See“Brazil’sNewProblemwithBlackness,”ForeignPolicy,April5,2017and“OneWoman’sFighttoClaimHer‘Blackness’inBrazil,”ForeignPolicy,July24,2017.

46 | The World Bank
67 Eduardo Restrepo, “Ethnicization of Blackness in Colombia: Toward De-racializing Theoretical and Political Imagination,”Cultural Studies 18, no. 5 (2004):698–753;BettinaNg’weno,“CanEthnicityReplaceRace?Afro-Colombians,IndigeneityandtheColombianMulticulturalState,”Journal of Latin American and Caribbean Anthropology 12,no.2(2007):414–40.
68 TiannaPaschel,“‘TheBeautifulFacesofMyBlackPeople:’Race,EthnicityandthePoliticsofColombia’s2005Census,”Ethnic and Racial Studies36,no.10(2013):1544–63.SeealsoTiannaPaschel,“TheRighttoDifference:ExplainingColombia’sShiftfromColor-BlindnesstotheLawofBlackCommunities,”American Journal of Sociology116,no.3(2010):729–69.
69 TiannaPaschel,“TheBeautifulFacesofMyBlackPeople,”1551.70 Ibid.71 BettinaNg’weno,“CanEthnicityReplaceRace?”
Box 5 | The Changing Meaning of Blackness in Colombia
After independence, there was minimal recognition of black populations in Colombia. Influenced by liberal ideologies, public intellectuals and political leaders stressed the racial mixture and cultural homogeneity of the nation. References to the “black race” were noticeable in relation to communities on the Pacific coast, as well as around cultural expressions of African origin. But, overall, during the first half of the twentieth century, blackness was used as a derogatory term or as a way of referring to poor groups. In fact, racial categories were absent in Colombia’s censuses during this period.
However, the 1991 constitution introduced a number of multicultural reforms. The Constitutional Assembly approved transitory article 55, which eventually led to Law 70 of 1993, recognizing the rights of rural comunidades negras (black communities) of the Pacific coast. Law 70 granted comunidades negras the right to own their collective territory, to maintain their rural-based traditional economies, and to develop in ways that were appropriate to their cultural identity and social practices. It also mandated the inclusion of Afro-Colombian history and culture in public school curricula. Finally, it reserved two seats in the National Congress, and over 300 government positions, for members of comunidades negras. Such constitutional reform was possible due to the activism of Afro-descendant social movements.
Although the constitution was innovative, some observers noted that Afro-descendant rights were framed in ways that resonated with those of indigenous peoples.67 Indigenous peoples, in fact, had gained important legal concessions and political influence. Thus, blackness was imagined as eminently referring to rural communities that were culturally distinct and whose major concerns revolved around land and cultural recognition. The reasons for this shift are multiple. Some point to the influence of black activists, the Catholic Church, and academics who had aligned themselves previously with indigenous movements. Others point to how the Colombian state was more prepared to accept demands that were similar to “indigenous models” of governance.68 The state’s support of this notion of blackness became evident in the census of 1993. The census asked respondents: “Do you belong to an ethnic group, indigenous group, or black community? If so, which one?”69 The idea of belonging to a group or community was incongruent with the experience of the Afro-descendant population living in urban environments or who had mixed-raced identities.70
The recognition of comunidades negras was an important step forward, but it excluded other Afro-descendant groups. For example, urban Afro-descendants who were outside the Pacific coast did not fit into the definition of comunidades negras. Moreover, although Law 70 has been alluded to by Afro-descendants outside the Pacific basin, its use has been restricted for issues pertaining to cultural difference and land rights, and not ethno-racial discrimination and racism.71
In the years following Law 70, black communities outside the Pacific coast contested these ideas of blackness. By the mid-1990s, the Inter-American Development Bank, the World Bank, the Inter-American Foundation, and the United Nations started supporting research on Afro-descendants in the region. In 1996, Brazilian activist Sueli Carneiro coined the term Afro-descendant, and after the 2001 Durban Conference it became widely disseminated in Colombia. In the early 2000s, other multilateral organizations began working with the Colombian National Administrative Department of Statistics (Departamento Administrativo Nacional de Estadística; DANE) on finding strategies to promote greater participation of Afro-descendants.
continued

Afro-descendants in Latin America | 47
72 TiannaPaschel,“TheBeautifulFacesofMyBlackPeople,”1555.73 Ibid.,1557.74 Ibid.,1556.
The participation of organizations that represented urban Afro-descendants pushed for the adoption of a less culturally specific and spatially confined census question. One such organization—Cimarrón—wanted a definition based on “a shared history of slavery and ongoing experiences of racial discrimination, rather than blackness specifically tied to geography or specific cultural practices.”72
The new category of “Afro-Colombian” (which encompassed black, mixed-race, and Afro-descendant) was the result of such negotiations. Combining the cultural and racial elements, DANE defined Afro-Colombians as persons of African descent with unique cultural characteristics. “They share a tradition and preserve their own culture in such a way that reveals an identity that distinguishes them from other groups, regardless of whether they live in rural or urban areas. They are also known under the names of black population, Afro-descendant, among other names.”73 The census question in 2005 changed in consonance, asking respondents if “According to your culture, community, or physical traits … you recognize yourself to be …: (1) Indigenous; (2) Gypsy (Rom); (3) From San Andres and Providencia; (4) Black, Mulatto, Afro-Colombian, Afro-Descendent; and (5) None of the above.”74
Although the results of the 2005 census were criticized by many organizations, 10 percent of the population identified as Afro-descendant. This was significantly higher than in the 1993 census, when only 1.5 percent of the population identified as such, but it was much lower than the estimates of local organizations (around 26 percent). Some claimed that DANE made the mistake of omitting popular categories such as moreno and zambo, and of failing to carry out a more effective media campaign.
Beyond the census results, this case shows how, within a decade, the definition of Afro-descendant changed dramatically in Colombia, due in part to the interaction of experts, activists, and an array of local and international actors.
PolItIcAl, PolIcy, And AnAlytIc ImPlIcAtIons of BeIng (or not BeIng) Afro-descendAnt todAy
The historical configuration of blackness and the changing patterns of ethno-racial classification have contributed to making Afro-descendant a complex category. Afro-descendant populations in Latin America are very diverse culturally, socioeconomically, and racially, encompassing a gamut of possibilities that range from relatively small or secluded social groups—for example, Afro-indigenous societies—to large urban populations. Moreover, the reporting of Afro-descendants is further complicated by political processes of multiple sorts, which can benefit some racial identities over others. As shown above, the spread
of ideas of “racial democracy” led to processes of invisibilization of the Afro-descendant population that started to be challenged only recently. The wave of statistical reinclusion of the last two decades has seen dramatic shifts in the number of people reported as being or not being Afro-descendant, probably owing to improvements in data method techniques, but also to changes in the political or legal context and the work of grassroots activism.
The definition of who is and who is not Afro-descendant also becomes increasingly relevant and contentious in the wake of new legal frameworks protecting Afro-descendants’ rights. These changes spur realignments that shape people’s perceptions and can produce new forms

48 | The World Bank
75 MarisaBucheliandRafaelPorzecanski, “Racial Inequality in theUruguayanLaborMarket:AnAnalysisofWageDifferentialsbetweenAfro-descendantsandWhites,”Latin American Politics and Society53,no.2(2011),137.
76 LeonardoRealesJiménez,“EthnicIdentityandPoliticalMobilization:TheAfro-ColombianCase,”inAfro-descendants, Identity, and the Struggle for Development in the Americas,eds.BerndReiterandKimberlyE.Simmons(EastLansing,MI:MichiganStateUniversityPress,2012):120.
of exclusion. Historically blurred borders turn more rigid with the creation of quotas for Afro-descendants in the job market or the education system. With these shifts, people who were disadvantaged in the past for not being “white enough” now run the risk of being excluded for not being “black enough.”
At the base, Afro-descendants are also in the process of incorporating the implications of ascribing or not to historically stigmatized categories. Including ethno-racial variables in statistical tools is not enough to revert decades or centuries of invisibilization. Afro-descendant organizations and governments must work hard to make the inclusion of these variables relevant. Experience shows that statistical inclusion needs to be accompanied by effective awareness campaigns, to explain the importance of speaking out and ascribing to the ethno-racial categories available to citizens in censuses or other tools. Also, self-ascription is affected by multiple factors, including how ethno-racial questions are worded, which categories are used, who asks the questions, and who answers them.
Given this fluid, context-sensitive, and changing character of ethnic and racial identifications, the safest methodological strategy to study racial
inequalities is to assess Afro-descendants’ situations from a variety of angles and use alternative methods to explain the observable patterns.75 This approach should begin with a nuanced treatment of the data available, and a clear understanding of who is and who is not being reported in official statistics, and why.
Who is Afro-descendant in official statistics?The greater recognition of Afro-descendants in recent decades had an objective manifestation in the reappearance of ethno-racial variables in official statistics throughout the region (figure 4). Hence, while in the 1990s only 2 out of 19 countries reported on their Afro-descendant population in the census (Brazil and Colombia), in the 2000s nearly half of them had reinserted ethno-racial variables, and for the current round (2010–20) most countries will include them (see appendix A). Though this wave of statistical inclusion and recognition represents a positive break from previous decades, Afro-descendants still face many political and practical barriers that prevent them from gaining visibility and voice in national and regional debates. There are also deficiencies in the way the questions are formulated in censuses and household surveys, which tend to affect the overall participation of Afro-descendants.76
Figure 4
Source: Mara Loveman, National Colors.
Countries Reporting Afro-descendants in Their Censuses
18
16
14
12
10
8
6
4
2
01900s 1910s 1920s 1930s 1940s 1950s 1960s 1970s 1980s 1990s 2000s 2010s
Spread of mestizaje ideologies

Afro-descendants in Latin America | 49
Until the 1990s, census questions aimed at identifying Afro-descendants were based on questions of “race” or “color,” in the few countries where they were identified. Indigenous peoples, meanwhile, who were more broadly included in censuses, were mainly identified through questions related to cultural aspects and identity (language, ethnic ascription, among others), which rendered a majority of Afro-descendants invisible, as very few Afro-descendants in the region would self-identify as belonging to an ethnic or indigenous minority—with notable exceptions, such as the Garifuna (see box 2).
From the 1990s onward, however, country censuses began including questions related to individual identity, membership, or sense of belonging to specific ethno-racial groups (table 3). This shift, whether implicitly or explicitly, “conceded the fundamentally inter-subjective basis of ethno-racial distinctions, making a break with objectivist understandings and measures that had prevailed in the past (including questions about race or color and questions about cultural practices).”77
Today, questions identifying Afro-descendants are all based on self-reporting, applying various
Table 3 Approaches for Identifying Afro-descendants, 1980s–2010s
Source: Mara Loveman, National Colors. Notes: A = Afro-descendant identified through ancestry; C = customs; I = identity; M = membership; P = physical appearance; R = race; U = unknown (not yet conducted); (S) = separate census.
1980s 1990s 2000s 2010s
Argentina A, I
Bolivia M
Brazil P P, R P, R P, R
Chile
Colombia M C, I, M, P U
Costa Rica M I
Cuba P P P
Dominican Republic
Ecuador I C, I
El Salvador I
Guatemala M U
Honduras M I, M
Mexico U(S)
Nicaragua M U
Panama I
Paraguay C, I, P
Peru U
Uruguay A
Venezuela A, C, I, P
77 MaraLoveman,National Colors,256.

50 | The World Bank
criteria, including tradition, ancestry, identity, group membership, physical appearance, and race (see appendix E). Though this is in line with international standards, self-reporting of African descent is ultimately down to perceptions, which are affected by several components besides racial ascription or skin color, such as the socioeconomic class of the respondent, regional context, identity, and cultural preferences. Though several studies have attempted to test the influence of these aspects on a person’s racial ascription, the results have
been heterogeneous, and prove that racial identity is socially and historically contingent. Counter to this trend, at least one study has suggested that interviewer classification of race could still be appropriate, because racial inequality is an outcome of racial discrimination, which depends on how others classify a person, and not only on how a person perceives themselves to be.78 The Latin American Public Opinion Project (LAPOP) includes interviewer classification, together with the respondent’s race ascription (boxes 6 and 7).
78 EdwardTelles,“MultipleMeasuresofEthnoracialClassificationinLatinAmerica,”Ethnic and Racial Studies 40,no.13(2017):2340–6.79 EdwardTelles,Race in Another America,87.80 AntonioSérgioAlfredoGuimarães,“TheBrazilianSystemofRacialClassification,”Ethnic and Racial Studies35,no.7(2011):1157–62.The1872censuscreated
fourcolorgroups:branco,caboclo(mixedindigenous-European),negro,andpardo.81 CarlN.Degler,Neither Black nor White: Slavery and Race Relations in Brazil and the United States(NewYork,Macmillan,1971);MarvinHarris,“RaceRelations
inMinasValhas,aCommunityintheMountainRegionofCentralBrazil,”inRace and Class in Rural Brazil,ed.CharlesWagley(Paris:UNESCO,1952).82 AntonioSérgioAlfredoGuimarães,“TheBrazilianSystemofRacialClassification,”1159.83 EdwardTelles,Race in Another America,88.However,95percentofsurveyrespondentsusedonlysixcategories.84 Ibid.
Box 6 | Skin Color and Race in Brazil
According to Edward Telles,79 there are three major systems of racial classification in Brazil: the census categories (branco, pardo, amarelo, preto, and indígena), categories used in everyday life (which include fluid terms such as moreno), and the categories that are being promoted by black social movements (such as the widespread adoption of negro).
In Brazil, it is more common to use the term côr (color) than race when referring to ethno-racial groups. “Color is often preferred because it captures the continuous aspects of Brazilian racial concepts in which groups shape into one another.”80 Ethno-racial groups have historically been classified following color categories. Color depends primarily on skin tone and corporeal features (including hair color, facial and bodily features), although previous observers have noted that higher income made individuals self-identify—and be publicly perceived—as belonging to whiter color groups.81 However, the rise of Afro-descendant movements in Brazil during the last decades has made Afro-descendants with higher-education backgrounds increasingly identify with categories associated with the darkest skin colors (negro) (see below).
Another study, conducted by the Brazilian Institute of Geography and Statistics in 2008, found that ethno-racial boundaries were now shifting less in relation to social status. Increasingly, color depended more on skin color, bodily features, family origin, and cultural traditions than on socioeconomic status (Table 4).82
Additionally, color names usually exceed census categories. For example, one survey conducted in 1976, with over 82,000 respondents, found more than 100 categories of color.83 A 1995 national survey (which also used an open-ended format) found similar results. The most popular category was white (42 percent), followed by moreno (32 percent). Pardo (the official census category for mixed-race individuals) was used by only 7 percent of respondents, next to moreno claro (light moreno), which was used by 6 percent (a category not included in the census). Five percent of the population used preto (the census category for blacks), while 3 percent used negro (a term that has been promoted by black social movements but still remains to be included in the census).84
continued

Afro-descendants in Latin America | 51
Table 4 Aspects Used by Brazilians Aged 15 and Over to Define Their Own Color or Race
Aspect %
Skin color 82.3
Physical traits 57.5
Family origin, ancestors 47.6
Culture, tradition 28.1
Socioeconomic origin 27
Political/ideological option 4
Source: Brazilian Institute of Geography and Statistics, 2008.
Box 7 | Class and Race
Ascription to Afro-descendant categories can also fluctuate in relation to class, a tradition that dates back to colonial views and laws of wealth and race distribution. In colonial Latin America, wealthy mixed-race individuals could purchase a document from the Crown—gracias al sacar, or “thanks for the exclusion”—that would provide them with the status of white people, therefore buying entry into a superior casta. This association between blackness and poverty, and between whiteness and wealth, survived the collapse of the colonial legal system, so people classified as blacks today continue to be associated with poverty in most countries, while mixed-race categories are used to describe people of higher socioeconomic status (see box 8 and chapter on poverty for exceptions in Panama and Brazil). Furthermore, Peter Wade has argued that successful black individuals tend to be integrated into nonblack social spaces, reinforcing patterns of racial inequality.85
However, the relation between class and ethno-racial categories is not clear-cut or homogeneous throughout the region. A study conducted in four countries found that having a higher income had disparate effects over the racial identity of people.86 In Brazil, for instance, it had a polarizing effect—it could equally whiten or darken individuals; while in the Dominican Republic, it darkened individuals—higher-status individuals tended to self-identify as Afro-descendant. In Colombia, it favored the adoption of mestizo identities, while in Panama, it had no effect. Thus, the authors conclude that belonging to a higher class does not always correlate with whitening, but could actually darken respondents or have no effect whatsoever. The disparate effects of higher earnings on ethno-racial classification responded to “nationalist narratives, popular understandings of race, and changing incentives for identifying with particular categories.”87
This does not mean that race does not matter socioeconomically, but rather that ethno-racial identities do not overlap neatly with socioeconomic status.
85 PeterWade,Race and Ethnicity in Latin America.86 EdwardTellesandTiannaPaschel, “Who isBlack,White,orMixedRace?HowSkinColor,Status,andNationShapeRacialClassification inLatinAmerica,”
American Journal of Sociology120,no.3(2014):864–907.87 Ibid.,899.

52 | The World Bank
88 Datafrom16censuseswereusedtoestimatethetotalAfro-descendantpopulationfor2015,whiledatafrom13countries(11censuses,1intercensalsurveyforMexicoplusPeru’s2015LivingStandardsMeasurementSurvey)wereusedfortheanalysisonaccesstoservices,demographics,aswellassomeeducationandlabormarketresults.
89 IntegratedPublicUseMicrodataSeries,International(IPUMS-International):ThisisaprojectoftheUniversityofMinnesotadedicatedtocollecting,documenting,harmonizing,anddistributingcensusdatafromaroundtheworld.WhenIPUMSdatawerenotavailableordidnothavetheharmonizedethnicityvariables,thereportusedcensusdatafromtheofficialNSOwebsiteusingREDATAMprogramming.
90 Socio-EconomicDatabaseforLatinAmericaandtheCaribbean(WorldBankandCEDLAS).91 Latinobarómetrowww.latinobarometro.organdLatinAmericanPublicOpinionProject(LAPOP)www.vanderbilt.edu/lapop.92 Theoverallprojectalsoincludesthecreationofasetoftools(dashboardsfordatavisualization)thatallowforfurtherordeeperanalysisthanthatprovidedinthis
report,tobeavailablethroughtheLACEquityLaboftheWorldBank.ThetoolsdevelopedforthisreportofferbothanintensiveandextensivemarginimprovementofthequantityofinformationwithrespecttoprevioussourcesintheregionandtheWorldBank.
93 MoreinformationcanbefoundinappendixB.ThedashboardsareavailablethroughthewebpageoftheLACEquityLaboftheWorldBank.94 WorldBank,Indigenous Latin America in the Twenty-First Century.95 Mestizo,inthereport,referstopeoplewithmixedwhiteandindigenousancestry,whichisanimportantsocialcategoryincountriessuchasEcuador,Mexico,Peru,
andinmuchofCentralAmerica,amongothers.
Who is Afro-descendant in this report?The quantitative analysis undertaken in this report is based on census data from—depending on the analysis—12 to 16 countries88 (IPUMS89 and national statistical organizations’ sites, NSOs), harmonized household survey data from 6 countries (SEDLAC90), and opinion survey data from 18 countries (Latinobarómetro and LAPOP91). The combination of three different sources of data provides a wider array of information and possible cross-validation, and takes advantage of the recent wave of statistical inclusion and recognition of Afro-descendants in NSOs across the region.92 The overall project also includes the creation of a set of tools (dashboards for data visualization) that allow for further or deeper analysis than that provided in this report (see appendix B).93
Nevertheless, important data gaps and inconsistencies persist, which are taken into account throughout the analysis. For example, as mentioned above, the existing race and ethnicity variables are prone to changes due to fluctuating self-reporting and perceptions. In countries such as Panama and Brazil, higher income classes are those now more willing to self-identify as black rather than as mixed race, resulting in seemingly better welfare results for blacks in these cases. Furthermore, although current increases in statistical inclusion have resulted in more ethno-racial variables in censuses, the vast majority of household surveys either do not yet include these variables or the data have no statistical power due to an underrepresentation of these
households in the survey. Therefore, the results based on the censuses are reasonably robust, while the results from the household surveys may be less representative of some parts of the region, such as Central America and Mexico. In addition, Brazil has the largest population of Afro-descendants and thus often drives the regional results. For this reason, the study focuses primarily on country-specific data and attempts to show a range of findings for comparative purposes. When aggregates are presented, it means that the results are consistent or representative of much of the region—with or without Brazil, for example.
This study follows the publication of a previous report on the status of indigenous peoples in Latin America.94 Given the serious disadvantages faced by indigenous peoples in the region, we try to avoid comparing the Afro-descendant data to them, but rather to the white and mestizo95 population, which is, in general, the wealthier segment of Latin American societies. Hence, when throughout the text we use the term non-Afro-descendant, it refers to nonindigenous peoples too.
Finally, the report uses census and household survey data in two distinctive ways. The first is purely descriptive, to account for gaps in access to services, general distribution of the population, and other parameters. These are uncontrolled data, usually drawn from censuses, aimed at providing the reader with a snapshot of the status of the Afro-descendant population in the region vis-à-vis a number of comparators,

Afro-descendants in Latin America | 53
both internal and external (for example, rural versus urban, Afro-descendants versus others, male versus female). These presentations do not aspire to explain the gaps, many of which can be due to the concentration of Afro-descendants in less developed areas, and not to a process of racial discrimination per se. The second type of analysis is based on household data, which are used to assess the possible drivers behind many of these gaps. Although these data are available in only six countries (two of which do not have
race data over time), they comprise almost 85 percent of the Afro-descendant population in Latin America. The regression analysis includes estimates of the probability of being poor across different dimensions, returns to schooling, Mincer wage regressions, and the probability of being an informal worker. In addition, the analysis includes the use of a nonparametric synthetic panel approach to estimate intragenerational economic mobility and chronic poverty for the four countries with available data over time.96
96 BasedonLeonardoRamiroLucchetti,Who Escaped Poverty and Who Was Left Behind? A Non-Parametric Approach to Explore Welfare Dynamics Using Cross-Sections, PolicyResearchWorkingPaperno.WPS8220(Washington,DC:WorldBank,2017), http://documents.worldbank.org/curated/en/608131508157256196/Who-escaped-poverty-and-who-was-left-behind-a-non-parametric-approach-to-explore-welfare-dynamics-using-cross-sections.


Where Do They Live?

56 | The World Bank
Based on the data available in the last round of censuses for 16 countries, there were about 133 million Afro-descendants in the Latin America region in 2015, close to 24 percent of the total population. It is difficult to determine the exact number and distribution of Afro-descendants, for reasons ranging from the nature of Afro-descendant identities and their historical processes, to lacunas in the statistical data and deficiencies in the way the data are collected or reported. For the purpose of clarification, it is safe to say that about one in four Latin Americans self-identify today as Afro-descendants.
Due to historical processes related to the slave trade and the needs and demands of the colonial economies for slave work, the distribution of Afro-descendants is highly uneven across the region. Over 91 percent are concentrated in Brazil and Venezuela, and a further 7 percent in Colombia, Cuba, Ecuador, and Mexico. The narrative of the region is therefore strongly influenced by countries in the Caribbean rim (Cuba, Venezuela), the Pacific coast (Colombia, Ecuador), and, above all, Brazil. Even if we exclude mixed-race categories, such as pardo and moreno, in Brazil and Venezuela respectively, these areas would still contribute more than 80 percent of the Afro-descendant population in the region. Brazil, with a projected Afro-descendant population of 105 million people in 2015, has not only the largest share of Afro-descendants in the region, but the second largest in any country in the world (after Nigeria). Brazil is followed by Venezuela (17 million), Colombia (5 million), Mexico (1.5 million), Ecuador (1.2 million), and Cuba (1.2 million). All the remaining countries have fewer than 1 million Afro-descendants, with Bolivia, El Salvador, and Paraguay, at the lower end, having both the smallest number and proportion of Afro-descendants.
As a share of the country’s population, many small Caribbean countries not included in this study top the list in the region, such as Jamaica (92 percent) and St. Lucia (87 percent). In Latin America, Venezuela has the largest proportion of Afro-descendants (55 percent), with morenos alone representing over 50 percent of the total population, followed by Brazil (51 percent), where pardos represent nearly 43 percent of the total. Venezuela and Brazil are followed by Colombia and Cuba (about 10 percent each), Panama (9 percent), Uruguay and Costa Rica (8 percent), Ecuador (7 percent), and Nicaragua (3 percent). Among the remaining countries for which we have data, Afro-descendants represent 2 percent of the total in Peru, 1.4 percent in Honduras, 1.2 percent in Mexico, 0.4 percent in Argentina, 0.2 percent in Bolivia, and 0.1 percent in El Salvador.
Table 5 shows the official data from country censuses, but the team is aware that Afro-descendant organizations do not always agree with the official estimates, and countries where Afro-descendant variables have not been included in the census, such as Chile, have calculated their own estimates.97
country-level dIstrIButIon of And Access to servIces
At the national level, Afro-descendants have a geographic distribution similar to that of the rest of the population in most countries. That is, Afro-descendants are predominantly urban, at nearly 82 percent, slightly above the average of the region (80 percent). Thus, in highly urbanized countries such as Argentina and Uruguay, Afro-descendants tend to show similarly high levels of urbanization. Ecuador and Panama have the most exceptional distribution, with Afro-descendants having a much larger proportion
97 ApartialcensuscarriedoutbyAfro-ChileanorganizationsandtheNationalStatisticsInstituteofChile(InstitutoNacionaldeEstadísticadeChile;INE),in2014,foundthatinAricaandParinacotaabout8,400Chileansself-identifiedasAfro-descendants.AlthoughtheAfro-descendantvariablewasnotincludedinthe2012generalcensusorinthe2017abbreviatedrecount,Afro-Chileanorganizationscontinuetofightforvisibilityandrecognition.SeeCristianAlejandroBáezLazcano,“ReflectionsontheAfro-ChileanSocialMovement:WeEnteredasBlacks,andWeLeftasAfrodescendants…andAfro-ChileansAppearedontheScene,”ReVista: Harvard Review of Latin America(Winter2018),https://revista.drclas.harvard.edu/book/reflections-afro-chilean-social-movement-we-entered-blacks-and-we-left.

Afro-descendants in Latin America | 57
AD = Afro-descendant; WDI = World Development Indicators.
Note: Proportion of AD over total population refers to those who answered the ethnicity/race question. Population projections are made assuming constant shares between the last census and the updated population information.
Table 5 Afro-descendant Population in Latin America (Projected to 2015)
country year of data
Proportion of Ad/total population
Ad population in census year
(million)
total population in 2015 (WdI)
(million)
Ad population in 2015 (million)
Brazil 2010 50.7% 96.8 206 104.5
Venezuela 2011 55.0% 14.5 31.2 17.1
Colombia 2005 10.6% 4.31 48.2 5.1
Mexico 2015 1.2% 1.38 125.9 1.5
Ecuador 2010 7.2% 1.04 16.1 1.2
Cuba 2002 10.1% 1.1 11.5 1.2
Peru 2015 2.3% 0.74 31.4 0.72
Costa Rica 2011 8.0% 0.34 4.8 0.38
Panama 2010 9.2% 0.3 4 0.37
Uruguay 2011 8.1% 0.26 3.4 0.28
Argentina 2010 0.4% 0.15 43.4 0.17
Nicaragua 2005 2.8% 0.14 6.1 0.17
Honduras 2013 1.4% 0.11 9 0.13
Bolivia 2012 0.2% 0.02 10.7 0.02
Paraguay 2012 0.2% 0.3 6.6 0.01
El Salvador 2007 0.1% 0.01 6.3 0.01
Total 23.4% 564.6 132.86
of urban residents than their conationals (87 percent versus 63 percent for Panama, and 75 percent versus 62 percent for Ecuador), while in most other countries the distribution tends to be similar to or slightly above the national average. Afro-Panamanian organizations, however, have
complained that the national statistics tend to underestimate their numbers and misrepresent their socioeconomic situation, due to a historical process of invisibilization. For this reason, most numbers presented in this report for Panama have to be taken with caution (box 8).98
98 WorldBank,Panama—Locking in Success: A Systematic Country Diagnostic(Washington,DC:WorldBank,2015).

58 | The World Bank
Box 8 | Panama
Afro-descendants in Panama seem to occupy an exceptional position. Based on census data, Afro-descendants are better off than non-Afro-descendants in education, literacy, and access to basic services and goods. Afro-descendants also have a lower poverty rate than other Panamanian households and are not overrepresented in the population living in slums. Despite these positive results, qualitative studies reveal a widespread perception that Afro-descendants have been excluded from the country’s economic growth and face exclusion in employment, health services, and political participation, putting them among the poorest and most vulnerable groups in the country. How can we make sense of the rift between census data and public perceptions?
Some Afro-descendant organizations in Panama have suggested that, in the last census round, only the better off and more empowered individuals self-identified as Afro-descendant, leading to an overestimation of the welfare and positive situation of the group in the country. The Latinobarómetro survey supports this explanation, as a higher proportion of Afro-descendants in Panama considered themselves as high or upper-middle class compared with non-Afro-descendants (11.3 percent versus 6.9 percent). The stigma preventing most Afro-Panamanians from self-reporting would emerge from the complex and antagonistic racial politics of Panama.
As in most Spanish colonies, the development of the isthmian economy depended on slave labor, especially around Portobelo, a situation that eventually led to slaves becoming known as “colonial blacks.”99 Prior to Panama’s independence from Colombia (1903), the regional elites promoted a discourse that, while valorizing whiteness, emphasized the mixture of indigenous, black and Spanish people, resulting in a large mestizo and mulatto population. Until then, Panama lacked rigid forms of racial segregation. In fact, the region was known as the “black province” among Colombians, due to its large mixed-race population.100
However, this idea of blackness changed at the turn of the twentieth century when the United States took the lead in the construction of the canal. The U.S. presence gave impetus to the arrival of over 150,000 West Indian workers (from Barbados, Grenada, Jamaica, St. Kitts and Nevis, and Trinidad) between 1904 and 1914, who remained in Panama after the canal was built. The Canal Zone altered racial relations in Panama as the United States created a “Jim Crow” system of labor segregation, which separated whites (the “gold payroll”) from nonwhites that comprised West Indians and all Panamanians (the “silver payroll”).101 Panamanians were not only categorized as black—and thus treated as a segregated and underprivileged workforce—but were unable to compete with English-speaking West Indians. In response, Panamanians (including “colonial blacks”) protested against the West Indian presence, and nationalist movements in the 1940s turned blackness into a category associated with foreigners. Anti-immigrant sentiment was accompanied by racist and xenophobic treatment of Afro-Antilleans (who were referred to with the derogatory term chombos).102 In sum, the system of racial fluidity morphed into a rigid system, in which blackness was seen as anti-Panamanian.
Although racial segregation was dismantled after 1977, racial discrimination and anti-blackness have continued until the present. Even though there are signs that the situation is slowly changing,103 this fraught history might explain why educated and wealthier individuals are disproportionately adopting the category of Afro-descendants, while the less educated and most vulnerable tend to avoid self-reporting as Afro-Panamanians.
99 By1789,ofPanamaCity’s35,920residents,22,504wereblackslaves.SeeMichaelL.Conniff,Black Labor on a White Canal: Panama, 1904–1981(Pittsburgh,PA:UniversityofPittsburghPress,1985).
100 MichaelL.Conniff,Black Labor on a White Canal,11.101 RenéeAlexanderCraft,When the Devil Knocks: The Congo Tradition and the Politics of Blackness in Twentieth-Century Panama (Columbus,OH:OhioState
UniversityPress,2015).102 Infact,inthe1940s,theconstitutionprohibitedtheimmigrationofblackindividuals“whosefirstlanguage[was]notcastellano(Art.23),”anditdeniedcitizenship
tochildrenborninthecountrywhoseparentswereblackAntilleans.SeeMichaelL.Conniff,Black Labor on a White Canal.103 Inthe1980s,thegovernmentcreatedanAfro-AntilleanmuseumandsupportedtheSecondCongressonBlackCultureintheAmericas.In2000,thegovernment
createdtheDayofBlackEthnicity,andin2006itcreatedthefirstFestivalAfropanameño.ThecountryhasundertakenotherlegalmeasurestocombatracismandprovidegreatervisibilitytoAfro-descendants.In2005,itcreatedalawthatforbidsdiscriminationintheworkplace(Law11of2005)andformedanationalcommissionagainstdiscrimination(ConsejoNacionaldelaEtniaNegra)andaNationalSecretariatfortheDevelopmentofAfro-Panamanians(Law64of2016).Thecurrentconstitution(whichwasreformedin1994)alsohasseveralarticlesagainstdiscriminationintheworkplace,ineducation,andinpoliticalspaces.Theblacksocialmovement,since1999,hastakenimportantstepstogaingreatervisibility.SeeGeorgePriestleyandAlbertoBarrow,“TheBlackMovementinPanamá:AHistoricalandPoliticalInterpretation,1994–2004,”Souls10,no.3(2008):227–55.

Afro-descendants in Latin America | 59
Overall, Afro-descendant households tend to be younger and have more members and lower dependency ratios than other households in most countries. Compared to whites and mestizos, Afro-descendant households tend to be 1 to 7 years younger. They also tend to have more young members but fewer aged 60 years and older, so they tend to have lower dependency ratios in almost all countries, except in Brazil, Colombia, Ecuador, Nicaragua, and Peru. Afro-descendant children and youths have fewer years of education at all levels, and their members of working age are disproportionally affected by unemployment (their rates are over twice as high as for whites and mestizos for much of the region). Moreover, those employed tend to work in low-skilled occupations at a higher rate (75 percent versus 69 percent). Afro-descendant households therefore tend to be poorer than those of whites and mestizos, and rural households tend to be poorer than urban ones.
One of the positive outcomes of their high urban concentration is that disparities in access to basic services are not very pronounced, if compared with indigenous peoples or rural vulnerable people in general. However, the situation varies widely across services, and between and within countries (figure 5), though these differences cannot be attributed a priori to racial issues.104 Access to electricity, water, and sanitation tends to be high in all countries, both for Afro-descendants and whites and mestizos, with few exceptions. In Nicaragua, in contrast to the rest of the region, access to water is as low as 15 percent for the Afro-descendant population (compared with 65 percent for the non-Afro-descendant population), probably due to their higher concentration in remote areas of the Atlantic coast.
Access to sewerage shows even wider variations across and within countries. High levels of access for Afro-descendants can be seen in Argentina (88 percent), Costa Rica (93 percent), Mexico (89 percent), Uruguay (98 percent), and Venezuela (91 percent), and these tend to be high for both Afro-descendants and non-Afro-descendants. In El Salvador (35 percent), just over a third of both populations have access to sewerage, while in Nicaragua only 9 percent of the Afro-descendant population and 26 percent of the non-Afro-descendant population have access. In some countries, however, the Afro-descendant population shows higher access to sewerage, such as in Honduras and Panama. At the opposite end, Brazil has the second-largest gap (after Nicaragua) between non-Afro-descendants and Afro-descendants, with 75 percent versus 59 percent access respectively.
Similarly, differences in access to assets—such as computers, telephones, and television sets—tend to be larger between countries than within countries (figure 6). Access to television sets tends to be high in all countries considered, with small intracountry differences between the Afro-descendants and whites/mestizos.105 Access to computers tends to be low across the board, with rates for Afro-descendants topping 54 percent in Argentina and Uruguay and reaching levels as low as 2 percent and 7 percent in Nicaragua and El Salvador. The largest gaps in access to computers between Afro-descendants and whites/mestizos can be seen in Brazil (23 percentage points), Ecuador (15 pp), Uruguay (14 pp), Peru (12 pp), Venezuela (12 pp), and Costa Rica (11 pp), while telephone ownership shows comparable gaps between the two in most countries. Finally, car ownership is relatively low for Afro-descendants in general (see dashboards, appendix B).
104 Althoughthefollowinganalysisiscountry-based,differencesinaccesscanalsobeexaminedwithinsubregionswithtoolsdesignedbytheteam.Thetoolsallowforanalysesofdifferencesbetweenpopulationgroupsacrossdifferentdimensions:ruralversusurban;geographiclevel;maleversusfemale(fortheeducationandlabordata);andeventuallytheteamcouldalsoaddbyagegroup.InthecaseofBrazilandVenezuela,theanalysiscandelveintodifferencesbetweenblacks,mulattos,andmestizos.
105 SomeexceptionsareColombiaandPanama(whichhave8percentagepointdifferences),andNicaragua(whichhasa30percentagepointdifference).

60 | The World Bank
Figure 5Access to Sewerage, Water, and Electricity among Afro-descendant and Non-Afro-descendant Populations
Source: National censuses.
“Non-Afro-descendant” does not include indigenous people.
Acce
ss to
ele
ctric
ity (%
)
88
59
93
75
35
8189
9
82
68
9891
87
75
96
80
43
68
95
26
63
73
99 95
Argentina2010
Brazil2010
Colombia2005
Costa Rica2011
Ecuador2010
El Salvador2007
Honduras2013
Mexico2015
Nicaragua2005
Panama2010
Peru2015
Uruguay2011
Venezuela2011
Argentina2010
Brazil2010
Costa Rica2011
Ecuador2010
El Salvador2007
Honduras2013
Mexico2015
Nicaragua2005
Panama2010
Peru2015
Uruguay2011
Venezuela2011
Argentina2010
Brazil2010
Colombia2005
Costa Rica2011
Ecuador2010
El Salvador2007
Honduras2013
Mexico2015
Nicaragua2005
Panama2010
Peru2015
Uruguay2011
Venezuela2011
99 9889
9994
87 87
99
46
98 9599 9999 99
9599 96
8881
99
70
9195
99 100
0102030405060708090
100
0102030405060708090
100
0
10
20
30
40
50
60
70
80
90
100
Afro-descendant Non-Afro-descendant
Afro-descendant Non-Afro-descendant
Afro-descendant Non-Afro-descendant
9890
72
97
79
68
89 92
15
97
85
98
85
98 97
85
98
8576
8696
65
9485
9989
Acce
ss to
wat
er (%
)Ac
cess
to s
ewer
age
(%)

Afro-descendants in Latin America | 61
Figure 6Access to Computer, Telephone, and TV by Race (Afro-descendant versus Non-Afro-descendant)
Source: National censuses.“Non-Afro-descendant” does not include indigenous people.Note: Argentina, Honduras, Peru and Venezuela include cell phone access in addition to landline.
Acce
ss to
tele
visi
on s
et (%
)
Afro-descendant Non-Afro-descendant
Afro-descendant Non-Afro-descendant
Afro-descendant Non-Afro-descendant
Acce
ss to
tele
phon
e (%
)Ac
cess
to c
ompu
ter (
%)
54
28
9
38
157
2432
2
39
25
40
29
49 51
17
49
30
1120
37
4
3137
54
41
96
3039
47
21 25
73
37
4
47
88
41
65
95
5056 60
36 38
71
41
12
35
91
6171
Argentina2010
Brazil2010
Colombia2005
Costa Rica2011
Ecuador2010
El Salvador2007
Honduras2013
Mexico2015
Nicaragua2005
Panama2010
Peru2015
Uruguay2011
Venezuela2011
Argentina2010
Brazil2010
Colombia2005
Costa Rica2011
Ecuador2010
El Salvador2007
Honduras2013
Mexico2015
Nicaragua2005
Panama2010
Peru2015
Uruguay2011
Venezuela2011
94
72
95
7873
92
32
94 97 9597
80
96
81
69
96
62
86
98 97
0
10
20
30
40
50
60
70
80
90
100
0102030405060708090
100
0102030405060708090
100
Brazil2010
Colombia2005
Costa Rica2011
El Salvador2007
Honduras2013
Mexico2015
Nicaragua2005
Panama2010
Uruguay2011
Venezuela2011

62 | The World Bank
If compared with indigenous peoples, national totals showing access to services and technology are considerably better for Afro-descendants, though still in the lower end of the national distribution.106 This is partly explained by the much higher concentration of Afro-descendants in urban areas, which, in general, increases notably the probability of gaining access to services, jobs, and education. This is also true for urban indigenous people, who are over 30 percent less likely to be poor if they live in an urban setting in Ecuador and Peru, for example, and over 17 percent and 26 percent in Mexico and Bolivia respectively.107
The geographic distribution of Afro-descendants can overshadow large gaps in access to services and markets in certain regions. Access to electricity, for instance, tends to be high across countries for all groups, and although access to water and sewerage shows important variations, those variations cannot be attributed to race distinctions. However, when we look at areas with high concentrations of Afro-descendants within each country, a different pattern begins to emerge.
Afro-descendAnt regIons
At a subnational level, Afro-descendants tend to be concentrated in some regions and cities more than in others (map 1). This distribution corresponds to historical processes and centuries of isolation or assimilation that followed their forced distribution throughout the region. In most countries, these historical processes have resulted in a small number of regions strongly associated with Afro-descendant culture, which are, invariably, regions with the lowest levels of development. These are also regions with typically
poor interconnection with the rest of the country and the market. Some illuminating examples of this territorial segregation are the departments of Chocó in Colombia, Esmeraldas in Ecuador, the states of Pará and Bahía in Brazil, and the Atlantic region of Nicaragua.
The Colombian department of Chocó, which stretches from the Pacific coast of Colombia to the Atlantic, bordering with Panama, has the largest proportion of Afro-descendants in its composition, at over 80 percent. In the sixteenth and seventeenth centuries, the discovery of gold deposits and the rapid decline of the indigenous population led to an inflow of West African slaves that entered through the port of Cartagena de Indias. West African slaves were in demand due to their knowledge of gold mining techniques and their better adaptation to the intensely hot and humid rain forest conditions of the region, which made it intolerable for European and Andean indigenous people. Colonial administrators therefore relied on African slaves not only to work in the cuadrillas (mining work gangs) but also to oversee the business locally, which was often performed by free blacks or mulattos.108 Following the abolition of slavery in 1851, and after the gold rush receded, Chocó fell into oblivion for the rest of the country, and has remained one of the most neglected regions of Colombia until present times. Today, 82 percent of the population of Chocó are Afro-descendants, and over 80 percent of the urban population lives in poverty, while only 20 percent has access to piped water. Illiteracy is three times higher than the national average, and the region lacks adequate infrastructure, transportation, and basic services.109 The Pacific coast has also been overwhelmingly affected by Colombia’s internal
106 SeeWorldBank,Indigenous Latin America in the Twenty-First Century.107 Ibid.108 GeorgeReidAndrews,Afro-Latin America,14.109 PaulaMoreno-Zapata,“Colombia:Afro-Colombians,”inEncyclopedia of the African Diaspora: Origins, Experiences, and Culture,vol.1, ed.CaroleE.BoyceDavies
(SantaBarbara,CA:ABC-CLIO,2008),317;UnitedNations,Chocó:la dimensión territorial y el logro de los ODM (Bogotá:FondoparaelLogrodelosObjetivosdelMilenio,2012).

Afro-descendants in Latin America | 63
Source: National censuses.
Map 1 | Regions with High Concentrations of Afro-descendants

64 | The World Bank
conflict, with communities caught in the crossfire between the army and several armed factions that have disputed control over the territory over the past 60 years.110
The disparities that affect Chocó are often normalized through the lens of stereotypes attributing “moral and intellectual differences between the people who inhabit [the department] rather than as a consequence of racialized state policies.”111 On the positive side, Chocó has engendered important Afro-Colombian organizations that have spurred significant changes in the recognition of Afro-descendants’ rights at the national level and beyond. Their mobilization contributed decisively in the constitutional recognition of the rights of Afro-Colombians, the passage of groundbreaking laws that grant territorial and cultural rights to black communities of the Pacific coast (Law 70 of 1993), and the creation of ethno-education programs that reflect their heritage, identity, and cultural knowledge.112
Similarly, in Brazil, the Afro-descendant population represents 77 percent of the total in the states of Pará, Bahía and Maranhão, all northeastern states, but only 16 percent in the wealthier state of Santa Catarina, in the south. During the colonial and imperial periods, the northeast developed an economy based on sugar and gold mining, which relied heavily on slave workers. Salvador de Bahía was the main port of entry for slaves,113 and was the colonial capital until 1763. By the end of the nineteenth century, however, Caribbean sugar
production displaced the sugar mills of Bahía, and during the twentieth century, Bahía also failed to benefit from the wave of industrialization that transformed the south and southeast. Similarly, mining drove an important contingent of enslaved workers to the state of Pará,114 which is currently the most populous state in northern Brazil. Pará also experienced a rubber boom in the nineteenth and twentieth centuries,115 which attracted mixed-race and black small farmers and peasants from the states of Ceará and Maranhão. In recent decades, there has been an expansion of iron ore and bauxite mining, cattle ranching, and soy cultivation. Pará also has the largest concentration of quilombolas with land titles (see box 11).
The north and south of Brazil are not only racially divided, but also experience striking socioeconomic gaps.116 In Pará, access to services is significantly lower than the national average, especially in water (73 percent versus 93 percent) and connection to sewerage (29 percent versus 50 percent). Similarly, almost 64 percent of households in Pará are living under slum conditions (defined below), more than double the national average (34 percent), and unemployment is also more pronounced (16 percent versus 6 percent). However, the unequal conditions of Pará are more visible when compared with Santa Catarina, a southern and predominantly white state that has the smallest Afro-descendant concentration (16 percent) in Brazil. While in Santa Catarina access to water is almost universal, in Pará a quarter of the population lacks regular access to this service
110 ThePacificcoasthasbeenadisputedterritoryfordecades,withhistoriesofmassdisplacements,forcedlaborinminesandcocaplantations,forcedrecruitment,torture,anddisappearance,amongothersystematicviolationsofhumanrights.InColombia,over650,000Afro-descendantshavebeenaffectedbythe60-year-longconflict,reinforcingtheirvulnerabilityandlockingentireAfro-Colombiancommunitiesinthepoorestareasofthecountry.Furthermore,theamountofresourcesnecessarytomitigateandaddresstheconsequencesofviolencehasdivertedfordecadeseconomic,human,natural,andinstitutionalresourcesfromotherareasofdevelopmentinalreadyimpoverishedcommunities.SeeWorldBank,Towards Sustainable Peace, Poverty Eradication, and Shared Prosperity(Washington,DC:WorldBank,2014);CésarRodríguezGaravitoandYukyanLam,Etnorreparaciones: la justicia colectiva étnica y la reparación a pueblos indígenas y comunidades afrodescendientes (Bogotá:CentrodeEstudiosdeDerecho, Justicia ySociedad,Dejusticia, 2011);CatalinaDíazGómez,NelsonCamiloSánchez,RodrigoUprimnyYepes,eds.,Reparar en Colombia: los dilemas en contextos de conflicto, pobreza y exclusion (Bogotá:CentrodeEstudiosdeDerecho, Justicia ySociedad,Dejusticia,CentroInternacionalparalaJusticiaTransicional,ICTJ,andtheEuropeanUnion,2009).
111 TiannaPaschel,Becoming Black Political Subjects,43.112 PaulaMoreno-Zapata,“Colombia:Afro-Colombians,”317.113 HendrikKraay, “Introduction:Afro-Bahia,1790s–1990s,” inAfro-Brazilian Culture and Politics: Bahia, 1790s to 1990s,ed.HendrikKraay (Armonk,NY:M.E.
Sharpe,1998).114 ComisiónEconómicaparaAméricaLatinayelCaribe,Situación de las personas afrodescendientes,60.115 BarbaraWeinstein,The Amazon Rubber Boom, 1850–1920 (Stanford,CA:StanfordUniversityPress,1983).116 EdwardTelles,Race in Another America.

Afro-descendants in Latin America | 65
(similar patterns are visible in electricity, sewerage, and access to computers and the Internet). The population living in slums in Pará is almost three times the proportion of Santa Catarina (64 percent versus 25 percent), and the illiteracy rate is almost two times higher (11 percent versus 6 percent).
The state of Bahía, which has a broader industrial economy and tourist sector, also experiences greater deprivations than southern states. In addition to gaps in access to basic services, the proportion of the population of Bahía living in slums is significantly higher than the proportion of Santa Catarina (35 percent versus 25 percent), and the unemployment rate is also over three times higher (19 percent versus 6 percent).
In the early twentieth century, public intellectuals attributed the marginalization of the north to the mixed-race and black component of the population.117 Although the industrial boom of the twentieth century triggered an internal migration of Afro-descendant workers to the southeast, it did not alter significantly the geographic distribution of ethno-racial groups across states, nor help close the socioeconomic gaps between predominantly Afro-descendant regions and predominantly white regions.118
Afro-descendAnts in cities
One of the most salient characteristics of the Afro-descendant population in Latin America is its predominantly urban character. At over 82
percent, Afro-descendants are concentrated in urban settings at a slightly higher rate than the average Latin American (80 percent), in one of the most urbanized regions in the world. As such, Afro-descendants often live in areas with privileged macroeconomic conditions, such as Caracas, Lima, Montevideo, or Rio de Janeiro, although they do not necessarily benefit proportionally from these conditions. In fact, in cities, Afro-descendants are more often relegated to areas with poor access to services and jobs, and exposed to higher levels of pollution, crime, violence, and natural disasters.
Using a simplified version of the UN-Habitat definition of a slum, determined by the absence of at least one basic public service (water, electricity, or sanitation) and the presence of dirt floors in the household as a proxy for poor construction materials, census data show that in most countries included in this report, the proportion of Afro-descendants living in slums is considerably higher than that of whites or mestizos—around twice as high in countries such as Brazil, Colombia, Costa Rica, Ecuador, Mexico, and Uruguay. In Nicaragua, about 93 percent of Afro-descendant households live in slum conditions. Other Afro-descendant populations with high rates of dwelling deprivations include those in El Salvador (50 percent), Brazil (34 percent), and Ecuador (30 percent) (figure 7).
The largest gap between Afro-descendants and others in the percentage of households living in slum conditions is found in Nicaragua, where Afro-descendant households are 34 percentage points
117 DurvalMunizdeAlbuquerqueJr.,The Invention of the Brazilian Northeast (Durham,NC:DukeUniversityPress,2014).118 EdwardTelles,Race in Another America,197.

66 | The World Bank
119 MariaBucheliandWandaCabela,Perfil Demográfico y Socioeconómico de la Poblacion Uruguaya según su Ascendencia Racial (Montevideo,Uruguay;InstitutoNacionaldeEstadística,2006);WandaCabella,MathíasNathan,andMarianaTenenbaum,La Población Afro-Uruguaya en el Censo 2011; Atlas Sociodemográfico de la Desigualdad del Uruguay (Montevideo,Uruguay;InstitutoNacionaldeEstadística,2013).
120 EdwardTelles,Race in Another America,199–200.121 WorldBank,Inclusion Matters,134.
Figure 7 Share of Urban Population Living in Slums, by Race
Source: National censuses.
Note: The definition of slums is a simplified version of the UN-Habitat definition, determined by the absence of at least one basic public service (water, elec-tricity, sanitation) and/or the presence of dirt floors, as a proxy for poor construction materials, in urban households.
“Non-Afro-descendant” does not include indigenous people.
worse off than other households. But the gap is also significant in Brazil (15 pp), Ecuador (14 pp), and Colombia (14 pp).
Even in prosperous capital cities, the spatial distribution of Afro-descendants often follows a pattern of geographic segregation, as they tend to be relegated to underserviced, precarious areas. In Montevideo, for example, while the concentration of Afro-Uruguayans in wealthy coastline neighborhoods in 2006 and 2011 was under 5 percent, it reached 40 percent in poorer peripheral neighborhoods. On the whole, about three in four Afro-Uruguayans lived in low- and lower middle-income neighborhoods. In contrast, the white population in low- and lower middle-income income neighborhoods was slightly above 45 percent, but they represented almost 100 percent of the population living in wealthy coastal
neighborhoods.119 A similar pattern occurs in the metropolitan area of Rio de Janeiro, where the majority of the white, middle-class population is concentrated in the southern districts, while the nonwhite population resides in the northern and eastern periphery, particularly in the poor suburbs known as the Baixada Fluminense, which has a negative reputation for crime and inadequate services.120
Urban inequality can reinforce exclusion in other areas of social life. Slums increase notably the exposure of Afro-descendants to crime and violence, for example, while widening the divide between those who benefit fully from urban infrastructure and those who do not.121 Similarly, the population living in slums can also face stigmatization in everyday life, limiting their job opportunities, access to markets, and provision of
Afro-descendant Non-Afro-descendant
11
34
22
7
30
50
1610
93
1318
13 151219
84
16
40
22
5
59
2217
711
0%
10%
20%
30%
40%
50%
60%
70%
80%
90%
100%
Argentina2010
Brazil2010
Colombia2005
Costa Rica2011
Ecuador2010
El Salvador2007
Honduras2013
Mexico2015
Nicaragua2005
Panama2010
Peru2015
Uruguay2011
Venezuela2011

Afro-descendants in Latin America | 67
other public services.122 Finally, in countries with laws that protect Afro-descendants’ land tenure systems (such as Brazil and Colombia), these provisions are usually inapplicable in urban areas.
Cities where Afro-descendants make up the majority of the population—and even represent a significant part of the middle class—are not protected from other forms of exclusion. One example is Salvador de Bahía, in Brazil. Salvador is the fourth-largest city in Brazil and a major tourist destination. The city epitomizes black culture and African heritage, manifested in the regional cuisine, religion, dance, music, and other cultural expressions.123 In fact, over one in five Bahíanos identify as pretos (blacks), the highest concentration of blacks in the country, as against the more common tendency of Afro-Brazilians to identify as pardos (mixed race). However, and although at least 77 percent of all Bahíanos embrace an Afro-Brazilian identity, the Afro-descendant population of Bahía was represented by 11 percent of the legislators in the state assembly, and in Salvador they had only 46 percent of all council seats in 2011.124 Furthermore, Salvador is among the most dangerous cities for Afro-descendant youths in the country,125 with one of the highest police-related homicide rates.126
In Cartagena de Indias, Colombia—another important slave port during the colonial period—Afro-Colombians represent over 36 percent of
residents but experience significant gaps in access to education and high-skill jobs.127 Moreover, with the growth of the tourist economy, neighborhoods that have a deep association with the black community—such as Getsemaní—are slowly being gentrified as demand for property surges. Although improvements in infrastructure and crime reduction have benefited old-time residents of Getsemaní, the booming touristic industry is buying Afro-Colombians out of their houses and driving them into poorer, more dangerous neighborhoods on the outskirts of the city.128
One of the most pervasive aspects of slums in Latin America is their association with higher levels of crime and violence. Latin America is, in fact, the most violent region in the world,129 and Afro-descendants are the main victims. Brazil is a well-documented case, where Afro-descendants have historically been overrepresented among homicide victims, a trend that has only worsened over the past decades.
About 60,000 people die in Brazil each year due to violence, making it one of the most violent countries in the world.130 But violence does not affect all Brazilians equally. The Atlas da Violência 2017 shows that the majority of homicide victims are men (92 percent)—young men in particular, aged 15 to 29 years—and 71 percent are Afro-descendant.131 According to the government’s Youth Vulnerability to Violence Index, in 2015,
122 EdwardTelles,Race in Another America,211.SeealsoUN-Habitat,World Cities Report 2016. Urbanization and Development: Emerging Futures (Key Findings and Messages) (Nairobi:UnitedNationsHumanSettlementsProgramme,2016),4;andRobinE.Sheriff,Dreaming Equality: Color, Race, and Racism in Urban Brazil (NewBrunswick,NJ:RutgersUniversityPress,2001).
123 EdwardTelles,Race in Another America,213.124 AsJudithMorrisonargues,“ThesituationisevengrimmerinRiodeJaneiroandSãoPaulo,whereAfro-Braziliansare44percentand32percentofthepopulation,
respectively,butholdonly7and3percent,respectively,ofthemunicipalcouncilseats.”SeeJudithA.Morrison,“SocialMovementsinLatinAmerica,”258.125 ChristenA.Smith,Afro-Paradise: Blackness, Violence, and Performance in Brazil (Urbana,IL:UniversityofIllinoisPress,2016),4.126 JulioJacoboWaiselfisz,Mapa da Viole ̂ncia 2013: Mortes Matadas por Armas de Fogo(CentroBrasileirodeEstudosLatino-AmericanosandFLACSOBrasil,2013),
http://mapadaviolencia.org.br/pdf2013/MapaViolencia2013_armas.pdf.127 CarlosAugustoViáfaraLópezandFernandoUrreaGiraldo,“Efectosdelarazayelgéneroenellogroeducativoyestatussocio-ocupacionalparatresciudades
colombianas,”Revista Desarrollo y Sociedad,58(2006):115–63.128 MelissaM.Valle,“TheDiscursiveDetachmentofRacefromGentrificationinCartagenadeIndias,Colombia,”Ethnic and Racial Studies (2017):1–20,https://doi.
org/10.1080/01419870.2016.1274419.129 LauraChioda,Stop the Violence in Latin America: A Look at Prevention from Cradle to Adulthood,LatinAmericanDevelopmentForum(Washington,DC:World
Bank,2017).130 Brazil,infact,hasmorethan10percentofthehomicidesworldwide,despitecomprisinglessthan3percentofthepopulation.SeeUnitedNationsOfficeonDrugs
andCrime,Global Study on Homicide 2013(Vienna:UnitedNationsPublication,2014).Twenty-fiveofthe50mostviolentcitiesintheworldareinBrazil,accordingtotheMexicanNGOSeguridad,JusticiayPaz.
131 DanielCerqueira,RenatoSergiodeLima,SamiraBueno,LuisIvánValencia,OlayaHanashiro,PedroHenriqueG.Machado,andAdrianadosSantosLima,Atlas da Violência 2017 (IPEAandForúmBrasileirodeSegurançaPública,2017),http://ipea.gov.br/portal/images/170602_atlas_da_violencia_2017.pdf.

68 | The World Bank
132 SecretariadeGovernodaPresidênciadaRepública,Brasil,Índice de vulnerabilidade juvenil à violência 2017: desigualdade racial, municípios com mais de 100 mil habitantes(SãoPaulo:SecretariadeGovernodaPresidênciadaRepública,SecretariaNacionaldeJuventude,eFórumBrasileirodeSegurançaPública,2017).
133 Datafrom2010showthatyoungAfro-BrazilianssufferedphysicalassaultsandinjuriesbypoliceforcesorprivatesecurityguardsalmosttwiceasmuchaswhiteBrazilians.JulioJacoboWaiselfisz,Mapa da Viole ̂ncia 2013.
134 DanielCerqueira,RenatoSergiodeLima,SamiraBueno,LuisIvánValencia,OlayaHanashiro,PedroHenriqueG.Machado,andAdrianadosSantosLima,Atlas da Violência 2017.
135 Thecountrywiththehighestrateintheworld(Honduras)hasaround80/100,000.136 EduardoBonilla-Silva,Racism without Racists: Color-Blind Racism and the Persistence of Racial Inequality in America (Lanham,MD:Rowman& Littlefield
Publishers,Inc.,2014),105.137 SeeInter-AmericanCommissiononHumanRights,The Situation of People of African Descent in the Americas.138 Keisha-KhanPerry,Black Women against the Land Grab: The Fight for Racial Justice in Brazil(Minneapolis:UniversityofMinnesotaPress,2013).
young Afro-descendants were 2.7 times more likely to be killed than white youths.132 In some states, such as Alagoas and Amapá, the likelihood was 12.1 and 11.9 times higher respectively. The risk for Afro-descendants of all ages of becoming homicide victims in Brazil is 23.5 percent higher than for the white population.133 For young Afro-descendant women, exposure to homicide was 2.2 times higher than for white women in the age group 15 to 29 years.
Of greater concern, during the past decade, the homicide rate among Afro-Brazilians increased by 18 percent while the rate for white victims decreased by 12 percent. The homicide numbers have skyrocketed in all regions, with high Afro-Brazilian concentrations, such as in the northeast, going from 186 per 100,000 inhabitants in 2002 to 375 per 100,000 in 2008. In the state of Rio Grande do Norte, the homicide rate for Afro-descendants increased by more than 330 percent.134 To put this in perspective, Afro-Brazilian homicide rates are more than four times the rate of the most violent country in the world.135
Exposure to crime and violence among Afro-descendants is not a problem exclusive to Brazil. Across the region, Afro-descendants have reported being subjected to higher levels of surveillance and hostile treatment in public spaces, including mistreatment by security forces.136 According to the Inter-American Commission on Human Rights, Afro-descendants are subject to “double victimization,” as they tend to be excluded from the protection of state security forces while being more likely to be affected by institutionalized violence, including tougher judicial treatment.137
The surge of crime and violence in Brazil has led the Brazilian federal government to relaunch, in 2017, the Youth Alive (Juventude Viva) program, a partnership between the National Secretary of Youth and the National Secretary for the Promotion of Racial Equality. The program aims to create social inclusion opportunities in municipalities that present the highest vulnerability to violence for Afro-descendant youths.
On a more positive note, Afro-descendant neighborhoods have also engendered grassroots organizations that are struggling for housing, land rights, and urban services and infrastructure. One illuminating example is Gamboa de Baixo, a coastal neighborhood in the city of Salvador de Bahía that comprises about 350 families (about 2,000 residents). Located along the Bay of All Saints, the neighborhood—situated at the bottom of a hill—sits below a middle-class neighborhood, a major roadway, and several tourist sites. Although the neighborhood is an area of prime real estate, women-led grassroots organizations have blocked new urbanization projects that threaten to relocate the residents, many of whom work in fishing or as domestic workers in nearby residences. Since the 1980s, women’s organizations also have succeeded in expanding social programs and public assistance; initiated community programs in health and education; fought against police abuse and racial profiling; and raised awareness on the importance of land rights in city space, especially for women, who experience greater degrees of exclusion.138 In sum, these efforts reveal the potential of Afro-descendant organizations to achieve greater justice and social change in cities.

Afro-descendants in Latin America | 69
Poverty and Access to Markets

70 | The World Bank
The first decade of the millennium was one of the most successful in Latin American history, in terms of both economic growth and poverty reduction. More than 80 million people were raised out of poverty between 2002 and 2012, and the middle class expanded to over one-third of the population. Afro-descendants benefited from these gains alongside other Latin Americans. The historical income gap separating them from whites and mestizos narrowed,139 and the probability of Afro-descendant households being poor has been decreasing. Yet, the benefits of the so-called “golden decade” were not evenly distributed, and Afro-descendants benefited less than whites and mestizos, leading to the perpetuation of several gaps and higher-than-average rates of poverty.
These differences coincide with the findings of a recent study by the World Bank,140 which pointed out that, despite the favorable economic conditions of the 2000s, one in five Latin Americans still endured chronic poverty at the end of the decade. That is, they were poor at the beginning and the end of a decade of generalized growth. The report, which serves as one of the analytic pillars for this study, also found that, though poverty affects individuals in rural and urban settings alike, it tends to be geographically concentrated, and it is difficult to overcome, as economic growth alone is not sufficient to lift the chronically poor out of poverty. In this study, we want to show that there is an important overlap between the findings of the study on chronic poverty and the situation of Afro-descendants in the region. In a previous study, we showed a similar connection between poverty and indigenous peoples,141 which gives a predominantly ethno-racial face to Latin America’s exclusion.
Furthermore, a protracted economic slowdown since 2012, followed by a contraction of 1.4 percent in regional gross domestic product (GDP) in 2015, led to a halt in the region’s poverty reduction in 2015 and the stagnation of the middle class.142 The halt in poverty reduction threatens to jeopardize the social gains achieved in the previous decade. Again, in the following pages, we will show that Afro-descendants risk being disproportionally affected by this reverse in gains, as during the “golden decade” they not only experienced smaller transitions out of poverty, but they also experienced larger transitions into poverty.
monetAry Poverty
The past decade left good news for Afro-descendants. They benefited significantly from the generalized poverty reduction trend of the region. Between 2005 and 2015 over 50 percent of Afro-descendant households living on less than US$5.5 a day were lifted out of poverty in Brazil and Uruguay, and more than 20 percent of them in Ecuador and Peru.143 Also, the probability of being poor, if compared with people living in households with similar socioeconomic conditions, declined significantly across the region. It was nearly halved in Brazil and Ecuador, and reduced by more than a third in Uruguay. Although the data available to assess ethno-racial poverty trends in the region are limited in scope and timespan, these positive trends are generalized and confirmed through many other sources, including censuses and specialized studies. It is therefore safe to say that the past decade saw a remarkable improvement in the living conditions of many Afro-descendants, which is indeed good news.
139 By2015,theAfro-descendantpopulationhadnarrowedtheincomegapinBrazil,Ecuador,Peru,andUruguaywiththenon-Afro-descendants.BrazilandUruguayshowedthestrongestdeclineintheincomegap.Asmentionedintheintroductorychapter,thepovertyanalysisisbasedontheonlysixcountrieswithavailableethno-racialvariables(withenoughstatisticalpower),yettheserepresentalmost85percentoftheAfro-descendantsinLatinAmerica.
140 RenosVakis,JameleRigolini,andLeonardoLucchetti,Left Behind.141 WorldBank,Indigenous Latin America in the Twenty-First Century.142 WorldBank,Social Gains Show Signs of Stagnation in Latin America.143 PovertyismeasuredinthisreportusingaUS$5.5perdayglobalpovertyline(2011PPP–PurchasingPowerParity).Householdsareconsideredpooriftheirper
capitaincomeisbelowthisUS$5.5perdaythreshold.ExtremepovertyismeasuredusingaUS$3.2perdayglobalpovertyline(2011PPP).

Afro-descendants in Latin America | 71
However, non-Afro-descendants saw even greater improvements, so many gaps that were present at the beginning of the decade were still there by the end. Thus, although Afro-Peruvians and Afro-Uruguayans saw an extraordinary annualized poverty decrease of 7 percent and 10 percent in the 2005–15 period, non-Afro-descendants experienced an annualized decrease of 9 percent and 14.5 percent respectively, widening the relative distance between the two groups in each country (figure 8). The current gaps are in fact considerable. Poverty is over twice as high for Afro-descendants in Brazil and three times higher in Uruguay, and over 10 percentage points higher in Colombia, Ecuador, and Peru (figure 9, appendix F).
Afro-descendants are, as a result, overrepresented among the poor and the extreme poor in the region. In 2015, they represented 38 percent of the total population in the six Latin American countries for which there are data, yet they comprised 47 percent of the poor and 49 percent of the extreme poor.144 Together with indigenous peoples, they accounted for about 58 percent of the extreme poor and about 55 percent of the poor in those countries, highlighting the weight of ethno-racial inequality in countries that not long ago were believed to epitomize “racial democracies.”
The impact of the recent economic slowdown varied from country to country. The economic
144 Althoughlimitedinnumber,thosesixcountriescomprisealmost85percentofthetotalAfro-descendantpopulationintheregion.
Figure 8 Average Annual Decrease in Poverty between 2005 and 2015
Source: Authors’ calculations using SEDLAC (CEDLAS and the World Bank).
Note: Based on US$5.5/day global poverty line (2011 PPP).
BRA = Brazil, ECU = Ecuador, PER = Peru, URY = Uruguay.
AD = Afro-descendant; Non-AD = non-Afro-descendant (does not include indigenous people).
-6.6%
-7.5%
-6.6%
-7.0%
-8.9%
-10.4%
-14.5%
0%
10%
20%
30%
40%
50%
60%
70%
BRA AD BRANon-AD
ECU AD ECU Non-AD
PER AD PER Non-AD
URY AD URY Non-AD
Annualized poverty decrease
Poverty circa 2005 Poverty circa 2015
-6.2%

72 | The World Bank
Figure 9
Figure 10
Poverty in 2015 by Race (US$5.5 a Day, 2011 PPP)
Poverty Trends in Brazil, Ecuador, Peru, and Uruguay (2005–15)
Source: Authors’ calculations using SEDLAC (CEDLAS and the World Bank).
contraction of 2015 affected everyone in Brazil—Afro-descendants and the overall population experienced an increase in poverty rates (figure 10). A recent study of Brazil found that, even in the best scenario, inequality and poverty were also likely to increase in 2016 and 2017, although the “new poor,” as the authors called them, were likely to be slightly younger, skilled workers of the service sector, located in urban areas of the southeast, and primarily white.145 In
Ecuador, while the 2015 economic contraction led to stagnant poverty reduction overall, its Afro-descendant population saw continued slight declines in poverty. Neither Peru nor Uruguay faced an economic contraction in 2015, but a continued economic slowdown. However, in Uruguay, poverty increased for the Afro-descendant population but remained stagnant for everyone else, while in Peru poverty remained stagnant for all (figure 10).
145 SeeWorldBank,Social Gains Show Signs of Stagnation in Latin America.
continued
41
34
29 26
13
2722
18
12
4
0%
10%
20%
30%
40%
50%
Colombia Ecuador Peru Brazil Uruguay
Afro-descendant Non-Afro-descendant
56.4
33.740.3
24.737.6
21.7
2007 2008 2009 2010 2011 2012 2013 2014 2015
Ecuador poverty (US$5.5 a day)
0%
10%
20%
30%
40%
50%
60%50.9
25.825.3
11.6
0%
10%
20%
30%
40%
50%
60%
2005 2006 2007 2008 2009 2011 2012 2014 2015
Brazil poverty (US$5.5 a day)
Afro-descendant Non-Afro-descendant Total population Afro-descendant Non-Afro-descendant Total population

Afro-descendants in Latin America | 73
Source: Authors’ calculations using SEDLAC (CEDLAS and the World Bank).
In Brazil, the data available allow a distinction in economic performance and other aspects between Afro-descendants who identify as preto or negro (black) and those who describe themselves as pardo (mixed race). Although both subgroups rank considerably below whites and mestizos in terms of income, and both are at higher risk of falling behind during an economic
crisis, the poverty rates are slightly different between the two. Overall, the segment of the Afro-descendant population describing itself as preto (black) fares slightly better off than the segment identifying as pardo (mixed race) throughout time, contrary to what most of the literature and the historical relations between the two would suggest (figure 11).146
146 See,forexample:MarvinHarris,“RaceRelationsinMinasValhas”;CarlN.Degler,Neither Black nor White.
Figure 11 Brazil Poverty: Negro and Pardo Populations
Source: Authors’ calculations using SEDLAC (CEDLAS and the World Bank).“Non-Afro-descendant” does not include indigenous people.
34.2
12.7
15.2 4.10%
10%
20%
30%
40%
50%
60%
2006 2007 2008 2009 2010 2011 2012 2013 2014 2015
Uruguay poverty (US$5.5 a day)
59.9
28.8
0%
10%
20%
30%
40%
50%
60%
2005 2006 2007 2008 2009 2010 2011 2012 2013 2014 2015
Peru poverty (US$5.5 a day)
Afro-descendant Non-Afro-descendant Total population Afro-descendant Non-Afro-descendant Total population
22.5
28.8
43.6
51.9
8.311.6
22.1
26.5
0%
10%
20%
30%
40%
50%
60%
2005 2006 2007 2008 2009 2011 2012 2014 2015
Negro ($3.2 a day) Pardo ($3.2 a day) Negro ($5.5 a day) Pardo ($5.5 a day)

74 | The World Bank
Several studies have attempted to explain this counterintuitive result. These have found that socioeconomic status is becoming less and less relevant when predicting a person’s racial or color identification in the country.147,148 This is probably due to the perseverance of Afro-descendant organizations, which have promoted adoption of the term negro (black) and widespread adoption of race-based and multicultural policies. These processes have produced an inversion in the historical regional trend among Afro-descendants (of ascribing to mixed-race categories), with educated Afro-descendants increasingly identifying with the “darkest” and more politically committed term negro (or its equivalent, preto, in the household survey).149 In this scenario, it is possible that people who self-identify as preto in the household survey are more likely to be influenced by the politics of black social movements, and therefore have higher levels of education and income than people who self-identify as mixed-race (pardo), which is a category historically adopted to offset the stigma of identifying as black.
Given the economic relevance of Afro-descendants for the region—representing one-quarter of the labor force—and their disproportionate representation among the poor, closing the gaps between Afro-descendants and the rest of the population is not only important in itself, as a means of building more just and prosperous societies, but it is also important for the region as a whole, as they represent the core of the chronically poor.
In fact, being born to Afro-descendant parents increases considerably the probability of
being raised in a poor household, giving Afro-descendant children an uneven start in life and contributing to cement a centuries-old poverty trap that hampers the full development of their potential. In Brazil, for example, considering two households with similar characteristics (similar urban or rural location, number of dependents, marital status, educational level, age and gender of the household head, among others), the probability of being poor increases by nearly 7 percent if the household head is Afro-descendant (figure 12).150 In Colombia, Ecuador, and Uruguay, the probability of a household being poor for the mere fact that the household head is Afro-descendant is between 4 percent and 6 percent higher.
The poverty trap afflicting many Afro-descendants is further exacerbated by other dimensions, such as the prevailing disparities between rural and urban settings, or those associated with the gender of the household head, which call for special attention to those specific dimensions. For instance, rural Afro-descendant households are more severely affected by poverty than urban ones. In 2015, the probability of being poor between two similar Afro-descendant households increased by as much as 38 percent in Peru, 16 percent in Brazil, and 13 percent in Colombia if the household was rural (figure 13). Although urban–rural disparities affect everyone in the region, rural Afro-descendant households are more likely to be poor even if compared with rural households with similar conditions but headed by someone without African descent. The latter are nearly 8 percent less likely to be poor in Brazil, for instance (figure 14).
147 AntonioSérgioAlfredoGuimarães,“TheBrazilianSystemofRacialClassification,”1159.148 EdwardTellesandTiannaPaschel,“WhoisBlack,White,orMixedRace?”149 MarceloPaixão,IreneRossetto,FabianaMontovanele,andLuizM.Carvano,eds.,Relatório Anual das Desigualdades Raciais no Brasil; 2009–2010 (Constituição
Cidadã, seguridade social e seus efeitos sobre as assimetrias de cor ou raça)(RiodeJaneiro:Garamond,2011).150 The results for bothPanamaandPeruare statistically insignificant for both yearsandall lines.The statistically insignificant results suggest that, holdingall
othercharacteristicsconstant,beingAfro-descendanthasnoeffectonwhetherthehouseholdispoor.InthecaseofPeru,thereasonmightbethatPeru’sAfro-descendantpopulationisrelativelysmall(around2percentinthecensusandsurvey).Aswiththeearlierresults,PanamacontinuestoshowpositiveorneutraloutcomesforAfro-descendant–headedhouseholds.Seebox8onPanamaforapossibleexplanation.

Afro-descendants in Latin America | 75
Figure 12
Figure 13
Increase in Probability of Being Poor if the Household Head Is Afro-descendant Instead of Non-Afro-descendant, Holding All Else Constant
Increase in Probability of Being Poor if Afro-descendant Household Head Lives in Rural Area
Source: Authors’ calculations using SEDLAC (CEDLAS and World Bank).
Methodological note: OLS regression of household’s poverty status (under the $1.90, $3.20, and $5.50 per day global poverty lines), controlling for race, area (urban/rural), household head’s gender, whether married, educational attainment, age cohort, number of children (whether 2+ children or not), and local region size (defined by country’s population).
Source: Authors’ calculations using SEDLAC (CEDLAS and the World Bank).
12.4
6.96.2
9.1
5.0
7.4
4.6
0%
2%
4%
6%
8%
10%
12%
14%
2005 2015 2015 2007 2015 2006 2015
Brazil Colombia Ecuador Uruguay
$1.90 $3.20 $5.50
$1.90 $3.20 $5.50
-20%
-10%
0%
10%
20%
30%
40%
50%
2005 2015 2015 2007 2015 2015 2005 2015 2015
Brazil Colombia Ecuador Panama Peru Uruguay
15.4 16.213.0
26.7
8.14.4
18.5
37.9
-10.0

76 | The World Bank
Similarly, the probability of being poor is higher among households headed by Afro-descendant women in all countries for which we have statistically significant data. Holding all other aspects constant, male-headed Afro-descendant households have a lower likelihood of being poor in Colombia (12 percent), Brazil (7 percent), and Uruguay (6
percent). More worryingly, in Brazil, the only country for which we have two points of reference (2005 and 2015), this probability has increased (up from 5.4 percent in 2005) (figure 15). Again, although gender disparities tend to affect all households in all countries, Afro-descendant households tend to be affected more strongly (figure 16).
Figure 14
Figure 15
Increase in Probability of Being Poor if Household Is Rural; Separately for Afro-descendant and Non-Afro-descendant Households
Decrease in Probability of Being Poor if Afro-descendant Household Is Headed by Male instead of Female
Source: Authors’ calculations using SEDLAC (CEDLAS and the World Bank).
“Non-Afro-descendant” does not include indigenous people.
Source: Authors’ calculations using SEDLAC (CEDLAS and the World Bank).
-20%
-10%
0%
10%
20%
30%
40%
2005 2015 2015 2007 2015 2015 2005 2015 2006 2015
Brazil Colombia Ecuador Panama Peru Uruguay
Afro-descendant Non-Afro-descendant
12.98.3
15.8 16.7
6.5 7.6
27.2
37.0
-0.7
-30%
-25%
-20%
-15%
-10%
-5%
0%
5%
2005 2015 2015 2007 2015 2015 2005 2015 2006
$1.90 $3.20 $5.50
Brazil Colombia Ecuador Panama Peru Uruguay
-5.4 -6.9
-12.3 -11.6
-3.3
-25.0
-5.7

Afro-descendants in Latin America | 77
151 TheteamusedanonparametricapproachtoestimateintragenerationaleconomicmobilitybasedonLeonardoRamiroLucchetti,Who Escaped Poverty and Who Was Left Behind? Thispaperproposesanonparametricadaptationofarecentlydevelopedparametrictechniquetoproducepointestimatesofintragenerationaleconomicmobility in theabsenceofpaneldatasets that follow individualsover time.Themethodpredictspast individual incomeorconsumptionusingtime-invariantobservablecharacteristics,whichallowstheestimationofmobilityintoandoutofpoverty,aswellashousehold-levelincomeorconsumptiongrowth,fromcross-sectionaldata.Thepapervalidatesthismethodbysamplingrepeatedcross-sectionsoutofactualpaneldatasetsfromthreecountriesintheLatinAmericaregionandcomparingthetechniquewithmobilityfrompanels.Overall,themethodperformswellinthethreesettings;withfewexceptions,allestimatesfallwithinthe95percentconfidenceintervalsofthepanelmobility.Thequalityoftheestimatesdoesnotdependingeneralonthesophisticationleveloftheunderlyingwelfaremodel’sspecifications.Theresultsareencouraging,evenforthosespecificationsthatincludefewtime-invariantvariablesasregressors.
Figure 16 Decrease in Probability of Being Poor if Male-Headed Household, for Both Afro-descendants and Non-Afro-descendants
Source: Authors’ calculations using SEDLAC (CEDLAS and the World Bank).
“Non-Afro-descendant” does not include indigenous people.
left BehInd
The mix of a protracted history of exclusion together with contemporary processes of structural discrimination—reflected in a higher likelihood of being poor in the absence of contextually disadvantageous factors—makes Afro-descendants one of the most persistent segments of Latin America’s poor. That is, as with indigenous peoples, generalized economic growth alone is unlikely to raise a large number of Afro-descendants out of poverty. Experience shows they need targeted policies to help them overcome the structural barriers that hinder their personal and group development.
Afro-descendants are, therefore, disproportionally represented among those left behind by the past decade of economic growth and inequality reduction. That is, Afro-descendants entered and
exited the past decade in poverty at a much higher rate than whites and mestizos, experiencing less upward economic mobility than their conationals. Estimates of mobility show that Afro-descendant households are 2.5 times more likely to be chronically poor than non-Afro-descendant households.
Again, although the data are limited to a number of countries and years, the gaps are considerable and consistent throughout the sample of countries available. Chronic poverty (defined as households that were in poverty in both the first and last year of the period under study)151 affected one in four Afro-descendant households in Ecuador during the 2009–15 period (figure 17), and nearly one in five in Brazil and Peru. In Uruguay, a country reputed for its low levels of inequality, chronic poverty afflicted about four times more Afro-descendant households in the period 2009–15.
Brazil Colombia Ecuador Panama Peru Uruguay
-30%
-25%
-20%
-15%
-10%
-5%
0%
2005 2015 2015 2007 2015 2015 2005 2006 2015
Afro-descendant Non-Afro-descendant
-4.1 -3.9-6.9
-5.1 -4.3-2.6
-4.8
-1.2

78 | The World Bank
The probability of being chronically poor diminished between the 2009–12 and the 2012–15 periods for all countries and all races, helped by the continued poverty reduction across the region. Still, Afro-descendant households remained more likely to be chronically poor during the 2012–15 slowdown period at an even higher rate in Ecuador, Peru, and Uruguay.
In consonance with the above, Afro-descendant households experienced smaller transitions out of poverty and, more worryingly, larger transitions into poverty than non-Afro-descendant households between 2009 and 2015, with few exceptions. From 2009 to 2012, Afro-descendant households in Brazil, Ecuador, and Uruguay had lower rates of transition out of poverty (34 percent, 32 percent, and 41 percent respectively) than the rates experienced by non-Afro-descendant
households (40 percent, 39.6 percent, and 44 percent) (figure 18). The only exception was Peru, where Afro-descendant-headed households and non-Afro-descendant households had similar rates (32.3 percent and 30.3 percent respectively). Similarly, the rate of Afro-descendant households that fell into poverty from 2009 to 2012 was larger than that of non-Afro-descendants in Brazil (10.3 percent versus 5.3 percent), Ecuador (21 percent versus 8.8 percent), and Uruguay (7.2 percent versus 3.1 percent).
Furthermore, the economic slowdown since 2012 has negatively impacted both Afro-descendants and non-Afro-descendants, decreasing their rates of poverty reduction (except Afro-descendants in Uruguay and Ecuador) and increasing their rates of poverty increase (except Afro-Ecuadorians) (figure 18 and appendix H).
Figure 17 Chronic Poverty in Afro-descendant and Non-Afro-descendant Households
Source: Authors’ calculations using SEDLAC (CEDLAS and the World Bank) and based on Leonardo Ramiro Lucchetti, Who Escaped Poverty and Who Was Left Behind?
AD = Afro-descendant; Non-AD = non-Afro-descendant (does not include indigenous people).
0%
5%
10%
15%
20%
25%
30%
AD Non-AD AD Non-AD AD Non-AD AD Non-AD
Chronic poor 2009–2012 (%) Chronic poor 2012–2015 (%)
Brazil Ecuador Peru Uruguay
22.6
7.8
26.8
19.1 18.517.1
10.2
2.9
17.9
5.6
26.0
13.9
18.7
13.0
4.8
1.2
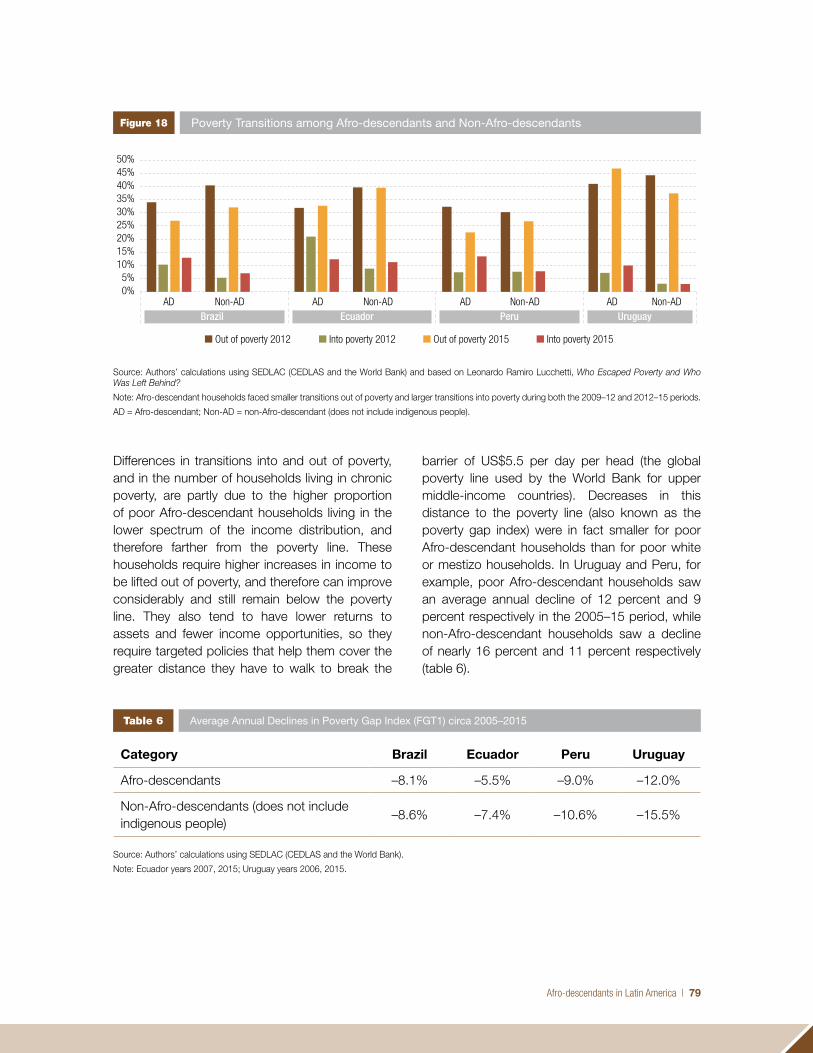
Afro-descendants in Latin America | 79
Differences in transitions into and out of poverty, and in the number of households living in chronic poverty, are partly due to the higher proportion of poor Afro-descendant households living in the lower spectrum of the income distribution, and therefore farther from the poverty line. These households require higher increases in income to be lifted out of poverty, and therefore can improve considerably and still remain below the poverty line. They also tend to have lower returns to assets and fewer income opportunities, so they require targeted policies that help them cover the greater distance they have to walk to break the
barrier of US$5.5 per day per head (the global poverty line used by the World Bank for upper middle-income countries). Decreases in this distance to the poverty line (also known as the poverty gap index) were in fact smaller for poor Afro-descendant households than for poor white or mestizo households. In Uruguay and Peru, for example, poor Afro-descendant households saw an average annual decline of 12 percent and 9 percent respectively in the 2005–15 period, while non-Afro-descendant households saw a decline of nearly 16 percent and 11 percent respectively (table 6).
Figure 18 Poverty Transitions among Afro-descendants and Non-Afro-descendants
Source: Authors’ calculations using SEDLAC (CEDLAS and the World Bank) and based on Leonardo Ramiro Lucchetti, Who Escaped Poverty and Who Was Left Behind?
Note: Afro-descendant households faced smaller transitions out of poverty and larger transitions into poverty during both the 2009–12 and 2012–15 periods.
AD = Afro-descendant; Non-AD = non-Afro-descendant (does not include indigenous people).
Table 6 Average Annual Declines in Poverty Gap Index (FGT1) circa 2005–2015
Source: Authors’ calculations using SEDLAC (CEDLAS and the World Bank).
Note: Ecuador years 2007, 2015; Uruguay years 2006, 2015.
category Brazil ecuador Peru uruguay
Afro-descendants –8.1% –5.5% –9.0% –12.0%
Non-Afro-descendants (does not include indigenous people)
–8.6% –7.4% –10.6% –15.5%
0%5%
10%15%20%25%30%35%40%45%50%
AD Non-AD AD Non-AD AD Non-AD AD Non-ADBrazil Ecuador Peru Uruguay
Out of poverty 2012 Into poverty 2012 Out of poverty 2015 Into poverty 2015

80 | The World Bank
On a more encouraging note, the income gap between Afro-descendants and others has been declining over time (from 19 percent in 2005 to 11 percent in 2015),152 as has the probability of being poor,153 and education seems to hold the key to understanding these positive trends. In Brazil, for instance, completing primary education can reduce the likelihood of Afro-descendants being poor by over 9 percent, while completing secondary and tertiary education can reduce it by 16 percent and 23 percent respectively. In Colombia, Ecuador, Peru, and Uruguay, completing tertiary education can reduce the likelihood of being poor by between 12 percent and 32 percent. These results are highly significant, as they hint at the urgent need to invest in racially minded policies of educational inclusion as a way to break the cycle of chronic poverty afflicting a disproportionate number of Afro-descendant households. They also give hope on the medium- and long-term impact of the highly effective policies of Afro-descendant tertiary-level inclusion that Brazil has been implementing for over a decade and turned into national law in 2012 (figure 19).
PArtIcIPAtIon In the JoB mArket
The persistence of poverty gaps between Afro-descendants and non-Afro-descendants, and the higher tendency of Afro-descendant households to remain poor over time, can be partially attributed to the way Afro-descendants are joining the labor market, where educational attainment and the return they are getting for their investment in education play, of course, crucial roles.
Overall, Afro-descendants have higher levels of unemployment in all countries, and among those employed, a larger share of them work in low-skilled occupations. On average, Afro-descendants have nearly twice the rate of unemployment of non-Afro-descendants in many countries, at about 13 percent versus 6 percent. Furthermore, about 75 percent of the Afro-descendant population works in low-skilled occupations, compared with around 69 percent of the non-Afro-descendant population (figure 20). But the differences between them are even starker when zooming into specific regions within a country. In the department of Chocó (Colombia), for example,
Figure 19 Decrease in the Probability of Being Poor if the Afro-Descendant Household Head Completes Primary, Secondary, or Tertiary Education
Source: Authors’ calculations using SEDLAC (CEDLAS and the World Bank).
152 AggregateforBrazil,Ecuador,Peru,andUruguay.153 Forthosecountriesforwhichwehavedataformorethanoneperiod,thetrendsshowthattheprobabilityofbeingpoorifthehouseholdheadisAfro-descendant
decreasesovertimeforBrazil,Ecuador,andUruguay,andforallpovertylinesanalyzed.
Complete primary Complete secondary Some tertiary
-35%
-30%
-25%
-20%
-15%
-10%
-5%
0%Brazil Ecuador Peru Uruguay Panama Colombia
-9.2 -9.8
-18.6
-7.3
-9.8
-16.4
-21.0
-18.6
-12.4
-4.5
-20.8-23.0 -21.6
-24.5
-11.9
-6.6
-31.7

Afro-descendants in Latin America | 81
unemployment is nearly twice as high for Afro-descendants than for the smaller white and mestizo population, while at national level the difference between the two is minimal.
Afro-descendants are also more likely to work in informal jobs in most countries, after controlling for all other factors. In Brazil and Uruguay, the likelihood of working in the informal sector is around 3 percent higher for Afro-descendant workers, while showing no improvement in the 2005–15 period for Brazil (figure 21). Counter to this trend, in Ecuador, in 2015, Afro-descendants were 3.5 percent less likely to work in the informal sector.
But the biggest gap between Afro-descendants and non-Afro-descendants is in income levels.
Figure 20 Employment Status and Type of Employment among Afro-descendants and Non-Afro-descendants
Figure 21
Probability of Working in the Informal Sector Is Higher if the Person is Afro-descendant in Brazil, Colombia, or Uruguay
Source: National censuses.
“Non-Afro-descendant” does not include indigenous people.
0%
10%
20%
30%
40%
50%
60%
70%
80%
90%
100%
Employed Unemployed Agriculture Manufacturing Services High skill occupation Low skill occupation
Economically active Sector Skill
Afro-descendant Non-Afro-descendant
87
13
2733
40
25
75
94
6
18
33
49
31
69
circa 2005 2015
-4%
-3%
-2%
-1%
0%
1%
2%
3%
4%
Brazil Colombia Ecuador Uruguay
3.0 3.22.9
1.3
-3.5

82 | The World Bank
According to the last census in Brazil (2010), Afro-descendants pursuing a professional career made on average over 40 percent less than their white peers, while those working as skilled agricultural or fishery workers made over 51 percent less. Of more concern, wage gaps widened between the last two rounds of censuses, so while in 2000 Afro-Brazilians earned on average 51 percent less than other Brazilians, in 2010 they earned 54 percent less. One of the most vulnerable groups in the country were Afro-Brazilian women, who not only made on average 46 percent less than white Brazilian women, but also made 32 percent less than male Afro-descendants.
In many countries, the wage gap actually increases with educational attainment. Even in Panama, where Afro-descendants fare generally better than the overall population, probably due to a bias in self-reporting (see box 8 on Panama), Afro-descendant workers lose ground against other Panamanians as they increase their educational level: with primary level completed, they earn on average 18 percent more than white workers, but by the time they complete university education, they earn 11 percent less. Something similar happens in every country, with different degrees
of severity. In Brazil, the earning gap tends to be more pronounced for Afro-Brazilians working in high-skilled, high-paying jobs (for example, they earn 40 percent less in the category “legislators, senior officials, and managers”). This association between educational attainment and widening wage gaps suggests that the return for increasing their educational levels is being held back by other factors, such as job segregation or wage discrimination.
In fact, when comparing workers with the same level of education, age, gender, marital status, experience, type of work, sector of work, and household characteristics, but different race, Afro-descendants tend to earn considerably less for the same types of jobs. Holding all other characteristics constant, in Brazil, in 2015, an Afro-descendant worker earned almost 16 percent less. In Uruguay, an Afro-descendant worker was likely to earn nearly 11 percent less; in Peru, 6.5 percent less; and in Colombia, Ecuador, and Panama, 4–5 percent less (figure 22). The impact of a similar comparison among rural workers varies by country, with rural Afro-descendant workers likely earning less in Brazil, Ecuador, and Uruguay, but more in Panama (figure 23).
Figure 22 Decrease in Income per Hour for Members of Urban Afro-descendant Households Relative to Urban Non-Afro-descendant Households
Source: Authors’ calculations using SEDLAC (CEDLAS and the World Bank).
Note: Marginal effects estimated using OLS regressions on income per hour from all occupations, controlling for ethnicity, gender, experience (defined as potential experience, which is equal to the difference between age and years of schooling minus six years), square of experience, marital status, educational attainment (complete primary, complete secondary, and tertiary), age cohort (18–24, 25–44, 45–54, 55–65 years of age), number of children in the household, type of work (wage workers, self-employed, and no-wage workers), informality status, sector of work (including construction, commerce, manufacturing, transport, mining and utilities, and other services), and whether the person is in a small region of residence (defined by population). Observations include only people from 15 to 65 years of age, out of the agricultural sector, and in urban areas. These probabilities are statistically significant (at least p < 0.01).
-15.7
-8.9
-15.9
-5.1-4.2
-5.1-6.5
-10.8
-18%
-16%
-14%
-12%
-10%
-8%
-6%
-4%
-2%
0%Brazil Colombia Ecuador Panama Peru Uruguay
circa 2005 2015

Afro-descendants in Latin America | 83
Wage differentials have been attributed to discriminatory biases or occupational segregation by several other studies.154 In Uruguay, for example, a country considered an exception to the typical Latin American pattern of pronounced inequality, one study found discrimination to be responsible for half of the wage gap for men and 20 percent for women.155 The wage disparity is even larger for workers at the bottom of the wage distribution, denoting that discrimination has deeper effects among poorer and less-educated workers than for those at the top.
In Brazil, an Inter-American Development Bank study based on data collected from 117 companies of the 500 largest in Brazil found a hierarchical bottleneck for Afro-descendants,
with Afro-Brazilians becoming increasingly underrepresented at higher levels.156 Afro-Brazilians account for 57.5 percent of apprentices in the group of companies, but only 36 percent of their workers, 26 percent of supervisor-level staff, 6 percent of managers, 5 percent of executives, and only 5 percent on boards of directors. Afro-Brazilian women fared even worse, representing under 11 percent of the labor force analyzed in the study (10 percent of workers, 8 percent of supervisors, and 1.6 percent of executives). The vast majority of the companies surveyed said they took no measures to encourage or enhance the presence of Afro-descendants at any staff level, despite recognizing that the share of Afro-descendants at the managerial level was below what it should be.
Figure 23 Decrease in Income per Hour for Members of Rural Afro-descendant Households Relative to Rural Non-Afro-descendant Households
Source: Authors’ calculations using SEDLAC (CEDLAS and the World Bank).
Note: Marginal effects estimated using OLS regressions on income per hour from all occupations, controlling for ethnicity, gender, experience (defined as potential experience, which is equal to the difference between age and years of schooling minus six years), square of experience, marital status, educational attainment (complete primary, complete secondary, and tertiary), age cohort (18–24, 25–44, 45–54, 55–65 years of age), number of children in the household, type of work (wage workers, self-employed, and no-wage workers), informality status, and whether the person is in a small region of residence (defined by population). Observations include only people from 15 to 65 years of age, in the agricultural sector, and in rural areas. These probabilities are statistically significant (at least p < 0.01).
154 SeeNoraLustig,Fiscal Policy and Ethno-Racial Inequality in Bolivia, Brazil, Guatemala and Uruguay,CEQWorkingPaperNo.22 (2015),NéstorGandelman,HugoÑopo,andLauraRipani,“TraditionalExcludingForces:AReviewoftheQuantitativeLiteratureontheEconomicSituationofIndigenousPeoples,Afro-descendants,andPeopleLivingwithDisability,”Latin American Politics and Society53,no.4(2011):147–79;EdwardTellesandtheProjectonEthnicityandRaceinLatinAmerica(PERLA),Pigmentocracies: Ethnicity, Race, and Color in Latin America (ChapelHill,NC:UniversityofNorthCarolinaPress,2014);JuanPabloAtal,HugoÑopo,andNataliaWinder,New Century, Old Disparities: Gender and Ethnic Wage Gaps in Latin America,IDBWorkingPaperSeries,No.IDB–WP–109(2009).
155 MarisaBucheliandRafaelPorzecanski,“RacialInequalityintheUruguayanLaborMarket,”136.156 EthosInstitute,Social, Racial, and Gender Profile of the 500 Largest Brazilian Companies(EthosInstituteandInter-AmericanDevelopmentBank,2016).
-30%
-25%
-20%
-15%
-10%
-5%
0%
5%
10%
15%
20%
Brazil Colombia Ecuador Panama Uruguay
circa 2005 2015
-20.1
-6.4 -5.9
-23.7
-12.1
17.1

84 | The World Bank
In Uruguay, a study conducted by the United Nations Development Programme in 2013,157 consisting of surveys and in-depth interviews, found that Afro-Uruguayans were underrepresented in managerial positions in the private and public sectors, as well as in civil society organizations (nonprofits, unions, universities, business associations, political organizations, and media groups). Based on a sample of 6,787 managers, the study found that Afro-descendants represented only 0.8 percent of the managerial workforce in the country, most of whom worked in the metropolitan area of Montevideo. The private sector (composed of medium and large companies) had only 0.2 percent of Afro-descendant chief executive officers. Afro-descendants occupying managerial positions cited structural disadvantages and discrimination as factors that reinforce this pattern.
yet oPtImIstIc...
On a more encouraging note, although Afro-descendants in the region perceive themselves as a group that is discriminated against,158 they hold a more optimistic outlook on the future than other groups, including whites, mestizos, and indigenous peoples. According to the Latinobarómetro, in 2013, more Afro-descendants believed that their children would be better off in the future (24 percent compared with 22 percent of non-Afro-descendants) or much better off in the future (14 percent compared with 11.6 percent for non-Afro-descendants).159 The countries with more positive aspirational results were Brazil, Panama, and Paraguay. The Afro-Brazilian population has the
most positive outlook in the region, which might be partially explained by the number of successful affirmative action policies implemented from 2000 to 2015.
The optimism of Afro-descendants seems to be slowly increasing over time. The proportion of Afro-descendants that considered that their children would be “better off” or “much better off” went from 41 percent in 2007 to 51 percent in 2013. Afro-descendants also evaluate their parents’ situation as worse, at consistently higher rates than non-Afro-descendants. Afro-descendants not only hold a more positive view of their children’s life, but also of their own future economic situation. In 2015, more than half of Afro-descendants (54 percent) saw themselves better off in the next year, as opposed to less than half of the non-Afro-descendant population (49 percent) (figures 24 and 25). Afro-descendants also have a more positive view of the importance of voting, with more than 69 percent stating that the way they vote can make things different in the future, as opposed to just 61 percent of non-Afro-descendants. Finally, Afro-descendants perceive that they are experiencing a greater degree of social mobility, with the number of respondents classifying themselves as “low” or “middle lower” class decreasing from 70 percent in 2011 to 64 percent in 2015. This pattern is not only visible in the Latinobarómetro. In Peru, a study found that a greater number of Afro-Peruvians noticed improvements in the last five years in areas such as access to health care, education, employment, income, and housing.160
157 EduardoBottinelliFreire,NadiaMateoSimeone,andFrancoGonzálezMora,“MapapolíticoydeliderazgodelapoblaciónafrodescendientedelUruguay,” inSituación socioeconomica y mapa político y de liderazgo de la población afrodescendiente del Uruguay,ed.UnitedNationsDevelopmentProgramme(PanamaCity:UnitedNationsDevelopmentProgramme,2013).
158 In Brazil, in 2011, 43.7 percent ofAfro-descendants said they belonged to a group that was discriminated against (almost 1.7 times higher than non-Afro-descendants).
159 Approximately29.5percentofAfro-descendantandnon-Afro-descendanthouseholdsconsideredthattheirchildrenwouldstaythesameasthemselves.Similarly,only6.6percentofAfro-descendanthouseholdsansweredthat theirchildrenwouldbemuchworseoff,while9.3percentofnon-Afro-descendanthouseholdsrespondedthisway.
160 MartinBenavides,JuanLeón,LucíaEspezúa,andAlejandroWangeman,Estudio especializado sobre población afroperuana(Lima:MinisteriodeCulturayGrupodeAnálisisparaelDesarrollo,2015).

Afro-descendants in Latin America | 85
The optimism of Afro-descendants in Latin American echoes the positive outlook of poor Afro-descendants in North America.161 Their optimism has been attributed to a greater capacity of resilience acquired by enduring exclusion over generations, as well as to the support of grassroots organizations and local safety nets, all of which contribute to a greater sense of hope and possibility.162 Afro-descendants also have a long history of collective work and struggle, from the communities of runaway slaves in the eighteenth and nineteenth centuries to their involvement in labor unions and political parties in the early twentieth century.163 This long history of social mobilizations and negotiations—which began from one of the most dreadful chapters of mass exploitation and displacement in human history—might have also reinforced among them the notion that positive changes are possible.
Afro-descendants’ optimistic outlook on the future does not mean that they are satisfied with their current socioeconomic and political situation. In fact, almost 47 percent of Afro-descendants are deeply dissatisfied with democracy in their country (compared to 28 percent of non-Afro-descendants). They also express less confidence in political parties, congress, and, in the case of Brazil, the justice system. Almost 74 percent of Afro-descendants do not feel politically represented by their government (compared to 71 percent of non-Afro-descendants), yet 79 percent of them voted in the last presidential election (higher than the 76 percent of non-Afro-descendants who voted).
Likewise, Afro-descendants persistently report being discriminated against at a greater proportion than white respondents, and in some countries
Figure 24 Figure 25Perceptions of Future Economic Situation: Afro-descendants versus Non-Afro-descendants
Perceptions of Country’s Economic Situation in Three Years: Afro-descendants versus Non-Afro-descendants
Source: Latinobarómetro (2015).
AD = Afro-descendant; Non-AD = non-Afro-descendant (does not include indigenous people).
161 “WhyareblackpoorAmericansmoreoptimisticthanwhiteones?”BBC,January30,2018.162 CarolGraham,Happiness for All? Unequal Hopes and Lives in Pursuit of the American Dream(Princeton,NJ:PrincetonUniversityPress,2017);CarolGraham,
SergioPinto,andJohnJuneauII, The Geography of Desperation in America(Brookings,July24,2017). 163 GeorgeReidAndrews,Afro-Latin America.
54% 49%
23% 31%
16% 14%
0%
10%
20%
30%
40%
50%
60%
70%
80%
90%
100%
AD non AD0%
10%
20%
30%
40%
50%
60%
70%
80%
90%
100%
AD non AD
Better & much better off The same Worse & much worse off Better & much better off The same Worse & much worse off
40% 36%
30%28%
25%27%

86 | The World Bank
(such as Brazil and Colombia) almost twice as much. Thus, their optimistic vision of the future needs to be considered along with the negative evaluation of their current conditions.
Afro-descendants evaluate positively the recent set of multicultural reforms implemented in the region. In 2013, most Afro-descendants considered that, in the past 10 years, their country had made significant progress in the recognition of the languages, traditions, and cultural practices of Afro-descendants and indigenous peoples at a greater proportion than whites, mestizos, or indigenous people (47 percent versus 37 percent). Thus, while Afro-descendants are pragmatic and critical of their current socioeconomic and political conditions, they remain hopeful that things will change, or continue to change, and recognize democratic processes and the progressive legal reforms approved recently as the right way to achieve that positive future.
The optimism of Afro-descendants is important for development for various reasons. Several studies have shown that one pervasive consequence of sustained patterns of exclusion like those
experienced by Afro-descendants is that chronic poverty reduces the capacity to find ways out of poverty or imagine a different, more positive future. Studies of chronic poverty have found that the state of mind—aspirations, psychological welfare—affects people’s life trajectories and the resulting implications for social policies. Ethno-racial discrimination not only leads to lower accumulation of human capital, but also can instigate a sense of powerlessness in people that discourages them from participating in society. Indigenous peoples, in contrast to Afro-descendants, share a more negative view of their future and that of their children, reflecting a pessimistic appreciation of their opportunities within the current socioeconomic system.164 The positive outlook of Afro-descendants is therefore an invaluable asset for the region, as it reflects a desire to improve their situations, provided that the right conditions enable them to do so. In fact, affirmative action policies implemented in Brazil to improve their representation in universities have been embraced by Afro-Brazilian youths, decisively changing the racial make-up of the Brazilian education system to better reflect the racial composition of the country.
164 WorldBank,Indigenous Latin America in the Twenty-First Century,75.

Access to Education

88 | The World Bank
Over the last few years, Latin America has made tremendous progress in expanding the coverage of the education system—primary and secondary education in particular—to all corners of the continent. Access to primary education is practically universal in much of the region, and access to secondary education has more than doubled since the 1980s. Going to school and learning, however, are not necessarily the same thing, a recent World Development Report pointed out, and Latin American states have generally failed to realize education’s promise, especially among poor and vulnerable children.165
Education is the single most important factor explaining the declines in the probability of being poor and in the income gap between Afro-descendants and non-Afro-descendants over the past decade (see previous chapter). Yet, there is abundant evidence that the region is failing to realize the tremendous potential of the education system in terms of ethno-racial inclusion. For Afro-descendant children education in fact poses many challenges, not only because they are overrepresented among the poor and the vulnerable, but also because school settings are one of the areas where structural discrimination manifests itself more strongly. This is due both to persisting and striking gaps in access and to poor and prejudiced representations in textbooks and classrooms.
To be sure, the progress made over the past decade in terms of access to primary and secondary education has benefited Afro-descendants.166 The
number of Afro-descendants without primary and secondary schooling completed dropped between the last two census rounds. Some countries created or strengthened existent affirmative action programs for higher education, yielding positive outcomes in enrollment and performance. Others passed antidiscrimination laws for education, as well as other measures aimed at incorporating contents of Afro-descendant history, language, and culture into the national curricula. Yet, despite these positive steps, many gaps persist, and education systems continue to exclude Afro-descendants on many levels.
educAtIonAl AttAInment And school AttendAnce
The Afro-descendant population has significantly lower levels of educational attainment in most countries. On average, about 64 percent of members of Afro-descendant households have completed primary education, against 83 percent of the non-Afro-descendant population. For higher levels, only 30 percent have completed secondary education (against 46 percent), and a mere 5 percent have completed tertiary education or more (against 14 percent). Educational attainment is even lower in rural areas for both groups, although the gap between both groups is particularly stark in rural primary education. In urban areas, educational attainment is generally higher for both populations, yet the non-Afro-descendant population outperforms the Afro-descendant population at all levels, more than doubling it in access to tertiary education (figure 26).
165 WorldBank,World Development Report 2018: Learning to Realize Education’s Promise (Washington,DC:WorldBank,2018), 38;SeealsoGuillermoCruces,CarolinaGarcíaDomench,andLeonardoGasparini,“InequalityinEducation:EvidenceforLatinAmerica,”inFalling Inequality in Latin America: Policy Changes and Lessons,ed.GiovanniAndreaCornia(Oxford:OxfordUniversityPress,2014),338.
166 SeealsoLuisF.López-CalvaandNoraLustig,eds.,Declining Inequality in Latin America: A Decade of Progress?(Washington,DC:BrookingsInstitutionPress,2010).

Afro-descendants in Latin America | 89
0%10%20%30%40%50%60%70%80%90%
100%
National National National Rural Rural Rural Urban Urban Urban
Primary ormore
Secondary ormore
Tertiary ormore
Primary ormore
Secondary ormore
Tertiary ormore
Primary ormore
Secondary ormore
Tertiary ormore
National Rural Urban
Afro-descendant Non-Afro-descendant
64
30
5
41
111
69
34
6
83
46
14
64
19
3
86
52
16
Afro-descendants have a lower probability of completing primary education after controlling for all other characteristics, although there has been some improvement over time. In Brazil, for example, in 2015, Afro-descendant youths aged 15 to 25 years were 9 percent less likely to have completed primary education than non-
167 Thisresultcontrolsforgender,maritalstatus,geographiclocation(ruralorurban),andwhetherthehouseholdlivesinalowpopulationarea.
Afro-descendants,167 an improvement from 2005, when Afro-descendant youths were nearly 17 percent less likely (figure 27). The gap is smaller for Colombia, Ecuador, Peru, and Uruguay, where Afro-descendant youths are 3 to 5 percent less likely to finish primary school relative to non-Afro-descendant youths (holding all else constant).
Figure 26
Figure 27
Educational Attainment among Afro-descendant and Non-Afro-descendant Household Members
Decrease in the Probability of Completing Primary Education if a Person Belongs to an Afro-descendant Household
Source: National censuses.
“Non-Afro-descendant” does not include indigenous people.
Source: Authors’ calculations using SEDLAC (CEDLAS and the World Bank).
-18%
-16%
-14%
-12%
-10%
-8%
-6%
-4%
-2%
0%Brazil Colombia Ecuador Peru Uruguay
circa 2005 2015
-16.6
-9.9
-5.8-4.2
-9.0
-2.6
-4.7
-2.6 -2.6

90 | The World Bank
Figure 28 Decrease in Probability of Completing Secondary Education if a Person Belongs to an Afro-descendant Household versus a Non-Afro-descendant Household
In contrast, the results for secondary education did not undergo strong improvements in the past decade. On the contrary, today the gaps are more pronounced and the probability of completion is much lower (holding all else constant). Most remarkably, in Uruguay, Afro-descendants were 24 percent less likely to complete secondary education in 2015 (compared to white Uruguayans with similar socioeconomic status, age, gender, and other characteristics), a decline from the previous decade (about 19 percent) (figure 28). For other countries with available data, such as Brazil, Ecuador, and Peru, the likelihood of completing secondary education is around 15 percent lower if the student is Afro-descendant.
Moreover, Afro-descendants have higher dropout rates in primary and secondary education. In Colombia, Afro-descendant youths have a higher
probability of being below the age-appropriate grade and face a higher likelihood of dropping out.168 In Uruguay, while the national average of dropouts (aged under 18) is one in three, for Afro-Uruguayans it is two in three.169 The main driving factors for dropouts in Uruguay include household pressure to enter the job market early, discrimination in high-skilled and high-paying positions (which deters Afro-descendants from pursuing college degrees), and the poor quality of educational facilities and programs.
Regarding gender, Afro-descendant girls of school age tend to fare equal to or slightly better than their male peers in all countries at primary level, and better than male youths in all countries except El Salvador at secondary level. Most notably, Afro-descendant girls are 7 and 4 percentage points above their male peers in Uruguay and Panama (figures 29 and 30).
Source: Authors’ calculations using SEDLAC (CEDLAS and the World Bank).
168 UnitedNationsChildren’sFund,Completar la escuela: un derecho para crecer, un deber para compartir(PanamaCity:UNICEF,2012),66.169 WandaCabella,MathíasNathan,andMarianaTenenbaum,“Lapoblaciónafro-uruguayaenelCenso2011,”inAtlas sociodemográfico y de la desigualdad del
Uruguay, fascículo2,coord.JuanJoséCalvo(Montevideo:ProgramadePoblación,UnidadMultidisciplinaria,FacultaddeCienciasSociales,UniversidaddelaRepública,2013),53.
-30%
-25%
-20%
-15%
-10%
-5%
0%Brazil Colombia Ecuador Panama Peru Uruguay
circa 2005 2015
-17.5-19.1
-18.1 -18.6-15.7
-3.5
-16.3-14.0
-24.2

Afro-descendants in Latin America | 91
Figure 29
Figure 30
School Attendance of Afro-descendants in Age Group 6 to 12 Years by Gender
Secondary School Attendance of Afro-descendants in Age Group 13 to 17 Years
Source: National censuses.
Source: National censuses.
0%
10%
20%
30%
40%
50%
60%
70%
80%
90%
100%
Female Male
Brazil EcuadorCosta RicaColombia UruguayPanamaNicaraguaMexicoEl Salvador
0%
10%
20%
30%
40%
50%
60%
70%
80%
90%
100%
Female Male
Brazil EcuadorCosta RicaColombia UruguayPanamaNicaraguaMexicoEl Salvador

92 | The World Bank
Afro-descendant population 25+ with tertiary degree Afro-descendant population 25+
0%
10%
20%
30%
40%
50%
Argentina Brazil Colombia Costa Rica Ecuador El Salvador Mexico Nicaragua Panama Peru Uruguay
As for tertiary education, the gaps are much more pronounced. A recent World Bank report found that nonwhite individuals have a 15-percentage-point smaller probability of entering higher-education institutions in Latin America and the Caribbean. In Brazil, in particular, the gap reaches 18 percentage points.170 Higher education also tends to favor urban populations.171 While 9 percent of Afro-descendants in urban areas have completed tertiary education, only 1.6 percent of rural Afro-descendants have done so.172
Afro-descendants are systematically underrepre-sented among Latin Americans aged 25 years and above who have achieved tertiary education. That is, while in the 10 countries listed in figure 31 Afro-descendants represent 25 percent of the population aged 25 years and above, on average they account for only 12 percent of those with higher education. The only exception is Panama,
with a largely urban Afro-descendant population (see box 8 for a possible explanation of this deviation for Panama, where less-educated Afro-descendants might be underreporting their race identity in national censuses).
dIscrImInAtIon In educAtIonAl settIngs
Discrimination plays an important role in explaining some educational gaps and outcomes. Education systems across the region often fail to promote the recognition of Afro-descendant identities and, on the contrary, contribute to promoting stereotypical and folklore-driven representations. Although most countries in Latin America ensure the universal right to education,173 there is a contrast between the type and quality of educational services available for Afro-descendants and for non-Afro-descendants. In Uruguay, for instance, the proportion of Afro-
Figure 31 Afro-descendant Share of Population Aged 25 Years and Above (General) versus Afro-descendant Share of Population Aged 25 Years and Above with Tertiary Degree
Source: National censuses.
170MaríaMartaFerreyra,CiroAvitabile,JavierBoteroÁlvarez,FranciscoHaimovichPaz,andSergioUrzúa,At a Crossroads: Higher Education in Latin America and the Caribbean(Washington,DC:WorldBank,2017),80.
171 InBrazilandVenezuela,wheredataontheblack(pretoandnegro/afrodescendiente)andbrown(mulatoandmoreno)populationshavebeencollected,thedatashownodifferencesintheformerandonlyaslightimprovementinprimaryandsecondaryeducationformorenos inthelatter.
172IncludingArgentina(17.6percentversus8percent),Honduras(8.5percentversus3.5percent),Mexico(19.3percentversus4.7percent),andPanama(21percentversus8.6percent).
173SeeTanyaKateríHernández,Racial Subordination in Latin America,75.

Afro-descendants in Latin America | 93
descendant children attending private rather than public elementary school is 1 in 13, whereas the proportion of whites is 1 in 4.174 While that in itself says little about the quality of education received by Afro-descendant children, it does suggest informal, perhaps indirect, forms of segregation in schooling, determined by other factors such as place of residence and socioeconomic status of the family.
Lack of public funding, inadequate facilities and class materials, and unsupported faculty are other factors that have been found to limit the performance of Afro-descendant youths throughout the region.175 Afro-descendant families also face obstacles in covering school-related expenses, including tuition, transportation, and school supplies. Schools attended by Afro-descendants tend to have fewer instructors per grade, or an incomplete roster of grades.176
Deficient schools can exacerbate ethno-racial gaps in the long run and shape learning outcomes.177
In high-quality schools in Brazil, for example, the performance of white and Afro-descendant students narrowed meaningfully (without entirely diminishing), but in low-quality schools, the racial gap on school performance reached its peak.178
In addition, there are limited numbers of Afro-descendant students in the most selective and competitive tertiary institutions in Latin America, which continue to be overrepresented by students
from white families and wealthier backgrounds. The expansion of the past 15 years in higher education has been concentrated in two-year technical programs, distance learning, and newer private universities of lower quality, which seem to be absorbing most of the new cohorts from poor and nonwhite households.179
Additionally, schools often contribute to promoting pervasive representations of black Latin Americans.180 In Argentina and Uruguay, for example, classroom dynamics have been found to create an environment hostile to Afro-descendants, contributing to early dropouts.181 As recently as 2013, a textbook of compulsory reading for second-year students sparked controversy in Peru after portraying the origin of the “black race” as the result of bathing in muddy water (figure 32). Equally troubling, one of the values and attitudes the reading was meant to promote, in the follow-up exercises, was “hygiene.” The book was soon after withdrawn from the national syllabus, but representations like this—some more subtle than others182—are common throughout the region. Textbooks in Colombia have been found to lack substantive discussions on race and ethnic differences,183 accurate descriptions of the geographic distribution of Afro-Colombians, and depictions of Afro-Colombian contributions to the country beyond the fields of music, sport, and dance.184
174WandaCabella,MathíasNathan,andMarianaTenenbaum,“Lapoblaciónafro-uruguayaenelCenso2011,”55.175Inter-AmericanCommissiononHumanRights,The Situation of People of African Descent in the Americas.176 UNICEF,Completar la escuela,105.177 BarbaraBrunsandJavierLuque,Great Teachers: How to Raise Student Learning in Latin America and the Caribbean (Washington,DC:WorldBank,2015),5.178 MariaLigiadeOliveiraBarbosa,“AsrelaçõesentreeducaçãoeraçanoBrasil:umobjetoemconstrução,”inOs mecanismos de discriminação racial nas escolas
brasileiras,eds.SergeiSoares,KaizôIwakamiBeltrão,MariaLigiadeOliveiraBarbosa,andMariaEugéniaFerrão(Brasilia:IPEA/Ford,2005),5–20,citedinLuizAlbertoOliveiraGonçalves,NatalinoNevesdaSilva,andNigelBrooke,“Brazil,”in The Palgrave Handbook of Race and Ethnic Inequalities in Education,eds.PeterA.J.StevensandA.GaryDworkin(Basingstoke,Hampshire:PalgraveMacmillan,2014),158–9.
179 MaríaMartaFerreyra,CiroAvitabile,JavierBoteroÁlvarez,FranciscoHaimovichPazandSergioUrzúa,At a Crossroads: Higher Education in Latin America and the Caribbean,78.
180Textbookshavebeenfoundtoshapetheviewpointsofteachersandstudentsonissuesofraceanddiscrimination.SeeElizabethCastilloGuzmán,“‘Laletraconraza,entra.’Racismo,textosescolaresyescriturapedagógicaafrocolombiana,”Pedagogía y Saberes34(2011):61–73.SeealsoMaríaIsabelMenaGarcía,“Lailustracióndelaspersonasafrocolombianasenlostextosescolaresparaenseñarhistoria,” Historia Caribe15(2009):105–22.
181 MargaritaSanchez,MauriceBryan,andMRGPartners, “Afro-descendants,DiscriminationandEconomicExclusion inLatinAmerica” (MinorityRightsGroupInternational, 2005), http://minorityrights.org/wp-content/uploads/old-site-downloads/download-78-Afro-descendants-Discrimination-and-Economic-Exclusion-in-Latin-America.pdf.
182 Color carne andcolor piel (skincolor)arecolorcategoriesregularlyusedinschoolsystemsthroughouttheregiontodescribebeige.Thisispartofthenaturalization,ineverydaylanguage,ofwhiteracialfeaturesasrepresentativeofproperhumancharacteristics.Ingeneral,myriadtermsandexpressionsdominateeverydaylanguageinLatinAmerica,whichassociateAfro-descendantswithantisocialbehavior(disorderly,wild,dirty,unintelligent)and,ingeneral,depictthemashavinganimal-likecharacteristics.
183 SandraSolerCastillo,“Pensarlarelaciónanálisiscríticodeldiscursoyeducación:elcasodelarepresentacióndeindígenasyafrodescendientesenlosmanualesescolaresdecienciassocialesenColombia,”Discurso & Sociedad2,no.3(2008):642–78.
184 ThetextbooksdescribeAfro-Colombiansalmostexclusivelyinrelationtoslavery.SeeEduardoRestrepoandAxelRojas,“Políticascurricularesentiemposdemulticulturalismo:proyectoseducativosde/paraafrodescendientesenColombia,”Currículo sem Fronteiras12,no.1(2012):157–73.

94 | The World Bank
Figure 32 “El Origen de las Razas”
Source: Aromas, Editorial San Marcos, Lima, 2010.
Note: The text in the picture (in Spanish) says: “The first race emerging was the white race, then emerged the Indians, because the water was already muddy, and finally some came out black …” (authors’ translation).
During the 1990s, Brazilian authorities targeted school textbooks to avoid the spread of prejudiced, discriminatory messages. The National School Textbook Program helped adjust the behavior
of publishing houses and authors of school textbooks. However, unequal outcomes persist and textbooks continue to depict Afro-Brazilians as passive victims and not as active historical agents who have contributed to the country in meaningful ways, especially in their role in the abolition of slavery and their struggle to create a more just society.185 Sociologist Marcelo Paixâo points out that unequal outcomes persist despite regulations because discrimination is rarely expressed in direct ways, but rather in the form of social expectations and incentives. In other words, “educational tools express racially stereotypical and prejudiced conceptions more easily because these are frequently masked in the spirit of jest, fun, or traditionalist ideas.”186
Finally, in countries where Afro-descendant communities have English or an indigenous language as their “mother tongue,” bilingual education continues to be absent or inadequately implemented.187
Access to education is a key priority for Afro-descendant organizations in Latin America, echoing the call of the Durban Declaration188 for greater efforts to ensure universal access to education and the adoption of policies for preventing discrimination in school environments.189 Although the region has made important efforts in expanding access to national education systems, for some Afro-descendant organizations ethno-education programs are an important, though still neglected, instrument for conveying their history and cultural knowledge to future generations (box 9).
185 SeeAmilcarAraujoPereira,“FromtheBlackMovement’sStruggletotheTeachingofAfricanandAfro-BrazilianHistory,”inRace, Politics, and Education in Brazil:Affirmative Action in Higher Education,eds.OllieA.JohnsonIIIandRosanaHeringer(NewYork:PalgraveMacmillan,2015),69.
186 Ibid.,25.187 Forinstance,inCostaRica,Guatemala,Honduras,andNicaragua.SeeMargaritaSanchez,MauriceBryan,andMRGPartners,“Afro-descendants,Discrimination
andEconomicExclusioninLatinAmerica.”188 DurbanDeclarationandProgrammeofAction,adoptedattheWorldConferenceagainstRacism,Durban,SouthAfrica,2001.189 ComisiónEconómicaparaAméricaLatinayelCaribe,Situación de las personas afrodescendientes.

Afro-descendants in Latin America | 95
The region has taken important—albeit uneven—steps in designing and promoting ethno-education policies for Afro-descendants. Guatemala passed several antidiscrimination laws for education (for example Decree No. 81, 2002), declared Garifuna an official language (Decree No. 19, 2003), and made efforts to institutionalize intercultural bilingual education. Honduras, through the Fundamental Law of Education (Ley Fundamental de Educación; Decree No. 262, 2011), enabled the incorporation of contents in school curricula that reflect the linguistic, cultural, and historical characteristics of each region. Nicaragua, through its General Law of Education (Ley General de Educación; Law No. 582, 2006), created the Regional Autonomous Education System (Sistema Educativo Autonómico Regional), responsible for managing programs of intercultural bilingual education, adapting the national system to the particular needs of each department, and supporting capacity-building initiatives for Afro-descendant teachers at all levels. Other countries, such as Argentina, Bolivia, Costa Rica, Peru, and Uruguay, have similarly adopted antidiscrimination laws and are working toward incorporating Afro-descendant history, culture, and language in school curricula.
Colombia offers important lessons for the region on the challenges that affect ethno-education programs. Afro-Colombians have mobilized for decades in favor of ethno-education programs, which resulted in significant legal changes. The constitution of 1991, Law 70 of 1993, Law 115 of 1994, Decree No. 804 (1995), and Decree No. 2249 (1995) support the formulation of programs tailored for Afro-Colombians. Such efforts have resulted in capacity-building programs for Afro-descendant teachers, the inclusion of Afro-Colombian contents in school curricula, and the creation of the Chair of Afro-Colombian Studies (Cátedra de Estudios Afrocolombianos), including a mandatory set of guidelines that requires public and private institutions—in primary and secondary education—to teach contents of Afro-Colombian history and culture. The Chair was created with the aim of adapting the national education system to the needs of Afro-descendants and finding ways of conveying the history of black communities to all Colombians. It was also viewed as a tool for raising awareness of past and present forms of discrimination. However, after several years of existence, these initiatives have generated mixed results. Despite robust legal support for current programs, one study found they are driven more by individual initiatives and less by systematic, nationwide policies. Many initiatives also lack financial resources and logistical support for training teachers. Finally, since higher-education institutions continue to adhere to nationwide standards for enrolling new students, some institutions are discouraged from designing programs that, while emphasizing Afro-Colombian heritage, could potentially reduce the time allotted to subjects that are expected at the college level.190
Box 9 | Ethno-education
190 EduardoRestrepoandAxelRojas,“Políticascurricularesentiemposdemulticulturalismo.”191 AsAndréCicaloargues,“Theconceptofaffirmativeactionreliesonarevisedversionoftheuniversalisticprincipleofequalitybyenvisagingthatthestateshould
recognizethedifferenceandredressthevulnerabilityofsociallyidentifiablegroupsthroughspecialcorrectivemeasuresthatarenonspecificallyclassbased.”AndréCicalo,Urban Encounters: Affirmative Action and Black Identities in Brazil(NewYork:PalgraveMacmillan,2012),3.
192 TanyaKateríHernández,Racial Subordination in Latin America.
chAnge toWArd ethno-rAcIAl InclusIon In educAtIon Is PossIBle
Affirmative action policies have been implemented in the last two decades with various degrees of success.191 Such programs are not equally distributed in the region and are less comprehensive
in scope than those implemented in India, Malaysia, or the United States, which contain provisions on employment and the public sector.192 But some countries, such as Brazil, Colombia, and Uruguay, are recognized for their affirmative action efforts, providing valuable lessons for the region. Brazil has the most comprehensive set of affirmative action policies for tertiary education.

96 | The World Bank
The adoption of affirmative action programs in education has been gradual, beginning in 2000 with the State University of Rio de Janeiro quotas,193 and peaking in 2012, when Federal Law 12,711/2012 instituted nationwide, targeted policies for Afro-descendants and three other categories of underrepresented students in public universities: (a) students who had attended public high schools; (b) low-income students from public schools; and (c) low-income indigenous, brown (pardo), and black (negro) students.194 As of 2015, 80 percent of state universities and 100 percent of federal institutions had adopted these policies. At the state level, 80 percent of universities had adopted a system reserving a special quota for underrepresented applicants, while two implemented a point system, which provides additional points in the admission exam for undergraduate applicants.195 Affirmative action policies have also included funding opportunities for tertiary education, institutional scholarships and grants for low-income Afro-descendants, and the inclusion of Afro-Brazilian culture and history in school curricula.196 Although these programs have not been free of controversy, a 2010 LAPOP survey found that 66 percent of Brazilians supported the quota policies for Afro-descendants,197 and over 90 percent of respondents also supported teaching Afro-Brazilian history and culture.198
Affirmative action programs have begun to change the racial make-up of Brazilian public universities,
making them more representative of the racial composition of Brazilian society. In effect, in 2002, only 2 percent of the students aged 18 to 26 years who enrolled in a public university declared to be black (negro), and 18 percent identified as pardos (mixed-race); at that time, the overall Afro-descendant population in ages 18 to 26 was 49 percent. A little more than a decade later, in 2015, the number of matriculated blacks increased to 6.3 percent, while the number of matriculated pardos soared to 41 percent. Afro-descendants represented about 57 percent of the population in ages 18 to 26 (figure 33).
With regard to performance, affirmative action programs are also yielding positive results.199 A study conducted in the State University of Campinas found that in 48 of the 55 undergraduate courses, quota students had higher scores—on average—than nonquota students. Another study at the University of Brasilia, which reserves a 20 percent quota for Afro-descendants, found no differences between quota and nonquota students concerning academic performance. An assessment in the medical school of the State University of Rio Janeiro also found no difference in academic performance across the student body. Affirmative action has also been found to raise academic expectations among high-school students who could potentially qualify for admission benefits, including a growing demand for free and accessible vestibular preparatory courses.200 Despite these positive steps,
193 Theuniversityinitiallypasseda40percentquotaforAfro-descendantsandmixed-racestudents(pretoandpardo),althoughthestatelegislaturelaterreformedthequotato20percentfor“self-declaredblacks/negros,20percentforpublicschoolstudents,and5percentforotherdisabledstudentsandindigenousBraziliansintotal.”SeeTanyaKateríHernández,Racial Subordination in Latin America,153–4.
194 Sincetheearly2000s,Brazilhasalsoimplementedaffirmativeactionprogramsforemployment.Similarly,in2002,presidentLuladaSilvacreatedtheSpecialOfficeforthePromotionofRacialEquality(SecretariadePolíticasdePromoçãodaIgualdadeRacial;SEPPIR),andin2011,thestateofRiodeJaneiroinstituteda20percentquotaforAfro-descendantsandindigenouspeopleapplyingforcivilservicepositions.SeeRosanaHeringerandOllieA.JohnsonIII,“Introduction,”inRace, Politics, and Education in Brazil:Affirmative Action in Higher Education,eds.OllieA.JohnsonIIIandRosanaHeringer(NewYork:PalgraveMacmillan,2015).
195 JoãoFeresJúnior,VerônicaToste,andLuizAugustoCampos,“AffirmativeActioninBrazil:AchievementsandChallenges,”inRace, Politics, and Education in Brazil:Affirmative Action in Higher Education,eds.OllieA.JohnsonIIIandRosanaHeringer(NewYork:PalgraveMacmillan,2015),189.
196 AndréCicalo,Urban Encounters,4.197 ThesurveycoveredfivemaingeographicregionsofBrazil(North,Northeast,Central-West,Southeast,andSouth)andcomprised1,500respondents(ofthe1,449
whoreportedcolorgroups,44werepardoand14werepreto).SeeJoãoFeresJúnior,VerônicaToste,andLuizAugustoCampos,“AffirmativeActioninBrazil,”193.198 GladysMitchell-Walthour,“Afro-BrazilianSupportforAffirmativeAction,”inRace, Politics, and Education in Brazil:Affirmative Action in Higher Education,eds.Ollie
A.JohnsonIIIandRosanaHeringer(NewYork:PalgraveMacmillan,2015),137.199 JoãoFeresJúnior,VerônicaToste,andLuizAugustoCampos,“AffirmativeActioninBrazil,”193.200 Publicuniversitiesenrollstudentsthroughadmissionexams(calledvestibulares).Whilevestibularesaremeanttobemeritocratic,studentswhoattendedprivate
secondaryschoolsaremorelikelytoearnhigherscoresandgetadmitted.Privatesecondaryschoolsarebetterfundedandusuallyofferspecialcoursesforcollegeadmissionexams.SeeJoãoFeresJúnior,VerônicaToste,andLuizAugustoCampos,“AffirmativeActioninBrazil,”180.

Afro-descendants in Latin America | 97
Figure 33 Population Aged 18 to 26 in Brazil (Left) and Population Aged 18 to 26 Enrolled in Tertiary Education (Right), by Race, 2002–15
Source: National censuses.
affirmative action programs need yet to address the gap between educational achievement and insertion in the labor markets, which is still skewed against Afro-descendant young professionals, especially in competitive professions (see previous section).
The Brazilian case gives room for optimism, but affirmative action should not be an isolated step or magical policy to eliminate racial gaps in access to education. Affirmative action policies can generate commendable results at the tertiary level of education, but if the gaps affecting Afro-descendant children and youths at primary and secondary level are not attended to, quota systems have a very low ceiling. Worse, they might fail to benefit the poorest or the most vulnerable, as the most excluded Afro-descendants are unlikely to have the educational background or the economic resources to profit from the quotas, creating a situation that is conducive to new forms
of segregation. Despite the overall progress of the past decades, the persistent underrepresentation of Afro-descendants in top academic institutions of the United States has been attributed to deficiencies in the way Afro-descendants are included in primary and secondary programs.201
In India, Malaysia, and South Africa, where affirmative action policies have also shown positive results, some preexisting patterns of discrimination persist, and they all point at the lack of attention to structural preconditions limiting the capacity of excluded groups to profit from the opportunities available. In India, despite the creation of a 22.5 percent quota in government jobs, university admissions, and electoral positions to level the playing field for the scheduled castes and tribes, they continue to be underrepresented in schools and in high-tier jobs in the public sector.202 In South Africa, affirmative action measures were established in
201“EvenWithAffirmativeAction,BlacksandHispanicsAreMoreUnderrepresentedatTopCollegesThan35YearsAgo,”New York Times,August24,2017.202 SeeP.S.Krishnan,“IndianSocialJusticeversusAmericanAffirmativeActionandtheCaseofHigherEducation,”inEqualizing Access: Affirmative Action in Higher
Education in India, United States, and South Africa,eds.ZoyaHasanandMarthaC.Nussbaum(NewDelhi:OxfordUniversityPress,2012);SonaldeDesaiandVeenaKulkarni, “ChangingEducational Inequalities in India in theContextofAffirmativeAction,”Demography 45,no.2(2008):245–70;AshwiniDeshpande,Affirmative Action in India and the United States(Washington,DC:WorldBank,2005).
2002
2003
2004
2005
2006
2007
2008
2009
2011
2012
2013
2014
2015
2002
2003
2004
2005
2006
2007
2008
2009
2011
2012
2013
2014
2015
Survey year
Population ages 18 to 26 in Brazil(2002–15)
White Black Pardo
Survey year
White Black Pardo
0%
20%
40%
60%
80%
100%
0%
20%
40%
60%
80%
100%
Population ages 18 to 26 enrolled in tertiary education,Brazil (2002–15)

98 | The World Bank
1997 to redress the effects of apartheid, but still encounter a number of obstacles, including the lack of racially based admission policies across many universities, the ongoing segregation of many higher-education institutions, and the persistent underrepresentation of black students among the college population.203
In Malaysia, following a series of racially motivated riots in 1969, the government passed a number of affirmative action measures aimed at assisting excluded racial groups (the Bumiputera, “sons of the soil”), who were viewed as falling behind the Chinese and Indian populations. These measures included quotas and scholarships for attending public universities, employment quotas for public and private sector jobs, and preferential benefits for accessing public housing and purchasing residential property. As Malaysia’s prosperity has soared, however, some questions have been raised with regard to the bias in these policies toward benefiting urban and wealthy elites among the Bumiputera.204
Notwithstanding these flaws, affirmative action has markedly expanded the participation of excluded
groups in all these cases, including Brazil. Yet, the path to inclusive education requires a holistic approach, attentive to the contextual differences that affect Afro-descendant youths and children. In some cases, conditional cash transfers may contribute to eliminating barriers in access, especially when low income and an inability to afford school-related costs are preventing Afro-descendant children from attending school.205 In other cases, Afro-descendants experience exclusion not due to lack of access, but because they reside in areas that have poor educational services. In this section we have referenced studies from Argentina, Brazil, and Uruguay that show the negative impact of discriminatory classroom dynamics, differential treatments, and degrading representations in textbooks on school outcomes and dropout rates. Eliminating these barriers may require a number of approaches, including capacity building, textbook and curriculum reviews, and awareness campaigns.206 Thus, full educational inclusion will need to start by addressing the needs of each particular context, beginning with the terms of their inclusion in early-year programs and accompanying Afro-descendant children and youths throughout their entire educational cycle.
203 See Saleem Badat, “Redressing the Colonial/Apartheid Legacy: Social Equity, Redress, and Higher EducationAdmissions in Democratic SouthAfrica,” inEqualizing Access: Affirmative Action in Higher Education in India, United States, and South Africa,eds.ZoyaHasanandMarthaC.Nussbaum(NewDehli:OxfordUniversityPress,2012).
204 SeeHwok-AunLee, “AffirmativeAction inMalaysia:EducationandEmploymentOutcomessince the1990s,”Journal of Contemporary Asia 42,no.2(2012):230–54;“Race-basedAffirmativeActionisFailingPoorMalaysians,”The Economist,May18,2017.
205 Ariel Fiszbein,NorbertSchady, FranciscoH.G.Ferreira,MargaretGrosh,Niall Keleher,PedroOlinto, andEmmanuelSkoufias,Conditional Cash Transfers Reducing Present and Future Poverty(Washington,DC:WorldBank,2009).
206 EmanueladiGropello,ed.,Meeting the Challenges of Secondary Education in Latin America and East Asia: Improving Efficiency and Resource Mobilization (Washington,DC:WorldBank,2006).

Toward a Framework for Ethno-racial Inclusion

100 | The World Bank
Afro-descendants improved their situations a great deal during the past decade in terms of access to services, poverty reduction, and recognition. Yet, with the exception of indigenous peoples, they are still poorer than other Latin Americans, have fewer years of education, are more often victims of crime and violence, tend to live in underserved areas, and are confronted with glass ceilings in the job market. Many of these disadvantages hold true after comparing them with individuals and households living under similar conditions but of different race. That is, holding everything else constant (for example, educational level, sector of employment, urban or rural residence, number of dependents in the household), Afro-descendants are still more likely to be poor, less likely to complete formal education at all levels, more likely to get paid less for similar jobs, and, more dramatically, have fewer chances of social mobility.
Structural discrimination plays a central role in explaining many of these gaps. Several studies and opinion surveys show that Latin Americans have, in general, a high appreciation of the structural disadvantages faced by Afro-descendants, and tend to favor historical and structural causes over victim-blaming ones when explaining these gaps.207 The region also has a strong body of laws and subscribes to international agreements protecting Afro-descendants from all forms of racial discrimination. And yet, in Latin America, poverty is disproportionally associated with ethno-racial minorities. This is because discrimination is ingrained in informal expressions of everyday life that naturalize racial hierarchies and reinforce ethno-racial biases, from verbal interactions and humor208 to hiring practices and police
profiling,209 without individuals being aware of their existence and effects.210 Thus, while structural discrimination can appear to many as “nobody’s fault,”211 it penetrates institutions and impairs Afro-descendants’ access to markets, services, and spaces, as shown throughout this report. Discrimination hence hinders the path toward social inclusion, blocking Afro-descendants’ ability to realize their full human potential.212
Despite the growing recognition of structural forms of ethno-racial discrimination, and the widespread evidence of its socioeconomic consequences, the region has been slow to include policies and programs specifically targeted at Afro-descendants until recently. The legal framework protecting the rights of Afro-descendants remains patchy and incomplete, and heavily tilted toward antiracist legislation, with limited enforcement capacity. Despite important gaps in market inclusion and education, only a minority of countries have special provisions for employment and education in their legislation. Also, even in countries where Afro-descendants are identified as an ethnic minority, and therefore protected by laws and international agreements pertaining to indigenous and tribal peoples’ rights, governments often fail to abide by this legislation in the case of Afro-descendant communities.213
Nevertheless, the perseverance of Afro-descendant representatives and scholars is giving rise to a shift in this situation. Albeit slowly, many countries have incrementally adopted reforms that are raising the visibility of Afro-descendants in policy debates.214 A majority of statistical institutes have included ethno-racial variables in national censuses and a
207 EdwardTellesandStanleyBailey,“UnderstandingLatinAmericanBeliefsaboutRacial Inequality,”American Journal of Sociology 118,no.6(2013):1559–95;GraziellaMoraesSilvaandMarceloPaixão,“MixedandUnequal:NewPerspectivesonBrazilianEthnoracialRelations,”inPigmentocracies: Ethnicity, Race, and Color in Latin America,211.
208 ChristinaA.SueandTanyaGolash-Boza,“‘ItWasOnlyaJoke’:HowRacialHumourFuelsColour-BlindIdeologiesinMexicoandPeru,”Ethnic and Racial Studies 36,no.10(2013):1582–98.
209 JenniferRoth-Gordon,Race and the Brazilian Body: Blackness, Whiteness, and Everyday Language in Rio de Janeiro (Durham,NC:DukeUniversityPress,2017).210 WorldBank,Inclusion Matters,77–8.211 PaulFarmer,“AnAnthropologyofStructuralViolence,”inPartner to the Poor: A Paul Farmer Reader,ed.HaunSaussy(Berkeley:UniversityofCaliforniaPress,
2010),383.212 SeealsoPhilippeBourgois,“TreintaañosderetrospectivaetnográficasobrelaviolenciaenlasAmérica,”inGuatemala: violencias desbordadas,eds.JulíanLópez
García,SantiagoBastos,andManuelaCamus(Córdoba:ServiciodePublicacionesdelaUniversidaddeCórdoba,2009).213 InBrazil,forexample,ofthe2,159communitiescertifiedbythegovernmenttodate(mostlyinthestatesofBahía,Maranhão,andMinasGerais),only24have
receivedlandtitles(seebox11).InColombia,whereAfro-ColombianshaveethnicminoritystatusunderLaw70of1993,thegovernmenthasbeenslowtoconcedeagriculturalorproductivelandtoAfro-Colombiancommunities,arightrarelycontestedtoindigenouscommunities.
214 EdwardTellesandtheProjectonEthnicityandRaceinLatinAmerica(PERLA),Pigmentocracies.

Afro-descendants in Latin America | 101
growing number of household surveys and other statistical tools. Also, a lesser but growing number of countries are implementing or expanding targeted and affirmative action programs.215 This experience provides a backdrop against which to look for strategies to close ethno-racial gaps, and allow countries to identify a framework to think of Afrocentric approaches for social inclusion.
Throughout the report, we have emphasized that the social exclusion of Afro-descendants is a multilayered problem, as they face cumulative disadvantages, unequal opportunities, and lack of respect and recognition. In this last section, we acknowledge the complexity and country-specific consideration that will be required for policy design. The solutions to their situations cannot be the same everywhere and need to be tailored to the specific conditions of each country and situation. We therefore provide not specific recommendations to this end, but a few elements that we believe should be considered when designing policies aimed at improving Afro-descendants’ opportunities and abilities, while respecting and recognizing their dignity as indispensable partners in the efforts to rid the region of poverty and lead it to a path of inclusive and sustainable growth.
stArt WIth A good dIAgnosIs
A starting point to developing a coherent set of policies aimed at fostering the social inclusion of Afro-descendants is to acknowledge that their population is highly heterogeneous, both culturally and socioeconomically, and between and within countries. Therefore, no single solution will suit all situations, and, most likely, policies aimed at them will involve several sectors and levels of government, and account for overlapping disadvantages that prevent the full development of their potential in every setting, situation, and time.
There are also big differences between Afro-descendant households. Female-headed house-holds tend to fare worse than male-headed ones,
and some racial categories tend to fare better than others within countries (mixed-blood versus black categories, for instance). This diversity of situations produces dissimilar forms of exclusion, which require improved data methods but also better analytical frameworks for social inclusion.
The growing disaggregation of data along ethnic and racial lines has been key to start developing a sense of the impacts of structural discrimination on Afro-descendants and indigenous peoples, the areas where they lag behind, and the opportunities and lessons available to close these gaps. The region has made tremendous progress in this sense, but reversing centuries of statistical invisibility will not be achieved overnight, or simply by adding variables to censuses. There still are issues to refine in the way Afro-descendants are being counted, the way questions are being asked in censuses and household surveys, and how Afro-descendants are to be incorporated in key statistical records where they are not yet included, most notably in education, health, and crime and violence records. Also, experience from across the region shows that statistical inclusion must go hand in hand with other policies aimed at reverting a prolonged history of stigmatization and invisibility (box 10), and must include careful analysis and recalibration of the statistics that are being produced.
The data used throughout this report are only a small fraction of the data compiled and processed by the World Bank in the context of this study. As part of the overall project, the World Bank created a set of tools that provide a wealth of additional information that is publicly available to facilitate further analysis. The tools developed for this report offer an improvement in terms of both scope and depth compared to previous sources available in the region and the World Bank database. The user should be aware of the data concerns mentioned in the report, in particular with regard to variations due to changing self-reporting and perceptions (see appendix B).
215 TiannaPaschel,Becoming Black Political Subjects,117.

102 | The World Bank
Box 10 | Fighting Statistical Invisibility in Peru
Peru boasts one of the most diverse and complex human geographies in the region, but few realize that Afro-descendants account for over 2 percent of its population. Afro-Peruvians were last included in the census of 1940 and since then had remained largely invisible to the state as a separate category until they were reintroduced in 2017 (the data are not yet available for analysis as we write). The government of Peru has realized, however, that understanding their status is imperative for advancing its social inclusion agenda.
Supported by the World Bank, the Ministry of Culture of Peru launched in 2013 a series of activities aimed at increasing the visibility of Afro-Peruvians, raising awareness of their situations, and promoting their inclusion in the broader political agenda. These activities included the production of nationwide statistical information through a specialized survey and the preparation of validated ethno-racial variables used in the 2017 census.
The analytic work was accompanied by a communications and engagement campaign, aimed at stimulating the debate both within and outside the Afro-Peruvian community (figure 34). The use of high-quality audiovisual and testimonial material proved effective in reaching out to the Afro-Peruvian population and stimulating their participation in the nationwide specialized survey and the forthcoming census.216
Figure 34 “Proudly Afro-Peruvian”—part of a photo and video campaign prepared by the Ministry of Culture of Peru and the World Bank in 2013
216 Seehttp://www.worldbank.org/en/news/feature/2013/10/14/Peru-negro-color-invisible.

Afro-descendants in Latin America | 103
Having statistical data is only a first step toward understanding social exclusion, but an analytic framework aimed at fostering social inclusion must go beyond metrics and ask why poor outcomes continue to persist. Innovative and integral approaches will be needed to disentangle the series of interconnected factors holding back Afro-descendant households. Improvements in access to tertiary education and fair representation in educational syllabi and textbooks, for instance, will not produce positive results if the glass ceilings confronting Afro-descendants in the job market are not understood and addressed. Also, although poverty and exclusion are often interconnected, exclusion can occur in the absence of poverty. The underrepresentation of Afro-descendant professionals in management positions is an example of exclusion that is not necessarily related to poverty, yet it limits the full development of their capacities.
The analysis of historically excluded groups, such as Afro-descendants, needs to look for hidden forms of exclusion in the data, such as the statistical distortions produced by underreporting disadvantaged racial categories. The ascription to categories describing lighter skin color or mixed-race origin, for instance, is used in most of the region to soften the discriminatory implications of identifying oneself as black, driving the statistical analysis in one direction or the other. The diagnostic of Afro-descendants’ situations must consider these nonmetric aspects and acknowledge the fluid and context-dependent nature of racial identities.
desIgn PolIcIes WIth cleAr, sPecIfIc, And meAsurABle goAls
The design of policies aimed at closing ethno-racial gaps must set specific goals that have clear responsibilities and competencies for implementation, and allow for assessing progress. The United Nations International Decade for People of African Descent provides a unique opportunity to advance specific goals regionally,
but, regrettably, there has been little progress so far, and Afro-descendant representatives often complain that it is an unfunded mandate. The region nonetheless has amassed experience that can help devise strategies to close many of the gaps described in this report, and can serve to unify efforts toward specific targets that can be monitored over time.
In particular, the region has experimented over the past three decades with policies aimed at Afro-descendants framed within two distinct legal sets of international agreements: policies focused on and asserting the right to cultural difference and self-determination, inspired by the principles contained in, among others, the ILO Indigenous and Tribal Peoples Convention, 1989 (No. 169) (for example, Colombian Law 70 of 1993), which we will call ethno-policies; and those asserting the right to equal treatment and nondiscrimination, inspired by, among others, the Durban Programme of Action and the International Convention on the Elimination of All Forms of Racial Discrimination (for example, Law 19,122 of 2013 in Uruguay and the Law of Social Quotas of 2012 in Brazil), which we will call policies of racial equality. A third type of policies, not usually framed within a discourse on racial equality, refers to policies of general territorial development in areas with high concentrations of Afro-descendants, which, as shown in this report, tend to be among the most underdeveloped and neglected (table 7).
These sets of policies are not mutually exclusive. On the contrary, they promote different types of actions and are ideally aimed at different forms of exclusion that often have cumulative effects on the same population. Ethno-policies are more assertive on the protection of collective rights and self-determination (for example, land rights, ethno-education, and inclusion of free, prior, and informed consent), while policies of racial equality focus more on the assertion of individual equal rights and the generation of equal opportunities (for example, antidiscrimination laws, affirmative action, and quota systems).

104 | The World Bank
The policies applied within these three frameworks have produced heterogeneous results. Often, there is a disconnect between the creation of legal provisions protecting Afro-descendants’ rights and their actual implementation, which is usually undermined by entangled bureaucratic proceedings, lack of coordination, and high turnover among government actors (box 11).
Table 7 Ethno-racial Policies Implemented in the Region
ethno-policies Policies of racial equality territorial development
Referent international frameworks
ILO Indigenous and Tribal Peoples Convention, 1989 (No. 169)
Committee on the Elimination of Racial Discrimination, Durban Programme of Action
Intersectoral policies and agreements
Dominant discourse
Ethnicity, right to difference Race, right to equal treatment
Development of lagging regions
Target population
Rural Afro-descendant communities, enclaves, and Afro-indigenous minorities
General Afro-descendant population facing structural disadvantages
Afro-descendants living in lagging regions
Type of reforms promoted
Protection and promotion of collective rights
Policies of social inclusion and equal treatment
Multisectoral development
Examples of policies promoted
Territorial rights, political autonomy, community-driven development, ethno-education, consultation and consent in decision making (inclusion of free, prior, and informed consent), cultural recognition, recovery and protection of historical memory, safeguards from development, protection of traditional livelihoods, political quotas for representation, etc.
Affirmative action in education and labor, political engagement and representation, revalorization of Afro-descendant contributions to society, awareness raising, enforcement of antiracist legislation, statistical visibility, access to justice, crime and violence prevention, etc.
Development of infrastructure, inclusion in national education and health systems, connection to markets, housing, etc. (policies aimed at better integrating lagging regions irrespective of race)
Another recurring problem is lack of clarity on the specific needs and barriers confronted by Afro-descendants, in their specific situations, and therefore on the type of policy strategy available to meet those specific needs. That is, Afro-descendants are often treated as a homogeneous social group and therefore assumed to be in need of a singular type of policies.

Afro-descendants in Latin America | 105
Box 11 | Quilombolas’ Long Road to Recognition
The Brazilian constitution grants special land rights to quilombolas (Article 68, 1988), a change enacted as a form of reparation for the past conditions of slavery. The government has also ratified ILO Convention No. 169 and passed Decree 4,887 (2003), granting quilombolas the right to self-identification and special land titles. Despite the robust legal frameworks, the land-titling process for quilombolas has been slow, as petitioning communities must provide documentation and undergo a long legal process that may inadvertently create exclusion.217
First, quilombolas must apply for a “certificate of recognition” from the Palmares Cultural Foundation and provide evidence of the particular history, cultural practices, and traditional use of land of the community. If communities fail to meet these criteria, they risk being formally ignored. Once the Palmares Cultural Foundation certifies a quilombo, they are categorized as “Traditional Peoples and Communities” (Povos e Comunidades Tradicionais). Once certified, quilombolas are eligible for targeted government programs through the Brazil Quilombola Program, including electricity and water infrastructure, the Bolsa Família social welfare program, medical services, and special funding for schools. But if a quilombo lacks a “certificate of recognition,” they are ineligible for special funding.218
After certification, quilombolas can request land titles from the National Institute for Colonization and Agrarian Reform (Instituto Nacional de Colonização e Reforma Agrária; INCRA). The land-titling process can take up to two years (depending on the agency’s funding and staff), but it can be delayed if private landowners are occupying part of the land (which usually results in disputes in court or compensation from INCRA), or if other public entities have a stake in the land. Of the 2,422 records kept by SEPPIR,219 2,159 communities have been certified (mostly in the states of Bahía, Maranhão, and Minas Gerais), but only 24 have received land titles (figure 35).
217 ElizabethFarfán-Santos,“‘Fraudulent’Identities:ThePoliticsofDefiningQuilomboDescendantsinBrazil,” Journal of Latin American and Caribbean Anthropology 20,no.1(2015):110–32.
218 ElizabethFarfán-Santos,Black Bodies, Black Rights: The Politics of Quilombolismo in Contemporary Brazil (Austin,TX:UniversityofTexasPress,2016),119.219 Seehttp://monitoramento.seppir.gov.br/paineis/pbq/index.vm?eixo=1.
Figure 35 Certified Quilombolas
Source: SEPPIR and Programa Brasil Quilombola.
Comunidades Quilombolas Certificadas Comunidades Certificadas por Año
2001
2004
2005
2006
2007
2008
2009
2010
2011
2012
2013
2014
3
166
329
401
156
129100
238216
144
364
146
512 - 614
409 - 511
307 - 408
205 - 306
102 - 204
0 - 101
AC
RO
MT
AM
RRAP
PA
MA
TO
PI
CE RN
PBPE
ALSEBA
MG
DFGO
MS
SP
PR
SC
RS
ES
RJ

106 | The World Bank
Having a clearer framework for ethno-racial policies will help better focus decision making and tailor social inclusion strategies to tackle the real issues holding back Afro-descendants in their specific situations. For instance, Colombia is probably the country that has generated most precedent regarding the inclusion of Afro-descendants within the set of legal instruments inspired by ILO Convention No. 169. Under Law 70, Afro-Colombians have been protected by legislation that puts them on a par with indigenous peoples. Though this strategy has allowed for important progress in various areas (for example, a special office was created within the Ministry of the Interior; Afro-Colombians are included in consultation processes operationalized by the same ministry; and two special seats are reserved for them in the National Congress), this approach has not taken into account the necessities of territorial development of Afro-Colombians on the Pacific coast or the biases and barriers in the job market that prevent urban Afro-Colombians from developing their full potential.
It is therefore important to understand the specific situations affecting Afro-descendants, the reforms they want to be promoted (with goals and progress indicators), and the policies available to achieve them. There should also be incentives for coordination among different actors and tools that facilitate this process (for example, information-sharing tools that facilitate intersectoral cooperation, coordination mechanisms, and high-level oversight and responsibility). Very often, the sort of interventions needed to help Afro-descendants break the cycle of poverty do not require substantial government spending, or specialized targeted programs, but rather small modifications or changes in scope in preexisting programs. In fact, experiences such as Mexico’s
conditional cash transfer program Progresa/Oportunidades show that policies that are not specifically targeted at ethnic minorities can still have positive effects in terms of poverty alleviation and school enrolment.
For instance, a recent report showed that crime and violence prevention requires comprehensive and interconnected approaches—spanning from pregnancy to adulthood—grounded in a deep understanding of the underlying conditions that make some individuals or collectives more prone to be victims or perpetrators.220 Afrocentric approaches to crime and violence prevention therefore require a review of education and socialization programs that are already in place, as well as a change of mindset regarding institutional biases that lead to stigmatization and criminalization of young Afro-descendants, exacerbating crime-poverty traps in Afro-descendant communities. None of these typically involves extra costs or specialized sectorial programs, but rather a greater level of coordination and the right incentives for several sectors (such as education, justice, security enforcement, and youth employment programs) to work together toward the goal of eliminating the crime and violence cycles afflicting many Afro-descendant households.
Policies aimed at Afro-descendants must also take into account that their situations are most often driven by multiple layers of exclusion, so single-minded approaches often fail to deliver substantial changes. One of the key areas addressed by Uruguayan Law 19.122, of 2013, is discrimination in the labor market. Article 4 of the law, in particular, aims at correcting employment and wage disparities by creating an 8 percent quota for Afro-descendants in public sector jobs.221 Although the law was welcomed as a decisive and
220 LauraChioda,Stop the Violence in Latin America. LatinAmericanDevelopmentForum(Washington,DC:WorldBank,2017).221 Onestudyin2010concludedthatAfro-descendantsearnonaverage35percentlessperhourthanwhiteworkersforsimilartasks.Furthermore,forlow-skilled
positions,thewagegapwasslightlylower(22percentless),andforhigh-skilledandmanagerialpositions,itreached82percent.SeeMartínIguini,NoeliaMaciel,FabianaMiguez,andOscarRorra,“AnálisisdelaimplementacióndelaLey19.122:laconstruccióndepolíticaspúblicasparalaequidadétnico-racialdesdelaperspectivadelasociedadcivil,”inHorizontes críticos sobre afrodescendencia en el Uruguay contemporáneo: primera jornada académica sobre afrodescendencia,Montevideo, 2016(Montevideo:InvestigacionesenDerechosEconómicos,SocialesyCulturales,DirecciónNacionaldePromociónSociocultural–MinisteriodeDesarrolloSocial,2017),74.

Afro-descendants in Latin America | 107
very positive move by the government to address the historical gaps between Afro-Uruguayans and others in access to state jobs and education, enforcing the quota system has not been easy. There are issues regarding the types of jobs Afro-Uruguayan are getting within the state, more often related to low-skilled, nonmanagerial jobs. A recent report,222 based on data from the Ministry of Social Development, showed that in 2014 only 1 percent of all new hires were Afro-descendants, and approximately 64 percent of those were affiliated with the Ministry of Defense as low-rank soldiers. That year, in fact, only three institutions met the quota threshold. In 2015, there was an increase of 143 percent, but 79 percent of new jobs were in the Ministry of Defense. Again, only three institutions had reached the quota requirement. Finally, in 2016, 1.8 percent of new state jobs went to Afro-descendants, but as in previous years, there was a disproportionate number of men and a lack of high-skilled or managerial positions—even though there was a slight increase in technical and professional positions with respect to 2014 and 2015.
To be sure, the approval of the Uruguayan law on racial equity is commendable, but the slow progress in filling the quotas and the segregation of most new hires under the law in low-skilled, low-paying jobs underlines the need to take an integral approach to close these historical gaps. The implementation of the law has been hampered, according to several reports, by numerous factors, including traditional gaps in education,223 lack of capacity-building training and institutional plans for complying with the quotas, lack of a roadmap
with milestones to raise employment among Afro-descendants in the private sector, and lack of a nationwide policy for combating racism and discrimination.224 The Committee on the Elimination of Racial Discrimination also regretted the absence of measures for improving political participation among Afro-Uruguayans, given the small numbers of them in decision-making positions in both the private and public sectors (0.8 percent).225
chAnge the mentAl models thAt drIve Afro-descendAnts’ exclusIon
The region must also address the beliefs and mental models that drive the exclusion of Afro-descendants. There is growing evidence that mental models shape individuals’ perceptions of themselves and the world, influencing not only how they perceive and recognize opportunities, but also how they act on them (or not). Mental models can hence be powerful contributors to social exclusion and should therefore be the target of policy interventions.226 Increasing peoples’ voice and participation in decision making has proved to be an effective way to fight negative mental models and stereotypes that preclude the inclusion of underrepresented groups, through the reservation of political quotas, for instance, or their inclusion in consultation processes and in development driven by the communities themselves.227 Similarly, interventions focused on noncognitive skills (such as empathy, tolerance of different opinions, and resilience) could target the barriers that reinforce the exclusion of Afro-descendants.228 Noncognitive skills can be developed in school
222 SeeMartínIguini,NoeliaMaciel,FabianaMiguez,andOscarRorra,“AnálisisdelaimplementacióndelaLey19.122,”69–84.223 UNICEFOficinadeUruguay,La universalización de la educación media en Uruguay: tendencias, asignaturas pendientes y retos a futuro(Montevideo:UNICEF,
2010).224 ComitéparalaEliminacióndelaDiscriminaciónRacial,Observaciones Finales sobre los Informes Periódicos21ºa23ºCombinadosdelUruguay(2017), CERD/C/
URY/CO/21–23.225 Ibid.226 WorldBank,World Development Report 2015: Mind, Society, and Behavior(Washington,DC:WorldBank,2015).227 KarlaHoff,“BehavioralEconomicsandSocialExclusion:CanInterventionsOvercomePrejudice?”PolicyResearchWorkingPaperno.7198(Washington,DC:
WorldBank,2015).228 Arecentreportfindsthatnoncognitiveskillshavebeeninstrumentalizedaskeycomponentsforimprovingeconomicandschoolingoutcomes.Noncognitiveskills
“fostersocialinclusionandpromoteeconomicandsocialmobility,economicproductivityandwell-being.”SeeTimKautz,JamesJ.Heckman,RonDiris,BasterWeel,andLexBorghans,Fostering and Measuring Skills: Improving Cognitive and Non-Cognitive Skills to Promote Lifetime Success(OECD).

108 | The World Bank
environments, both in the early and later stages of an individual’s life. While the metrics for measuring their effect over time are still a matter of debate, fostering noncognitive skills can be an important mechanism for promoting ethno-racial equality and building inclusive social environments.
Studies of race relations in schools have shown that the school setting in many Latin American countries duplicates and reinforces traditional asymmetries between whites and Afro-descendants.229 Racial hierarchies existing in the school environment are manifested in myriad ways, including differential probability of receiving verbal praise or criticism, or nonverbal practices demonstrating or withholding affection, pedagogical practices that—consciously or not—reinforce racial stereotypes or the invisibility of Afro-descendants.
A study of school textbook illustrations from the 1980s in Brazil found that whites were presented more often in text and images than members of any other racial group, and they tended to be represented in positions of prestige (such as doctors or family fathers). Afro-descendants usually appeared in stereotypically subservient roles (such as maids or construction workers). Also, whites appeared representing more diverse professional situations (36 in all), while Afro-descendants were represented only in 9 (mostly menial occupations).230 During the 1990s, however, the Brazilian government targeted school textbooks to avoid the spread of prejudiced, discriminatory messages. The National School Textbook Program has helped over the past two decades to adjust the behavior of publishing houses and authors of school textbooks, showing that change and monitoring the way Afro-descendants are represented in school textbooks is possible.231
strengthen Afro-descendAnts’ voIce And PArtIcIPAtIon
Lack of recognition not only renders ethno-racial minorities “invisible” in official statistics, it also creates barriers in access to services and in their ability to take advantage of the opportunities available to them. Afro-descendants might exclude themselves from development if they feel that their cultures, values, and dignity might be compromised. In Peru, a 2011 study by the Ombudsman’s Office found that about 70 percent of the Afro-Peruvian population who suffered any illness the previous year had not sought medical assistance due to perceived discrimination, despite inhabiting areas where public health services were available.232 Experience shows that including the points of view of excluded groups is critical to avoid reproducing prejudices that can lead to failed development and, more importantly, to drive change in communities seemingly trapped in chronic poverty cycles.
But recognition rarely happens without pressure from organizations representing excluded social groups. Afro-descendants have, in fact, a long history of negotiations and political engagement with the majority society. Black identities were not an axiomatic response to slavery or racism, but the “contingent products of agency and the cultural and political work of articulation” by Afro-descendants themselves.233 Pro-Afro-descendant legislation approved throughout the region has been possible only due to the tenacity of Afro-descendant movements. However, they remain a very underrepresented minority in decision-making arenas, in both the private and public spheres, as they encounter numerous obstacles for exercising their political, economic, and cultural rights.234 In fact,
229 MarceloPaixão,The Paradox of the “Good” Student: Race and the Brazilian Education System(Washington,DC:PREAL,2009);WandaCabella,MathíasNathan,andMarianaTenenbaum,“Lapoblaciónafro-uruguayaenelCenso2011.”
230 ReginaPinto,“Arepresentaçãodonegroemlivrosdidáticosdeleitura,”Caderno de Pesquisas63(Nov.1987):88–92,citedinMarceloPaixão,The Paradox of the “Good” Student,23.
231 MarceloPaixão,The Paradox of the “Good” Student,25.232 DefensoríadelPueblo, Los Afrodescendientes en el Perú: una aproximacion a su realidad y al ejercicio de sus derechos (Lima:DefensoríadelPueblo,2011).233 TiannaPaschel,Becoming Black Political Subjects,13

Afro-descendants in Latin America | 109
it has been estimated that the entire Afro-descendant community in Latin America is represented by fewer than 100 legislators.235 With few exceptions, however, the countries of the region have been reluctant to reserve quotas for Afro-descendant leaders or political parties in their institutional architecture, nor have they stimulated Afro-descendants’ political inclusion by other means.
Expanding the voice and participation opportunities of Afro-descendants will help address the needs and priorities of this highly heterogeneous population without ascribing to the stereotypes and biases that have historically dominated the region’s understanding of their situations. Experience shows that without the participation of local communities in all phases of development (from design through implementation), development programs tend to engender old and new prejudices that hamper their success. In stark contrast, there is widespread agreement in the region on the need to involve indigenous communities in development programs and policies.236
The region must invest more in strengthening the technical and organizational capacities of Afro-descendants, via representative organizations. This is fundamental to help Afro-descendants elaborate and convey a common view of their development needs and aspirations, locally, nationally, and regionally. Latin America has accumulated sufficient experience and knowledge to address many of the gaps described in this study, and do it in ways that respect the identities and dignities of Afro-descendants. But to take advantage of these lessons and knowledge, the region must recognize that Afro-descendants are indispensable partners on the path of sustainable growth and inclusive prosperity.
deePen regIonAl knoWledge on crItIcAl AreAs of develoPment And BuIld rePosItorIes of good PrActIces And exPerIence
The rapid increase in the statistical inclusion of Afro-descendants has been accompanied by an equally rapid expansion of the specialized research and literature. Old paradigms that led the understanding of ethno-racial relations in the region—such as the myth of racial democracy—have given way to new, better informed theories of the drivers behind their persistent exclusion. There is also a growing understanding of the role of Afro-descendants in the historical and current formation of the region. This report has summarized some of the messages that we found more relevant for development purposes.
However, much of the relevant research is still limited in scope and breadth to specific countries or populations, and important data and analytic gaps persist in areas critical for Afro-descendants today, such as their health status or the strategies available to fight the wave of crime and violence that afflicts Afro-descendant youths in many countries. The study of Latin American Afro-descendants is also disconnected from discussions and lessons on social inclusion learned elsewhere, related to the wider African diaspora and other groups excluded on the basis of their ethno-racial identity, for example, or the struggles of the anti-apartheid movement in South Africa or the civil rights movement in the United States.
Afro-descendant organizations have taken the lead in trying to bridge some of these experiences, as African and North American representatives are invited to many regional Afro-descendant
234 SeeInter-AmericanCommissiononHumanRights,The Situation of People of African Descent in the Americas,11;EdwardTelles,“RaceandEthnicityandLatinAmerica’sUnitedNationsMillenniumDevelopmentGoals.”
235 JudithA.Morrison,“SocialMovementsinLatinAmerica,”258.236 WorldBank,Indigenous Latin America in the Twenty-First Century.

110 | The World Bank
meetings, but research is still lagging in this respect. A common comparator for Afro-descendant development and policy analyses are indigenous peoples. Some Afro-descendant groups—such as the Palenques in Colombia, the Garifuna in Central America, and the Quilombolas in Brazil—have characteristics that align with those of the indigenous population, especially their historical connection to particular territories, their distinctive political and decision-making institutions, and their demands for protecting communal land tenure systems. These Afro-descendant groups are also exposed to similar threats to those that affect indigenous peoples, and which might require protection measures found in the ILO Indigenous and Tribal Peoples Convention, 1989 (No. 169), and the United Nations Declaration on the Rights of Indigenous Peoples, 2007. Deeper analysis is needed to understand the legal and policy tools for addressing the special rights and priorities of this segment of the population. But this emphasis should not translate into policy discussions and studies narrowly focused on issues relevant to a minority of rural Afro-descendant communities, which are important arguments in themselves, but fail to account for the needs and views of the majority Afro-descendant population, which is neither rural nor defined by ethnicity. More research is thus required to understand the multiple aspects of exclusion that affect Afro-descendants on a broader scale, drawing from experiences elsewhere. Even in countries where segments of the Afro-descendant population dominate the political arena, such as the Dominican Republic and Venezuela, racialized patterns of exclusion persist.237 These countries require their own context-specific approach.
Throughout this report we have highlighted persistent gaps in education and the labor market. Education is the most powerful tool available today to change the terms of inclusion of Afro-descendants in the region, but most countries are failing to take full advantage of its potential. The region has been experimenting with various forms of bilingual and intercultural education for indigenous peoples since the first half of the twentieth century, yet very few countries have policies specifically targeted at improving access and outcomes among Afro-descendant children and youths. Moreover, although some targeted policies exist, with heterogeneous results, no country has to date developed an organic plan—on par with bilingual and intercultural education—that articulates these efforts within a comprehensive strategy for ethno-racial inclusion. Evidence from Brazil at tertiary level shows that simple mechanisms to guarantee fair access to public universities can have a tremendous impact on the ethno-racial make-up of education institutions, while maintaining or improving performance outcomes. More systematic research needs to be conducted on the inclusion of appropriate ethno-racial content in textbooks and class dynamics, as well as on the elimination of both structural barriers and racism. The causes underpinning the underperformance of Afro-descendant boys also require further research, especially considering that similar patterns in Asian,238 Pacific, and Caribbean countries have been found to be connected to gender stereotypes, fostered in domestic and school settings, that reinforce male dropout.239 Finally, the region could benefit from research on specific policies that can advance the educational inclusion of Afro-descendants, especially by
237 See,forexample,KimberlyE.Simmons,Reconstructing Racial Identity and the African Past in the Dominican Republic;“Antihaitianismo:SystemicXenophobiaandRacismintheDominicanRepublic,”CouncilonHemisphericAffairs,June29,2017;WinthropR.Wright,Café con Leche;JesúsMaríaHerreraSalas,“EthnicityandRevolution:ThePoliticalEconomyofRacisminVenezuela,”Latin American Perspectives32,no.2(2005):72–91;andAngelinaPollak-Eltz,“¿HayonohayracismoenVenezuela?”Ibero-amerikanisches Archiv, Neue Folge19,no.3/4(1993):271–89.
238 AreportonfourEastAsiancountries(Malaysia,Mongolia,thePhilippines,andThailand)foundthatwhileaccesstoschoolandaffordabilityplayedaroleinmaledropout,genderdynamicsthatreinforcedthesensethatboysareindependentandcouldearnmoneybyleavingschoolalsocontributednegativelytothispattern.Thereportalsofoundentrenchedideasamongteachersthatsituateboysaslesseager,lessmotivated,andlesscapableoflearninginschool.SeeUnitedNationsGirls’EducationInitiative,Why are Boys Under-performing in Education? Gender Analysis of Four Asia-Pacific Countries.
239 USAID,Measurement and Research Support to Education Strategy Goal 1. Boys’ Underachievement in Education: A Review of the Literature with a Focus on Reading in the Early Years.

Afro-descendants in Latin America | 111
evaluating or piloting approaches directed at improving primary and secondary education.
In this report we have also shown that there is a significant disconnect between educational attainment and the return Afro-descendants are getting for their investment in education. Having similar qualifications and socioeconomic characteristics, Afro-descendant workers tend to be paid considerably less than whites or mestizos for the same type of jobs. Wage differentials can be largely attributed to discriminatory biases. Yet, the reasons why these glass ceilings persist, despite the progressive legal and policy changes of the last decades, require further attention. The region should profit from the experience accumulated in other regions to incorporate diversity programs and best practices for inclusion in the workplace, but first the countries need to have a thorough assessment of these gaps and the loss of income and opportunity that they represent both for Afro-descendants and for the local economies. The region could also benefit from more detailed qualitative surveys that can uncover the factors that contribute to the persistence of wage differentials and other barriers in the labor market, but that are rarely found through quantitative studies (such as social norms, stereotypes, or beliefs).
Another area that merits deeper research is the impact of extractive industries among rural Afro-descendant communities. One illuminating example is Colombia. Although the region of Chocó has been an epicenter of gold mining since the early colonial period, gold mining in its different modalities of extraction continues to be a source of conflict. While Afro-Colombians defend the right
to practice artisanal gold mining (a nonmechanized technique called barequear, gold panning), which supports the livelihoods of thousands of miners and their families, this practice faces numerous threats due to the country’s regulatory framework (which favors large-scale mining investments) and the involvement of armed actors and members of organized crime.240 In 2015, Colombia’s Office of the Ombudsman found that of 165 mining concessions in Chocó, 51 were located in areas were Afro-Colombians practiced artisanal gold mining.241 Armed actors and members of organized crime use heavy machinery (bulldozers and dredging boats) and a high amount of mercury, resulting in forms of ecological degradation and human rights violations against Afro-Colombian communities.242
In 2013, the national government launched a process that seeks to formalize artisanal miners by providing legal titles and training, while also cracking down on illegal miners. But Afro-Colombian communities often lack the resources to secure legal titles and formalize their mining operations. Although the government aims to formalize all mining operations by 2032, 80 percent of the submitted applications (3,114) have been denied, and there are still 19,500 applications awaiting notification.243 Despite the slow progress, Afro-descendant activists continue to push for changes around gold mining practices in Chocó and elsewhere. In 2018, despite being threatened and subsequently displaced from her hometown, Francia Márquez Mina was awarded the Goldman Environmental Prize for her work in the Cauca region, fighting against illegal gold mining and large-scale projects that have failed to adhere to the rules of prior consultation.244
240 OrganizationforEconomicCo-operationandDevelopment,Debida diligencia en la cadena de suministros de oro colombiana: el sector minero aurífero en Chocó.241 DefensoríadelPueblo,La minería sin control: un enfoque desde la vulneración de los derechos humanos delegada para los derechos colectivos y del ambiente
(Bogotá:DefensoríadelPueblo,2015),143.242 OrganizationforEconomicCo-operationandDevelopment,Debida diligencia,12. 243 “Survival,Profit,andWar:TheManyFacesofGoldMininginColombia.”NorthAmericanCongressonLatinAmerica,Nov9,2015.244 “AsíesFranciaMárquez,lacolombianaqueganóel‘Nobel’ambiental,”DeJusticia,April24,2018.

112 | The World Bank
Another aspect of great concern, which was only slightly touched upon in this report, is the much higher incidence of crime and violence among Afro-descendant youths. Although much of the violence experienced by Afro-descendants might be explained by their underprivileged geographic location (they have a much higher concentration in slums and poor regions in all countries) and their socioeconomic conditions, there is abundant evidence from other regions—especially North America—that racial biases exacerbate these predisposing factors to be victimized by both criminals and institutions (for example, through tougher judicial treatment and excessive use of force by security forces). There are few ethno-racial data outside Brazil, but in Brazil alone up to three in four homicide victims are Afro-descendants. There are also experiences from Brazil that may offer clues for finding racially targeted strategies, such as the Youth Alive (Juventude Viva) program, recently relaunched by the Brazilian government.
Finally, multilateral organizations need to better understand and integrate Afro-descendants’ needs and voices in their operations and policy agendas. Over the past three decades, multilateral development banks, such as the World Bank and the Inter-American Development Bank, have built robust policies and guidelines to safeguard indigenous communities, which not only protect them against the undesired effects of development but seek to mainstream their inclusion—from design through the life cycle of the projects—as key partners for development. The same is not true for many Afro-descendant communities,
despite representing a large proportion of the most vulnerable people in many countries. A review of the World Bank’s systematic country diagnostics and country strategies, developed with client countries of the region, conducted in the context of this study in 2016, showed that Afro-descendants were still only anecdotally treated in these two key documents of policy and operational engagement,245 despite studies—old and new—that pointed to their disadvantaged situations.
At the project level, for its part, development banks lack a repository of knowledge regarding best practices and critical information on the impact of their portfolios on Afro-descendant communities, as these are not regularly included under safeguards supervision. This not only hampers the banks’ ability to align this segment of the population with their development goals, but also misses the opportunity to profit from the potential contributions of over one-quarter of the Latin American population to their development agenda. In this sense, the new Social and Environmental Framework of the World Bank, which will replace its Safeguard Policies in 2018, offers an opportunity to make up for these deficiencies as it broadens the scope of project requirements to make them more inclusive, sustainable, locally relevant, participatory, and responsive to social risks and needs. This report offers only a first glance at the multiplicity of situations and challenges faced by Afro-descendants in the Latin America region, but we hope it will inform the dialogue between the Bank and the region as they move toward a new approach of higher and more sustainable standards.
245 Thereviewincluded19WorldBankcountrystrategies,inMarch2016,andfoundthatinonlysevendocumentsAfro-descendantswereidentifiedasaspecialtargetorvulnerablepopulation.Ofthese,however,onlyonecountrystrategyincludedastrategicapproachforAfro-descendants,andsetaspecificprogressindicator(relatedtoreproductivehealth).

Afro-descendants in Latin America | 113
Appendixes

114 | The World Bank
Appendix A
1810s 1820s 1830s 1840s 1850s 1860s 1870s 1880s 1890s 1900s 1910s 1920s 1930s 1940s 1950s 1960s 1970s 1980s 1990s 2000s 2010s
Argentina
Bolivia
Brazil
Chile
Colombia
Costa Rica
Cuba
Dominican Republic
Ecuador
El Salvador
Guatemala
Honduras
Mexico
Nicaragua
Panama
Paraguay
Peru
Uruguay
Venezuela
Notes: Bullet points indicate Afro-descendant variable in census; gray shadow indicates census availability; and lighter shadow highlights blackout period (i.e., with only two countries reporting on Afro-descendants). The “?” symbol indicates that the census was taken but there are no data on the questions. Source: Mara Loveman, National Colors, 241.
Visibility of Afro-descendants in Latin American Censuses

Afro-descendants in Latin America | 115
1810s 1820s 1830s 1840s 1850s 1860s 1870s 1880s 1890s 1900s 1910s 1920s 1930s 1940s 1950s 1960s 1970s 1980s 1990s 2000s 2010s
Argentina
Bolivia
Brazil
Chile
Colombia
Costa Rica
Cuba
Dominican Republic
Ecuador
El Salvador
Guatemala
Honduras
Mexico
Nicaragua
Panama
Paraguay
Peru
Uruguay
Venezuela

116 | The World Bank
Appendix B
The data used throughout this report are only a small fraction of the data compiled and processed by the World Bank in the context of this study. As part of the overall project, the World Bank also created a set of tools (dashboards for data visualization) that provide a wealth of additional information that is publicly available to facilitate further analysis. The tools developed for this report offer an improvement in terms of both scope and depth with respect to previous sources available in the region and the World Bank database. The user should be aware of the data concerns mentioned in the report, in particular with regard to variations due to changing self-reporting and perceptions.
LAC Equity Lab Dashboards on Afro-descendants
The second set of data visualizations using census data covers labor and education variables at the individual level. It includes similar tabs, plus one on gender. Population figures can be seen by ethnicity and country, but also for subregions within countries.
In both sets of data visualizations, the user can choose the ethnicity of interest and a comparator group of interest for the analysis. The options are shown on the right:
Variables Available Demographic Info Dashboard Absolute Access Dashboard Services Relative Analysis Regional Urban Rural
246 IntegratedPublicUseMicrodataSeries,International(IPUMS-International):ThisisaprojectoftheUniversityofMinnesotadedicatedtocollecting,documenting,harmonizing,anddistributingcensusdatafromaroundtheworld.WhenIPUMSdatawerenotavailableordidnothavetheharmonizedethnicityvariables,thereportusedcensusdatafromtheofficialNSOwebsiteusingREDATAMprogramming.Intotal13countrieswereincluded:12censusesplusPeru’s2015LivingStandardsMeasurementSurvey.
247 Seewww.latinobarometro.organdLatinAmericanPublicOpinionProject(LAPOP)www.vanderbilt.edu/lapop.
ethinicity selector
non IP non AD
AD
non-AD
non IP non AD
IP
All
Brown
Non Brown
Non Black
Black
Non IP
Three sets of data visualizations were created: two based on census data for 13 countries (using IPUMS and NSO sites)246 and one based on opinion survey data for 18 countries (using Latinobarómetro).247 The census data are divided into a set of dashboards with household-level information (such as access to services) and a set of dashboards with individual-level information (such as data on labor and education).
census dAtA
The first set of data visualizations using census data covers access to services and other characteristics at the household level. It includes six tabs:

Afro-descendants in Latin America | 117
At the household level, the census variables available (or created), by country, are the following:
country / yeAr
se
rv
Ice
gr
ou
P
service
Arg
enti
na20
10
Bra
zil
2010
co
lom
bia
2005
co
sta
ric
a20
11
ecu
ado
r20
10
el s
alva
do
r20
07
ho
ndur
as20
13
mex
ico
2015
nic
arag
ua20
05
Pan
ama
2010
Per
u20
15
uru
gua
y20
11
ven
ezue
la20
11
Ass
ets
Automobiles available
Clothes washing machine
Computer
Internet
Refrigerator
Telephone availability
Television set
dw
ellin
g c
hara
cter
isti
cs
At least one bathroom
Electricity
House made of good mate...
Household not overcrowd...
Kitchen or cooking faciliti...
Ownership of dwelling [ge...
Sewerage
Toilet or/and Sewerage avai...
Water
ho
useh
old
cha
ract
eris
tics
1ry sector occupation
2ry sector occupation
3ry sector occupation
High skill occupation
Inactivity
Literacy
Low dependency ratio
Low skill occupation
No unemployment in HH
Unemployment
Unemployment HH rate lo...

118 | The World Bank
Examples of dashboard visualizations from the census data:
Variables Available Demographic Info Dashboard Absolute Access Dashboard Services Relative Analysis Regional Urban Rural

Afro-descendants in Latin America | 119
oPInIon survey dAtA
The third set of data visualizations is based on Latinobarómetro opinion survey data for 18 countries in Latin America. It includes the following six tabs:
The question structure contains information on the available questions in Latinobarómetro, while three of the remaining tabs highlight the results of a set of those questions (for Afro-descendants versus non-Afro-descendants). The tab on population shows the percentage of respondents by ethnic group for all years and countries available.
Question Structure Opinion (%) Feeling Discriminated Aspiration and Perceptions Afrodescent Population Voice and Representarion
Variables Available Demographic Info Dashboard Absolute Access Dashboard Services Relative Analysis Regional Urban Rural

120 | The World Bank
Examples of dashboard visualizations from the opinion survey data:
Question Structure Opinion (%) Feeling Discriminated Aspiration and Perceptions Afro-descendant Population Voice and Representation

Afro-descendants in Latin America | 121
Question Structure Opinion (%) Feeling Discriminated Aspiration and Perceptions Afro-descendant Population Voice and Representation
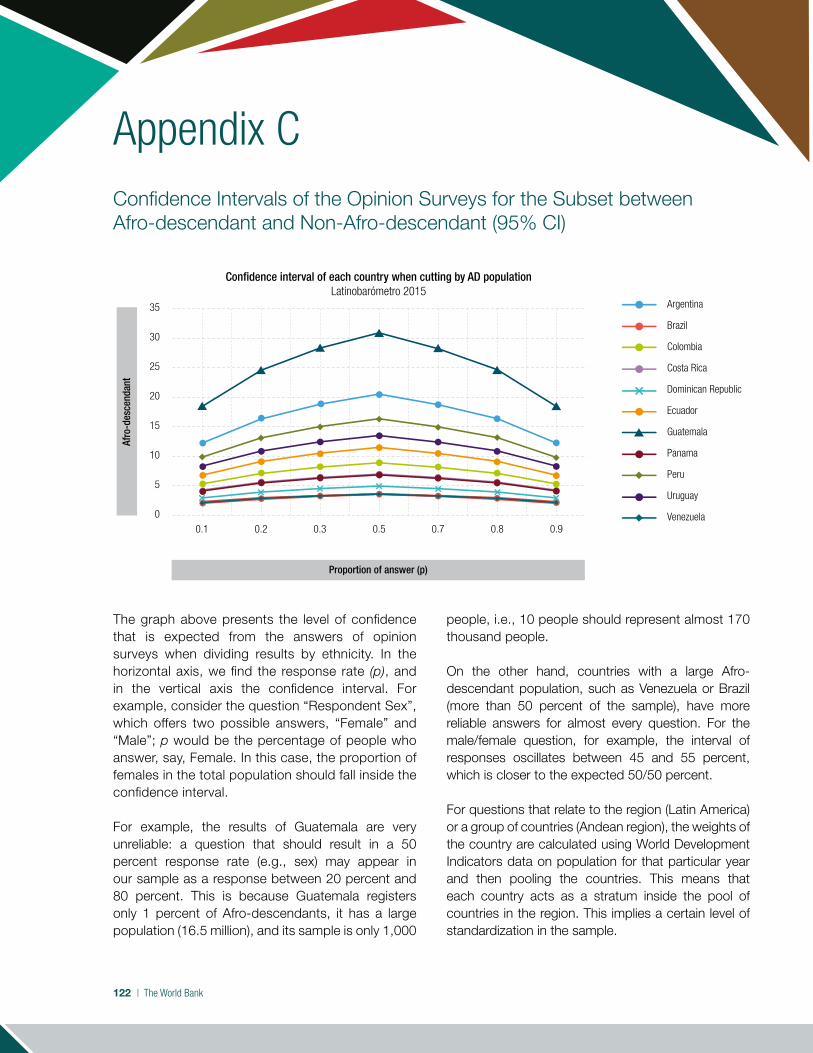
122 | The World Bank
The graph above presents the level of confidence that is expected from the answers of opinion surveys when dividing results by ethnicity. In the horizontal axis, we find the response rate (p), and in the vertical axis the confidence interval. For example, consider the question “Respondent Sex”, which offers two possible answers, “Female” and “Male”; p would be the percentage of people who answer, say, Female. In this case, the proportion of females in the total population should fall inside the confidence interval.
For example, the results of Guatemala are very unreliable: a question that should result in a 50 percent response rate (e.g., sex) may appear in our sample as a response between 20 percent and 80 percent. This is because Guatemala registers only 1 percent of Afro-descendants, it has a large population (16.5 million), and its sample is only 1,000
Appendix CConfidence Intervals of the Opinion Surveys for the Subset between Afro-descendant and Non-Afro-descendant (95% CI)
people, i.e., 10 people should represent almost 170 thousand people.
On the other hand, countries with a large Afro-descendant population, such as Venezuela or Brazil (more than 50 percent of the sample), have more reliable answers for almost every question. For the male/female question, for example, the interval of responses oscillates between 45 and 55 percent, which is closer to the expected 50/50 percent.
For questions that relate to the region (Latin America) or a group of countries (Andean region), the weights of the country are calculated using World Development Indicators data on population for that particular year and then pooling the countries. This means that each country acts as a stratum inside the pool of countries in the region. This implies a certain level of standardization in the sample.
Argentina
Brazil
Colombia
Costa Rica
Dominican Republic
Ecuador
Guatemala
Panama
Peru
Uruguay
Venezuela0.1 0.2 0.3 0.5 0.7 0.8 0.9
Proportion of answer (p)
Confidence interval of each country when cutting by AD populationLatinobarómetro 2015
Afro
-des
cend
ant
35
30
25
20
15
10
5
0

Afro-descendants in Latin America | 123
latinobarómetro: The question of ethnicity differs according to the year of the survey, as follows. The question is open ended, at which point the interviewer ticks one of the options:
Appendix DConstruction of Afro-descendant Variables from Opinion Surveys
Afro-descendants were constructed as those who answered Mulatto or Black. Due to the definition of Moreno in Venezuela and Pardo/Preto in Brazil, the definition of Afro-descendant in those two countries includes Mestizo.
lAPoP: The 2016 round of LAPOP identifies race by auto-identification, but the question is contextual to the country. For example, in Argentina the question is ¿Usted se considera una persona blanca, mestiza, indígena, negra, mulata, u otra? [Si la persona entrevistada dice
Afro-argentina, codificar como (4) Negra], in Brazil O(A) sr./sra. se considera uma pessoa branca, negra, parda, indígena ou amarela? [Se diz Afro-brasileira, codificar como (4) Negro (Preta)], and in Venezuela ¿Usted se considera una persona blanca, mestiza, indígena, negra, mulata, morena u otra? [Si la persona entrevistada dice Afro-venezolana, codificar como (4) Negra].
Afro-descendants were coded as those declaring Black (any category), Morena (in Venezuela), Mulato/Mulatta/Pardo (in Brazil), Negra, Zamba.
year Question options
2011 What race do you consider yourself to belong to?
(1) Asian; (2) Black; (3) Indigenous; (4) Mestizo; (5) Mulatto; (6) White; (7) Other race; (8) DNK; (9) DNA
2013 What ethnicity or race do you identify best with?
2015 What ethnicity or race do you identify best with?
2016 What race do you consider yourself to belong to?

124 | The World Bank
Appendix EEthnicity Questions in Censuses
Question in original language Question in english
Brazil
A sua cor ou raça é[ ] 1 Branca [ ] 2 Preta [ ] 3 Amarela [ ] 4 Parda
[ ] 5 Indígena
Your color or race is:[ ] 1 White[ ] 2 Black[ ] 3 Yellow[ ] 4 Brown[ ] 5 Indigenous
ecuador
¿Cómo se identifica (….) según su cultura y Costumbres?
[ ] 1 Indígena?
[ ] 2 Afroecuatoriano/a Afrodescendiente?
[ ] 3 Negro/a?
[ ] 4 Mulato/a?
[ ] 5 Montubio/a?
[ ] 6 Mestizo/a?
[ ] 7 Blanco/a?
[ ] 8 Otro /a?
How does [the respondent] self-identify according to his/her culture and customs?
[ ] 1 Indigenous?
[ ] 2 Afro-Ecuadorian/ of African descent?
[ ] 3 Black?
[ ] 4 Mulatto?
[ ] 5 Montubio (coastal peasant)?
[ ] 6 Mestizo?
[ ] 7 White?
[ ] 8 Other?
el salvador
¿Es usted?
[ ] 1 Blanco
[ ] 2 Mestizo (Mezcla de blanco con indígena)
[ ] 3 Indígena
[ ] 4 Negro (de raza)
[ ] 5 Otro
Are you:
[ ] 1 White
[ ] 2 Mixed race (a mix of white and indigenous)
[ ] 3 Indigenous (go to question 6b)
[ ] 4 Black (by race)
[ ] 5 Other
A. The following countries are in IPUMS. They use a standardized race variable, which is applied in the same manner as throughout this document:

Afro-descendants in Latin America | 125
Question in original language Question in english
colombia
¿De acuerdo con su CULTURA, PUEBLO o RASGOS FÍSICOS, ... es o se reconoce como:[ ] 1 Indígena? 1.1 ¿A cuál PUEBLO INDÍGENA
pertenece? [ ] 2 Rom? [ ] 3 Raizal del Archipiélago de San Andrés y
Providencia? [ ] 4 Palanquero de San Basilio? [ ] 5 Negro(a), mulato(a), afrocolombiano(a) o
afrodescendiente? [ ] 6 Ninguna de las anteriores?
According to his/her culture, group or physical characteristics, [the respondent] is known as: (basic)[ ] 1 Indigenous? 1.1 Which indigenous group does he/she
belong to? [ ] 2 Rom?[ ] 3 Raizal of the archipelago of San Andres and
Providence?[ ] 4 Palenquero of San Basilio?[ ] 5 Black, mulatto, African-Colombian or of African
ancestry?[ ] 6 None of the above?
costa rica
¿ [Nombre] se considera?[ ] 1 negro(a) o afrodescendiente? [ ] 2 mulato(a)? [ ] 3 chino(a)? [ ] 4 blanco(a) o mestizo(a)? [ ] 5 Otro?[ ] 6 Ninguna?
Does [the respondent] consider himself/herself…?[ ] 1 Black or Afro-descendant?[ ] 2 Mulatto?[ ] 3 Chinese?[ ] 4 White or mestizo?[ ] 5 Other?[ ] 6 None?
mexico
De acuerdo con su cultura, historia y tradiciones, se condera negra(o), es decir, afromexicana(o) o afrodescendiente?248
[ ] 1 Si[ ] 2 Sí, en parte [ ] 3 No[ ] 4 No sabe
According to your culture, history and traditions, do you consider yourself black, that is, Afro-Mexican or Afro-descendant?[ ] 1 Yes[ ] 2 Yes, in part[ ] 3 No[ ] 4 Does not know
B. The following countries are in IPUMS. The race variable may be standardized, but given the particularities in the counting process, the original census questions are used:
248 InordertomaintainconsistencywiththeNSOresults,only[]YesisconsideredAfro-descendant.Thisyieldsatotalof1.38million,or1.2%ofthenationalpopulation.IfpartiallyAfro-descendantisincluded,thefiguregoesupto1.97million,or1.65%ofthenationalpopulation.
continued

126 | The World Bank
Question in original language Question in english
nicaragua
¿A cuál de los siguientes pueblos indígenas o etnias pertenece […]?
[ ] 1 Rama
[ ] 2 Garífuna
[ ] 3 Mayangna-Sumu
[ ] 4 Miskitu
[ ] 5 Ulwa
[ ] 6 Creole (Kriol)
[ ] 7 Mestizo de la Costa Caribe
[ ] 8 Xiu-Sutiava
[ ] 9 Nahoa-Nicarao
[ ] 10 Chorotega-Nahua-Mange
[ ] 11 Cacaopera-Matagalpa
[ ] 12 Otro
[ ] 13 No sabe
To which of the following indigenous peoples or ethnic communities does [the person] belong?
[ ] 1 Rama
[ ] 2 Garifuna
[ ] 3 Mayangna-Sumu
[ ] 4 Miskitu
[ ] 5 Ulwa
[ ] 6 Creole (Kriol)
[ ] 7 Mestizo from the Caribbean Coast
[ ] 8 Xui-Sutiava
[ ] 9 Nahoa-Nicarao
[ ] 10 Chorotega-Nahua-Mange
[ ] 11 Cacaopera-Matagalpa
[ ] 12 Other
[ ] 13 Does not know
Panama249
¿SE CONSIDERA USTED…:
[ ] 1 Negro(a) colonial?
[ ] 2 Negro(a) antillano(a)?
[ ] 3 Negro(a)?
[ ] 4 Otro? _ (especifique)?
[ ] 5 Ninguna?
Do you consider yourself to be?
[ ] 1 Colonial black?
[ ] 2 Antillean black?
[ ] 3 Black?
[ ] 4 Other (specify) ____?
[ ] 5 None?
uruguay
¿Cree tener ascendencia…
[ ] 1 Afro o Negra?
[ ] 2 Asiática o Amarilla?
[ ] 3 Blanca?
[ ] 4 Indígena?
[ ] 5 Otra?
Do you believe you have the following descent?250
[ ] 1 African or black?
[ ] 2 Asian or yellow (amarilla)?
[ ] 3 White?
[ ] 4 Indigenous?
[ ] 5 Other?
249 BlackorAfricandescent:ReferstothesocialgrouporiginallybroughtfromAfricatotheAmericasbyEuropeans. a.Colonialblack:AdescendantofAfricanslavesbroughttotheisthmusduringtheSpanishcolonization. b.Antilleanblack:DescendantofWestIndianworkerswhospeakFrench,English,orotherlanguageswhocametoPanama,mainlyduringtheconstructionofthePanamarailroad,theFrenchcanalprojectlateinthenineteenthcentury,andtheUnitedStates’canalproject. c.Black:Apersonwithancestorswhoaredescendantsofblackslavesorcolonialblacksand/ordescendantsofblackAntilleanswhospeakEnglish,French,orotherlanguages,migrantsatdifferentperiodsofthenationaldevelopment,whoselectedthisoptionforself-identification.
250 Thequestionallowsforseveralanswers.Dependingontheanswer,thenextquestionwillaskforthemainancestry.

Afro-descendants in Latin America | 127
Question in original language Question in english
Argentina
¿Ud. o alguna persona de esta hogar a afrodescendiente o tiene antepasados de origen afrodescendiente o africano (padre, madre, abuelos/as, bisabuelos/as)?[ ] 1 Sí[ ] 2 No[ ] 3 Ignorado
Are you, or someone from this household, Afro-descendant or of Afro-descendant ancestry or Afro-descendant origin (father, mother, grandparents, great-grandparents)?[ ] 1Yes[ ] 2 No[ ] 3 Do not know
honduras
A que pueblo pertence (nombre)?[ ] 1 Maya-Chorti[ ] 2 Lenca[ ] 3 Miskito[ ] 4 Nahua[ ] 5 Pech[ ] 6 Tolupán[ ] 7 Tawahka[ ] 8 Garifuna[ ] 9 Negro de habla ingles[ ] 10 Otro [Especifique]
To which people does (name) belong?[ ] 1 Maya-Chorti[ ] 2 Lenca[ ] 3 Miskito[ ] 4 Nahua[ ] 5 Pech[ ] 6 Tolupán[ ] 7 Tawahka[ ] 8 Garifuna[ ] 9 English-speaking black[ ] 10 Other [Specify]
venezuela
Según sus rasgos físicos, ascendencia familiar, cultura y tradiciones se considera:[ ] 1 Negra/Negro [ ] 2 Afrodescendiente [ ] 3 Morena/Moreno[ ] 4 Blanca/Blanco[ ] 5 Otra. ¿Cuál?
According to its physical characteristics, family ancestry, culture and traditions it is considered:[ ] 1 Black [ ] 2 Afrodescendant[ ] 3 Morena/Moreno[ ] 4 White [ ] 5 Other. Which?
Por sus antepasados y de acuerdo a sus costumbres, ¿Ud. se considera:
[ ] 1 Quechua?
[ ] 2 Aymara?
[ ] 3 Nativo o Indígena de la Amazonía?
[ ] 4 Negro/ Mulato/Zambo/Afro peruano?
[ ] 5 Blanco?
[ ] 6 Mestizo?
[ ] 7 Otro?
[ ] 8 No sabe?
According to your ancestors and customs, you consider yourself:
[ ] 1 Quechua?
[ ] 2 Aymara?
[ ] 3 Native or Indigenous of the Amazon?
[ ] 4 Black / Mulato / Zambo / Afro Peruvian?
[ ] 5 White?
[ ] 6 Mestizo?
[ ] 7 Other?
[ ] 8 Do not know?
C. For the following countries, the official census from the national statistics office website is used:
D. In the case of Peru, 2015 LSMS (Encuesta Nacional de Hogares – ENAHO) is used:

128 | The World Bank
Appendix FPoverty in Brazil, Ecuador, Peru, Uruguay, Panama, and Colombia, at US$3.2 and US$5.5 a Day (2011 PPP)
Brazil ecuador Peru
2005 2015 2007 2015 2005 2015
Poverty (%)
$3.2 a day
Afro-descendants 28.0 11.0 28.2 15.9 31.7 11.9
Non-Afro-non-IP 11.4 4.2 17.0 7.0 24.7 7.3
Total population 19.7 8.0 19.2 9.4 30.7 10.3
$5.5 a day
Afro-descendants 50.9 25.8 56.4 33.7 59.6 29.0
Non-Afro-non-IP 25.3 11.6 37.6 21.7 46.5 18.3
Total population 38.1 19.4 40.3 24.7 52.1 24.2
Pov-Gap
$3.2 a day
Afro-descendants 10.9 4.0 10.3 5.5 14.2 3.9
Non-Afro-non-IP 4.2 1.6 6.2 2.2 9.2 2.5
Total population 7.6 2.9 7.3 3.3 12.5 3.4
$5.5 a day
Afro-descendants 23.2 9.9 23.9 13.5 27.5 10.7
Non-Afro-non-IP 10.2 4.1 15.2 7.0 20.4 6.7
Total population 16.7 7.3 16.9 8.8 24.9 9.1
Sample (‘000)
Unweighted
Afro-descendants 216.7 202.9 4.1 5.3 1.7 2.6
Non-Afro-non-IP 185.6 147.7 65.4 91.1 45.6 72.1
Total population 403.2 352.2 75.9 112.4 86.2 119.5
Weighted
Afro-descendants 91,041 109,156 526 750 603 745
Non-Afro-non-IP 91,777 91,784 12,015 14,218 15,175 20,592
Total population 183,183 201,699 13,492 16,294 28,121 31,811
AD/total population (w) 49.7% 54.1% 3.9% 4.6% 2.1% 2.3%

Afro-descendants in Latin America | 129
uruguay Panama colombia
2006 2015 2015 2015
Poverty (%)
$3.2 a day
Afro-descendants 8.7 2.5 2.7 19.3
Non-Afro-non-IP 3.1 0.6 3.1 10.4
Total population 3.6 0.7 6.1 11.9
$5.5 a day
Afro-descendants 34.2 12.7 7.6 40.9
Non-Afro-non-IP 15.2 3.7 9.1 26.6
Total population 17.1 4.1 14.5 28.8
Pov-Gap
$3.2 a day
Afro-descendants 1.8 0.5 0.9 7.1
Non-Afro-non-IP 0.6 0.1 0.9 3.6
Total population 0.8 0.2 2.0 4.3
$5.5 a day
Afro-descendants 9.8 3.1 2.6 16.9
Non-Afro-non-IP 4.0 0.9 3.0 9.8
Total population 4.6 1.0 5.4 11.0
Sample (‘000)
Unweighted
Afro-descendants 22.4 5.1 6.7 64.2
Non-Afro-non-IP 224.2 114.4 27.6 694.7
Total population 256.9 121.5 42.4 781.6
Weighted
Afro-descendants 253 149 631 3,686
Non-Afro-non-IP 2,686 3,262 2,754 41,235
Total population 3,066 3,467 3,964 46,528
AD/total population (w) 8.3% 4.3% 15.9% 7.9%

130 | The World Bank
Brazil ecuador Peru uruguay
Ad non-Ad total Ad non-Ad total Ad non-Ad total Ad non-Ad total
Chronic poor 2009–12 (%)
22.6 7.8 16.1 26.8 19.1 19.2 Chronic poor 2009–12 (%)
18.5 17.1 17.1 10.2 2.9 3.3
Sample obs.50,578 38,501 89,079 729 12,515 13,244
Sample obs.297 11,469 11,766 1,345 28,723 30,068
57% 43% 100% 6% 94% 100% 3% 97% 100% 4% 96% 100%
Chronic poor 2012–15 (%)
17.9 5.6 12.7 26.0 13.9 14.5 Chronic poor 2012–15 (%)
18.7 13.0 13.3 4.8 1.2 1.3
Sample obs.53,762 37,792 91,554 1,137 19,668 20,805
Sample obs.489 14,549 15,038 1,490 29,393 30,883
59% 41% 100% 5% 95% 100% 3% 97% 100% 5% 95% 100%
Appendix GChronic Poor in Brazil, Ecuador, Peru, and Uruguay, circa 2009–12 and circa 2012–15
Data source: SEDLAC data (CEDLAS and the World Bank).
Note: Results are constrained to the sample of households whose heads are between 25 and 65 years old. The underlying models include household time-invariant characteristics, region fixed effects, and interactions between household time-invariant characteristics and fixed effects. Estimations are based on γ = 0.5. Poor are those individuals with a per capita income lower than $5.5/day. Poverty lines and incomes are expressed in 2011 $PPP/day.
AD = Afro-descendant; Non-AD = non-Afro-descendant (does not include indigenous people).

Afro-descendants in Latin America | 131
Brazil ecuador Peru uruguay
Ad non-Ad total Ad non-Ad total Ad non-Ad total Ad non-Ad total
Chronic poor 2009–12 (%)
22.6 7.8 16.1 26.8 19.1 19.2 Chronic poor 2009–12 (%)
18.5 17.1 17.1 10.2 2.9 3.3
Sample obs.50,578 38,501 89,079 729 12,515 13,244
Sample obs.297 11,469 11,766 1,345 28,723 30,068
57% 43% 100% 6% 94% 100% 3% 97% 100% 4% 96% 100%
Chronic poor 2012–15 (%)
17.9 5.6 12.7 26.0 13.9 14.5 Chronic poor 2012–15 (%)
18.7 13.0 13.3 4.8 1.2 1.3
Sample obs.53,762 37,792 91,554 1,137 19,668 20,805
Sample obs.489 14,549 15,038 1,490 29,393 30,883
59% 41% 100% 5% 95% 100% 3% 97% 100% 5% 95% 100%

132 | The World Bank
Data source: SEDLAC data (CEDLAS and the World Bank).
Note: Results are constrained to the sample of households whose heads are 25 to 65 years old. The underlying models include household
time-invariant characteristics, region fixed effects, and interactions between household time-invariant characteristics and fixed effects.
Estimations are based on γ = 0.5. Poor are those individuals with a per capita income lower than $5.5/day. Poverty lines and incomes are
expressed in 2011 $PPP/day.
Appendix HConditional Transition in Brazil, Ecuador, Peru, and Uruguay
circa 2009–12
circa 2012–15
category Brazil ecuador category Peru uruguay
Ad non-Ad total Ad non-Ad total Ad non-Ad total Ad non-Ad total
Proportion of poor in 2009 who moved out of poverty by 2012
34.0 40.4 35.3
31.9 39.6 40.2 Proportion of poor in 2009 who moved out of poverty by 2012
32.3 30.3 31.0 41.0 44.2 42.9
Proportion of nonpoor in 2009 who moved into poverty by 2012
10.3 5.3 7.7 21.0 8.8 9.8 Proportion of nonpoor in 2009 who moved into poverty by 2012
7.4 7.6 7.6 7.2 3.1 3.2
Sample obs.50,578 38,501 89,079 729 12,515 13,244
Sample obs.297 11,469 11,766 1,345 28,723 30,068
57% 43% 100% 6% 94% 100% 3% 97% 100% 4% 96% 100%
category Brazil ecuador category Peru uruguay
Ad non-Ad total Ad non-Ad total Ad non-Ad total Ad non-Ad total
Proportion of poor in 2012 who moved out of poverty by 2015
27.0 32.0 27.8
32.7 39.5 39.7 Proportion of poor in 2012 who moved out of poverty by 2015
22.6 26.8 26.6 46.8 37.4 38.1
Proportion of nonpoor in 2012 who moved into poverty by 2015
12.9 7.0 10.1 12.3 11.3 11.3 Proportion of nonpoor in 2012 who moved into poverty by 2015
13.5 7.8 7.8 10.0 3.0 3.4
Sample obs.53,762 37,792 91,554 1,137 19,668 20,805
Sample obs.489 14,549 15,038 1,490 29,393 30,883
59% 41% 100% 5% 95% 100% 3% 97% 100% 5% 95% 100%

Afro-descendants in Latin America | 133
category Brazil ecuador category Peru uruguay
Ad non-Ad total Ad non-Ad total Ad non-Ad total Ad non-Ad total
Proportion of poor in 2009 who moved out of poverty by 2012
34.0 40.4 35.3
31.9 39.6 40.2 Proportion of poor in 2009 who moved out of poverty by 2012
32.3 30.3 31.0 41.0 44.2 42.9
Proportion of nonpoor in 2009 who moved into poverty by 2012
10.3 5.3 7.7 21.0 8.8 9.8 Proportion of nonpoor in 2009 who moved into poverty by 2012
7.4 7.6 7.6 7.2 3.1 3.2
Sample obs.50,578 38,501 89,079 729 12,515 13,244
Sample obs.297 11,469 11,766 1,345 28,723 30,068
57% 43% 100% 6% 94% 100% 3% 97% 100% 4% 96% 100%
category Brazil ecuador category Peru uruguay
Ad non-Ad total Ad non-Ad total Ad non-Ad total Ad non-Ad total
Proportion of poor in 2012 who moved out of poverty by 2015
27.0 32.0 27.8
32.7 39.5 39.7 Proportion of poor in 2012 who moved out of poverty by 2015
22.6 26.8 26.6 46.8 37.4 38.1
Proportion of nonpoor in 2012 who moved into poverty by 2015
12.9 7.0 10.1 12.3 11.3 11.3 Proportion of nonpoor in 2012 who moved into poverty by 2015
13.5 7.8 7.8 10.0 3.0 3.4
Sample obs.53,762 37,792 91,554 1,137 19,668 20,805
Sample obs.489 14,549 15,038 1,490 29,393 30,883
59% 41% 100% 5% 95% 100% 3% 97% 100% 5% 95% 100%


Afro-descendantsin Latin AmericaToward a Framework of Inclusion
Afro
-des
cend
ants
in L
atin
Am
eric
a