pt nusantara infrastructure tbk. · founded through backdoor listing in 2006, pt nusantara...
TRANSCRIPT

© 2016 PT Nusantara Infrastructure Tbk
PT Nusantara Infrastructure Tbk. Public Expose
Jakarta, 15 December 2016
1

© 2016 PT Nusantara Infrastructure Tbk
Presentation Contents
PART I : Company Overview 3
PART II : Key Development Progress 7
PART III : Financial Highlights 24
www.nusantarainfrastructure.com
2

© 2016 PT Nusantara Infrastructure Tbk
PART I: Company Overview
3

© 2016 PT Nusantara Infrastructure Tbk
Company Overview
Founded through backdoor listing in 2006, PT Nusantara Infrastructure Tbk. is an
Indonesia’s leading private infrastructure company.
PT Nusantara Infrastructure Tbk. is listed at the Indonesia Stock Exchange (Ticker: META).
The company manages diversified infrastructure sectors across:
1. Toll Road
2. Port
3. Water
4. Renewable Energy
5. Telecommunication Tower
Transportation
Infrastructure
Utilities
Infrastructure
4

© 2016 PT Nusantara Infrastructure Tbk
Geographical Coverage
5
Ports Panjang Seaport – South Sumatera
Telecommunication Tower 1,024 telecommunication towers across Sumatera, Java, East Region
Renewable Energy Lau Gunung Mini Hydro Power Plant – North Sumatera
Toll Roads Harbor Road - Makassar
Airport Toll Road - Makassar
Commuter Road – Greater Jakarta
Jakarta International Airport Road JORR 1
Water Cisadane Water Treatment Plant – Greater Jakarta
Medan Industrial Water Treatment Plant – North Sumatera
East Serang Water Treatment Plant – Greater Jakarta
The company currently serves over 103 million customers, 550,000 households,
266 factories and 210 vessels, 1,486 telecommunication tenancies.

© 2016 PT Nusantara Infrastructure Tbk
99.99%
Shareholding Structure
PT Hijau Makmur
Sejahtera
21.00%
Eagle Infrastructure
22.32%
Public and Others
56.68%
PT Margautama
Nusantara
(“MUN”)
PT Portco
Infranusantara
(“Portco”)
PT Potum Mundi
Infranusantara
(“POTUM”)
PT Telekom
Infranusantara
(“TI”)
PT Energi
Infranusantara
(“EI”)
74.98% 99.99% 99.99% 99.99%
Note:
(1) As of September 2016.
6

© 2016 PT Nusantara Infrastructure Tbk
Corporate Structure
Cap Asia
invested in 2013 Partnered with
PEP in 2014
ISAB
Acquired
2012
Acquired &
Developed
2013
Acquired &
Developed
2012
SCTK
Developed
2012
Acquired
2014
Acquired
2006
Expanded
2008
Acquired
2006
Acquired &
Developed
2009
Developed
2007
BSD JLB
Acquired
2012
TBN
TKCM
74.99% 99.99% 99.99% 99.99% 99.99%
88.93% 98.53% 25.00% 39.00% 51.00% 51.00% 64.99% 54.64% 79.64%
99.39% 28.00%
Partnered with
JEXWAY
in 2014
Partnered
with LDC in 2012
Note:
(1) As of September 2016.
BMN
JTSE
DCC KIN IME
Acquired
2012
Legend:
: Business Unit Level
BSD : PT Bintaro Serpong Damai
BMN : PT Bosowa Marga Nusantara
JTSE : PT Jalan Tol Seksi Empat
JLB : PT Jalan Lingkar Baratsatu
ISAB : PT Inti Sentosa Alam Bahtera
TBN : PT Tirta Bangun Nusantara
TKCM : PT Tirta Kencana Cahaya Mandiri
DCC : PT Dain Celicani Cemerlang
SCTK : PT Sarata Catur Tirtakelola
IME : PT Inpola Meka Energi
KIN : PT Komet Infra Nusantara
Partnered
with PTPP in
2012
7

© 2016 PT Nusantara Infrastructure Tbk
PART II: Key Development Progress
8

© 2016 PT Nusantara Infrastructure Tbk
Toll Road
9

© 2016 PT Nusantara Infrastructure Tbk
Selected Map of Makassar City and List of Key Projects
10
1
Airport Toll Road - Makassar
Harbor Road - Makassar
2
3
Sultan
Hasanuddin
Airport
New
Makassar
Port
Old
Makassar
Port
Legend:
: Airport Toll Road
: Harbor Road
Number 1 : Tallo Bridge Area
Number 2 : Frontage Road Area
Number 3 : TIS Project Spot
1. Tallo Bridge Expansion : Road expansion to 2x2 lane design, expanding capacity and reducing travel time.
2. Frontage Road Reconstruction : Improving traffic flow benefited both to toll road and surrounding arterial road users.
3. Traffic Information System : Project pioneer integrated to Smart City Concept, providing real time traffic data.

© 2016 PT Nusantara Infrastructure Tbk
1. Tallo Bridge Expansion
11
The project was started in July 2015 and completed within 12 months work plan, just before the Lebaran holidays.
The expansion has reduced bottleneck condition resulting greater access of mobility to users.
The toll road is connecting Airport to Inner City and serving a direct access to Industrial areas located at northern part.
Before Expansion After Expansion

© 2016 PT Nusantara Infrastructure Tbk
2. Frontage Road Reconstruction
12
The project was initiated together with Tallo Bridge expansion and has been completed since June 2016.
Frontage road is located alongside of Airport Toll Road in Makassar with length of 10.00 Km. It serves as arterial road
providing direct access to toll road. Through completing this project, it ultimately delivers better access of mobility.
Before Reconstruction After Reconstruction

© 2016 PT Nusantara Infrastructure Tbk
3. Traffic Information System
13
Project Concept
CCTV placed on spots
capturing real time traffic 1
Capturing & Collecting Data
and Create Output. 2
Information generated in
Control Center. 3 Information generated for
public via Videtron/Gadget. 4
Probe Data
Processing
Create
Traffic Info
Calculate
Travel Time
Pro
be In
form
atio
n In
ter F
ace
IVA SYSTEM
A C B C D
Development Progress
The implementation allows road users to access information of estimated travel time to opt for the best routes.
(A) Videotron using LED Billboard
Projecting real time traffic data and commercial advertising (B) Control Room Center (C) Real Time CCTV (D) Capturing Vehicle’s Police Number

© 2016 PT Nusantara Infrastructure Tbk
Renewable Energy
14

© 2016 PT Nusantara Infrastructure Tbk
Renewable Energy Sector
Currently constructing a Mini Hydro Power Plant, 2 x 5 MW capacity located in North Sumatera.
The project has a 20 year contract with PLN (Power Purchase Agreement).
First operation is expected to start by 3Q-2018 (third quarter year 2018).
The company is partnering with PT Pembangunan Perumahan (Persero) Tbk. (PTPP) as a joint shareholder and
main contractor.
Location Lau Gunung River, North Sumatera
Energy Type Hydro / Run-off River
Concession 20 years
Annual Energy Output 107 GWh
Installed Capacity 10 MW (2 x 5 MW)
Project Profile Project Location
74.5 km from Medan Capital City
15

© 2016 PT Nusantara Infrastructure Tbk
Project Progress
16
Development Progress – Downstream Area
(A) Inlet Tunnel (B) Deterrent Drainage (C) Bekisting Work at Penstock
(A) Power House Zone (B) Shotcrete Ramp Power House (B) Tailrace Zone
A B C
A B C
Development Progress – Upstream Area
Overall progress has reached 22.0% and scheduled to initiate commencement operation date in 3Q-18.

© 2016 PT Nusantara Infrastructure Tbk
Port
17

© 2016 PT Nusantara Infrastructure Tbk
Port Sector Development
18
As per completion of Biodiesel Plant, from May to November 2016, ISAB has served more than 76,000 tons distribution
of biodiesel supply for state-owned oil and gas company Pertamina.
The Biodiesel Plant has annual production capacity of 420,000 tons of palm oil methyl ester, commonly known as palm
oil diesel and 50,000 tons of glycerin.
Development of Biodiesel Plant Opening Ceremonial Photo

© 2016 PT Nusantara Infrastructure Tbk
Location Map of Lampung Port
19
2
1
3 4
Legend:
: Lampung Port Area
Number 1 : Jetty Area
Number 2 : Warehouse Area
Number 3 : Liquid Tank Farm Area
Number 4 : Biodiesel Plant
Lampung Port - Dry Area
Lampung Port - Liquid Area
PELINDO
Port
Up to November 2016, number of vessels has increased more than 53.6% from last year driven by Biodiesel cargos.
© 2016 PT Nusantara Infrastructure Tbk
Water
20

© 2016 PT Nusantara Infrastructure Tbk
Water Sector Project Progress
21
Current Plant Expansion Plant (In Progress)
(A) Water Treatment Plant 1 & 2: Capacity 2 x 50 lps (Total 100 lps)
(B) New Reservoir Tanks (2 x 3,000 m3)
(C) New Water Treatment Plant 3: Capacity 250 lps (Total After Expansion 350 lps)
A B
C
Expansion Plant of East Serang Water Treatment
Plant has reached finalization stage.
It is expected that the new Water Treatment Plant will
commence its first operation by year end.
Combined capacity will reach up to 350 lps,
contributing significant performance growth.

© 2016 PT Nusantara Infrastructure Tbk
Telecommunication Tower Sector
22

© 2016 PT Nusantara Infrastructure Tbk
KIN 21-Jan-14 2014 OrganicB2S
2014 InorganicM&A
KIN 2014 2015 OrganicB2S
2015 InorganicM&A
KIN 2015 3Q-16 OrganicB2S
3Q-16 InorganicM&A
KIN 3Q-16
Summary Chart KIN Tower Evolution 2014 – 3Q-16
23
Size Growth +4.2x in 2.5 years period
30 193
368 591
80
230
901 51
72 1,024
5 M&A transactions
(portfolio size ~20 –
70 towers per
acquisition)
3 M&A transactions
(portfolio size ~10 –
156 towers per
acquisition)
In closing process of
new portfolio
acquisition for more
than 180 microcell
towers.
Expanding to
Microcell
Business
Combination of aggressive inorganic acquisitions and expansion of adjacent business drive the company’s growth.
Note:
(1) B2S = Build to Suit (Orders from Telco Operators).
(2) M&A = Mergers & Acquisitions (Asset / Shares Acquisition of other Telecommunication Tower Company).

© 2016 PT Nusantara Infrastructure Tbk 24
PART III: Financial Highlights

© 2016 PT Nusantara Infrastructure Tbk
270
426
518
618
131 163
260
324
398
489
2012 2013 2014 2015 1Q-15 1Q-16 1H-15 1H-16 3Q-15 3Q-16
CAGR 3 Years (2012 – 2015)
Revenue 31.7%
Revenues Growth
25
Note:
(1) Including Construction Revenue, as per Stated in the Financial Statements.
1Q-16
Revenue(1)
+24.7% YoY
+32 Billion
1H-16
Revenue(1)
+24.5% YoY
+64 Billion
3Q-16
Revenue(1)
+23.0% YoY
+91 Billion
With stable and growth assets, the company manages to maintain its earning generation.
NI Consolidated Revenues(1) Trend 2012 – 3Q-16
IDR Billion; unless otherwise stated
© 2016 PT Nusantara Infrastructure Tbk
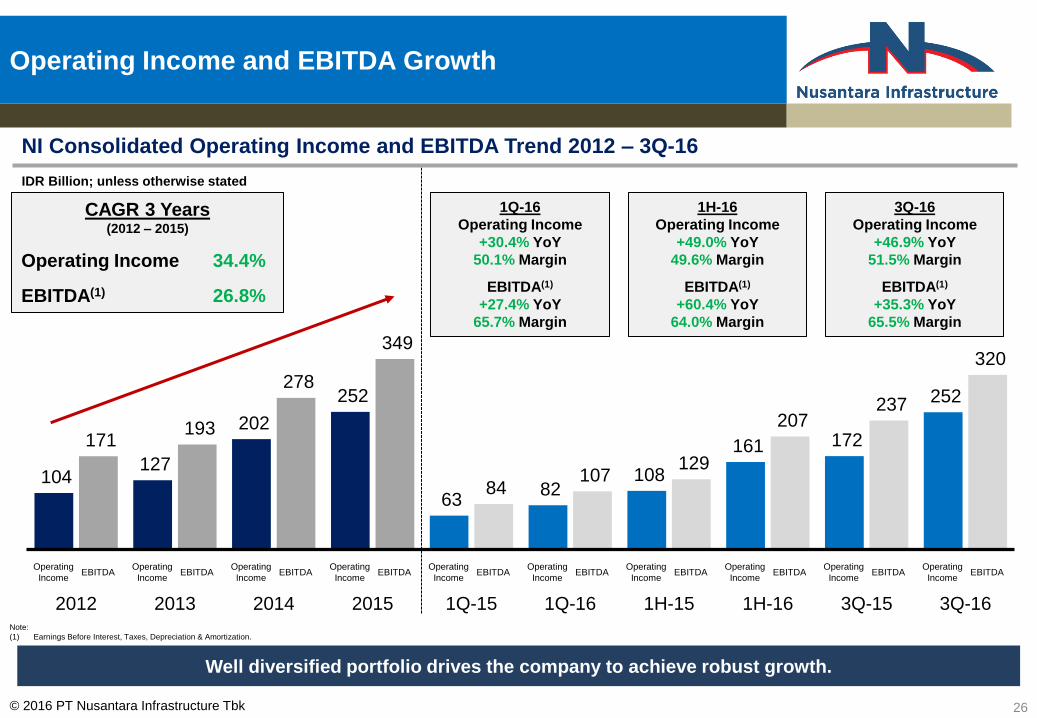
Operating Income and EBITDA Growth
26
104 127
202
252
63 82
108
161 172
252
171 193
278
349
84 107
129
207 237
320
2012 2013 2014 2015 1Q-15 1Q-16 1H-15 1H-16 3Q-15 3Q-16
CAGR 3 Years (2012 – 2015)
Operating Income 34.4%
EBITDA(1) 26.8%
Well diversified portfolio drives the company to achieve robust growth.
Note:
(1) Earnings Before Interest, Taxes, Depreciation & Amortization.
Operating
Income EBITDA
Operating
Income EBITDA
Operating
Income EBITDA
Operating
Income EBITDA
Operating
Income EBITDA
Operating
Income EBITDA
Operating
Income EBITDA
Operating
Income EBITDA
Operating
Income EBITDA
Operating
Income EBITDA
1H-16
Operating Income
+49.0% YoY
49.6% Margin
EBITDA(1)
+60.4% YoY
64.0% Margin
1Q-16
Operating Income
+30.4% YoY
50.1% Margin
EBITDA(1)
+27.4% YoY
65.7% Margin
3Q-16
Operating Income
+46.9% YoY
51.5% Margin
EBITDA(1)
+35.3% YoY
65.5% Margin
NI Consolidated Operating Income and EBITDA Trend 2012 – 3Q-16
IDR Billion; unless otherwise stated

© 2016 PT Nusantara Infrastructure Tbk
Net Income Growth
27
43 60
92
131
26 37
70
109 101
144 2.8 3.9
6.1 8.6
1.7 2.4 4.6
7.1 6.6 9.4
2012 2013 2014 2015 1Q-15 1Q-16 1H-15 1H-16 3Q-15 3Q-16
Net Income
EPS
Valuable company with growing assets and high earning power.
Note:
(1) Net Income Attributable to Owner of the Parent Entity (After Minority Interest).
1Q-16
Net Income(1)
+40.2% YoY
22.7% Margin
1H-16
Net Income(1)
+55.5% YoY
33.6% Margin
3Q-16
Net Income(1)
+42.7% YoY
29.4% Margin
CAGR 3 Years (2012 – 2015)
Net Income 44.6%
NI Consolidated Net Income and EPS Trend 2012 – 3Q-16
IDR Billion for Net Income and IDR for EPS; otherwise stated

© 2016 PT Nusantara Infrastructure Tbk
4,075
942
2,361
4,840
1,280
2,604
5,139
1,366
2,662
5,497
1,596
2,747
5,602
1,642
2,800
Total Assets Interest Bearing Liabilities Total Equity
Financial Position Trend
28
NI Consolidated Financial Position Trend 2014 – 3Q-16
IDR Billion; unless otherwise stated
Trend showed company’s financial position is at healthy condition and well-maintained.
3Q-16
Debt(1) to Assets Ratio
29.3%
Debt(1) Service
Coverage Ratio 2.32x
3Q-16
Debt to EBITDA(2)
3.84x
Net Debt(3) to EBITDA
2.32x
3Q-16
Debt(1) to Equity Ratio
58.6%
Equity Multiplier Ratio
2.00x
CAGR 3 Years (2012 – 2015)
33.8%
CAGR 3 Years (2012 – 2015)
35.5%
Note:
(1) Debt = Outstanding Interest Bearing Liabilities (Current & Non-Current). Excluding Islamic Financing debt from Providence Equity Partners in Telecommunication Tower segment (Non-Interest Bearing Liabilities).
(2) Debt to EBITDA = Debt divided by EBITDA. EBITDA is using annualized figure.
(3) Net Debt = Debt minus Cash and Cash Equivalents.
2014 2015 1Q-16 1H-16 3Q-16 2014 2015 1Q-16 1H-16 3Q-16 2014 2015 1Q-16 1H-16 3Q-16

© 2016 PT Nusantara Infrastructure Tbk
Key Growth Drivers
29
Capacity for Future
Expansion
Low leverage position benefits the company to upscale with potential projects.
Alliances with Strategic Partners, Co-Investment with Global Players, and
Exploring creative financing structure.
2
Room for Scale-Up
3
3 Base Strategies optimizing the company’s value creation.
1. Organic – Optimizing & Enhancement of Existing Assets
2. Business Development – Project Initiatives Extending Assets’ Value
3. Acquisition – Capturing Direct Potential Value
Consistent Growth
1
Consistent Growth in Company’s Performance.
1. Total Assets 9 Years CAGR (2006 – 2015) = 29%
2. Total Revenues 9 Years CAGR (2006 – 2015) = 21%
3. EBITDA 9 Years CAGR (2006 – 2015) = 29%

© 2016 PT Nusantara Infrastructure Tbk 30
www.nusantarainfrastructure.com
Thank You