psychometric instrument development - wikimedia … concepts & their measurement...
TRANSCRIPT
Lecture 6Survey Research & Design in Psychology
James Neill, 2015Creative Commons Attribution 4.0
Psychometric Instrument Development
Image source: http://commons.wikimedia.org/wiki/File:Soft_ruler.jpg, CC-by-SA 3.0
2
Overview
1. Recap: Exploratory factor analysis2. Concepts & their measurement3. Measurement error4. Psychometrics5. Reliability & validity6. Composite scores7. Writing up instrument development
3
1. Bryman & Cramer (1997). Concepts and their measurement. [Chapter - eReserve]
2. DeCoster, J. (2000). Scale construction notes. http://www.stat-help.com/scale.pdf
3. Howitt & Cramer (2005). Reliability and validity: Evaluating the value of tests and measures. [Chapter – eReserve]
4. Howitt & Cramer (2011/2014). Reliability in scales and measurement: Consistency and measurement. [Chapter 36/37 – Textbook]
5. Wikiversity. Measurement error - http://en.wikiversity.org/wiki/Measurement_error
6.Wikiversity. Reliability and validity - http://en.wikiversity.org/wiki/Reliability_and_validity
Readings: Psychometrics
5
What is factor analysis?
• Factor analysis is: –a family of multivariate correlational
methods used to identify clusters of covariance (called factors)
• Two main types (extraction methods):–Exploratory factor analysis (EFA)–Confirmatory factor analysis (CFA)
6
EFA assumptions• Sample size
– 5+ cases per variables (min.)– 20+ cases per variable (ideal)– Another guideline: Or N > 200
• Check bivariate outliers & linearity• Factorability: check any of:
– Correlation matrix: Some > .3?– Anti-image correlation matrix diags > .5– Measures of Sampling Adequacy
• KMO > ~ .5 to 6; Bartlett's sig?
7
Summary of EFA steps1. Test assumptions
– Sample size– Outliers & linearity – Factorability
2. Select type of analysis– Extraction
• Principal Components (PC)• Principal Axis Factoring (PAF)
– Rotation• Orthorgonal (Varimax)• Oblique (Oblimin) 8
Summary of EFA steps3. Determine no. of factors
– Theory?– Kaiser's criterion?– Eigen Values and Scree plot?– % variance explained?– Interpretability of weakest factor?
4. Select items– Check factor loadings to identify which items
belong in which factor– Drop items 1-by-1 if
• primary loading low? (< .5 ?)• cross-loadings high? (> .3 ?)• item wording doesn't belong to meaning of factor
9
Summary of EFA steps
5. Name and define factors6. Examine correlations amongst
factors7. Check factor structure for sub-
groups8. Analyse internal reliability9. Compute composite scores
Covered in this lecture
10
● 271 UC students responded to 24 university student motivation statements in 2008 using an 8-point Likert scale (False to True) e.g., “I study at university … ”– to enhance my job prospects.– because other people have told me I should.
● EFA PC Oblimin revealed 5 factors
Example EFA: University student motivation
11
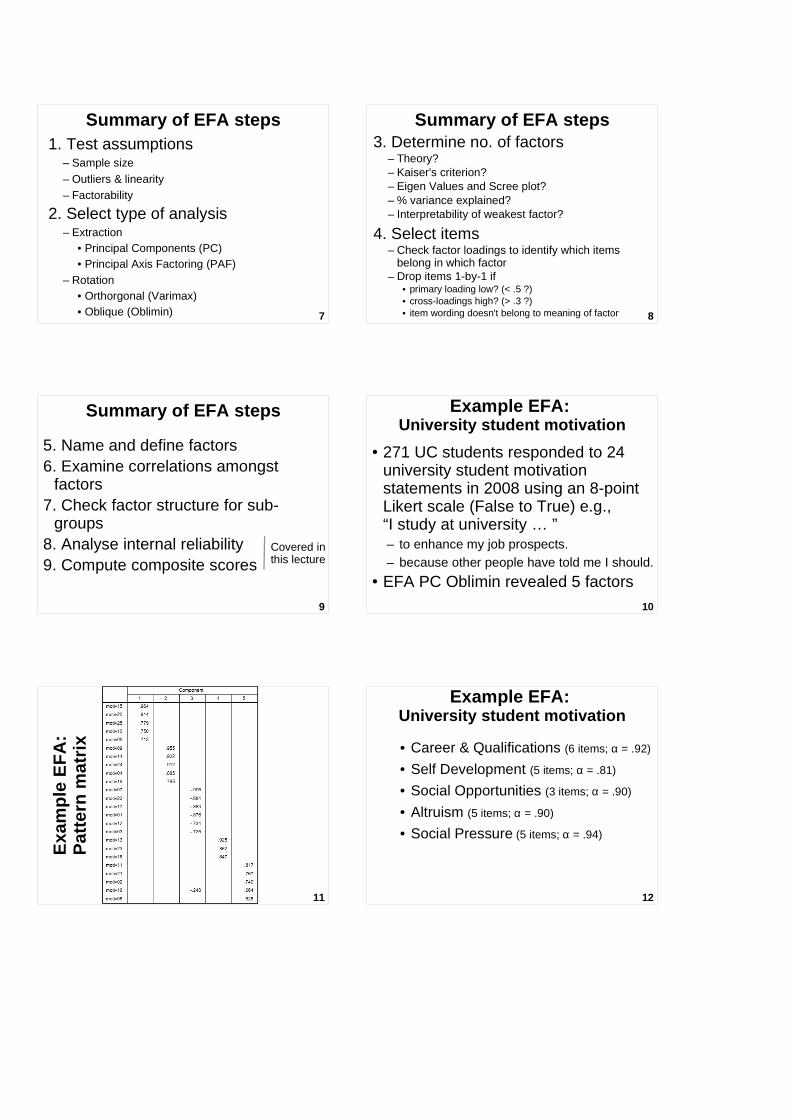
Exa
mpl
e E
FA
:P
atte
rn m
atrix
12
Example EFA: University student motivation
• Career & Qualifications (6 items; α = .92)
• Self Development (5 items; α = .81)
• Social Opportunities (3 items; α = .90)
• Altruism (5 items; α = .90)
• Social Pressure (5 items; α = .94)
13
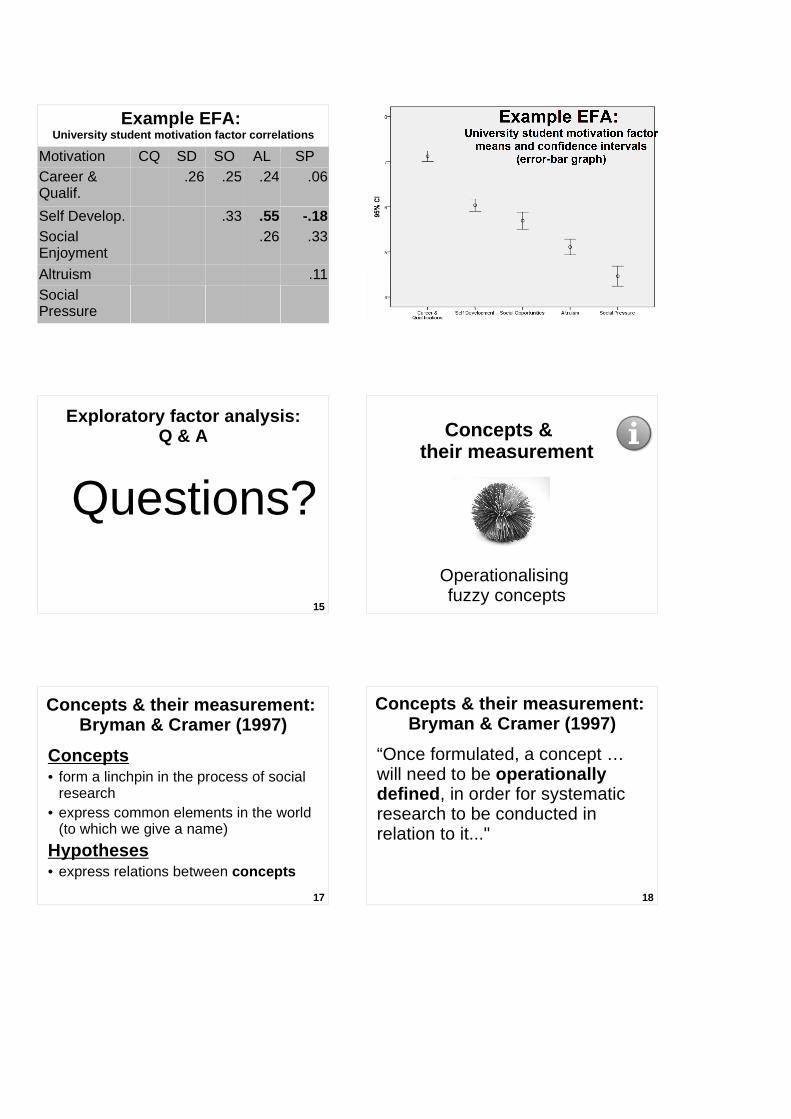
Example EFA: University student motivation factor correlations
Motivation CQ SD SO AL SPCareer & Qualif.
.26 .25 .24 .06
Self Develop. .33 .55 -.18Social Enjoyment
.26 .33
Altruism .11Social Pressure
15
Exploratory factor analysis: Q & A
Questions?
Concepts & their measurement
Operationalising fuzzy concepts
17
Concepts & their measurement: Bryman & Cramer (1997)
Concepts• form a linchpin in the process of social
research• express common elements in the world
(to which we give a name)
Hypotheses • express relations between concepts
18
Concepts & their measurement: Bryman & Cramer (1997)
“Once formulated, a concept … will need to be operationally defined, in order for systematic research to be conducted in relation to it..."

19
Concepts & their measurement: Bryman & Cramer (1997)
“...An operational definition specifies the procedures (operations) that will permit differences between individuals in respect of the concept(s) concerned to be precisely specified..."
20
Concepts & their measurement: Bryman & Cramer (1997)
“...What we are in reality talking about here is measurement, that is, the assignment of numbers to the units of analysis - be they people, organizations, or nations - to which a concept refers."
Operationalisation● ...is the act of making
a fuzzy concept measurable.
● Social sciences often use multi-item measures to assess related but distinct aspects of a fuzzy concept.
22
Operationalisation steps
1. Brainstorm indicators of a concept2. Define the concept3. Draft measurement items4. Pre-test and pilot test5. Examine psychometric properties
– how precise are the measures?6. Redraft/refine and re-test
Operationalisating a fuzzy concept: Example (Brainstorming indicators)
Fuzzy concepts - MindmapNurse empowerment
Factor analysis process
Image source: Figure 4.2 Bryman & Cramer (1997)
27
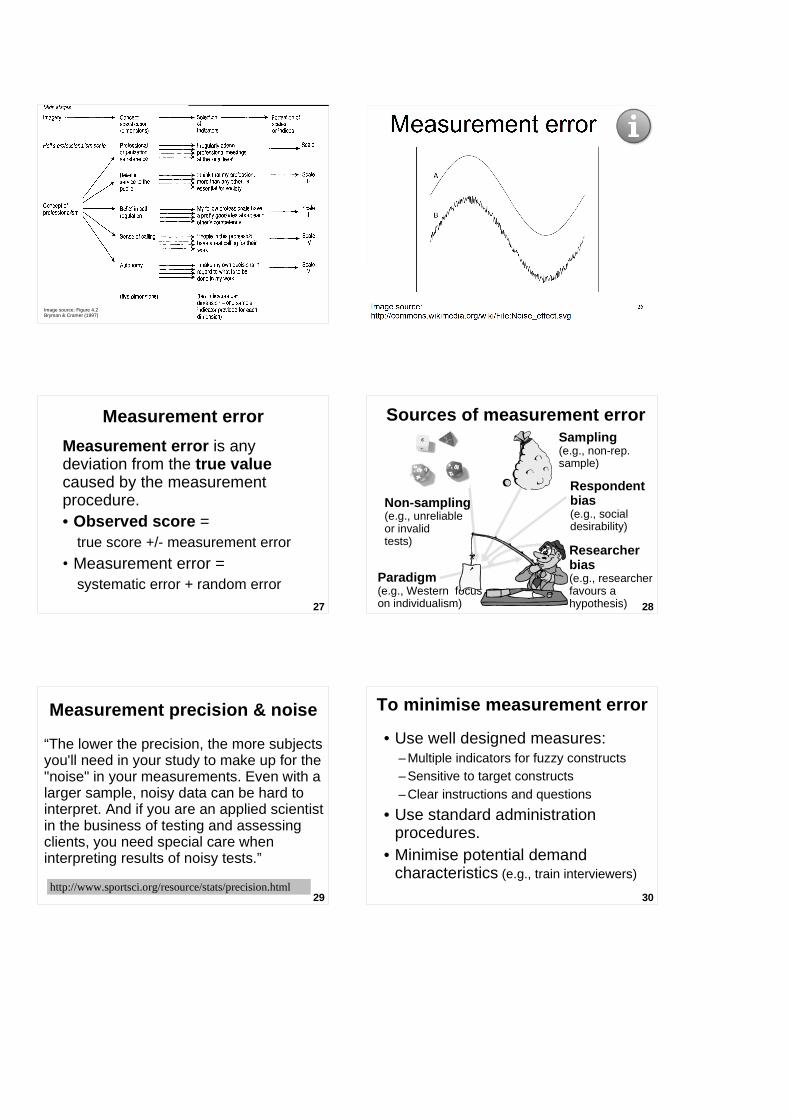
Measurement error
Measurement error is any deviation from the true value caused by the measurement procedure.• Observed score =
true score +/- measurement error
• Measurement error =systematic error + random error
28
Sources of measurement error
Non-sampling(e.g., unreliableor invalidtests)
Sampling(e.g., non-rep. sample)
Researcher bias(e.g., researcher favours a hypothesis)
Paradigm(e.g., Western focus on individualism)
Respondent bias(e.g., social desirability)
29
Measurement precision & noise
“The lower the precision, the more subjects you'll need in your study to make up for the "noise" in your measurements. Even with a larger sample, noisy data can be hard to interpret. And if you are an applied scientist in the business of testing and assessing clients, you need special care when interpreting results of noisy tests.”
http://www.sportsci.org/resource/stats/precision.html 30
To minimise measurement error
• Use well designed measures:– Multiple indicators for fuzzy constructs– Sensitive to target constructs– Clear instructions and questions
• Use standard administration procedures.
• Minimise potential demand characteristics (e.g., train interviewers)
31
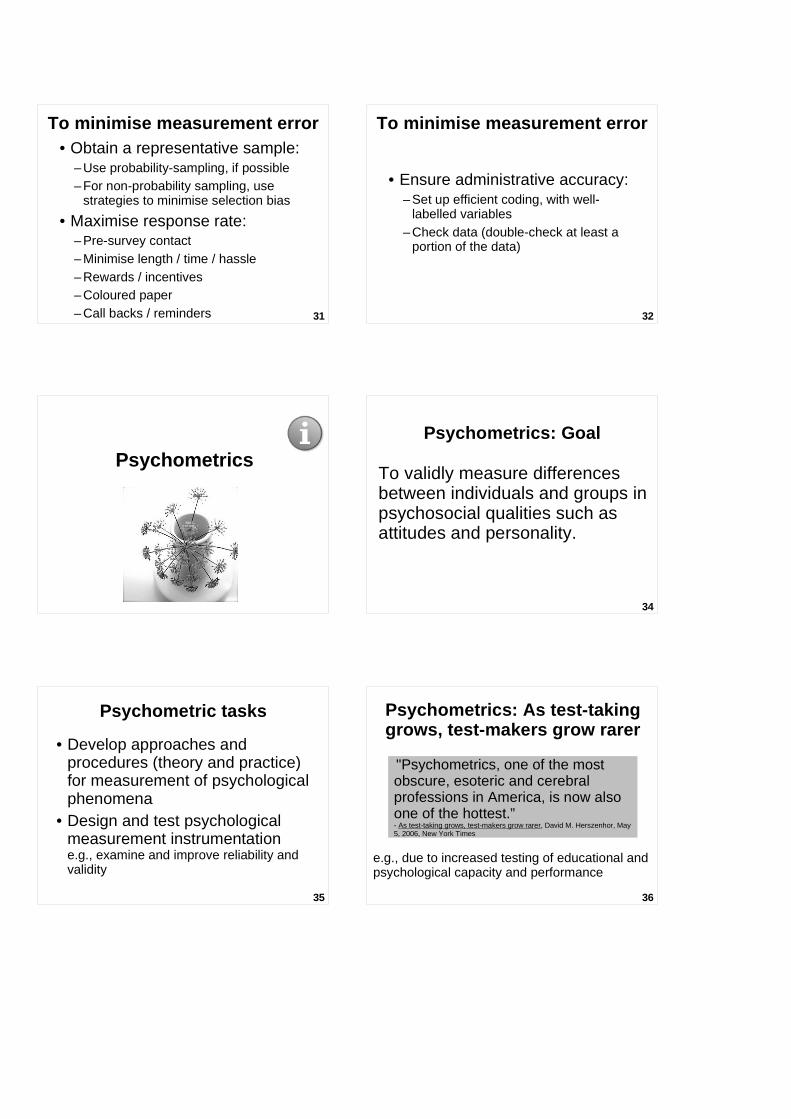
To minimise measurement error• Obtain a representative sample:
– Use probability-sampling, if possible– For non-probability sampling, use
strategies to minimise selection bias
• Maximise response rate:– Pre-survey contact– Minimise length / time / hassle– Rewards / incentives– Coloured paper– Call backs / reminders 32
• Ensure administrative accuracy:– Set up efficient coding, with well-
labelled variables– Check data (double-check at least a
portion of the data)
To minimise measurement error
Psychometrics
34
Psychometrics: Goal
To validly measure differences between individuals and groups in psychosocial qualities such as attitudes and personality.
35
Psychometric tasks
• Develop approaches and procedures (theory and practice) for measurement of psychological phenomena
• Design and test psychological measurement instrumentatione.g., examine and improve reliability and validity
36
Psychometrics: As test-taking grows, test-makers grow rarer
"Psychometrics, one of the most obscure, esoteric and cerebral professions in America, is now also one of the hottest.”- As test-taking grows, test-makers grow rarer, David M. Herszenhor, May 5, 2006, New York Times
e.g., due to increased testing of educational and psychological capacity and performance

But remember
38
Psychometric methods
• Factor analysis– Exploratory– Confirmatory
• Classical test theory–Reliability–Validity
Reliability & Validity
Image source: http://www.flickr.com/photos/psd/17433783/in/photostream, CC-by-A 2.0 40
Reliability and validity(Howitt & Cramer, 2005)
Reliability and validity (“classical test theory”) are ways of evaluating psychological tests and measures.• Reliability is about consistency of
– the items within the measure – a measure over time
• Validity is about whether the measure actually measures what it is intended to measure.
Reliability vs. validityIn classical test theory, reliability is generally thought to be necessary for validity, but it does not guarantee validity.
In practice, a test of a relatively changeable psychological construct such as suicide ideation, may be valid (i.e., accurate), but not particularly reliable over time (because suicide ideation is likely to fluctuate). 42
Reliability and validity(Howitt & Cramer, 2005)
• Reliability and validity are not inherent characteristics of measures. They are affected by the context and purpose of the measurement → a measure that is valid for one purpose may not be valid for another purpose.
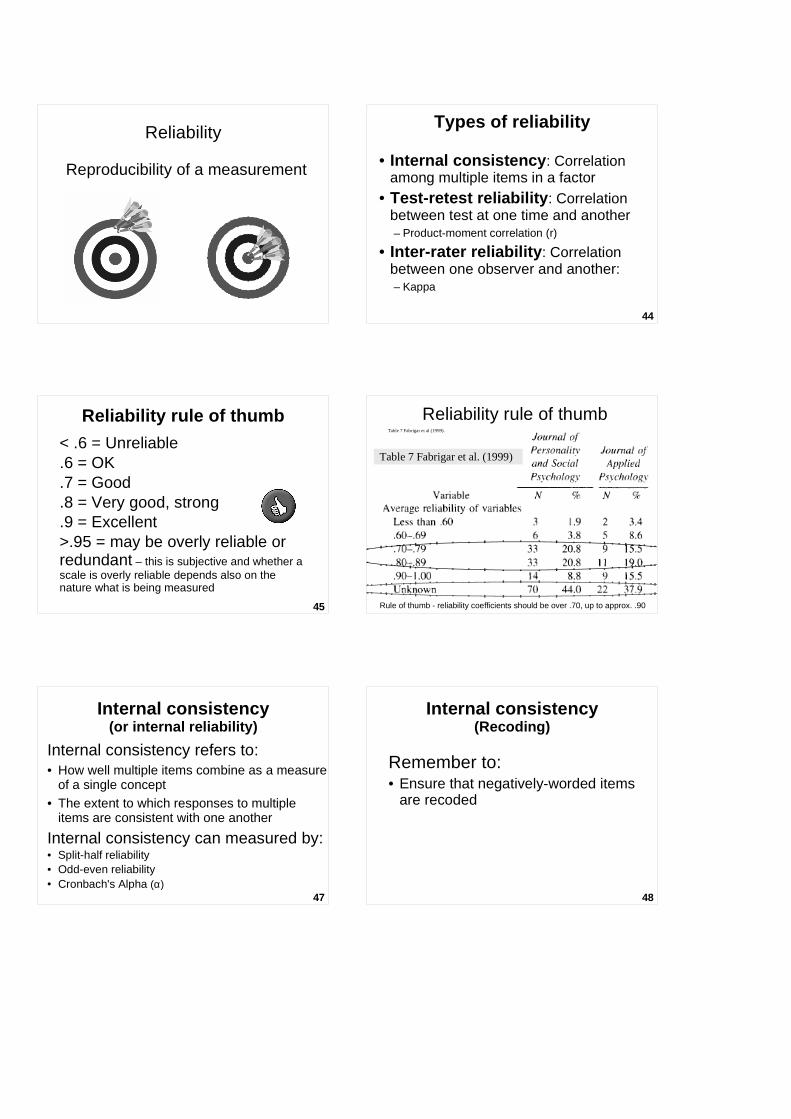
Reliability
Reproducibility of a measurement
44
Types of reliability
• Internal consistency : Correlation among multiple items in a factor
• Test-retest reliability : Correlation between test at one time and another– Product-moment correlation (r)
• Inter-rater reliability : Correlation between one observer and another:– Kappa
45
Reliability rule of thumb
< .6 = Unreliable.6 = OK.7 = Good.8 = Very good, strong.9 = Excellent>.95 = may be overly reliable or redundant – this is subjective and whether a scale is overly reliable depends also on the nature what is being measured
Reliability rule of thumb Table 7 Fabrigar et al (1999).
Table 7 Fabrigar et al. (1999)
Rule of thumb - reliability coefficients should be over .70, up to approx. .90
47
Internal consistency(or internal reliability)
Internal consistency refers to:• How well multiple items combine as a measure
of a single concept• The extent to which responses to multiple
items are consistent with one another
Internal consistency can measured by:• Split-half reliability• Odd-even reliability• Cronbach's Alpha (α)
48
Internal consistency(Recoding)
Remember to:• Ensure that negatively-worded items
are recoded
49
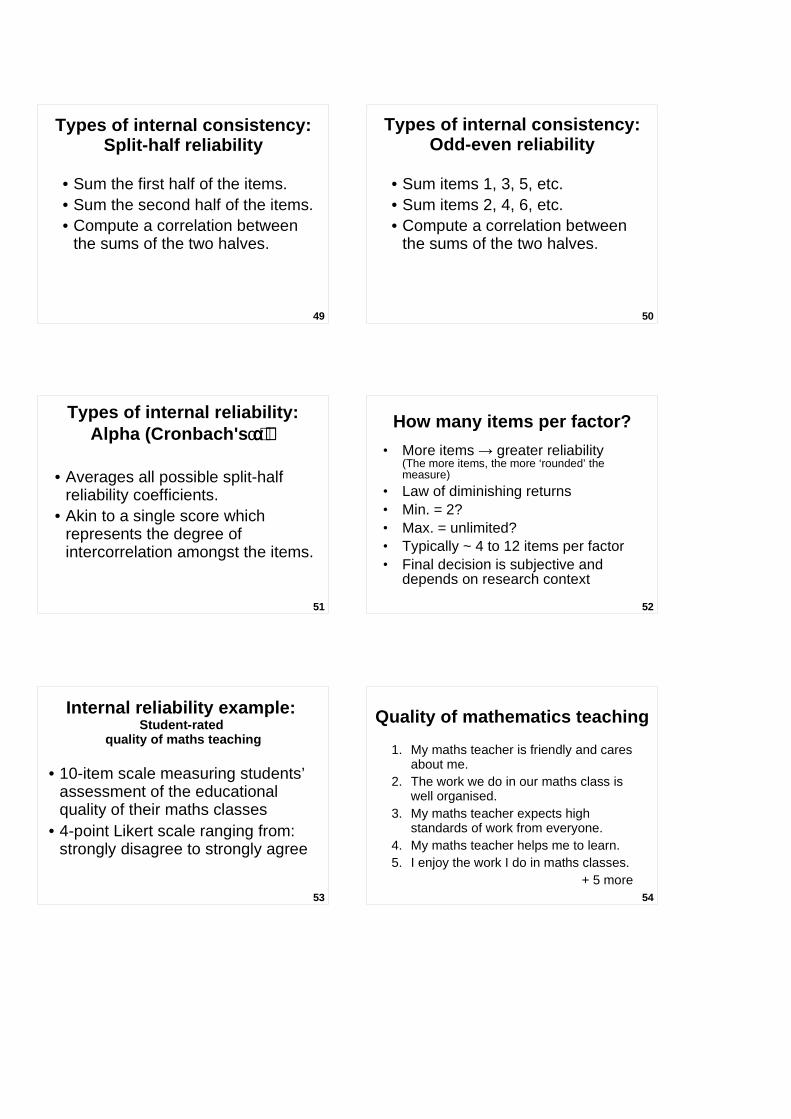
Types of internal consistency:Split-half reliability
• Sum the first half of the items.• Sum the second half of the items.• Compute a correlation between
the sums of the two halves.
50
Types of internal consistency:Odd-even reliability
• Sum items 1, 3, 5, etc.• Sum items 2, 4, 6, etc.• Compute a correlation between
the sums of the two halves.
51
Types of internal reliability:Alpha (Cronbach's α)α)α)α)
• Averages all possible split-half reliability coefficients.
• Akin to a single score which represents the degree of intercorrelation amongst the items.
52
• More items → greater reliability(The more items, the more ‘rounded’ the measure)
• Law of diminishing returns• Min. = 2?• Max. = unlimited?• Typically ~ 4 to 12 items per factor• Final decision is subjective and
depends on research context
How many items per factor?
53
Internal reliability example: Student-rated
quality of maths teaching
• 10-item scale measuring students’ assessment of the educational quality of their maths classes
• 4-point Likert scale ranging from:strongly disagree to strongly agree
54
Quality of mathematics teaching
1. My maths teacher is friendly and cares about me.
2. The work we do in our maths class is well organised.
3. My maths teacher expects high standards of work from everyone.
4. My maths teacher helps me to learn.5. I enjoy the work I do in maths classes.
+ 5 more
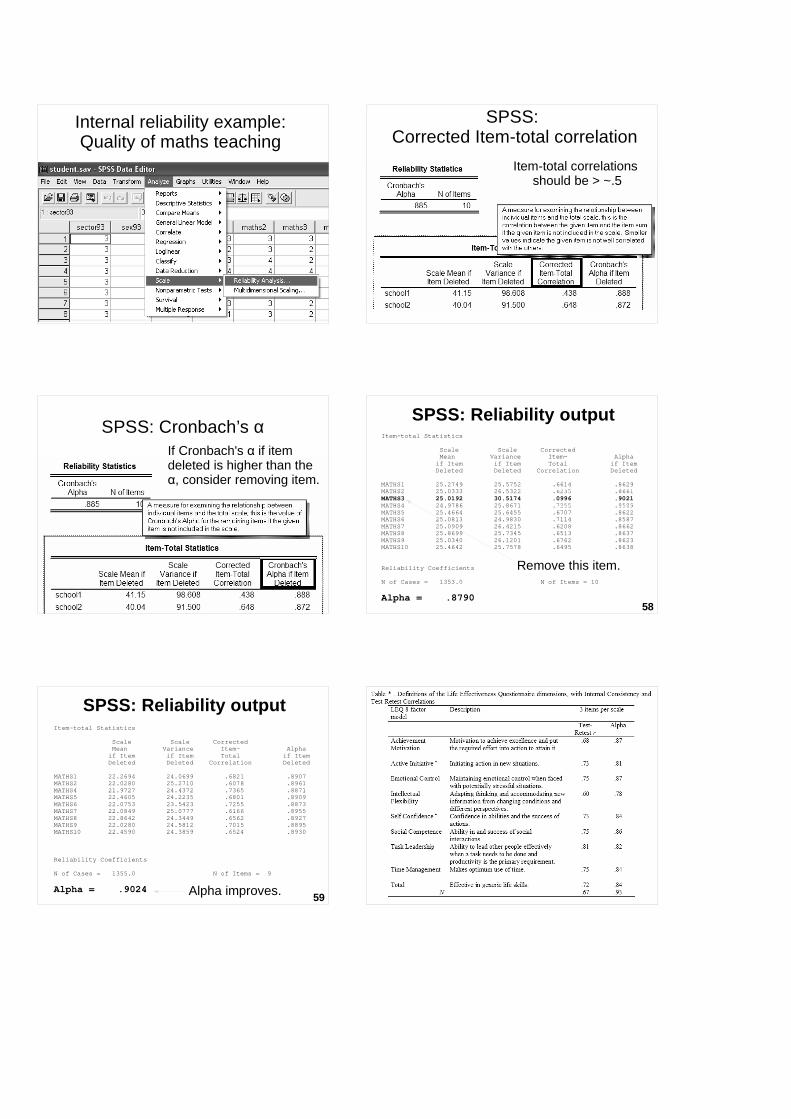
Internal reliability example: Quality of maths teaching
SPSS: Corrected Item-total correlation
Item-total correlations should be > ~.5
SPSS: Cronbach’s αIf Cronbach's α if item deleted is higher than the α, consider removing item.
58
Item-total Statistics
Scale Scale Corrected Mean Variance Item- Alpha if Item if Item Total if Item Deleted Deleted Correlation Deleted
MATHS1 25.2749 25.5752 .6614 .8629MATHS2 25.0333 26.5322 .6235 .8661MATHS3 25.0192 30.5174 .0996 .9021MATHS4 24.9786 25.8671 .7255 .8589MATHS5 25.4664 25.6455 .6707 .8622MATHS6 25.0813 24.9830 .7114 .8587MATHS7 25.0909 26.4215 .6208 .8662MATHS8 25.8699 25.7345 .6513 .8637MATHS9 25.0340 26.1201 .6762 .8623MATHS10 25.4642 25.7578 .6495 .8638
Reliability Coefficients
N of Cases = 1353.0 N of Items = 10
Alpha = .8790
SPSS: Reliability output
Remove this item.
59
Item-total Statistics
Scale Scale Corrected Mean Variance Item- Alpha if Item if Item Total if Item Deleted Deleted Correlation Deleted
MATHS1 22.2694 24.0699 .6821 .8907MATHS2 22.0280 25.2710 .6078 .8961MATHS4 21.9727 24.4372 .7365 .8871MATHS5 22.4605 24.2235 .6801 .8909MATHS6 22.0753 23.5423 .7255 .8873MATHS7 22.0849 25.0777 .6166 .8955MATHS8 22.8642 24.3449 .6562 .8927MATHS9 22.0280 24.5812 .7015 .8895MATHS10 22.4590 24.3859 .6524 .8930
Reliability Coefficients
N of Cases = 1355.0 N of Items = 9
Alpha = .9024
SPSS: Reliability output
Alpha improves.
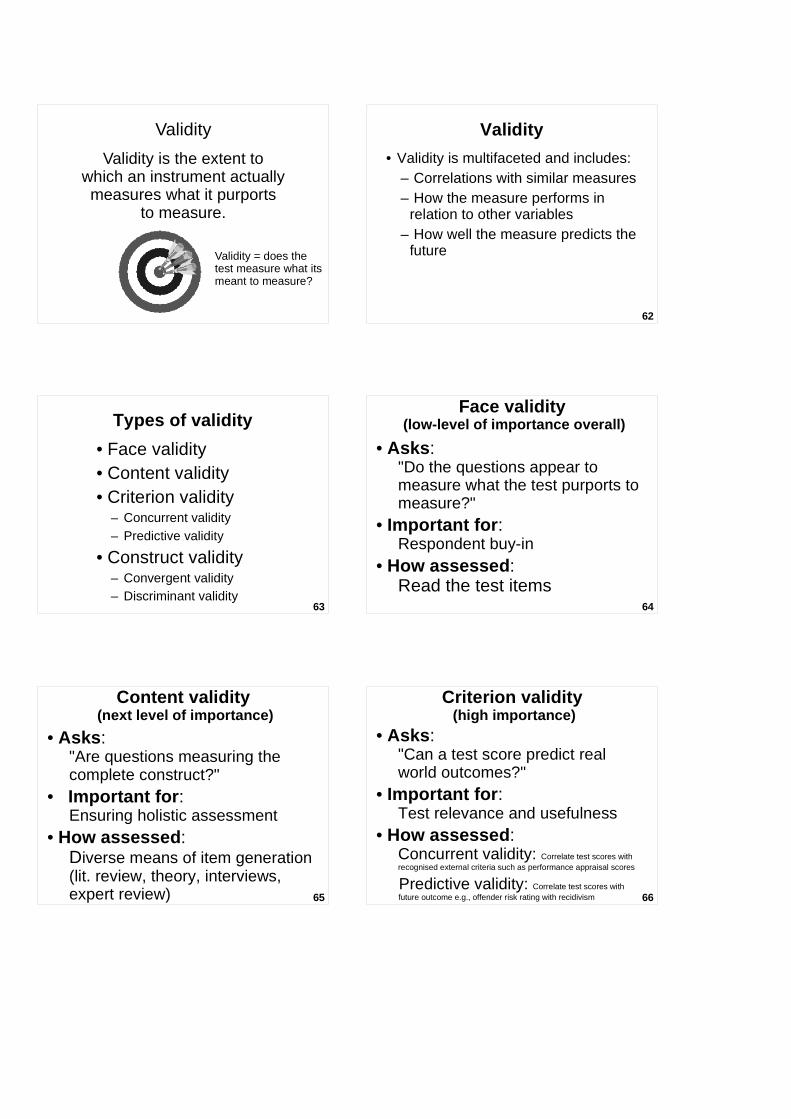
Validity
Validity is the extent to which an instrument actually measures what it purports
to measure.
Validity = does the test measure what its meant to measure?
62
Validity
• Validity is multifaceted and includes:– Correlations with similar measures – How the measure performs in
relation to other variables– How well the measure predicts the
future
63
Types of validity
• Face validity• Content validity• Criterion validity
– Concurrent validity– Predictive validity
• Construct validity– Convergent validity– Discriminant validity
64
Face validity (low-level of importance overall)
• Asks : "Do the questions appear to measure what the test purports to measure?"
• Important for : Respondent buy-in
• How assessed : Read the test items
65
Content validity (next level of importance)
• Asks : "Are questions measuring the complete construct?"
• Important for : Ensuring holistic assessment
• How assessed : Diverse means of item generation (lit. review, theory, interviews, expert review) 66
Criterion validity (high importance)
• Asks : "Can a test score predict real world outcomes?"
• Important for :Test relevance and usefulness
• How assessed : Concurrent validity: Correlate test scores with recognised external criteria such as performance appraisal scores
Predictive validity: Correlate test scores with future outcome e.g., offender risk rating with recidivism

67
Construct validity (high importance)
• Asks : Does the test assess the construct it purports to? ("the truth, the whole truth and nothing but the truth.")
• Important for :Making inferences from operationalisations to theoretical constructs
• How assessed : - Theoretical (is the theory about the construct valid?) - Statistical Convergent – correlation with similar measures Discriminant – not correlated with other constructs
Composite Scores
70
Composite scores
Combine item-scores into overall scores which represent individual differences in the target constructs.These new 'continuous' variables can then be used for:• Descriptive statistics and histograms• Correlations• As IVs and/or DVs in inferential
analyses such as MLR and ANOVA
71
Composite scores
There are two ways of creating composite scores:• Unit weighting• Regression weighting
72
Unit weighting
Average (or total) of item scores within a factor.(each variable is equally weighted)
X = mean(y1…yp)Unit
Weighting
.25.25 .25
.25
73
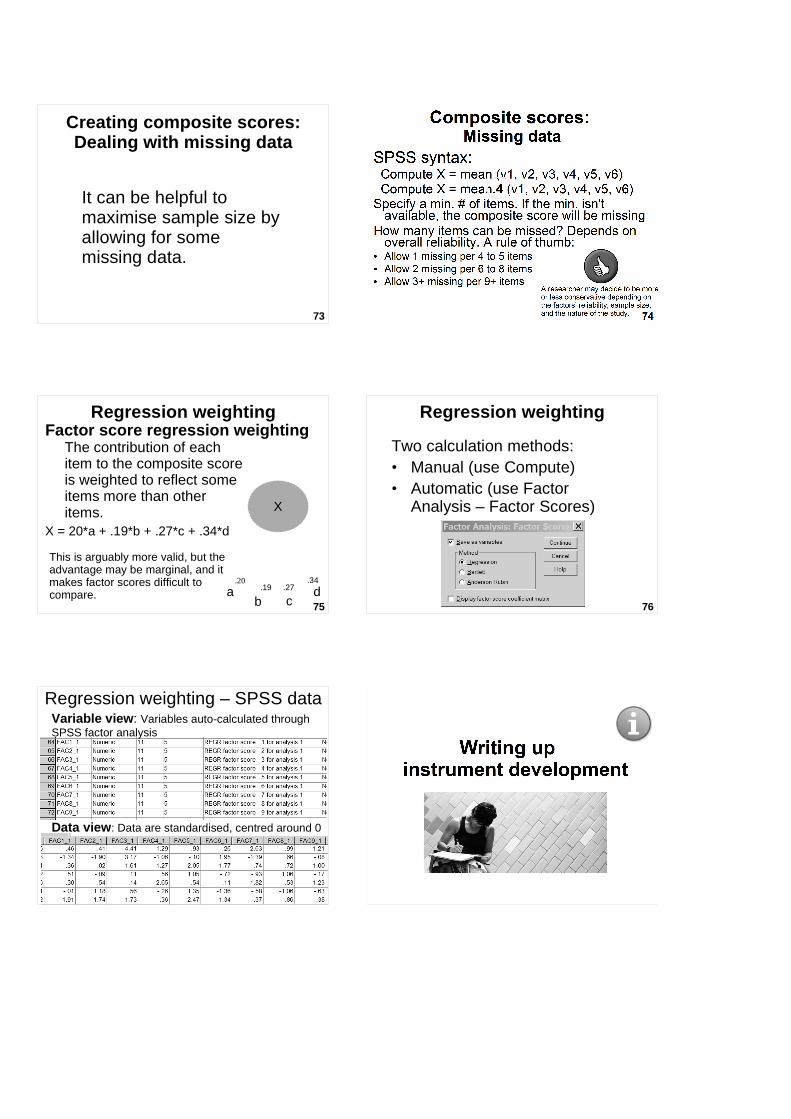
Creating composite scores: Dealing with missing data
It can be helpful to maximise sample size by allowing for some missing data.
75
Regression weightingFactor score regression weighting
The contribution of eachitem to the composite scoreis weighted to reflect someitems more than otheritems.
X = 20*a + .19*b + .27*c + .34*d
X
.20.19 .27
.34
ab c
d
This is arguably more valid, but the advantage may be marginal, and it makes factor scores difficult to compare.
76
Regression weighting
Two calculation methods:• Manual (use Compute)• Automatic (use Factor
Analysis – Factor Scores)
Regression weighting – SPSS data
Data view : Data are standardised, centred around 0
Variable view : Variables auto-calculated through SPSS factor analysis
79
Writing up instrument development
• Introduction–Literature review about underlying
factors – theory and research
• Method–Materials/Instrumentation –
summarise how the measures were developed and the expected factor structure e.g., present a table of the expected factors and their operational definitions. 80
Writing up instrument development• Results
–Factor analysis• Assumption testing• Extraction method & rotation • # of factors & items removed• Names & definitions of factors• Item factor loadings & communalities• Factor correlations
–Reliability for each factor–Composite scores for each factor–Correlations between factors
81
Writing up instrument development• Discussion
– Theoretical underpinning – Was it supported by the data? What adaptations should be made to the theory?
– Quality / usefulness of measure – Provide an objective, critical assessment, reflecting the measures' strengths and weaknesses
– Recommendations for further improvement
• Writing up a factor analysis– Download examples: http://goo.gl/fD2qby 82
Summary
83
Summary: Concepts & their measurement1. Concepts name common elements2. Hypotheses identify relations between
concepts3. Brainstorm indicators of a concept4. Define the concept5. Draft measurement items6. Pre-test and pilot test7. Examine psychometric properties8. Redraft/refine and re-test
84
Summary: Measurement error
1. Deviation of measure from true score2. Sources:
1. Non-sampling (e.g., paradigm, respondent bias, researcher bias)
2. Sampling (e.g., non-representativeness)
3. How to minimise1. Well-designed measures2. Reduce demand effects3. Representative sampling4. Maximise response rate5. Ensure administrative accuracy

85
Summary: Psychometrics
1. Science of psychological measurement
2. Goal: Validly measure individual psychosocial differences
3. Design and test psychological measures e.g., using1. Factor analysis2. Reliability and validity
86
Summary: Reliability1. Consistency or reproducability2. Types
1. Internal consistency2. Test-retest reliability
3. Rule of thumb1. > .6 OK2. > .8 Very good
4. Internal consistency1. Split-half2. Odd-even3. Cronbach's Alpha
87
Summary: Validity
1. Extent to which a measure measures what its meant to measure
2. Multifaceted1. Correlations with similar measures2. Performance in relation to other variables3. Predicts future
88
Summary: Composite scores Two ways of creating composite (factor) scores:1. Unit weighting
1.Total of items or2. Average of items
2. Regression weighting1. Each item is weighted by its
importance to measuring the underlying factor (based on regression weights)
89
Summary: Writing up instrument development
1. Introduction1. Review constructs & previous structures2. Generate research question
2. Method1. Explanation measure creation
3. Results 1. Factor analysis2. Reliability 3. Composite scores4. Correlations between factors
4. Discussion 1. Balanced interpretation and critique of theory
and measure with recommendations 90
1. Allen, P. & Bennett, K. (2008). Reliability analysis (Ch 15) in SPSS for the health & behavioural sciences (pp. 205-218). South Melbourne, Victoria, Australia: Thomson.
2. Bryman, A. & Cramer, D. (1997). Concepts and their measurement (Ch. 4). In Quantitative data analysis with SPSS for Windows: A guide for social scientists (pp. 53-68). Routledge.
3. DeCoster, J. (2000). Scale construction notes. http://www.stat-help.com/scale.pdf (pdf)
4. Fabrigar, L. R., Wegener, D. T., MacCallum, R. C., & Strahan, E. J. (1999). Evaluating the use of exploratory factor analysis in psychological research. Psychological Methods, 4(3), 272-299.
5. Fowler, F. (2002). Designing questions to be good measures. In Survey research methods (3rd ed.)(pp. 76-103). Thousand Oaks, CA: Sage. Ereserve.
6. Howitt, D. & Cramer, D. (2005). Reliability and validity: Evaluating the value of tests and measures (Ch. 13). In Introduction to research methods in psychology (pp. 218-231). Harlow, Essex: Pearson. eReserve.
References