prudential plc investor conference - m&g prudential/media/files/p/prudential-v3/... · m&g...
TRANSCRIPT

UKJohn Foley

M&G PrudentialCreating a simple, modern savings and investments business
7.2million
Year-on-year growth of 8%
Customers with strong persistency and loyalty
5customer groups
Diversified customer base with asset management at
its heart
£337billion AUM Customer-centric
Simple and efficient
Digitally-enabled
Capital-light
Fast-growing
Delivery-focused
Europe AUM
€14tn2015-16
Addressable
Discretionary5
€8.5tnInvestmentFunds
1. Source: The Investment Association – Asset management in the UK 2015-2016 2. Source: EFAMA Asset Management report, data as at 2015 3. Growth rates source: PWC Asset Management 2020, BCG and Prudential calculations. Retail growth rate sourced from BCG, Europe and remaining UK using PWC Europe
forecast CAGR of 4.4%4. UK AUM consists of Commercial Property, Private Equity and Other of £1.3tn growing by £0.5tn by 2023. European AUM consists of Discretionary of €5.2tn growing by €2.0tn5. Discretionary includes mandates and could be included within M&G Institutional addressable market
Market Context
Institutional
+£0.9tn
£4.6tn
£1.2tnPrivate Equity4
Other4
Commercialproperty4
by 2023+£0.9tn
1,2,3
UK AUM
£7tn2015-16
Addressable
by 2023+£1.6tn
by 2023+€3.5tn
Retail

M&G Prudential Business MixDiversified across five customer groups, all contributing significantly
� Top 5 in UK retail funds2
� Active management offering with strong performance� Distributed through wholesale channels
� Range of consumer-focused retirement/savings wrappers� PruFund investment proposition� Distributed through intermediaries and direct channels
� Large, individual and corporate closed book� Resilient cash flows� Loyal customers, looking for help into retirement
� Large and growing� High quality clients� Differentiated investment capabilities
� Strong growth, with further potential� Establishing Luxembourg HQ and SICAV range� Complemented by Prudential’s European businesses
£33bn400k
customers
£150bn6.6m
customers
£337bn1individual customers
£35bn180k direct
customers
£40bn
£79bn 785 clients
Leadingcross-border fund sales
Savings & Retirement Solutions
Traditionalproducts
European customers
Institutions
Investmentfunds
UK c
ust
om
ers
AUM (9M 17) Customers
7.2m1. Europe includes AUM in Asia and South Africa
2. Source: The Investment Association, June 2017

M&G Prudential Assets Under ManagementStrong AUM growth across customer groups
UK customers: Traditional products
European customers1
UK customers: Savings & Retirement Solutions 43%
(2%)
UK customers: Investment funds 0%
Institutions 6%
47%
8%Overall AUM Growth
Growth(9M16-9M17)£311bn £312bn £337bn
149 153 150
35 35 35
73 74 79
25 23 3329 27
40
YE 2016 9M 2016 9M 2017
1. European includes AUM in Asia and South Africa

Rationale for M&G Prudential Compelling logic for combining our businesses
A clear market leader in UK consumer savingsMarket leader
CollaborationBetter collaboration across business segments
PropositionMore innovative and differentiated propositions
Better access to customers and channels
Distribution
Investment to create a digital, data-led businesswith low marginal cost of growth
Transformation
Efficiencies
Merger cost synergies and transformation benefits(£145m cost reduction target)
Complementary & diversified
Growth & profit
Across propositions, asset classes, channels, and geographies
Capabilities aligned to attractive structural growth opportunities
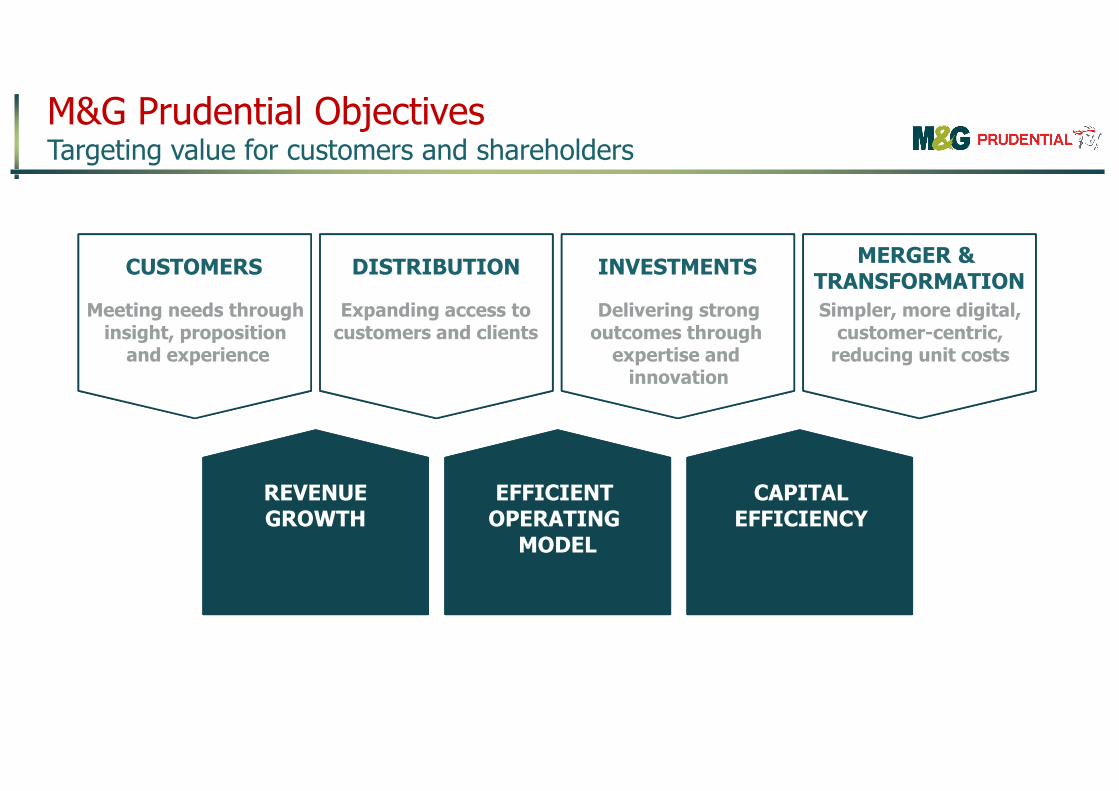
REVENUEGROWTH
EFFICIENT OPERATING
MODEL
CAPITALEFFICIENCY
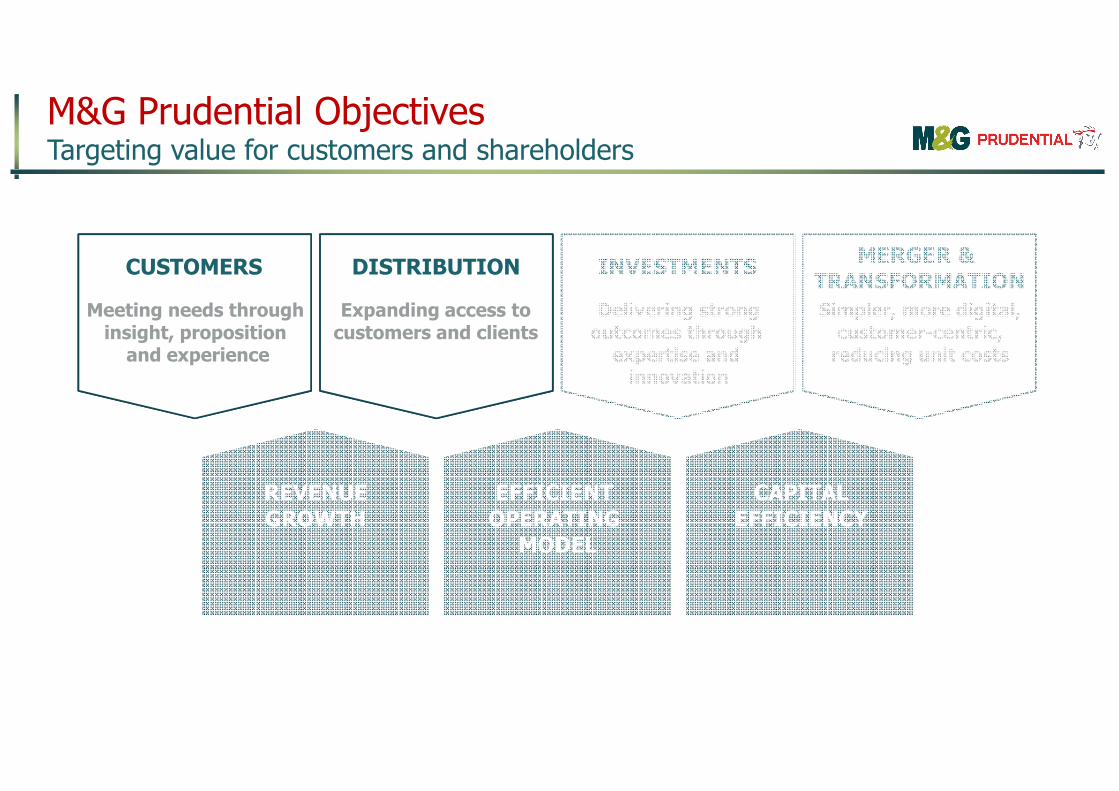
CUSTOMERS
Meeting needs through insight, proposition
and experience
INVESTMENTS
Delivering strongoutcomes through
expertise and innovation
MERGER & TRANSFORMATION
Simpler, more digital, customer-centric,
reducing unit costs
DISTRIBUTION
Expanding access to customers and clients
M&G Prudential ObjectivesTargeting value for customers and shareholders

Growth expanding global
access and deepening expertise
Growthbased on strong performance
Cashsimplify, improve
service and efficiency
Growtha leading UK consumer
investments business
Growthstrong position,
plenty of market headroom
Savings & Retirement Solutions
Traditionalproducts
European customers
Institutions
Investmentfunds
UK c
ust
om
ers
Large, stable customer base inannuities and traditional with-profits
Scale asset manager, drivingstrong investment performance
Underlying multi-asset capability
Retirement Account with unique PruFund proposition
Deep investment capability
Brings scale and helps withseeding of investment strategies
Leading cross-border asset manager
With-Profits in Poland, PIA licence in Ireland
+
+
+
+
Providing scale in key asset classes
Top 5 UK retail asset manager1
with scale in FI and solutions+
1. Source: The Investment Association, June 2017
M&G Prudential Customer GroupsWorking together for positive customer outcomes, growth and cash

Chief Executive
CEO, M&G Investments
Deputy CE, M&GP
Clare Bousfield Anne Richards
CEO, Savings & Retirement Solutions
Deputy CE, M&GP
Jack Daniels Keith Davies
Group TreasurerCIO, Savings &
Retirement Solutions
HR Director Chief of Staff
Irene McDermott Brown
Nicole Jones
Chief Operating Officer
Chief Financial Officer
Grant SpeirsMiguel Ortiz
John Foley
Chief Risk & Compliance Officer
M&G Prudential Leadership TeamNew team combines the breadth of skills, experience and drive to deliver

Overview John Foley
M&G Prudential: Merger and Transformation Miguel Ortiz
M&G Prudential: Customers and Distribution Clare Bousfield
M&G Prudential: Investments Anne Richards
Conclusion John Foley
M&G Prudential: Financials Grant Speirs
1
2
3
4
5
6
Agenda

Shareholderbacked
� Reinsurance
� Asset trading
� Credit hedging
� Model improvements
� Potential sale of blocks of business
Net annuity liabilities (HY 2017)
Investment strategy
� Long-term view using strategic asset allocation
� Active asset management through M&G and PPMA1
� Asset origination
� Strong credit research teams
� Diversified portfolio
� Alternative asset classes
Capital optimisation
With-profits(non-
participating)
1. Prudential Portfolio Managers America
7
11
33
Annuities Update Investment strategy to drive profitability, and capital optimisation
With-profits(participating)
£51bn

UKClare Bousfield
REVENUEGROWTH
EFFICIENT OPERATING
MODEL
CAPITALEFFICIENCY
CUSTOMERS
Meeting needs through insight, proposition
and experience
INVESTMENTS
Delivering strongoutcomes through
expertise and innovation
MERGER & TRANSFORMATION
Simpler, more digital, customer-centric,
reducing unit costs
DISTRIBUTION
Expanding access to customers and clients
M&G Prudential ObjectivesTargeting value for customers and shareholders

Structural Drivers of Continued Market GrowthGrowing need for long-term investment solutions and retirement support
UK customers� Above GDP growth in individual savings � Stronger growth in demand for retirement
and investment solutions
European customers� Shift from traditional investment products
to mutual funds� Growing 1-2% faster than UK
Institutions� Long-term investment horizons� Search for yield and growing demand for
real assets and alternatives
1. Source: Eurostat
+15%
+14%
2017 2030
107.6m 122.2m
EU and UK population aged 55-75, 2017-20301
(EU 28,ex UK)
14.7m16.9m
+17m
Demographics� Ageing and growing
population of retirees� People living longer� Expectations shaped
by other industries
Macroeconomics� Search for yield� Volatile markets� Transfer of risk to
individual
2.1 1.9 1.7 1.6 1.6 1.6
1.0 .9 1.0 1.2
3.2
3.9
2010 2011 2012 2013 2014 2015
2. Source: Occupational Pension Schemes Survey, UK: 2015
Active membership of UK private sector occupational pension schemes
(millions)2
Defined contribution
Defined benefit

1. ABI statistics / Prudential analysis 2. Broadridge data digest H1 2017, excluding ETFs
3. Broadridge data digest H1 2017
4. S&P Money Market as at 31 December 20165. IPE March 2015
M&G Prudential Gross FlowsStructural opportunity translates into strong traction across all customer groups
� 18% market share in life and pensions retail investments in H1 171
� M&G gross sales up 45% 9M 17 vs 9M 16
Gross flows (£bn)
� Work with 44 out of 89 UK Local Government clients4
� Manage money for 68% of the UK’s top 50 pension schemes5
� In top 5 active asset managers for pan European net sales for H1 172
� 2 funds in the top 25 pan-Euro net selling funds in H1 1739.8
5.8
17.2
FY 2016 9M 2016 9M 2017
UK customers
European customers
Institutions
14.510.4
14.3
FY 2016 9M 2016 9M 2017
7.1 5.19.1
FY 2016 9M 2016 9M 2017

M&G Prudential Growth StrategiesLeverage combined strengths to drive growth in UK, European and global markets
UK customers
Support retirement opportunity
Diversify wrappers and extend investment proposition
�Invest in intermediated and direct distribution
�
�
European customers
Broaden reach and proposition
Build out SICAV offering�
Expand reach through wholesale relationships�
Leverage insurance capabilities�
Institutions
Differentiated and flexible capabilities
�
�
�
Respond to growing demand for yield and real assets
Develop new products alongside our clients
Target long-term investment strategies
� � �
Target cash savings that are earning low returns
Leverage brand strengthNeed alternatives to expensive guarantees
Deepen client relationships
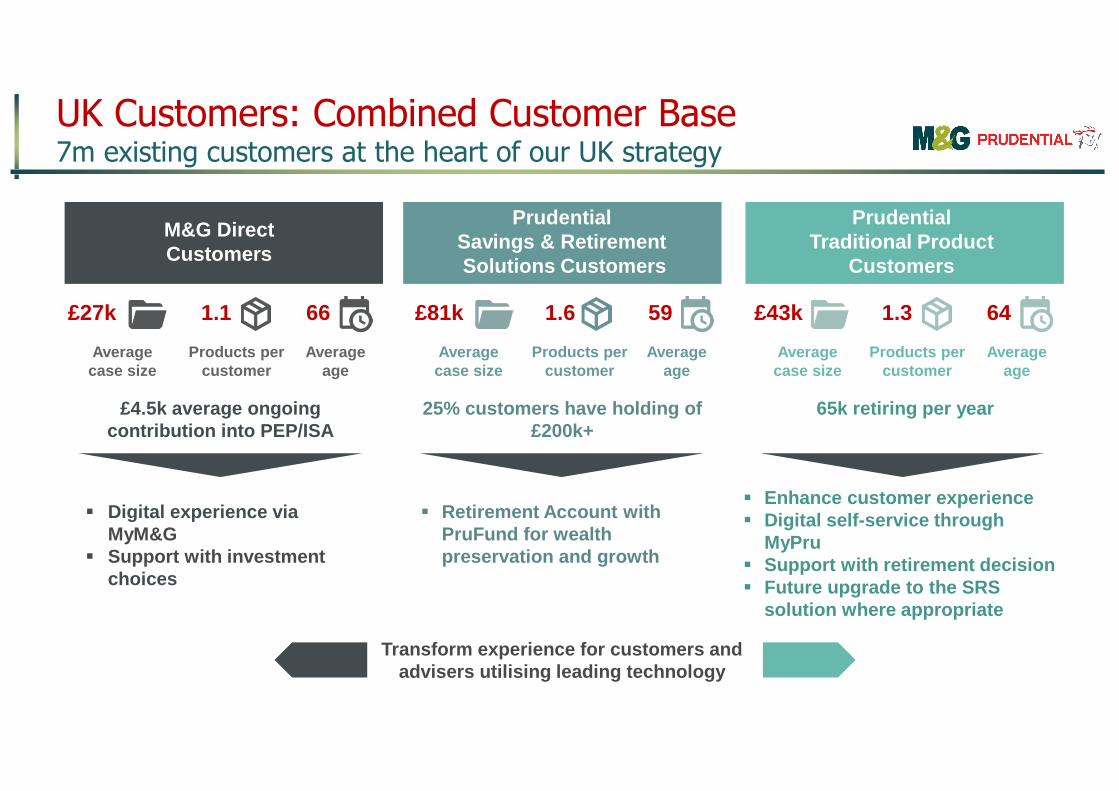
M&G DirectCustomers
� Digital experience via MyM&G
� Support with investment choices
PrudentialSavings & RetirementSolutions Customers
� Retirement Account with PruFund for wealth preservation and growth
Prudential Traditional Product
Customers
� Enhance customer experience� Digital self-service through
MyPru� Support with retirement decision� Future upgrade to the SRS
solution where appropriate
UK Customers: Combined Customer Base7m existing customers at the heart of our UK strategy
Transform experience for customers and advisers utilising leading technology
£4.5k average ongoing contribution into PEP/ISA
25% customers have holding of £200k+
65k retiring per year
Products per customer
1.1 £27k
Average case size
Average age
66 £43k
Products per customer
1.6 £81k
Average case size
Average age
59
Products per customer
Average case size
Average age
1.3 64

UK Customers: Delivering for our CustomersDelivering good outcomes for our customers, new and existing
VulnerabilityDecision Support
Attitude to Risk
Value for Money
TransparencyCustomer-focused
approach
PruFund
Unparalleled diversification����Smoothed returns����Financial strength����
Differentiated investment solutions����Strong performance����Fund innovation����
Always Human
Intelligent Solutions
Visual First Volatility Managed
Mobile First Multi-Channel

UK Customers: Channel MixAccessing our customers through a range of channels, all with potential for growth
9M 2017gross flows:
£14.3bn
Direct to customer
Intermediary
Wholesale
SRS and M&G
Advised (PFP)
Working directly with Independent
and Restricted advisers
Advisers via platforms, wealth
managers and banks
UK
cu
sto
me
rs
Customer solutions
addressing financial needs
Customer solutions for advisers
leveraging unique investment capability
Individual funds within
adviser portfolios
Intermediated58%
Direct: Non-advised
3%
Direct: PFP6%
Wholesale33%

UK Customers: M&G Prudential Brand StrengthStarting with two distinctive, trusted and complementary brands
Experts in their field
Strong Heritage
LeadingInvestment Brand
Financially Strong
LeadingRetirement
Brand
Strong retirement brand, with heritage and trust
Particular strength with mass market/mass affluent segments of intermediary market
Strong investment brand in the UK, seen as expert in the field and a leading/top 10 brand in Europe
Particular strength with sophisticated investors and mass affluent into HNW segments of intermediary market, both in the UK and across Europe
UK consumers’ views of M&G and Prudential1
(proportion of those who “strongly agree” or “ tend to agree” with statement)
1. Source: YouGov sample of GB adults, October 2017. Responses for ABC1s familiar with the brand (Prudential – 754; M&G – 152)

13%18%
22% 25% 28%
2013 2014 2015 2016 9M 2017
1.1 1.7
2.83.6
5.0
25
129
191 210251
288320
2011 2012 2013 2014 2015 2016 9M 2017
UK Customers: Direct to Customer ChannelProviding advice and guidance, using digital technology to transform experience
GoPru PFP Lead Management App� One of a number of apps / innovations
developed in M&G Prudential Digital Hothouse
� Dynamic lead generation and management for partners
� Roll-out underway now
M&G Direct ISA/GIA customers� 24/7 secure access� News and insight� Self-service
MyPru� Manage existing policies online� Request annual review
AUA (£bn) and Partner numbers
AuA Partners
Self-sufficiency (% new business written from referral and PFP own clients)
Prudential Financial Planning growth
Digital development

UK Customers: Intermediary OpportunityMerger work driving opportunities in our distribution relationships
9M 2017 Total UK intermediary gross flows
£4.8bn2
£8.2bn£3bn initial sweet-spot … 680 IFA
firms with strong existing relationships and business with
M&G and Prudential
LOW MED HIGH
LOW
MED
HIGH
(Flow £)
Intermediary flows from 7,400 IFA firms analysed at individual account level1
Nat/Network
Investments
Pensions
Wealth
45%
Nat/Network
Investments
Pensions
Wealth
22%
27%
6%
81%
1%
14%
2%
IFA Type
£200m £2,100m
£250m
240 Firms
70 Firms
290 Firms
1. Analysis using a sub-set of total flows 2. Across intermediary and wholesale via intermediaries
£480m
80 Firms

£15.2bn£3.5bn
£4.4bn
£6.7bn1
£0.7bn
European Customers: Deepening DistributionGrowing presence in growth investment markets
� An established presence across major European markets following 15 years of growth
� Italy is our largest market with £15bn AUM distributed through over 100 of the largest retail distributors
� Opportunity for further growth through strategic partnerships and new investment solutions
� Small but growing with-profits business in Poland. Investigating expanded use of smoothing
� Hubs in Luxembourg and Dublin for delivery of European solutions
1. Includes Chile
£1.7bn
European AUM (9M 17)
£4.9bn
9M 16 9M 17
£39.5bn
£26.8bn
Total2
+
2. Europe includes AUM in Asia and South Africa
<£0.1bn

69%
8%
8%
5%4%
3%3%
Institutions: Growing the Client BaseWorking with a range of UK and global institutions
� Alternatives have delivered strong revenue growth in closed ended funds (e.g. private debt and real estate)
� Positive progress off low base for growth strategies (e.g. emerging markets and multi-asset)
� Opportunity to leverage our expertise in Europe as changes in regulations are embedded
Institutional client breakdown by client type at
30 Sep 2017
Private sector pension fund DB
Public pension fund
Bank
Insurance company
Other
Asset manager
Private sector pension fund DC
48
57 5963
66
73
79
2011 2012 2013 2014 2015 2016 9M
2017
3rd party institutional AUM(£bn)

Summary: Customers and DistributionA strong platform for growth
Growing market demand
A step-change in customer focus Two complementary, trusted brands
2010 2020 2030
A strong distribution footprint
� >7 million retail customers
� 130+ platform placements
� Nearly 800 institutional mandates� Strong growth and opportunities to
expand presence with specialist advisers through combining our offerings
� Modernising business while developing competitive advantages will create a strong, customer-centric foundation for growth
� Segment focus remains in the near/at/in-retirement market, centred on age 50+, mid to high affluence segments
� Institutional: search for yield and transfer of risk to individuals
� UK consumers: continue to capture retirement opportunity by diversifying wrappers to access PruFund and extending investment proposition
� Europe: strong growth and potential for further revenue synergies

UKAnne Richards

REVENUEGROWTH
EFFICIENT OPERATING
MODEL
CAPITALEFFICIENCY
CUSTOMERS
Meeting needs through insight, proposition
and experience
INVESTMENTS
Delivering strongoutcomes through
expertise and innovation
MERGER & TRANSFORMATION
Simpler, more digital, customer-centric,
reducing unit costs
DISTRIBUTION
Expanding access to customers and clients
M&G Prudential ObjectivesTargeting value for customers and shareholders

M&G Prudential Investment ModelDelivering for clients through active management
Private assets Absolute return Emerging markets Retirement Income Multi-asset Credit
� Broad range of strategies and asset classes
� Bespoke solutions� Smoothing using inherited
estate
� Active management� Meeting customer objectives� Identifying and taking advantage
of market opportunities
� Flagship proposition highlights� Creating and seeding new
propositions
Capability Performance Proposition
Responding to structural shifts in client needs

M&G Prudential Investment ModelDelivering for clients through active management
Private assets Absolute return Emerging markets Retirement Search for yield Multi-asset Impact investing
� Broad range of strategies and asset classes
� Bespoke solutions� Smoothing using inherited
estate
� Active management� Meeting customer objectives� Identifying and taking advantage
of market opportunities
� Flagship proposition highlights� Creating and seeding new
propositions
Capability Performance Proposition

M&G Prudential Mix by Asset ClassBreadth of M&G Prudential investment capabilities
30%
7%
1%
2%
60%
M&G Prudential AUM by asset class (%)
Multi-assetCombining our wider range of investment capabilities to provide multi-asset solutions
Fixed income
A leading European bond manager with one of the largest credit analyst teams in UK / Europe
EquitiesUnconstrained, conviction-led approach to long-term investing
Real estateManaging a range of asset types (e.g. retail, residential, commercial) in the UK, continental Europe, Asia and North America
AlternativesFull series of investment disciplines including real estate finance, direct lending and infrastructure equity investmentTotal AUM: £337bn

M&G Prudential Mix by Asset ClassBreadth of M&G Prudential investment capabilities
56%
16%
6%
2%
3%
17%
M&G Prudential AUM by asset class, multi-asset lookthrough (%)
Multi-asset
Fixed income
Equities
External
Alternatives
Real estate
13%
24%
40%
9%
8%6%
Sterling govt bond Sterling corporate bond
Overseas bonds Other public debt
Private debt Real estate mortgages / debt
M&G Prudential fixed income AUM by sub-asset class (%)
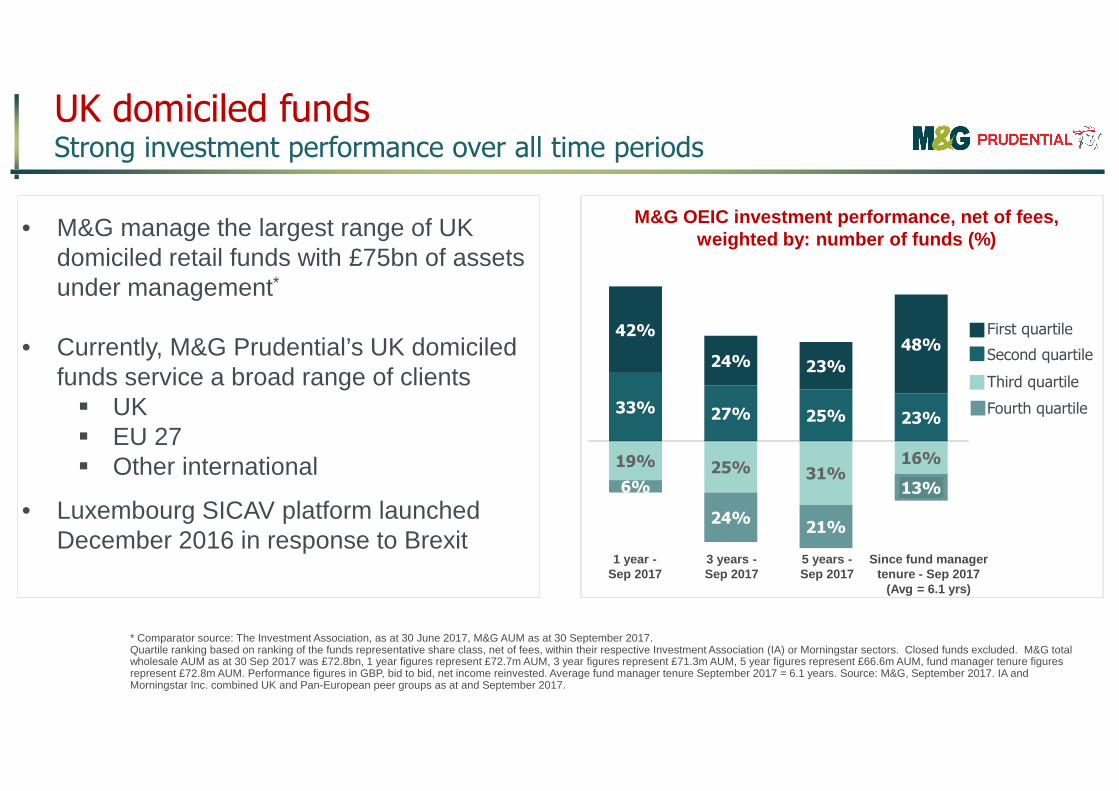
M&G OEIC investment performance, net of fees, weighted by: number of funds (%)
19% 25% 31%16%
6%
24%21%
13%
33% 27% 25% 23%
42%
24% 23%
48%
3 years -Sep 2017
5 years -Sep 2017
1 year -Sep 2017
Since fund manager tenure - Sep 2017
(Avg = 6.1 yrs)
Fourth quartile
Second quartile
First quartile
Third quartile
* Comparator source: The Investment Association, as at 30 June 2017, M&G AUM as at 30 September 2017.Quartile ranking based on ranking of the funds representative share class, net of fees, within their respective Investment Association (IA) or Morningstar sectors. Closed funds excluded. M&G total wholesale AUM as at 30 Sep 2017 was £72.8bn, 1 year figures represent £72.7m AUM, 3 year figures represent £71.3m AUM, 5 year figures represent £66.6m AUM, fund manager tenure figures represent £72.8m AUM. Performance figures in GBP, bid to bid, net income reinvested. Average fund manager tenure September 2017 = 6.1 years. Source: M&G, September 2017. IA and Morningstar Inc. combined UK and Pan-European peer groups as at and September 2017.
• M&G manage the largest range of UK domiciled retail funds with £75bn of assets under management*
• Currently, M&G Prudential’s UK domiciled funds service a broad range of clients� UK� EU 27� Other international
• Luxembourg SICAV platform launched December 2016 in response to Brexit
UK domiciled funds Strong investment performance over all time periods

M&G OEIC investment performance, net of fees, weighted by: assets under management (%)
12% 13%25%
4%
8%
29%16%
11%
28% 21% 21%11%
52%
37% 38%74%
3 years -Sep 2017
5 years -Sep 2017
1 year -Sep 2017
Since fund manager tenure - Sep 2017
(Avg = 6.1 yrs)
• M&G manage the largest range of UK domiciled retail funds with £75bn of assets under management*
• Currently, M&G Prudential’s UK domiciled funds service a broad range of clients� UK� EU 27� Other international
• Luxembourg SICAV platform launched December 2016 in response to Brexit
Fourth quartile
Second quartile
First quartile
Third quartile
* Comparator source: The Investment Association, as at 30 June 2017, M&G AUM as at 30 September 2017.Quartile ranking based on ranking of the funds representative share class, net of fees, within their respective Investment Association (IA) or Morningstar sectors. Closed funds excluded. M&G total wholesale AUM as at 30 Sep 2017 was £72.8bn, 1 year figures represent £72.7m AUM, 3 year figures represent £71.3m AUM, 5 year figures represent £66.6m AUM, fund manager tenure figures represent £72.8m AUM. Performance figures in GBP, bid to bid, net income reinvested. Average fund manager tenure September 2017 = 6.1 years. Source: M&G, September 2017. IA and Morningstar Inc. combined UK and Pan-European peer groups as at and September 2017.
UK domiciled funds Strong investment performance over all time periods

See appendix for performance disclosures. AUM and performance figures as at 30 September 2017.
• Institutional portfolios come with a range of objectives and criteria for success
- Benchmark/target relative- IRR over life of fund- Asset liability management- Hold to maturity
• No single measure can effectively capture the entire £79bn institutional book of business
• We are showing a subset of our book where we have quartile returns and a selection of flagship strategies
Third quartile
Second quartile
First quartile
3 yrs to Sep 2017
10%
20%
50%
5%
62%
33%
0%
M&G institutional peer comparison by quartile on externally managed AUM
Fourth quartile
Chart represents £28.6bn of AUM, for mandates measured gross of fees
Flagship institutional strategy investment performance returns (%)
FIXED INCOME
M&G Alpha Opportunities
PROPERTY M&G Asia Property
MULTI-ASSET M&G Episode
Allocation
EQUITYInstitutionalEquity Client
ALTERNATIVESInfracapital Partners
II
Return relative to benchmark
Fund return
£0.5bn £1.7bn£7.3bn £0.7bn £1.9bn
20.6%
Infracapital Partners II performance shown as cumulative IRR, all other fund returns are annualised. Returns are 3 years to 30 September 2017. See appendix for full performance disclosures including fee basis per strategy.
20.6%
3.9%3.4%
2.7%
7.7%
11.1%
0.2%1.1%
3.1%
InstitutionalStrong investment performance

# Refers to GBP I share class returns, net of fees since inception (08/12/2006) *21 investment professionals refers to M&G’s Retail Fixed Income team supported by M&G’s wider credit analysis team
Flagship proposition highlight: 1. M&G Optimal Income Fund
� Delivering a combination of income and capital growth to customers seeking yield while having the opportunity to grow their capital across a variety of market conditions.
� Net sales to end September 2017 of £3.8bn
� Annualised performance since inception of 7.5%#
net of fees
Launched: December 2006
Stable team of 21 investment professionals*
AUM £20.7 billion
M&G Optimal Income Fund relative return net of fees vs. UK and European benchmarks (%)
-2
0
2
4
6
8
2013 2014 2015 2016 9M 2017
M&G Optimal Income Fund GBP I Acc relative to IA sterling strategic bond sectorM&G Optimal Income Fund EUR A-H relative to Morningstar EUR Cautious Allocation global sector

M&G Optimal Income FundA flexible fixed income fund with the ability to outperform throughout the economic cycle
Flexible and dynamic
A flexible and strategic fixed income fund taking active duration, yield curve, credit and equity positions
Performance
Aims to outperform the average investment grade, high yield and government bond fund over the medium term
Expertise
Draws on M&G’s broad range of fixed income expertise and access to assets
Source: M&G analysis, September 2017
A ‘go-anywhere’ fixed income fund

-2.3
1.7
7.2
-4
2.7
PruFund Growth Life Fund relative to ABI Mixed Investment 20%-60%
� Part of a suite of six funds within the
PruFund range
� Aims to grow customers’ investments while
utilising the inherited estate to deliver stable
returns over the medium to long term
* AUM shown is total for PruFund Growth Life and Pensions Funds, representative performance shown for Life Fund only. Note: Data as at 9M 2017. PruFund performance is after representative 0.65% pa fund charge for consistency with ABI Mixed Investment 20%-60% which allows for average fund charge for that sector. Source: Financial Express.
Flagship proposition highlight: 2. PruFund Growth Investment performance update
PruFund Growth Life Fund investment performance relative to benchmark
Launched: November 2004
Leveraging strength of multi-asset expertise
AUM £18.1 billion
2013 2014 2015 2016 9M 2017
+35%
+28%
ABI Mixed Investment 20%-60% Shares

With-Profits Fund: A Competitive AdvantageUnique asset delivering long-term performance
PruFund sales, 9M 2017
PruFund AUM (£bn)
12%
5.1
1.7
1.00.6
% New businesswith guarantees9M 2017: 2% 9M 2012: 50%
£8.4bnInternational
ISAs
Bonds
Pensions/Drawdown
7.5 9.111.6
16.5
24.7
32.6
2012 2013 2014 2015 2016 9M 17

Well diversified fund
With-profits life fund strategicasset allocation 2017
26.5%Fixed
Income
15.5%Real
Estate
3%Cash
47.5%Equity
7.5% Alternatives
With-Profits Fund: A Competitive AdvantageUnique asset delivering long-term performance
PruFund sales, 9M 2017
PruFund AUM (£bn)
12%
5.1
1.7
1.00.6
% New businesswith guarantees9M 2017: 2% 9M 2012: 50%
£8.4bnInternational
ISAs
Bonds
Pensions/Drawdown
7.5 9.111.6
16.5
24.7
32.6
2012 2013 2014 2015 2016 9M 17

With-profits fund investment performance to YE 2016 1
1 yr
5 yrs
10 yrs
14.5%
Cumulative CAGR
14.5%
56.6%
84.2%
9.4%
6.3%
2. Invested with-profits assets at HY 2017
£126bn invested assets2
£8.6bn inherited estate3
3. UK with-profits estimated Solvency II Own Funds position at HY 2017
1. Return before tax
With-Profits Fund: A Competitive AdvantageUnique asset delivering long-term performance
Well diversified fund
With-profits life fund strategicasset allocation 2017
26.5%Fixed
Income
15.5%Real
Estate
3%Cash
47.5%Equity
7.5% Alternatives
PruFund sales, 9M 2017
PruFund AUM (£bn)
12%
5.1
1.7
1.00.6
% New businesswith guarantees9M 2017: 2% 9M 2012: 50%
£8.4bnInternational
ISAs
Bonds
Pensions/Drawdown
7.5 9.111.6
16.5
24.7
32.6
2012 2013 2014 2015 2016 9M 17

Investment Proposition DevelopmentMeeting evolving customer needs
• Leveraging our investment capabilities and balance sheet to develop a range of innovative products and propositions for our customers
• M&G High Yield ESG Bond Fund
• M&G Impact Financing Fund
• Infracapital Partners 3
• M&G Floating Rate High Yield Solution Fund
IDEA DEVELOPMENT CONSTRUCTION SEEDING
PROPOSITION DEVELOPMENT PROCESS

Recent product development: Infrastructure Greenfield: Long-term opportunity for yield
Infracapital Greenfield Partners
2016
IMPPP 2002
Infracapital Partners LP
2005
Infracapital Partners II
2012
M&G Prudential have strength and depth in Infrastructure investing through Infracapital, our dedicated infrastructure investing arm – managing a broad range of strategies
Portfolio of infrastructure assets
Long term
Stable
Predictable
Inflation-linked
IDEA DEVELOPMENT CONSTRUCTION
• Balance sheet support provided to launch the fund
• Subsequent success in capital raising
SEEDING
Customer need

Seeding new productsStrategic use of M&G and Prudential balance sheets capital to seed funds
50
13529
58
2016 2017
+144%
Institutional funds
Wholesale and direct funds
16%
10%
8%
6%
5%
2%
1%1%
10%
4%
10%
5%
22%
Absolute Return Bond
Global Target Return
EM Income Opportunities
High Yield ESG Bond
Global Listed Infrastructure
EM Hard Currency Bond
Global Rate High Yield Solution
Floating Rate High Yield Solution
European Secured Property Income
Infracapital Greenfield
UK Enhanced Value
Infracapital Fund III
Other
2017:£193m
2016 figures are full year actual, 2017 figures are full year forecast. Source: M&G, November 2017
Seeding portfolio (£m)

Summary: InvestmentsLeveraging a broad range of capabilities to deliver solutions to our customers
Capability
Proposition Commitment
Performance
� Strong performance across asset classes and products
� Meeting customer needs� Successfully developing ideas
into successful commercial propositions
� Long term, sustainable, active management
16%
10%
8%
6%
5%
2%
1%1%
10%
4%
10%
5%
22%
� Investing in the growth of the business through new product launches

APPENDIX: Institutional performance chart disclosure
This chart represents £28.6bn of AUM out of a total institutional AUM of £79bn.1) Performance is aggregated and weighted by assets managed removing any cross holdings as at 30 September 2017. 2) Returns are reported at a total level in mandate currency. Investment returns are net of fees for pooled products and gross of fees for most other products such as segregated mandates or structured products. 3) Peer groups are sourced from Morningstar where available. The internally calculated peer groups are based on mandate returns relative to their agreed performance comparator (peer group or benchmarks) +/- an agreed range to account for the quartiles. Therange differs depending on mandate type and risk profile but is applied consistently. Funds or mandates that do not have an appropriate peer group, performance comparator or outperformance target are excluded from calculations.4) All measures are against peer groups as opposed to the investible benchmarks. These measures use representative share classes for the pooled vehicles, not the entire product. 5) Returns are shown by client mandate, not by individual strategy. 7) Property funds or mandates are measured to 30 June 2017 for calculation.8) Closed funds are excluded from the end of period AUM and therefore they have been excluded from the calculation.
Note: Alpha Opportunities Fund A £ benchmark is LIBOR 1 month rate. Performance is net of fees. Infracapital Partners I has no formal benchmark or internal reference benchmark, return shown is since inception IRR net of fees. Performance is net of fees. Institutional Equity Client performance is gross of fees. M&G Episode Allocation Fund I £ has no formal benchmark, the internal reference benchmark is (IA) Mixed Investment 20-60% Shares Sector Average/Count. Performance is net of fees. Asia Property Fund returns are in USD. The underlying asset return benchmark is the 31/12/13 IPD “M&G reweighted Pan-Asia benchmark’”. The Fund’s investment objective is a rolling three year local currency return target of 8%. Performance is net of irrecoverable costs and property management fees. Source: M&G October 2017.
M&G institutional peer comparison by quartile on ex ternally managed AUM (Gross of Fee Mandated Target)
Flagship institutional strategy investment perform ance returns (%), three years to 30 September 2017

UKMiguel Ortiz

REVENUEGROWTH
EFFICIENT OPERATING
MODEL
CAPITALEFFICIENCY
CUSTOMERS
Meeting needs through insight, proposition
and experience
INVESTMENTS
Delivering strongoutcomes through
expertise and innovation
MERGER & TRANSFORMATION
Simpler, more digital, customer-centric,
reducing unit costs
DISTRIBUTION
Expanding access to customers and clients
M&G Prudential ObjectivesTargeting value for customers and shareholders

Capitallight
Customer-centric
Why We Are TransformingEnvironmental factors create need and opportunity
Simpleand
efficient
Delivery-focused
Fast-growing
Digitally-enabled
“to become the best-loved, and most successful savings and investments business”
Investing to grow the breadth and reach of our capital-light solutions for consumers, intermediaries and institutions
Becoming an externally-focused business, that puts the customer at the centre
of everything we do
Using data, analytics and digitalto improve the experience of our customers and colleagues
Transforming the scalability of our operating model: the biggest constraint on our growth
Evolving the culture and capabilities
of the organisation, and translating transformation into a set of simple goals
A simple, efficient business model, that
allows us to deliver outstanding
solutions to our customers at low cost

Merger & Transformation
Distribution & Proposition
Merger Sprints Transformation Workstreams
Operations & IT
Investment Management
Support Functions
Culture
European Funds Platform
In-Force ModernisationUK Retail Savings
Investment Operating Model
Finance Transformation
Merger & Transformation ProgrammeProgramme structured to deliver quick results
Single merger and transformation team
Locations Governance and culture

Business as usual (BAU)
Merger & Transformation Timeline3-4 years transforming our business
20222017 2018 2019 2020 2021
European Funds Platform
Regulatory
Finance Transformation
Merger planning & execution
UK Savings
Investment operating model
Culture
In-Force Modernisation
Merger revenue synergies

Merger & TransformationTargeting revenue growth and expense reduction of £145m pa as stated at HY 2017
Similar split of investment spend of £250m
Re-engineering to be a cost leader and create a scalable platform for growth
� £145m pa reduction in shareholder expense base to be achieved in FY 2022, majority of run-rate savings delivered by end of 2020
� Savings to be delivered by modernisation of back book and new business activities, and by rationalisation and simplification of support functions
� Investing to accelerate growth, moving to a more fixed-cost digital model, with new business added at low marginal cost
� Moving core in-force business towards a more variable cost model
Summary composition of expense base reduction
Back bookmodernisation
New business
modernisation
Merger& functional
transformation
Total
c35% c40% c25% £145m

Transformation Workstreams
Transformation: UK Retail SavingsBuilding a digital front end for new and existing customers
European FundsPlatform
In-Force Modernisation
UK Retail Savings
Finance Transformation
Intuitive digital engagement layer available through multiple channels
Guidance Interactive tools Self-service
Advisors PFP Direct Workplace
Transforming customer experience
Range of M&G Prudential proprietary funds through variety of wrappers
0.2mDirect
customers
4.6 mDirect & traditional
customers
1.7 mAdvised
customers
0.1 mPFP
customers
0.6mWorkplacecustomers
Customer servicing & infrastructure
Investment Operating Model
Culture

Transformation: In-Force ModernisationRationalisation and digital enablement of legacy policy admin platforms
Transformation Workstreams
Legacy platform consolidation
and administration
Wealth management platform and administration
IT InfrastructureM&G Prudential
Digital enablement(customer and advisor hub,
API layer and platform integration layer)European FundsPlatform
Digital experiencecustomer/advisor
Investment Operating Model
Finance Transformation
In-Force Modernisation
UK Retail Savings
Culture

Tranche mergers
Transformation: European Funds PlatformM&G Prudential’s response to Brexit creates a stronger platform for European growth
Transformation Workstreams
European FundsPlatform
JanContingency planning
June Brexitreferendum
DecLaunch of M&G (Lux) Investment Funds (1) SICAV
CSSF submission for new corporate structure and additional fund launches
Executing Brexit Response
CSSF authorisationof Luxembourg Super ManCo and MiFID firm
H1 16 H2 16 20182017
Finance Transformation
In-Force Modernisation
UK Retail Savings
Investment Operating Model
Culture

Transformation: Investment Operating ModelData lake and Aladdin platform provide scalable core of operating model
Transformation Workstreams
European FundsPlatform
Portfolio Management
Trading & Operations
toolsALADDIN
M&G Pru
Data Lake
Risk Analytics
Delivering simplification, insight & operational scale
benefits
Majority of M&G Prudential funds maintained on
Aladdin
Core source of data for
investment decisions
Consistent view of holdings &
analytics
Finance Transformation
In-Force Modernisation
UK Retail Savings
Investment Operating Model
Culture

Transformation: CultureEmbedding the right culture is core to successful execution
Transformation Workstreams
European FundsPlatform
Why?
How?
What?
� Established the case for change for two successful organisations
� Merger a catalyst for wider change
� Mix of old, new and innovative� Driven by simplicity, efficiency,
customer outcomes
� Accountable/empowered teams� New ways of working � Leadership and best-in-class talent
CultureFinance
Transformation
Investment Operating Model
In-Force Modernisation
UK Retail Savings
UKGrant Speirs

REVENUEGROWTH
EFFICIENT OPERATING
MODEL
CAPITALEFFICIENCY
CUSTOMERS
Meeting needs through insight, proposition
and experience
INVESTMENTS
Delivering strongoutcomes through
expertise and innovation
MERGER & TRANSFORMATION
Simpler, more digital, customer-centric,
reducing unit costs
DISTRIBUTION
Expanding access to customers and clients
M&G Prudential ObjectivesTargeting value for customers and shareholders

IFRS operating profit:M&G Prudential
(2016 - H1 2017, £m)1
M&G
In-forceannuities
With-profits
Other2
TotalIFRS £1,253m £745m£717m
� Short payback period
� More market-driven
� Capital-light
� Longer payback periods
� Stable underlying earnings
� Capital-light new business
Complementary profiles
IFRS Operating Profit and Cash RemittancesDiversified earnings in combined business
M&G
SRS
Cash remittances to Group:M&G Prudential(2012 – H1 2017, £m)
392
216 242
332
306 288
269
195 215
260
H1 2016 H1 2017
206 235285 302 290
150 175
313
355325 301 300
215215
2012 2013 2014 2015 2016 HY
2016
HY
2017
M&G
SRS
1. Includes intra-Group revenue2. Management actions, performance related fees and one-offs
Other2

� Strong 9M 2017 trading across the business
� M&G positive net flows of £9.9bn vs (£8.0bn) in 9M 2016
� Particularly strong performances from Optimal Income Fund with £3.8bn net positive sales and Global Floating Rate High Yield Fund with £2.5bn net positive sales
� Record inflows to PruFund. Life business recorded £2.7bn positive flow vs £1.2bn in 9M 2016
� AUM growing strongly
Fund flows and AUM: M&G Prudential
(2016 – 9M 2017, £bn1)
Infl
ow
sO
utf
low
s
Net flows
Gross flows
22.2 41.432.8
(6.6) (6.9)
1. UK flows exclude annuities and internal fund flows for M&G. M&G flows include South Africa
12.6
22.814.7
31.7
10
7.5
9.8
(30.9)(22.8) (21.7)
(8.5)
(6.3) (7.1)
Prudential UK&E M&G
AUM 311 337312
2016 9M 16 9M 17
Fund Flows and AUMStrong growth across the business

UKJohn Foley

Conclusion
�
Combination is about building a business that can better meet customer needs
�
Uniquely positioned for growth in capital-light business – strong brands, scale, and investment capabilities
�Driving asset growth through a diversified set of wrappers, offerings and channels
�
Investing from a position of strength, to transform our operating model, technology, capabilities and culture

John Foley, Anne Richards, Clare Bousfield , Grant Speirs & Miguel Ortiz