provider stakeholder group october 7th, 2015 · minor chronic diseases in multiple organ systems 3%...
TRANSCRIPT

1
Provider Stakeholder Group
October 7th, 2015

2
Update on Primary Care Transformation
Update on Long Term Services and Supports (LTSS)
3
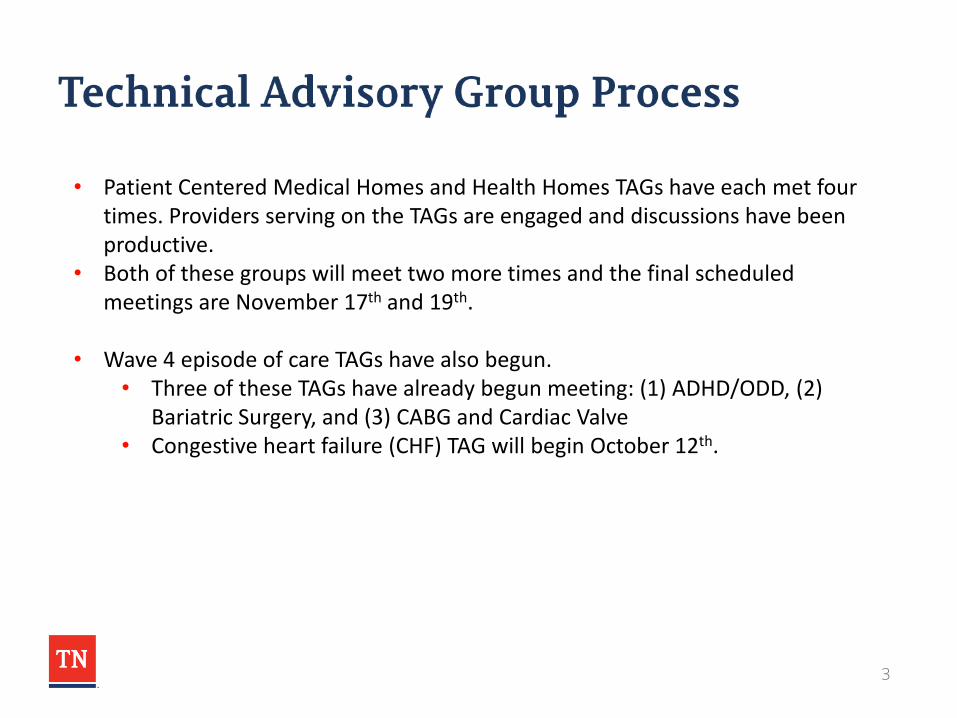
• Patient Centered Medical Homes and Health Homes TAGs have each met four times. Providers serving on the TAGs are engaged and discussions have been productive.
• Both of these groups will meet two more times and the final scheduled meetings are November 17th and 19th.
• Wave 4 episode of care TAGs have also begun.
• Three of these TAGs have already begun meeting: (1) ADHD/ODD, (2) Bariatric Surgery, and (3) CABG and Cardiac Valve
• Congestive heart failure (CHF) TAG will begin October 12th.

4
Profile of highest-spend patient population
Consistency of highest-spend patient population year on year
Utilization patterns including avoidable ED and IP visits
Diagnostic profile of individuals with 3 or more co-morbidities
Care access patterns for individuals for behavioral healthcare
1
2
3
4
5

5
2% 2% 2% 3% 4% 5% 7%
9%
14%
48%
<1% <1% <1% <1% <1% 1% 1% 1% 1% 1%
Each bar represents 5% of unique claimants (54K)
Distribution of members with claims1 by spend rank
Percent of adjusted spend, CY2014
The top 5% of claimants account for 48% of total adjusted spend
5% most costly claimants 5% least costly claimants
The top 20% of claimants account for 79% of the total adjusted spend
ADJUSTED TOTAL
6
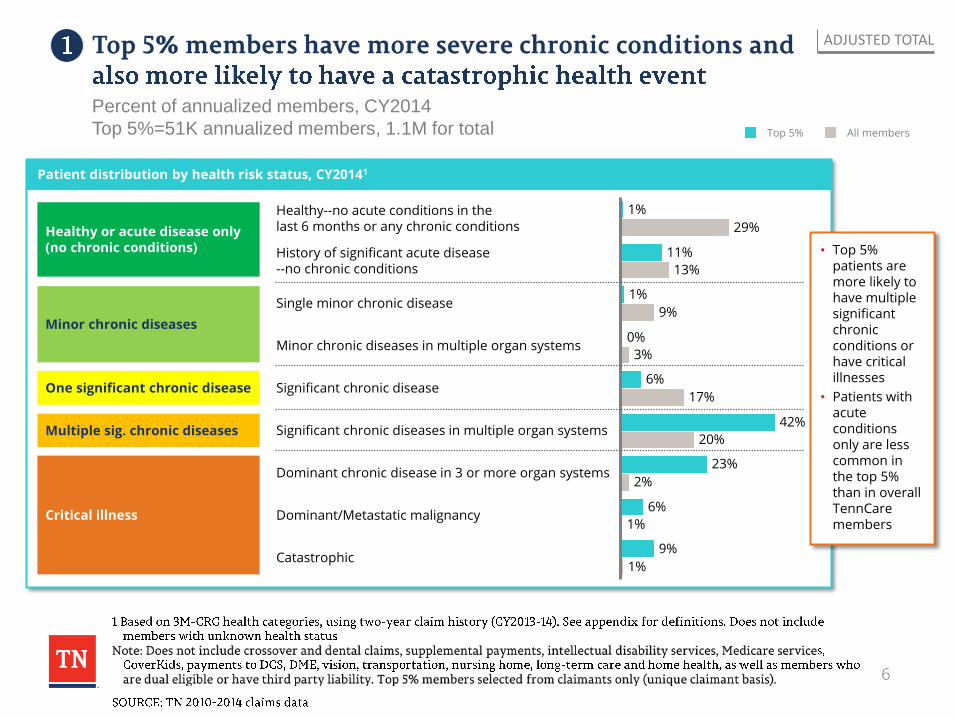
Patient distribution by health risk status, CY20141
Catastrophic 1%
9%
Dominant/Metastatic malignancy 1%
6%
Dominant chronic disease in 3 or more organ systems 2%
23%
Significant chronic diseases in multiple organ systems 20%
42%
Significant chronic disease 17%
6%
Minor chronic diseases in multiple organ systems 3%
0%
Single minor chronic disease 9%
1%
History of significant acute disease --no chronic conditions 13%
11%
Healthy--no acute conditions in the last 6 months or any chronic conditions 29%
1%
ADJUSTED TOTAL
Healthy or acute disease only (no chronic conditions)
Critical illness
Minor chronic diseases
One significant chronic disease
Multiple sig. chronic diseases
• Top 5% patients are more likely to have multiple significant chronic conditions or have critical illnesses
• Patients with acute conditions only are less common in the top 5% than in overall TennCare members
Percent of annualized members, CY2014
Top 5%=51K annualized members, 1.1M for total All members Top 5%

7
Age distribution Share of members with a BH diagnosis and receiving treatment
Overall 21%
Top 5% 64%
3 times 18-34
25%
53%
15%
7%
0%
35-44
55-64 3%
17%
45-54 5%
65+ 0%
17%
8%
24%
2-17 19%
0-1 6%
Top 5%
All members
Share of members receiving LTSS services1
Top 5% 4.5%
0.5% Overall
ADJUSTED TOTAL
Out of 5.9K non-dual patients receiving LTSS services, 2.3K are part of the top 5%
Percent of annualized members, CY2014
Top 5%=51K annualized members, 1.1M for total

8
EXCLUDES PHARMACY SPEND
4% 7%
8%
Malignancies
3% 7%
8%
Respiratory diseases
Cardiovascular diseases
0%
0% Diseases of blood & blood-forming organs 2%
16%
7% 6%
12%
Musculoskeletal diseases 8% 6%
Infectious & parasitic diseases
4% 6%
5%
Pregnancy, childbirth & puerperium
Digestive system diseases
12%
Newborns & other neonates
Mental diseases
13%
11%
3%
34% Other 2
Nervous system diseases
2% 3%
10%
1% 2%
Kidney and urinary tract diseases
Hepatobiliary system & pancreas diseases
• Medical service for diagnoses of neonatal conditions and mental diseases accounted for the largest share of medical spend for the top5%
• Neonatal conditions and malignancies are diagnoses for which there is a significant difference in share of spend for the top 5% and the remaining population
ADJUSTED TOTAL
Medical spend by diagnosis for the top 5% claimants, CY 2014 Percent of medical spend1
Top 5%
Other 95%

9
ODD 4
Conduct disorder 6
Adjustment reaction 6
Other/unspecified 6
PTSD 7
Attempted suicide or self-injury 8
Schizophrenia 8
Psychosis 9
Sleep disorders 10
ADHD 11
Other mood disorders 11
Major depression 15
Bipolar 18
Depression 29
Anxiety 32
Substance use 46
Somatoform disorders 0
Tic disorder 0
Phobias 0
Psychosexual 1
Emotional dist. of child/adolesence 1
Eating disorders 1
OCD 1
Borderline personality disorder 1
Homicidal ideation 2
Trauma
0 Manic disorder
2
Infant mental health/ substance abuse 3
Neonatal 3
Psychosomatic disorders 3
Personality 3
ADJUSTED TOTAL
• Substance abuse, anxiety, and depression are the most common BH diagnoses in top 5%
Behavioral health diagnosis prevalence in top5% claimants, CY 2014 Percent of annualized top 5% members; a member can have multiple BH diagnoses
10
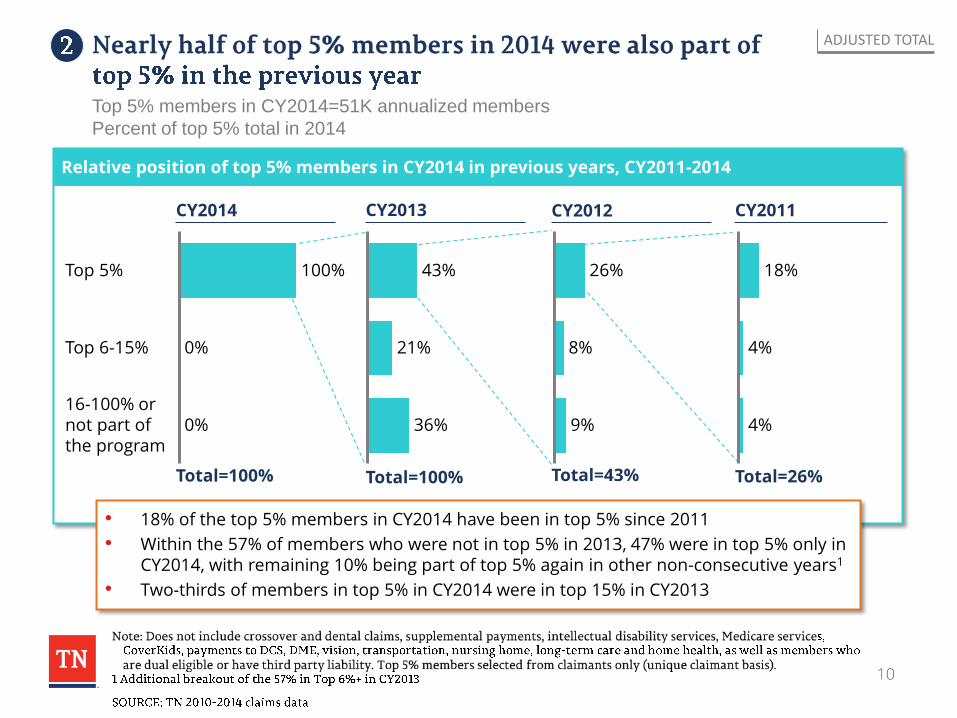
Relative position of top 5% members in CY2014 in previous years, CY2011-2014
Top 6-15%
0%
100%
16-100% or not part of the program
Top 5%
0%
CY2014
43%
21%
36%
• 18% of the top 5% members in CY2014 have been in top 5% since 2011
• Within the 57% of members who were not in top 5% in 2013, 47% were in top 5% only in CY2014, with remaining 10% being part of top 5% again in other non-consecutive years1
• Two-thirds of members in top 5% in CY2014 were in top 15% in CY2013
8%
9%
26%
4%
4%
18%
CY2013 CY2012 CY2011
Total=100% Total=100% Total=43% Total=26%
ADJUSTED TOTAL
Top 5% members in CY2014=51K annualized members
Percent of top 5% total in 2014

11
Patient distribution by health risk status, CY20141
ADJUSTED TOTAL
Healthy or acute disease only (no chronic conditions)
Critical illness
Minor chronic diseases
One significant chronic disease
Multiple sig. chronic diseases
• Patients in top 5% for four years more likely to be affected by critical illnesses
• Patients in top 5% for one year only likely to be affected by acute conditions only
Percent of annualized members, CY2014
100%=24K for in top 5% in CY14 only, 9K in top 5% in CY11-14
20% History of significant acute disease --no chronic conditions
0%
Healthy--no acute conditions in the last 6 months or any chronic conditions
2%
1%
0% Single minor chronic disease
Significant chronic diseases in multiple organ systems
Minor chronic diseases in multiple organ systems
Significant chronic disease
4%
Dominant chronic disease in 3 or more organ systems
2%
8%
Dominant/Metastatic malignancy
14%
5%
1%
0%
5%
Catastrophic 20%
44%
34%
3%
38%
Top5% in 2014 in top 5% in 2014 only
Top 5% in 2014 in top 5% in 2011-2014

12
Age distribution Share of members with a BH diagnosis and receiving treatment
Share of members receiving LTSS services1
ADJUSTED TOTAL
Percent of annualized members, CY2014
100%=24K for in top 5% in CY14 only, 9K in top 5% in CY11-14
45-54 24%
12%
26%
0%
55-64
65+ 1%
16%
0%
10%
19%
18-34 31%
2-17
13%
18%
16%
0-1
14% 35-44
Top 5% in 2014 in top 5% in 2011-2014
Top5% in 2014 in top 5% in 2014 only
Top5% in 2014 in top 5% in 2014 only
Top 5% in 2014 in top 5% in 2011-2014
72%
57%
Top 5% in 2014 in top 5% in 2011-2014
9.4%
2.3% Top5% in 2014 in top 5% in 2014 only
Among non-dual patients receiving LTSS services, 0.8K were in top 5% for all four
years, and 0.5K only in 2014
Largely female
13
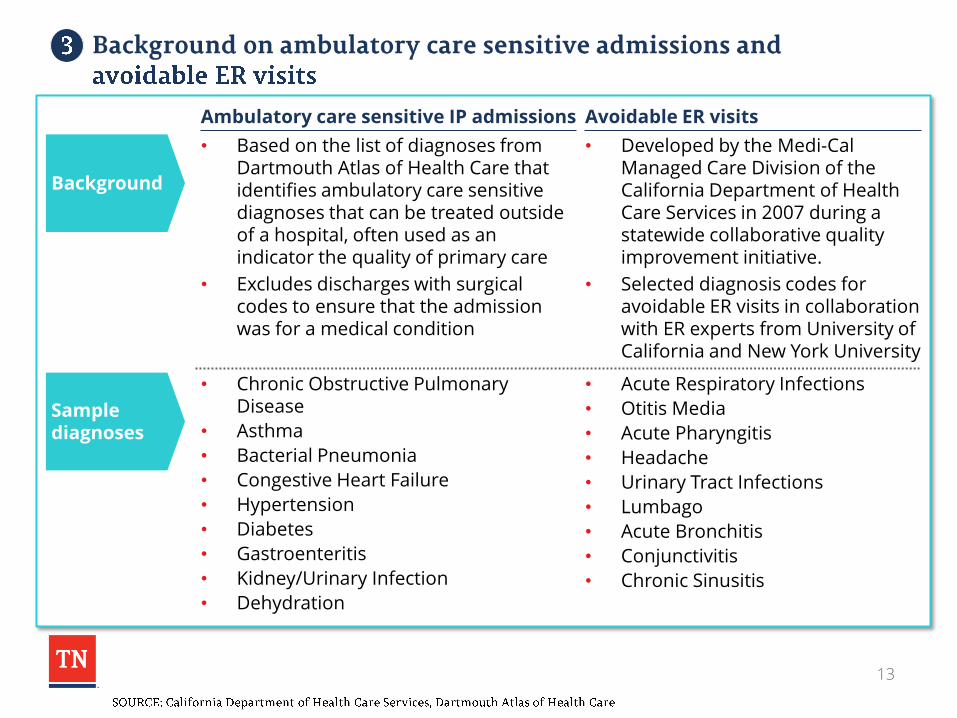
Sample diagnoses
Background
• Acute Respiratory Infections
• Otitis Media
• Acute Pharyngitis
• Headache
• Urinary Tract Infections
• Lumbago
• Acute Bronchitis
• Conjunctivitis
• Chronic Sinusitis
• Developed by the Medi-Cal Managed Care Division of the California Department of Health Care Services in 2007 during a statewide collaborative quality improvement initiative.
• Selected diagnosis codes for avoidable ER visits in collaboration with ER experts from University of California and New York University
Avoidable ER visits
• Chronic Obstructive Pulmonary Disease
• Asthma
• Bacterial Pneumonia
• Congestive Heart Failure
• Hypertension
• Diabetes
• Gastroenteritis
• Kidney/Urinary Infection
• Dehydration
• Based on the list of diagnoses from Dartmouth Atlas of Health Care that identifies ambulatory care sensitive diagnoses that can be treated outside of a hospital, often used as an indicator the quality of primary care
• Excludes discharges with surgical codes to ensure that the admission was for a medical condition
Ambulatory care sensitive IP admissions

14
Key utilization metrics by chronic medical condition status1– Inpatient admissions
CY2014 IP admits/ 1,000 (#)
IP ALOS (days)
30-day readmis-sion rate (%)
Ambulatory care sensitive admits/ 1,000 (#)
Avg=136
Two or more chronic medical conditions
430
One chronic medical condition
174
No chronic medical conditions
95
Avg=5.0
6.3
5.3
4.3
Avg=14%
22%
15%
10%
Avg=11
16
81
2
• On average, one in 12 admissions are for ambulatory care sensitive conditions
• Close to 20% of the IP admissions for members with two or more chronic conditions are for ambulatory care sensitive conditions
ADJUSTED TOTAL

15
Key utilization metrics by chronic medical condition status1– ER admissions by type
CY2014 ER visits/1,000 (#)
Avoidable ER visits (%)
ER cost/visit ($)
Avoidable ER visits/1,000 (#)
On average, one in 5 ER visits were for potentially avoidable conditions
ADJUSTED TOTAL
2,186
Avg=904
Two or more chronic medical conditions
No chronic medical conditions
1,494
655
One chronic medical condition
Avg=166
131
268
319 15%
20%
Avg=18%
18% 413
354
540
Avg=$407

16
Key utilization metrics by chronic medical condition status1 – Pharmacy costs
CY2014 Scripts/1,000 (#)
Rx spend (%)
Rx spend PMPM ($)
Generic dispensing ratio (%)
ADJUSTED TOTAL
Avg=10,765
Two or more chronic medical conditions
43,849
One chronic medical condition
17,688
No chronic medical conditions
5,734
Avg=79%
82%
77%
78%
38%
22%
40%
Avg=$63
106
262
32

17
BH condition prevalence in overall behavioral health population vs. patients who have 3 or more BH co-morbidities1
Percentage of relevant population with condition (duplicated members)
Homicidal ideation 1%
Trauma 1%
Personality 2%
Attempted suicide2 4%
Psychosis 4%
Schizophrenia 4%
Other/Unspecified 4%
ODD 5%
PTSD 6%
Conduct disorder 7%
Other mood disorders 10%
Sleep disorders 10%
Adjustment reaction 11%
Bipolar 12%
ADHD 27%
Anxiety 31%
Major depression 13%
Other depression 26%
Substance use 36%
2%
3%
5%
11%
10%
8%
10%
9%
14%
11%
21%
21%
14%
28%
25%
59%
27%
52%
61%
Individuals with 3 or more BH co-morbidities Overall BH population
68%
89%
-5%
132%
26%
106%
113%
54%
140%
77%
126%
93%
158%
208%
188%
193%
217%
Percent difference in prevalence
Total patients 250,158 78,657
97%
114%

18
Percentage of members by their visits with each provider type for an outpatient BH treatment1
BH specialty
Psych hospital
3%
Medical specialty group/clinic
3%
6%
9%
Mental health clinic3 11%
Other 15%
Primary care 29%
CMHC2 37%
Long-term care 0%
BH residential facility 1%
Surgical specialty group/clinic 1%
ER 1%
FQHC 2%
Community/supportive care 3%
Hospital
Percent of overall BH population (duplicated members)
2%
1%
0%
2%
2%
4%
10%
16%
10%
9%
29%
34%
21%
70%
Total members =250K Total members =13K
XX 7+ visits
Average number of BH OP visits per member per year Top 5% by BH cost
Average number of BH OP visits per member per year
30.7
2.7
4.0
39.0
4.7
12.7
8.1
3.1
11.7
4.0
2.2
1.3
17.1
19.2
11.1
2.5
2.4
12.5
3.3
6.5
7.0
2.2
6.9
2.8
1.9
1.2
13.7
13.1
Overall BH population
19
Update on Primary Care Transformation
Update on Long Term Services and Supports (LTSS)

20
▫ Acuity- and quality-based payments for LTSS (Nursing Facilities and HCBS)
▫ Value-based purchasing for Enhanced Respiratory Care (ERC) services in a Nursing Facility
▫ Workforce development

21
▫ 18 community forums in 9 cities and an on-line survey
▫ Gathered member and family input on quality from member’s perspective (the member’s experience of care)
▫ More than 1200 participants, 1750 responses objectively evaluated and analyzed using acceptable statistical methods
▫ Survey of federal & state landscape
▫ Literature review
▫ Key informant interviews with other states
▫ Technical Assistance Report by Lipscomb University’s School of TransformAging available at: http://www.lipscomb.edu/transformaging/tareport
▫ Facilitation of ongoing stakeholder processes to develop and implement Quality Framework and payment approach

22
• Threshold Measures ▫ Minimum standards to participate in QuILTSS
• Quality Measures ▫ Satisfaction 35 points
– Member (15 points)
– Family (10 points)
– Staff (10 points)
▫ Culture Change/Quality of Life 30 Points
– Respectful treatment, member choice, member/family input,
meaningful activities
▫ Staffing/Staff Competency 25 Points
– Staffing ratios, retention, consistent assignment, initial and
ongoing staff training
▫ Clinical Performance 10 Points
– Health related measures, prevention and early detection,
ongoing functional assessment
▫ Bonus Points for significant quality improvement initiatives

23
▫ Implemented first with NFs ▫ Acuity determined by RUG scores from MDS ▫ Quality based on NF performance on specified quality
measures – Phase 1 (bridge) quarterly adjustments to per diem rates—
largely focused on quality improvement activities (i.e., process measures)
– Phase 2 (full model) component of prospective per diem based on quality performance compared against benchmarks
▫ Utilizing interim web-based submission tool and process ▫ 5 quarterly submissions completed; NFs receive a summary
score sheet with explanation of point awards ▫ Reconsideration committee of external stakeholders ▫ MCOs have distributed over $18 million in payments for
quality-based rate adjustments for the first 4 submissions

24
46
61 65 69 72
0
10
20
30
40
50
60
70
80
90
100
#1 #2 #3 #4 #5

25
0
20
40
60
80
100
120
140
160
#1 #2 #3 #4 #5
0-25
26-50
51-75
76-110

26
0%
10%
20%
30%
40%
50%
60%
70%
80%
90%
100%
#1 #2 #3 #4 #5
Resident Satisfaction
Survey
Took Action based on
Resident Survey
Family Satisfaction
Survey
Took Action based on
Family Survey
Staff Satisfaction
Survey
Took Action based on
Staff Survey

27
0%
10%
20%
30%
40%
50%
60%
70%
80%
90%
100%
#1 #2 #3 #4 #5
CC/PCP Assessment
Took action based on
CC/PCP Assessment

28
TN 5 Star rating is improving October 2013, average=2.9
February 2015, average=3.2
14%
19%
18% 24%
24%
2%
20%
19%
20%
22%
17%
2%
1 Star
2 Star
3 Star
4 Star
5 Star
Too New

29
• Next Step for NFs:
▫ Working with stakeholders to finalize measures and approach for implementation of full VBP model in 2016
▫ Bridge data collection and payment processes will continue pending implementation of full model

30
• Next Step for CHOICES HCBS:
▫ Stakeholder processes continue and will be expanded
▫ Focus on personal assistance and residential services
▫ Utilize the QuILTSS framework, with adjustments as appropriate
▫ Person-Centered Plan is key to driving the member experience
– Goals and preferences
– Employment and community integration
▫ Leverage technology
– Point-of-service satisfaction survey in EVV 10/1

31
• Next Steps for HCBS for Individuals with I/DD:
o New Behavioral Health Crisis Prevention, Intervention and Stabilization services to be implemented this year
– Delivered under managed care program, in collaboration with I/DD agency
– Focus on crisis prevention and in-home stabilization, sustained community living, reduced inpatient utilization
– Performance measures (e.g., decrease in PRN use of anti-psychotics, decrease in crisis events, increase in in-place stabilization when crises occur, and decrease in inpatient psychiatric admissions and inpatient days) will be tracked and utilized to establish a VBP component (incentive or shared savings) for the reimbursement structure

32
• Next Steps for HCBS for Individuals with I/DD:
o Section 1915(c) waivers
– Developing acuity-based reimbursement approach for residential and day services, using the Supports Intensity Scale
– Plan to develop a “QuILTSS-like” quality component of reimbursement as well

33
• Next Steps for HCBS for Individuals with I/DD:
o Employment and Community First (ECF) CHOICES – MLTSS program to be implemented in 2016
– Promotes integrated employment and community living as the first and preferred outcome for individuals with I/DD
– Employment benefits designed in consultation with experts from the federal Office of Disability Employment Policy create a pathway to employment, even for people with severe disabilities, with outcome or value-based reimbursement approaches
Outcome-based reimbursement for certain employment services
Reimbursement approach for other services will take into account provider’s performance on key outcomes, including number of persons employed in integrated settings and # of hours of employment (after a reasonable period for data collection and benchmarking)

34
• Enhanced per diem rates for nursing facility services for individuals requiring Chronic Ventilator Care, Frequent Tracheal Suctioning and Ventilator Weaning
• VBP initiative developed in response to significant increases in service utilization but without expected quality and outcomes
• Will implement a revised reimbursement approach for these services as an add-on to the new NF acuity-based per diem based on NF performance on clinical and technology measures
• Combine with strengthened standards of care and education to promote quality and best practices

35
• Key Performance Indicators include:
o Quality Measures
– Ventilator wean rate
– Average length of stay to wean
– Infection rate
– Unplanned hospitalizations
– Decannulation rate
– Unanticipated deaths
– Denial rate

36
• Key Performance Indicators include:
o Technology Measures
– Incentive spirometer or any PEP therapy
– High frequency chest wall oscillation or IPV
– Non-invasive open ventilation
– Heated wire circuits
– Alarm paging or beeping system
– High flow molecular humidifcation
– Cough assist
– Non-invasive ventilation (volume)

37
Initial data collection tool/process implemented
4 months of quality data in hand across funding sources (not just Medicaid)
Additional months of data being held by NFs
Working with a vendor to develop new submission process for the collected data and feedback to NFs and MCOs
At least 6 months of analyzed data will allow setting of specific benchmarks and development of payment approach
Must be implemented along with new NF reimbursement methodology (as add-on to facility per diem)

38
• Stakeholder input highlighted critical importance of training and competency of professionals delivering HCBS and NF services
• Develop a comprehensive workforce training program and credentialing registry for individuals paid to deliver LTSS for deployment through secondary, vo-tech, trade schools, community colleges, and 4-year institutions, offering college credit, stackable credentials
• Staff training will be an important quality measure and will also impact a provider’s success across other measures
• Agencies employing better trained and qualified staff will be compensated for the higher quality of care experienced by individuals they serve