proton therapy vs imrt
TRANSCRIPT
Proton Therapy vs. IMRT
Carlos Vargas, MD
Boca Radiation Oncology Associates
Disclosures
ProCure Clinical advisory board. I was faculty at UF and the experience here
presented is the current standard at UFPTI We are trying to bring proton therapy to
South Florida.
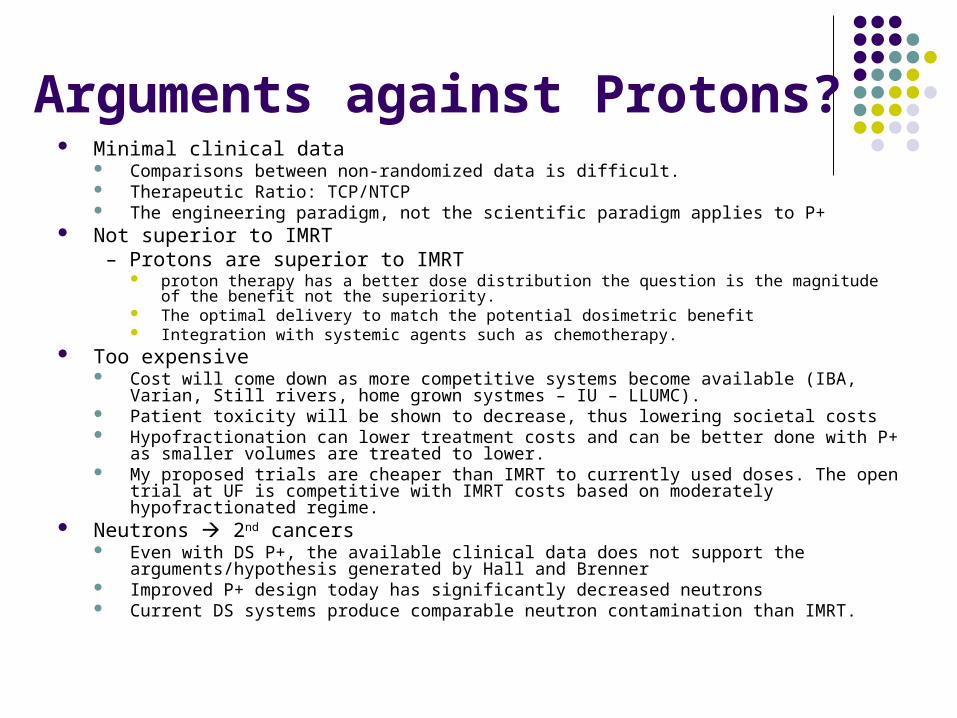
Arguments against Protons? Minimal clinical data
Comparisons between non-randomized data is difficult. Therapeutic Ratio: TCP/NTCP The engineering paradigm, not the scientific paradigm applies to P+
Not superior to IMRT – Protons are superior to IMRT
proton therapy has a better dose distribution the question is the magnitude of the benefit not the superiority.
The optimal delivery to match the potential dosimetric benefit Integration with systemic agents such as chemotherapy.
Too expensive Cost will come down as more competitive systems become available (IBA, Varian, Still rivers, home
grown systmes – IU – LLUMC). Patient toxicity will be shown to decrease, thus lowering societal costs Hypofractionation can lower treatment costs and can be better done with P+ as smaller volumes are
treated to lower. My proposed trials are cheaper than IMRT to currently used doses. The open trial at UF is
competitive with IMRT costs based on moderately hypofractionated regime. Neutrons 2nd cancers
Even with DS P+, the available clinical data does not support the arguments/hypothesis generated by Hall and Brenner
Improved P+ design today has significantly decreased neutrons Current DS systems produce comparable neutron contamination than IMRT.
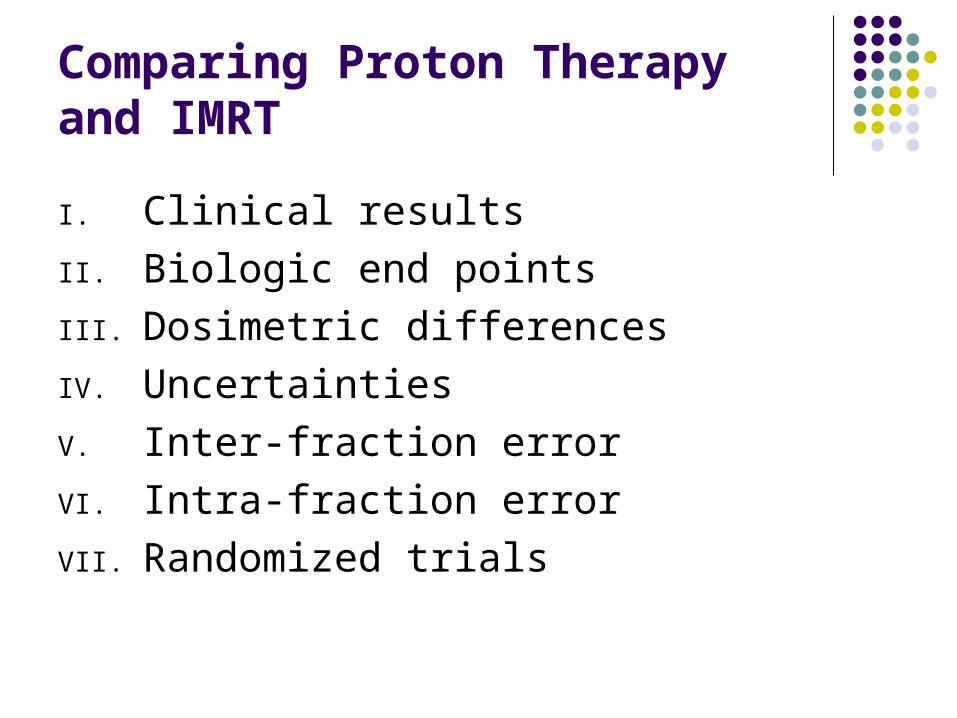
Comparing Proton Therapy and IMRT
I. Clinical results
II. Biologic end points
III. Dosimetric differences
IV. Uncertainties
V. Inter-fraction error
VI. Intra-fraction error
VII. Randomized trials
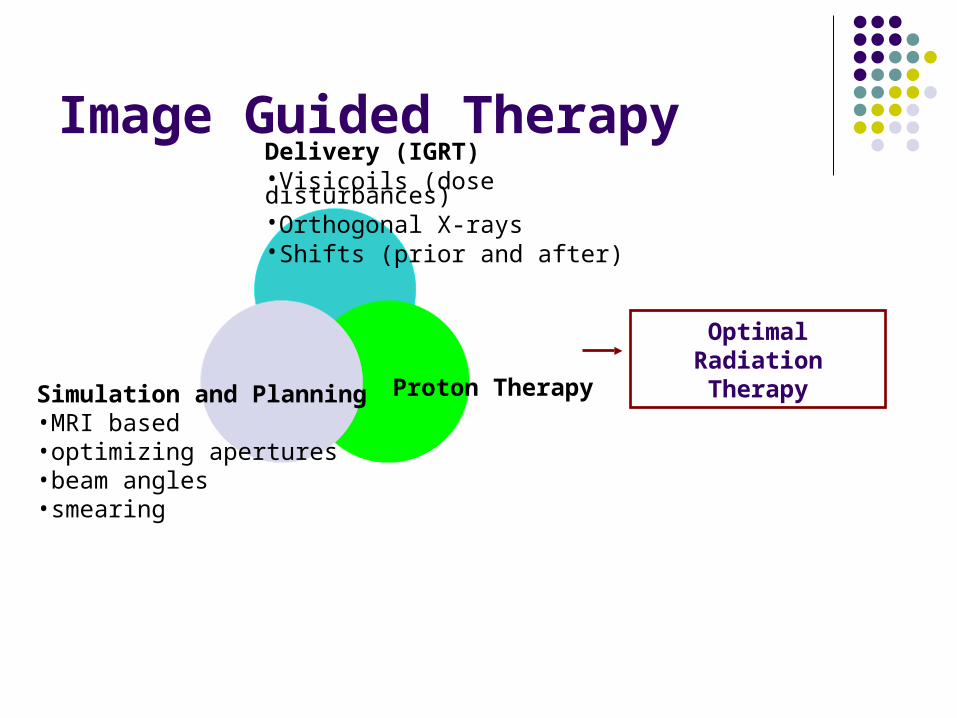
Image Guided Therapy
Simulation and Planning•MRI based •optimizing apertures •beam angles•smearing
Proton Therapy
Optimal Radiation Therapy
Delivery (IGRT)•Visicoils (dose disturbances)•Orthogonal X-rays•Shifts (prior and after)
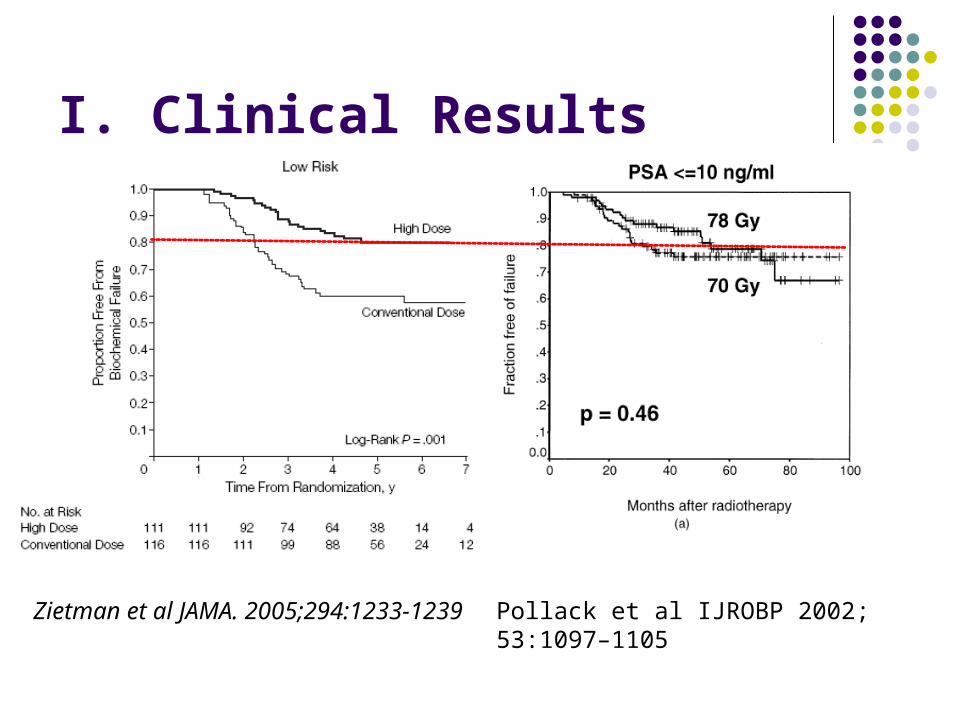
I. Clinical Results
Zietman et al JAMA. 2005;294:1233-1239 Pollack et al IJROBP 2002; 53:1097–1105
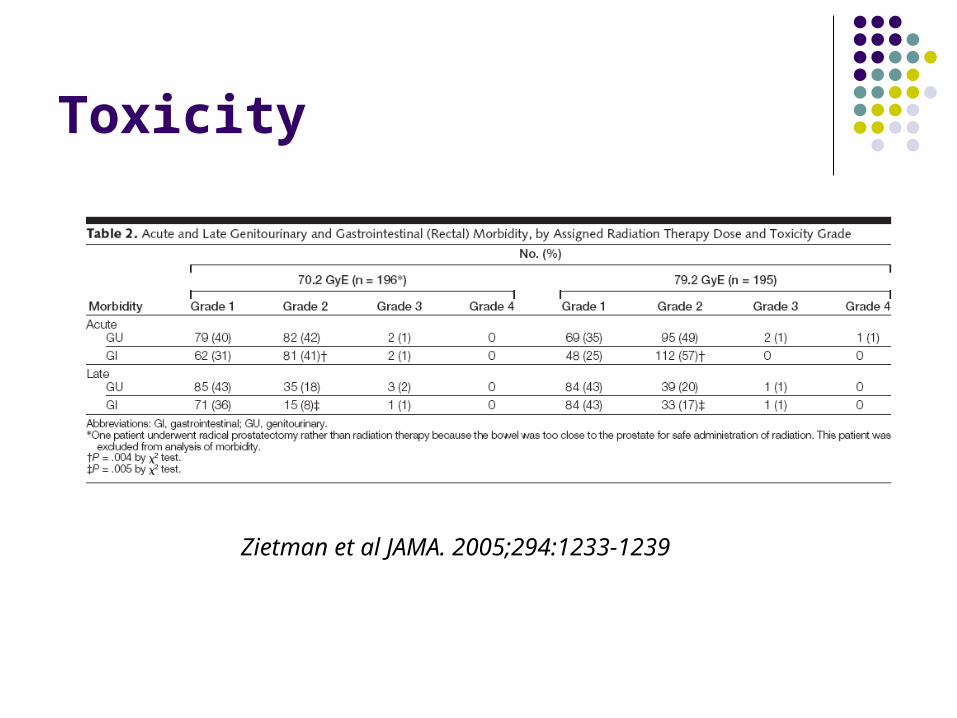
Toxicity
Zietman et al JAMA. 2005;294:1233-1239
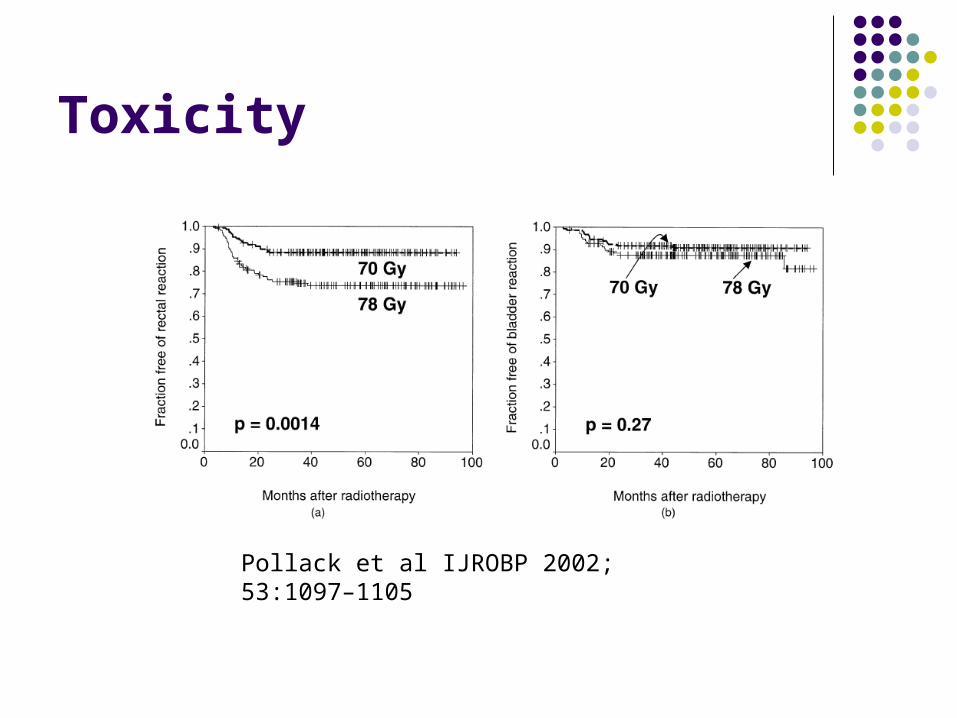
Toxicity
Pollack et al IJROBP 2002; 53:1097–1105
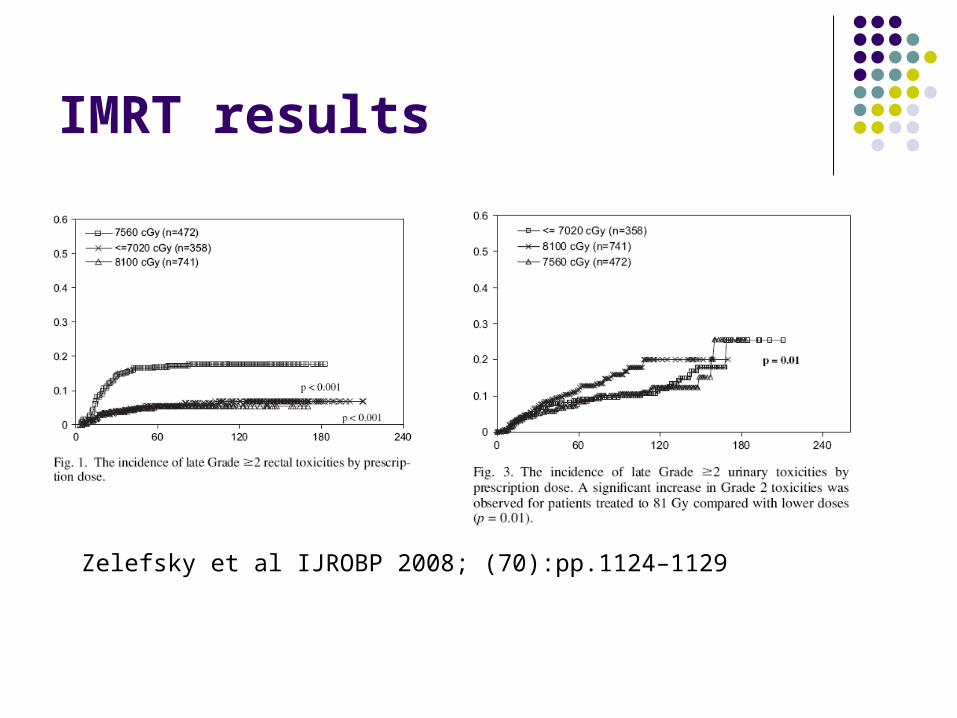
IMRT results
Zelefsky et al IJROBP 2008; (70):pp.1124–1129
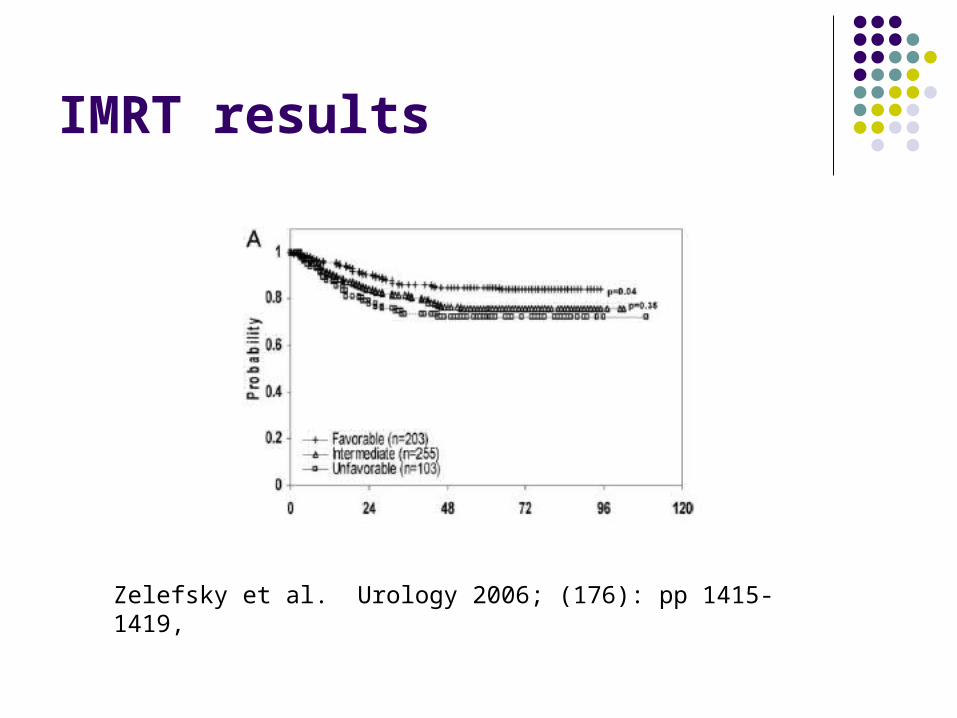
IMRT results
Zelefsky et al. Urology 2006; (176): pp 1415-1419,
IMRT Results
5-year chronic ≥2 toxicity was 5% GI and 20 GU.
5-year BFS 85%. Single institution experience and results
across the country are likely to be higher.
Zelefsky et al. Urology 2006; (176): pp 1415-1419,
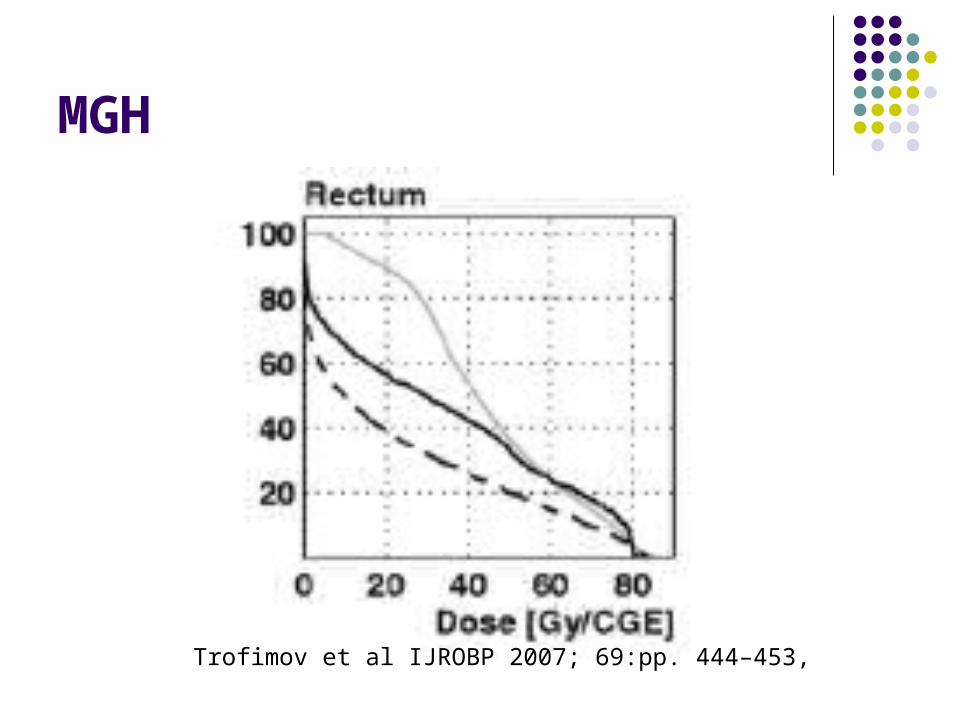
MGH
Trofimov et al IJROBP 2007; 69:pp. 444–453,
II. Biology
Proton therapy has a low LET and the RBE has been found to be similar to photon therapy.
Higher LET and RBE are seen at the distal part of the SOBP
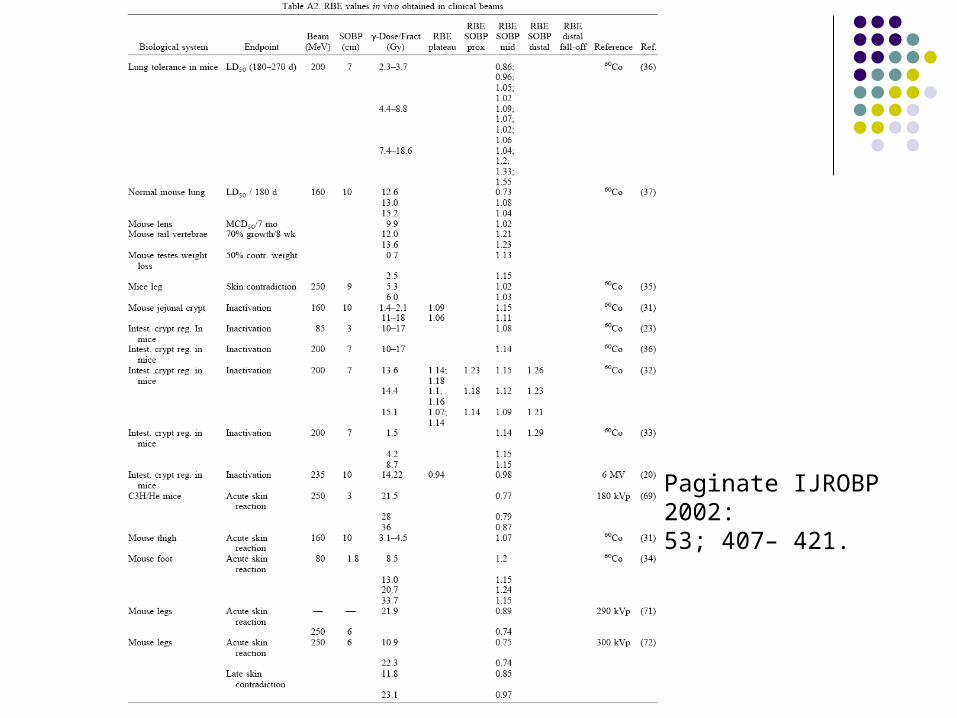
Paginate IJROBP 2002: 53; 407– 421.
RBE differences
RBE differences can be potentially exploited or beam modulation to match RBE differences.
Single beam treatments stopping close to a normal structure may not be preferred.
Relatively, of no clinical significance for prostate cancer therapy due to the currently used beam arrangements.
Second malignancies
“Intensity-modulated radiation therapy may double the incidence of solid cancers in long-term survivors”
“An alternative strategy is to replace X-rays with protons. However, this change is only an advantage if the proton machine employs a pencil scanning beam”
Hall et al. IJROBP 2006; 65: 1-7.
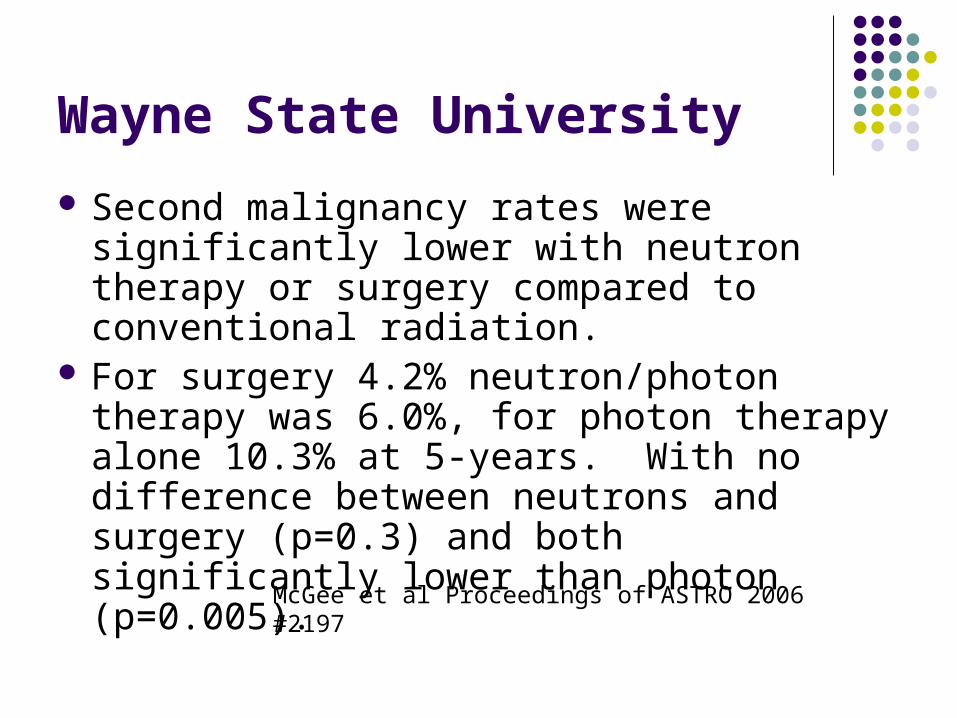
Wayne State University
Second malignancy rates were significantly lower with neutron therapy or surgery compared to conventional radiation.
For surgery 4.2% neutron/photon therapy was 6.0%, for photon therapy alone 10.3% at 5-years. With no difference between neutrons and surgery (p=0.3) and both significantly lower than photon (p=0.005).
McGee et al Proceedings of ASTRO 2006 #2197
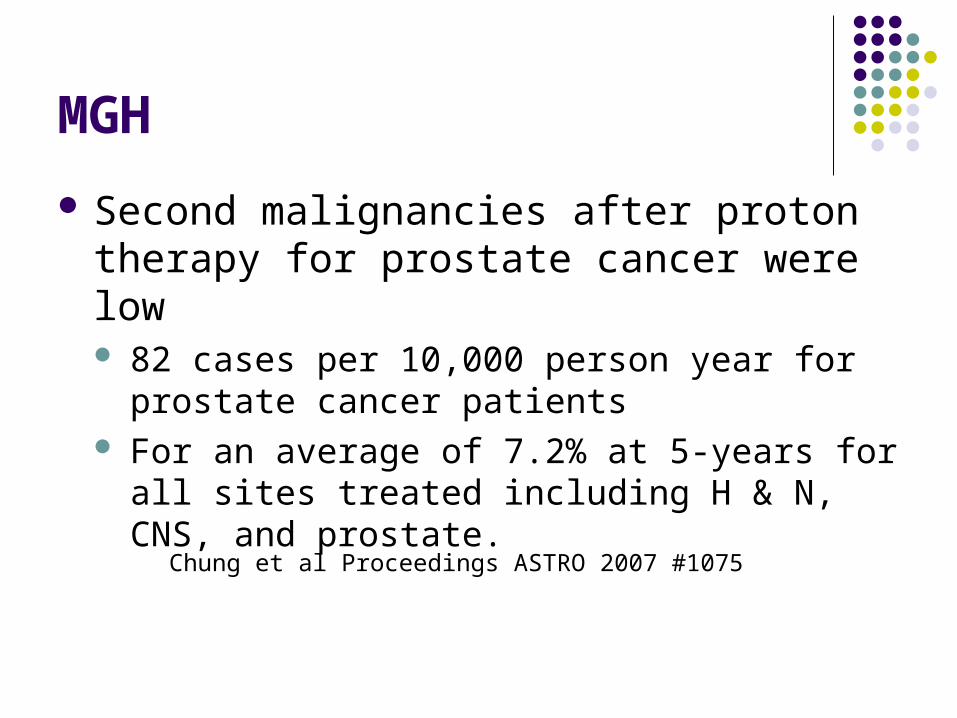
MGH
Second malignancies after proton therapy for prostate cancer were low 82 cases per 10,000 person year for prostate
cancer patients For an average of 7.2% at 5-years for all sites
treated including H & N, CNS, and prostate.
Chung et al Proceedings ASTRO 2007 #1075
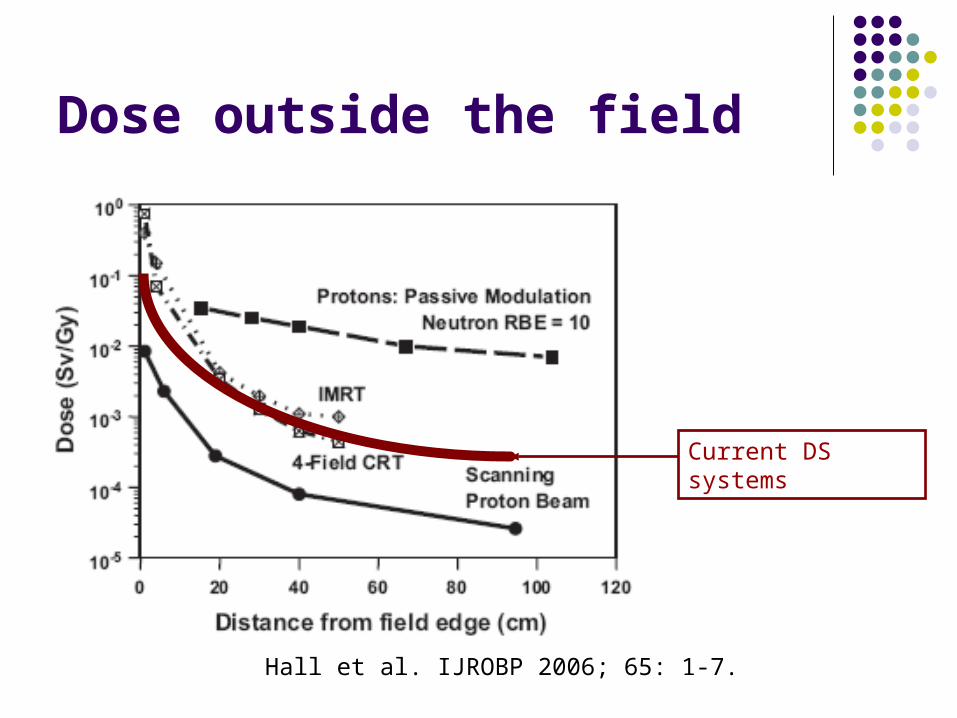
Dose outside the field
Current DS systems
Hall et al. IJROBP 2006; 65: 1-7.
Summary
Lower neutron doses are possible with scanned beam proton therapy compared to IMRT
The higher RBE area can be placed safely away from normal dose limiting structures for prostate proton therapy.
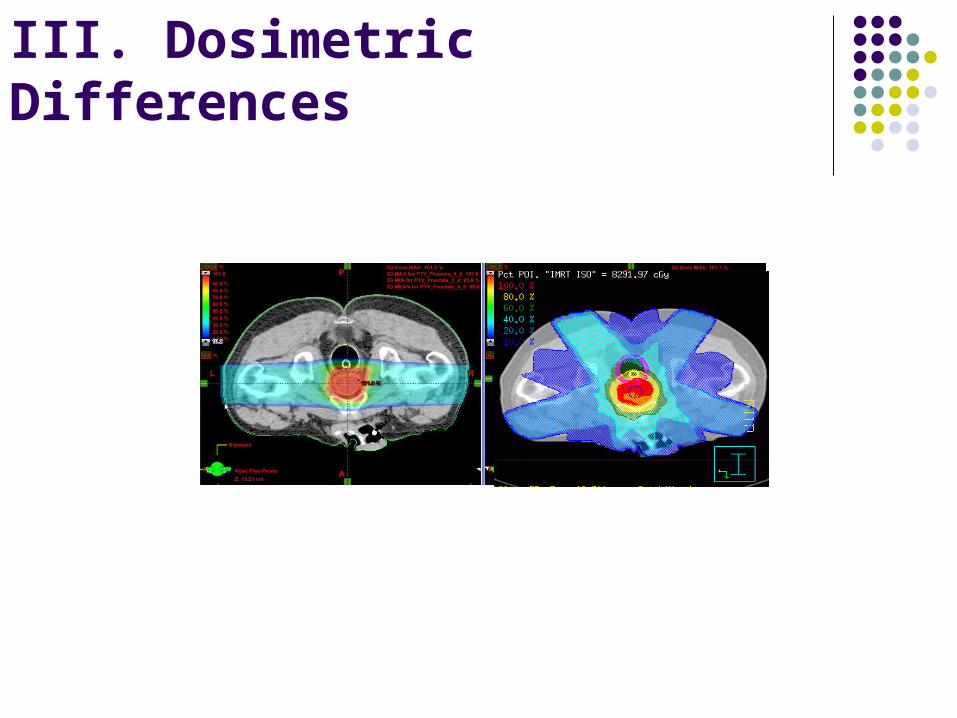
III. Dosimetric Differences
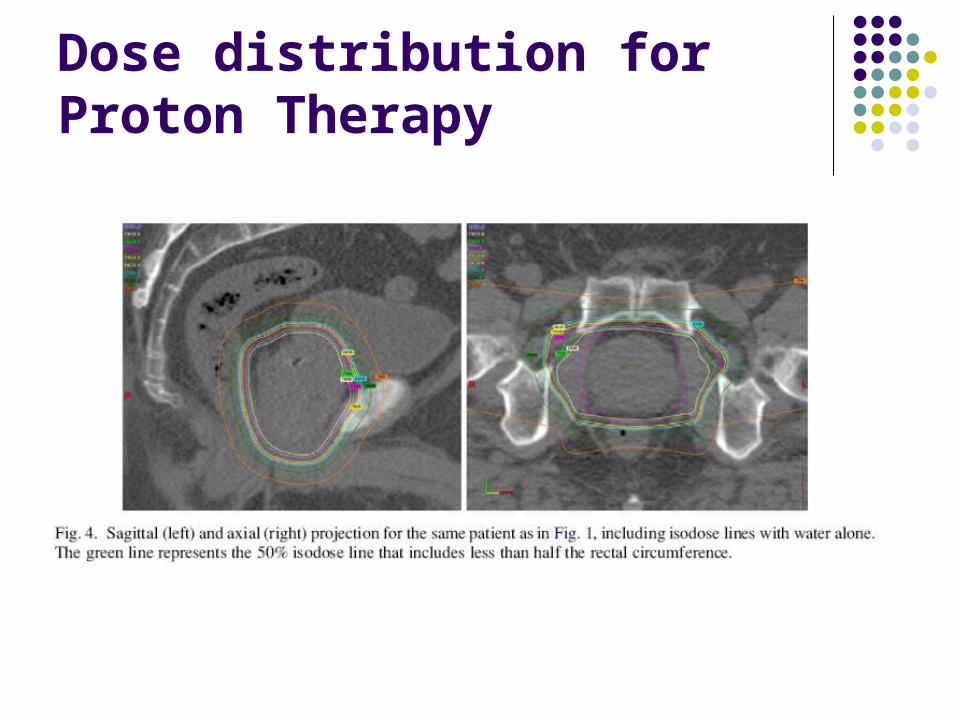
Dose distribution for Proton Therapy
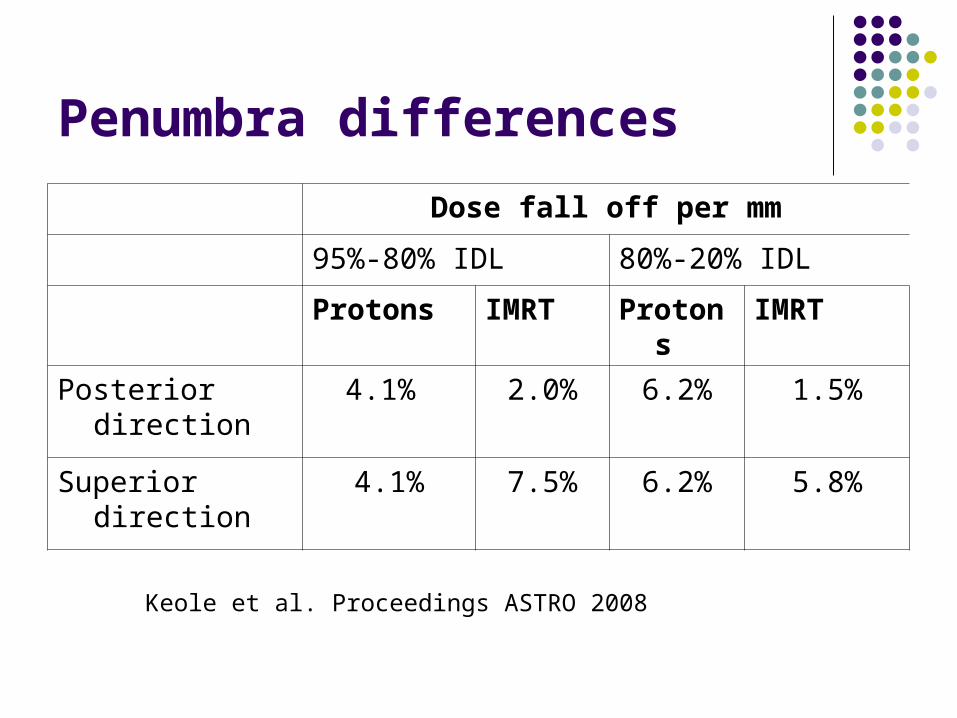
Penumbra differences
Keole et al. Proceedings ASTRO 2008
Dose fall off per mm
95%-80% IDL 80%-20% IDL
Protons IMRT Protons IMRT
Posterior direction 4.1% 2.0% 6.2% 1.5%
Superior direction 4.1% 7.5% 6.2% 5.8%
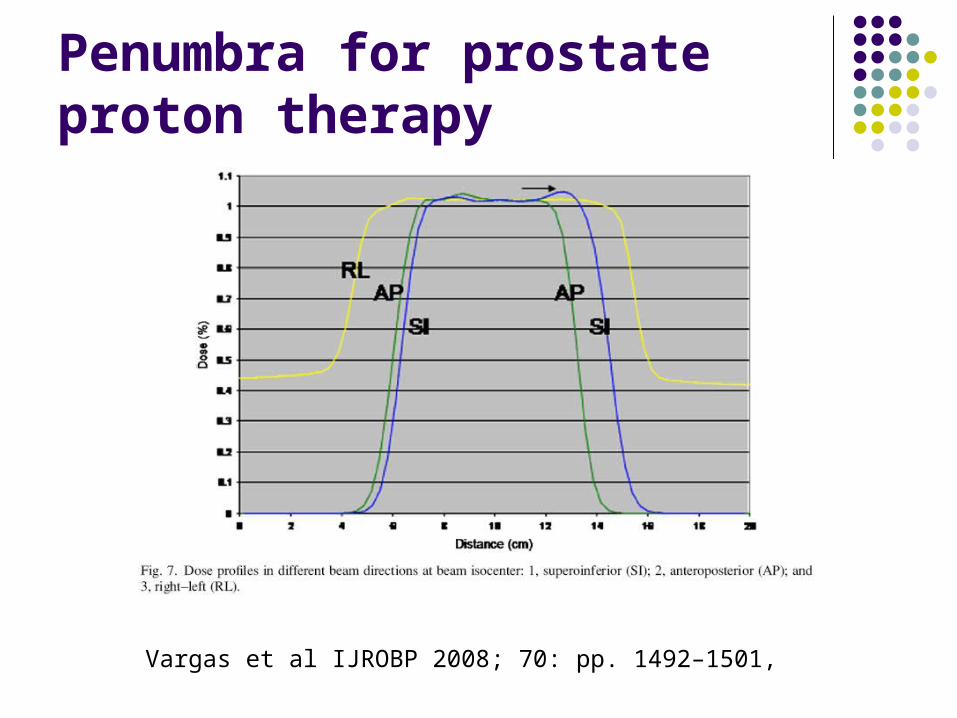
Penumbra for prostate proton therapy
Vargas et al IJROBP 2008; 70: pp. 1492–1501,
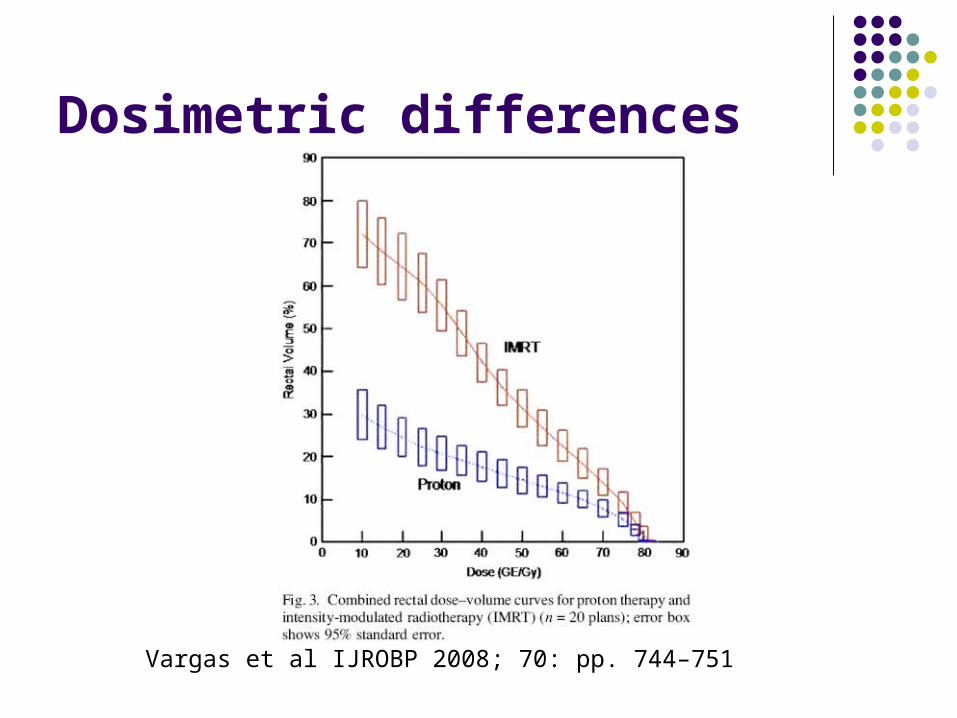
Dosimetric differences
Vargas et al IJROBP 2008; 70: pp. 744–751
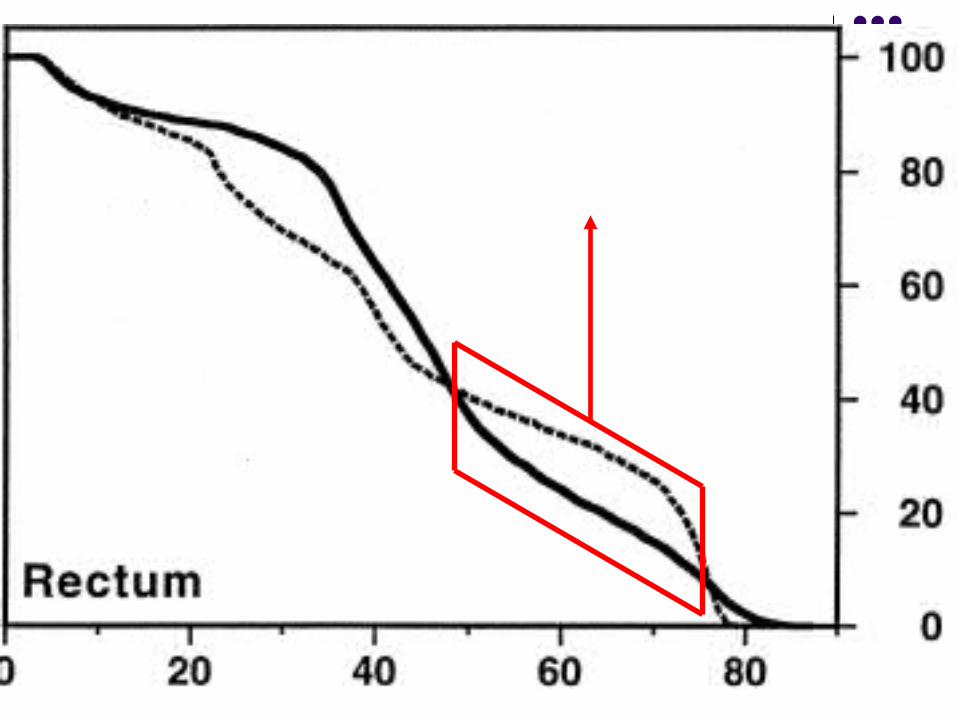
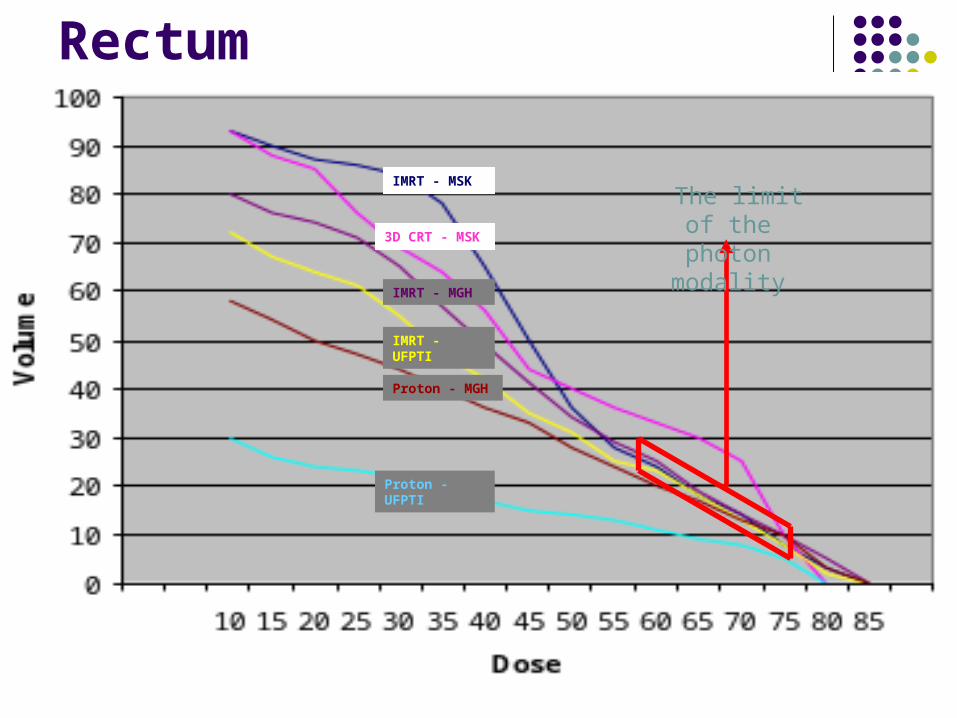
Rectum
IMRT - MSK
3D CRT - MSK
IMRT - UFPTI
Proton - UFPTI
The limit of the photon modality
IMRT - MGH
Proton - MGH
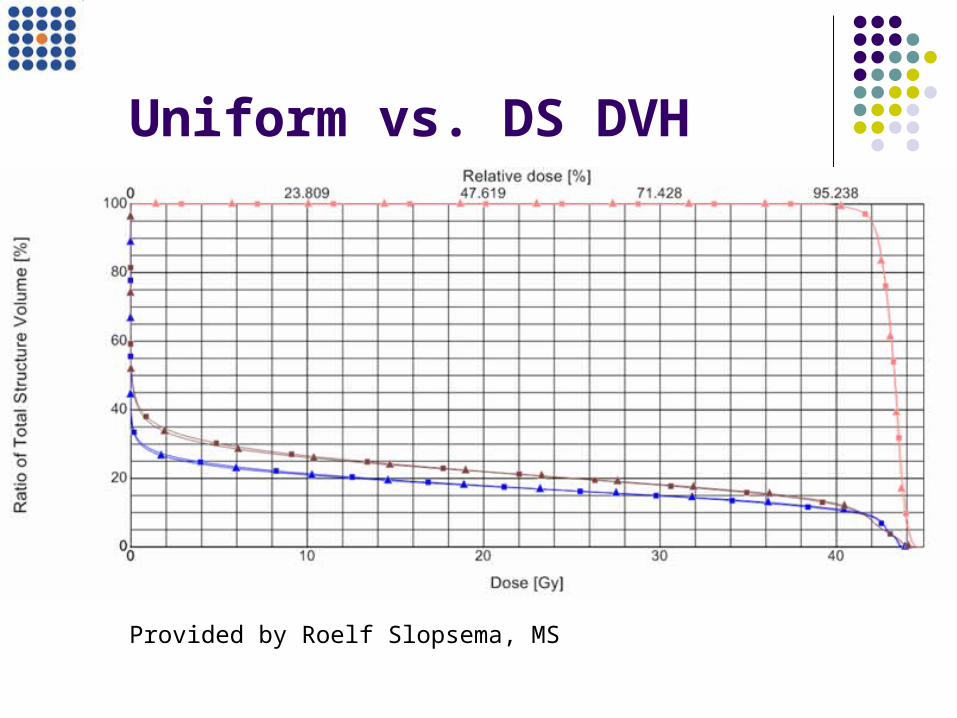
Uniform vs. DS DVH
Provided by Roelf Slopsema, MS
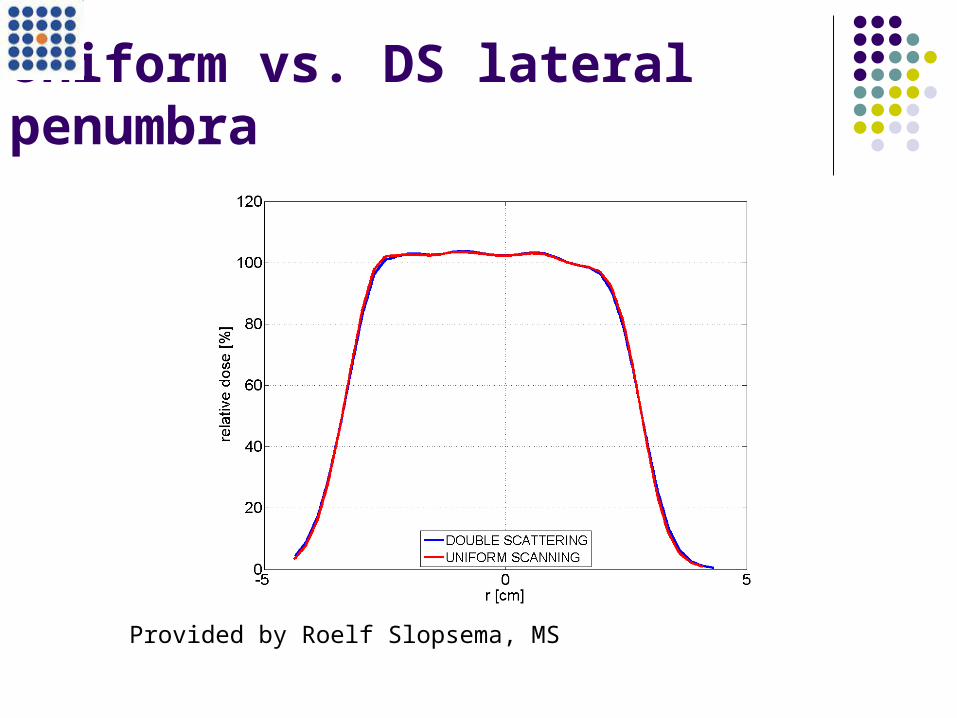
Uniform vs. DS lateral penumbra
Provided by Roelf Slopsema, MS
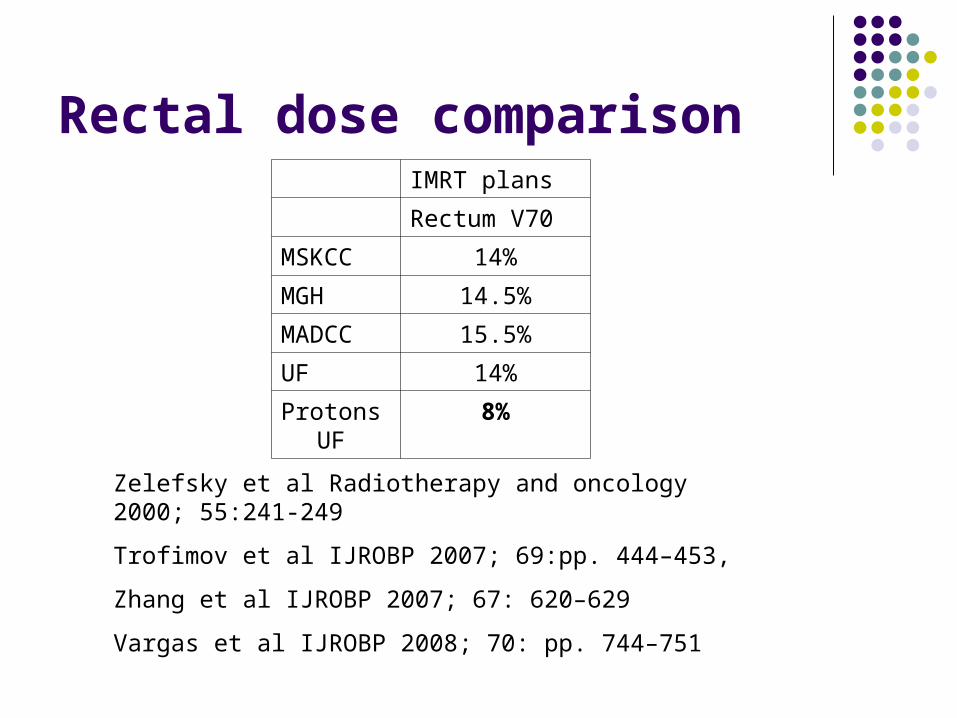
Rectal dose comparisonIMRT plans
Rectum V70
MSKCC 14%
MGH 14.5%
MADCC 15.5%
UF 14%
Protons UF 8%
Zelefsky et al Radiotherapy and oncology 2000; 55:241-249
Trofimov et al IJROBP 2007; 69:pp. 444–453,
Zhang et al IJROBP 2007; 67: 620–629
Vargas et al IJROBP 2008; 70: pp. 744–751
Uncertainties Two different sources of uncertainties: planning and
delivery. For proton therapy dose depth deposition
uncertainty is predictable and appropriate angle selection will determine the direction of the uncertainty.
IMRT has also uncertainty. However, no DVH plan reflects this uncertainty.
Jin et al Med Phys. 2005; 6:1747-56
IV. Uncertainties
Planning: for proton therapy we should account for the depth dose uncertainty and biologic effectiveness for IMRT the spatial and non-spatial disagreement between plan and delivery.
Proton Uncertainties
Uncertainty for prostate proton therapy treatments has been quantified at UFPTI
Our prostate uncertainty is 5-8mm in the direction of the beam and is corrected at planning.
Uncertainties
IMRT uncertainties in the low and high dose area should be corrected. However, this is not currently done.
“minimization of overall uncertainty during the treatment planning process will improve the quality of IMRT” Jin et al Med Phys 2008; 35: 983
Uncertainties
The remainder uncertainties are related mostly to patient positioning, inter-fraction and intra-fraction error.
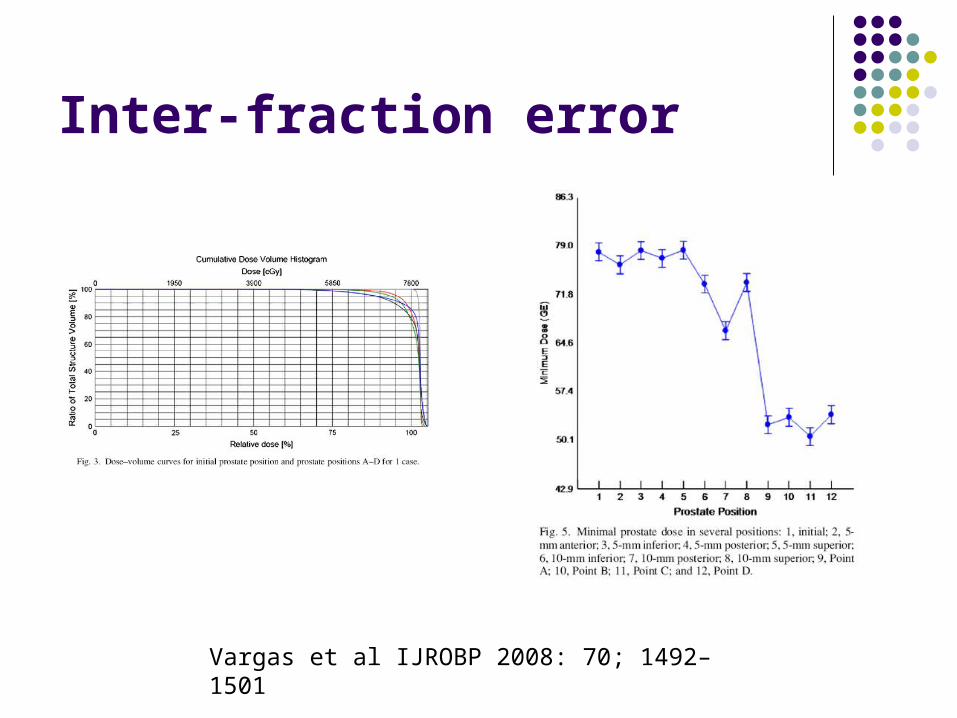
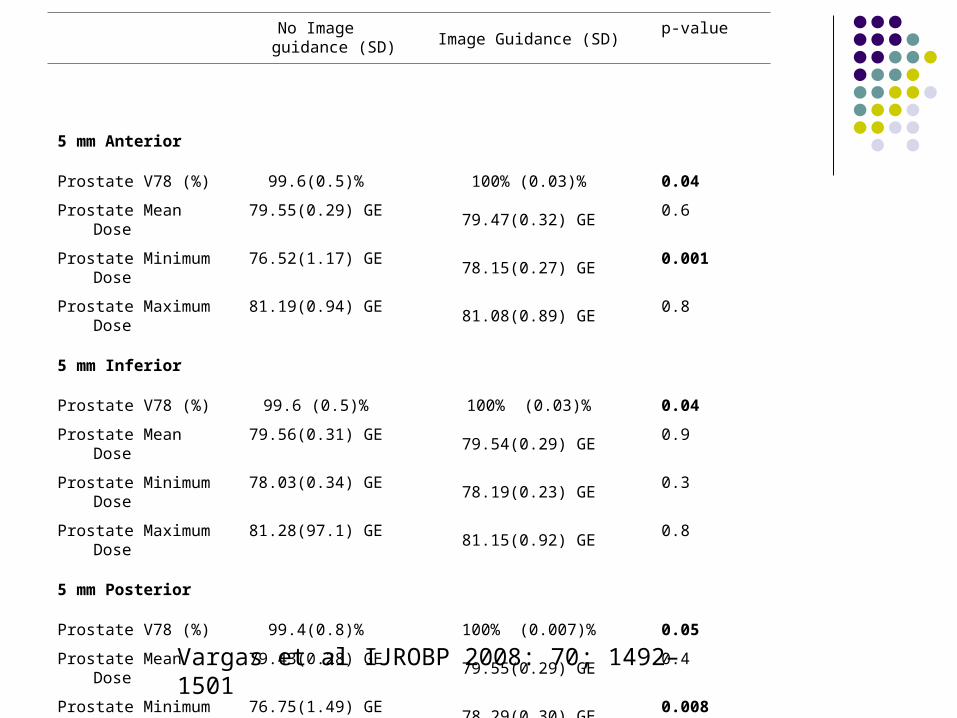
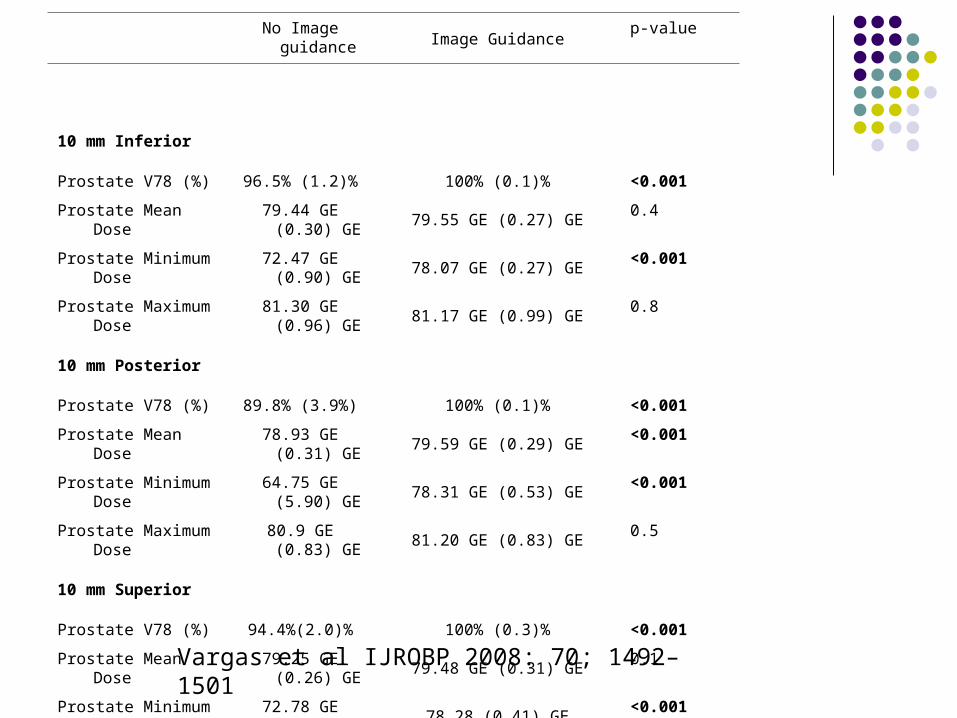
Inter-fraction error
Vargas et al IJROBP 2008: 70; 1492–1501
No Image guidance (SD)Image Guidance (SD)
p-value
5 mm Anterior
Prostate V78 (%) 99.6(0.5)% 100% (0.03)% 0.04
Prostate Mean Dose 79.55(0.29) GE 79.47(0.32) GE 0.6
Prostate Minimum Dose 76.52(1.17) GE 78.15(0.27) GE 0.001
Prostate Maximum Dose 81.19(0.94) GE 81.08(0.89) GE 0.8
5 mm Inferior
Prostate V78 (%) 99.6 (0.5)% 100% (0.03)% 0.04
Prostate Mean Dose 79.56(0.31) GE 79.54(0.29) GE 0.9
Prostate Minimum Dose 78.03(0.34) GE 78.19(0.23) GE 0.3
Prostate Maximum Dose 81.28(97.1) GE 81.15(0.92) GE 0.8
5 mm Posterior
Prostate V78 (%) 99.4(0.8)% 100% (0.007)% 0.05
Prostate Mean Dose 79.43(0.28) GE 79.55(0.29) GE 0.4
Prostate Minimum Dose 76.75(1.49) GE 78.29(0.30) GE 0.008
Prostate Maximum Dose 81.16(96.6) GE 81.29(1.02) GE 0.8
Vargas et al IJROBP 2008: 70; 1492–1501
No Image guidanceImage Guidance
p-value
10 mm Inferior
Prostate V78 (%) 96.5% (1.2)% 100% (0.1)% <0.001
Prostate Mean Dose 79.44 GE (0.30) GE 79.55 GE (0.27) GE 0.4
Prostate Minimum Dose 72.47 GE (0.90) GE 78.07 GE (0.27) GE <0.001
Prostate Maximum Dose 81.30 GE (0.96) GE 81.17 GE (0.99) GE 0.8
10 mm Posterior
Prostate V78 (%) 89.8% (3.9%) 100% (0.1)% <0.001
Prostate Mean Dose 78.93 GE (0.31) GE 79.59 GE (0.29) GE <0.001
Prostate Minimum Dose 64.75 GE (5.90) GE 78.31 GE (0.53) GE <0.001
Prostate Maximum Dose 80.9 GE (0.83) GE 81.20 GE (0.83) GE 0.5
10 mm Superior
Prostate V78 (%) 94.4%(2.0)% 100% (0.3)% <0.001
Prostate Mean Dose 79.25 GE (0.26) GE 79.48 GE (0.31) GE 0.1
Prostate Minimum Dose 72.78 GE (0.70) GE 78.28 (0.41) GE <0.001
Prostate Maximum Dose 81.00 GE (84.3) GE 81.23 GE (0.93) GE 0.6
Vargas et al IJROBP 2008: 70; 1492–1501
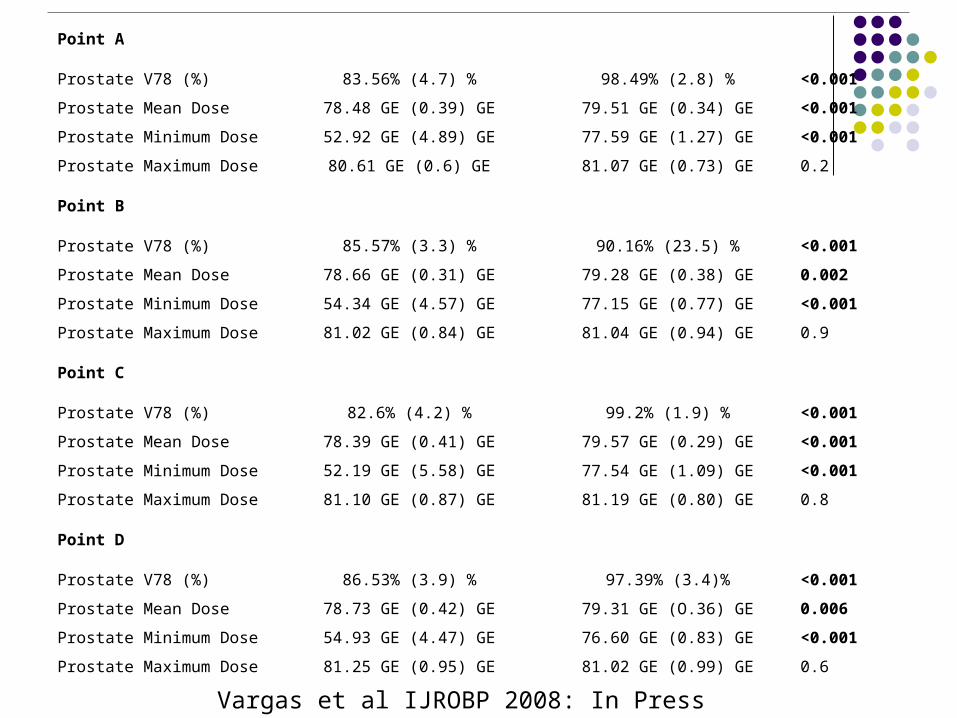
Point A
Prostate V78 (%) 83.56% (4.7) % 98.49% (2.8) % <0.001
Prostate Mean Dose 78.48 GE (0.39) GE 79.51 GE (0.34) GE <0.001
Prostate Minimum Dose 52.92 GE (4.89) GE 77.59 GE (1.27) GE <0.001
Prostate Maximum Dose 80.61 GE (0.6) GE 81.07 GE (0.73) GE 0.2
Point B
Prostate V78 (%) 85.57% (3.3) % 90.16% (23.5) % <0.001
Prostate Mean Dose 78.66 GE (0.31) GE 79.28 GE (0.38) GE 0.002
Prostate Minimum Dose 54.34 GE (4.57) GE 77.15 GE (0.77) GE <0.001
Prostate Maximum Dose 81.02 GE (0.84) GE 81.04 GE (0.94) GE 0.9
Point C
Prostate V78 (%) 82.6% (4.2) % 99.2% (1.9) % <0.001
Prostate Mean Dose 78.39 GE (0.41) GE 79.57 GE (0.29) GE <0.001
Prostate Minimum Dose 52.19 GE (5.58) GE 77.54 GE (1.09) GE <0.001
Prostate Maximum Dose 81.10 GE (0.87) GE 81.19 GE (0.80) GE 0.8
Point D
Prostate V78 (%) 86.53% (3.9) % 97.39% (3.4)% <0.001
Prostate Mean Dose 78.73 GE (0.42) GE 79.31 GE (O.36) GE 0.006
Prostate Minimum Dose 54.93 GE (4.47) GE 76.60 GE (0.83) GE <0.001
Prostate Maximum Dose 81.25 GE (0.95) GE 81.02 GE (0.99) GE 0.6
Vargas et al IJROBP 2008: In Press
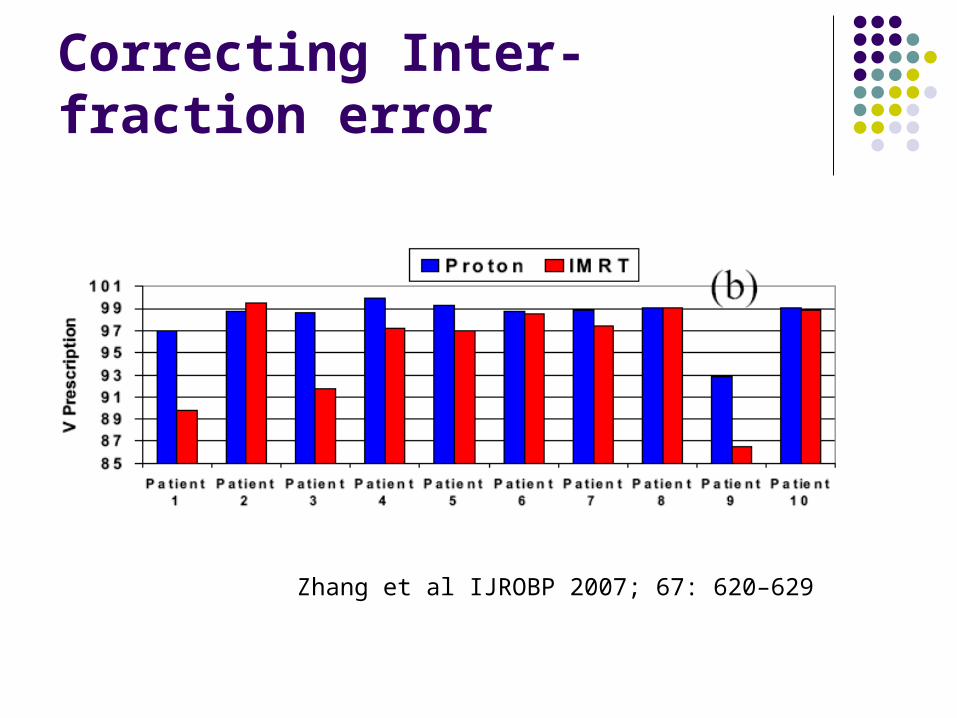
Correcting Inter-fraction error
Zhang et al IJROBP 2007; 67: 620–629
Image Guidance Accuracy
The image guidance system and use will define the residual error for your IGRT system.
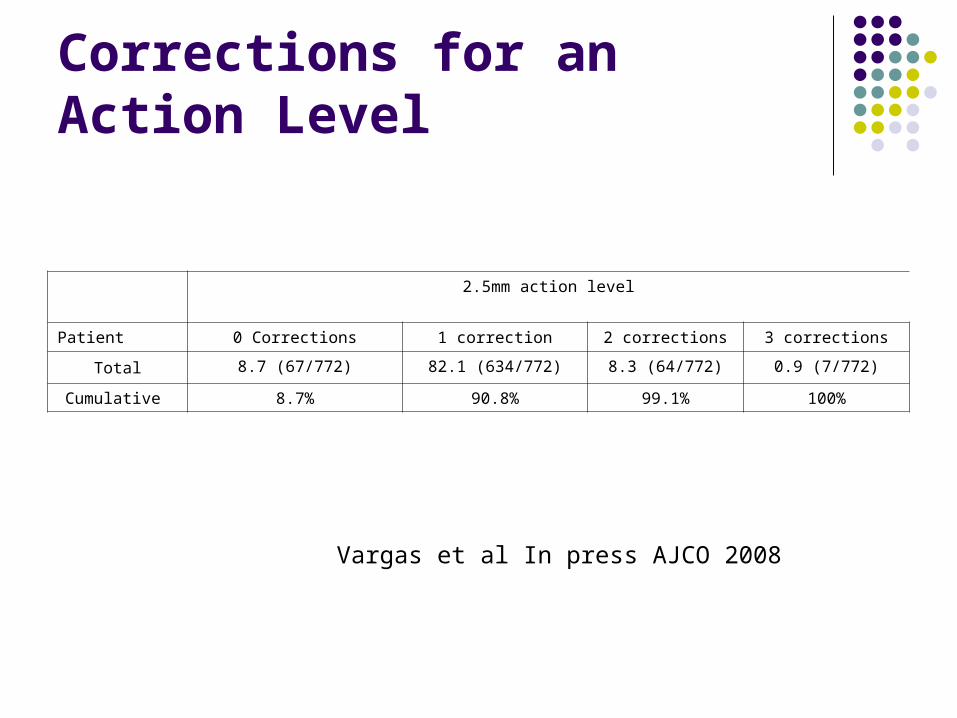
Corrections for an Action Level
2.5mm action level
Patient 0 Corrections 1 correction 2 corrections 3 corrections
Total 8.7 (67/772) 82.1 (634/772) 8.3 (64/772) 0.9 (7/772)
Cumulative 8.7% 90.8% 99.1% 100%
Vargas et al In press AJCO 2008
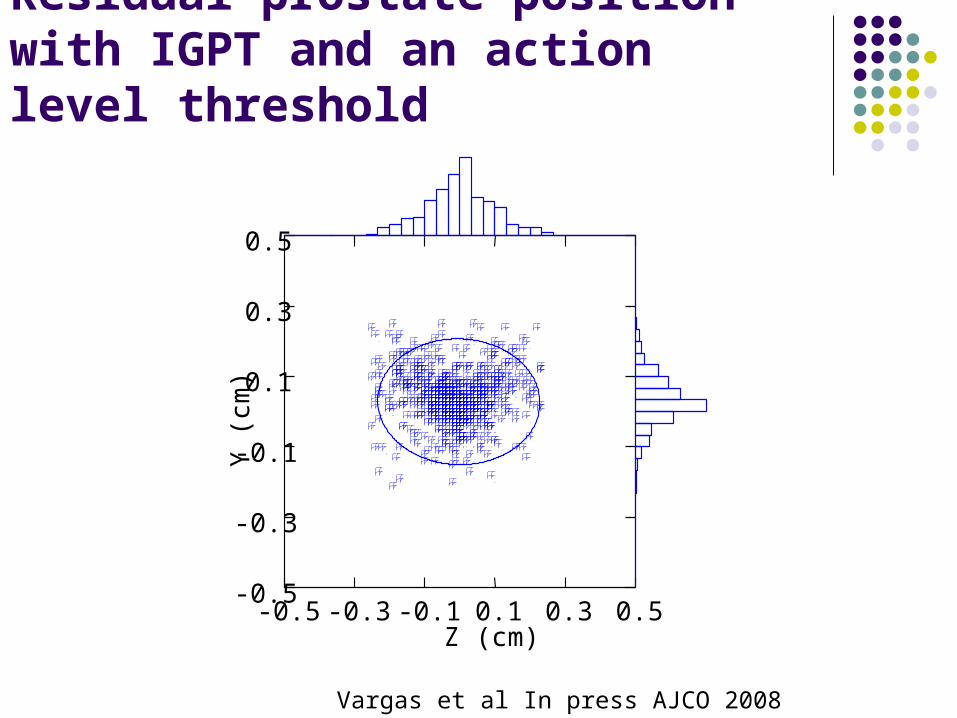
Residual prostate position with IGPT and an action level threshold
-0.5 -0.3 -0.1 0.1 0.3 0.5Z (cm)
-0.5
-0.3
-0.1
0.1
0.3
0.5Y
(cm
)
Vargas et al In press AJCO 2008
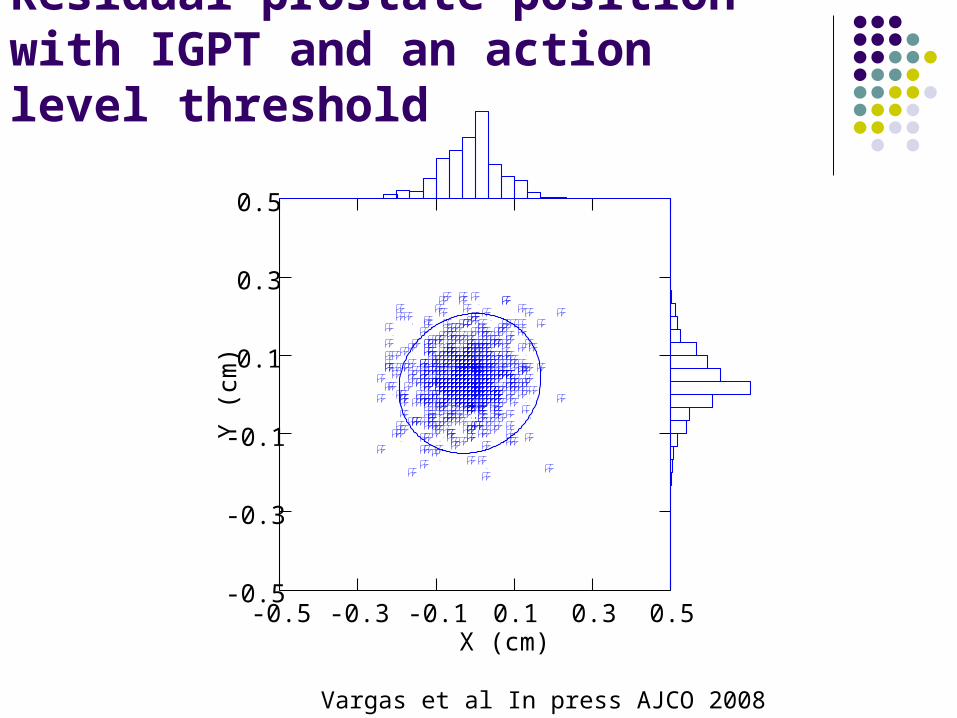
Residual prostate position with IGPT and an action level threshold
-0.5 -0.3 -0.1 0.1 0.3 0.5X (cm)
-0.5
-0.3
-0.1
0.1
0.3
0.5Y
(cm
)
Vargas et al In press AJCO 2008
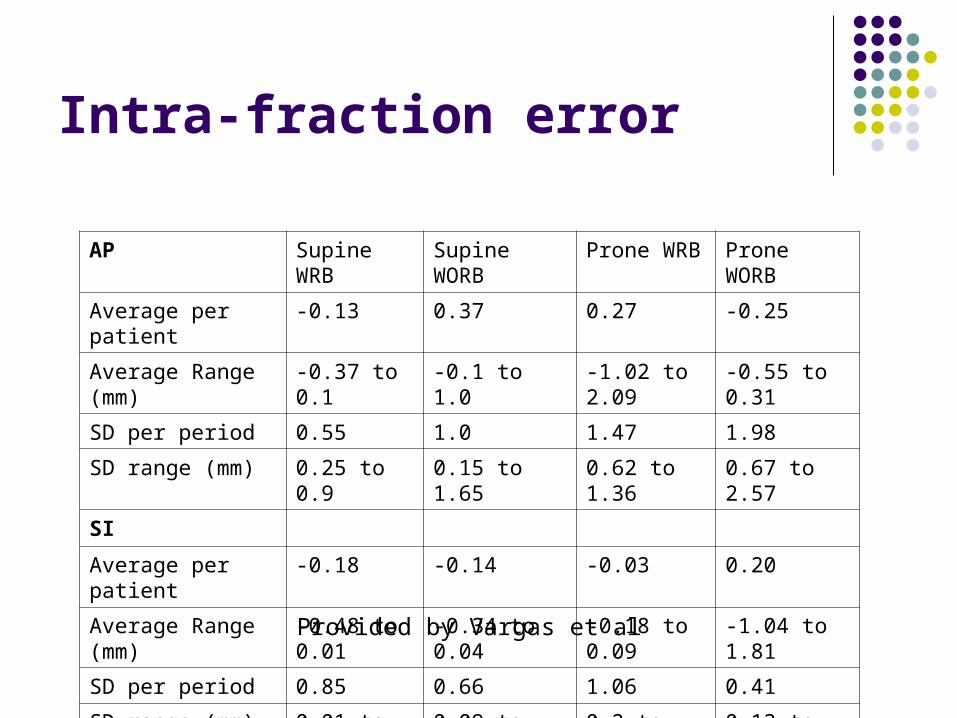
Intra-fraction error
AP Supine WRB Supine WORB Prone WRB Prone WORB
Average per patient -0.13 0.37 0.27 -0.25
Average Range (mm) -0.37 to 0.1 -0.1 to 1.0 -1.02 to 2.09 -0.55 to 0.31
SD per period 0.55 1.0 1.47 1.98
SD range (mm) 0.25 to 0.9 0.15 to 1.65 0.62 to 1.36 0.67 to 2.57
SI
Average per patient -0.18 -0.14 -0.03 0.20
Average Range (mm) -0.48 to 0.01 -0.34 to 0.04 -0.18 to 0.09 -1.04 to 1.81
SD per period 0.85 0.66 1.06 0.41
SD range (mm) 0.01 to 1.40 0.09 to 0.99 0.2 to 1.68 0.13 to 0.87
Provided by Vargas et al
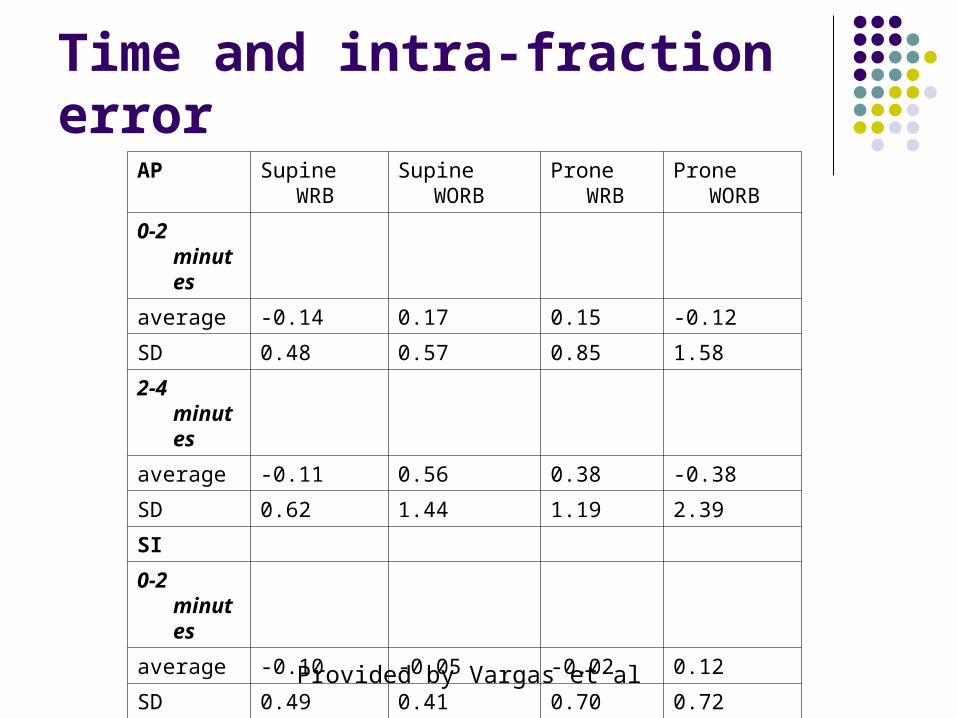
Time and intra-fraction errorAP Supine WRB Supine WORB Prone WRB Prone WORB
0-2 minutes
average -0.14 0.17 0.15 -0.12
SD 0.48 0.57 0.85 1.58
2-4 minutes
average -0.11 0.56 0.38 -0.38
SD 0.62 1.44 1.19 2.39
SI
0-2 minutes
average -0.10 -0.05 -0.02 0.12
SD 0.49 0.41 0.70 0.72
2-4 minutes
average -0.25 -0.23 -0.05 0.28
SD 1.22 0.91 1.42 0.92
Provided by Vargas et al
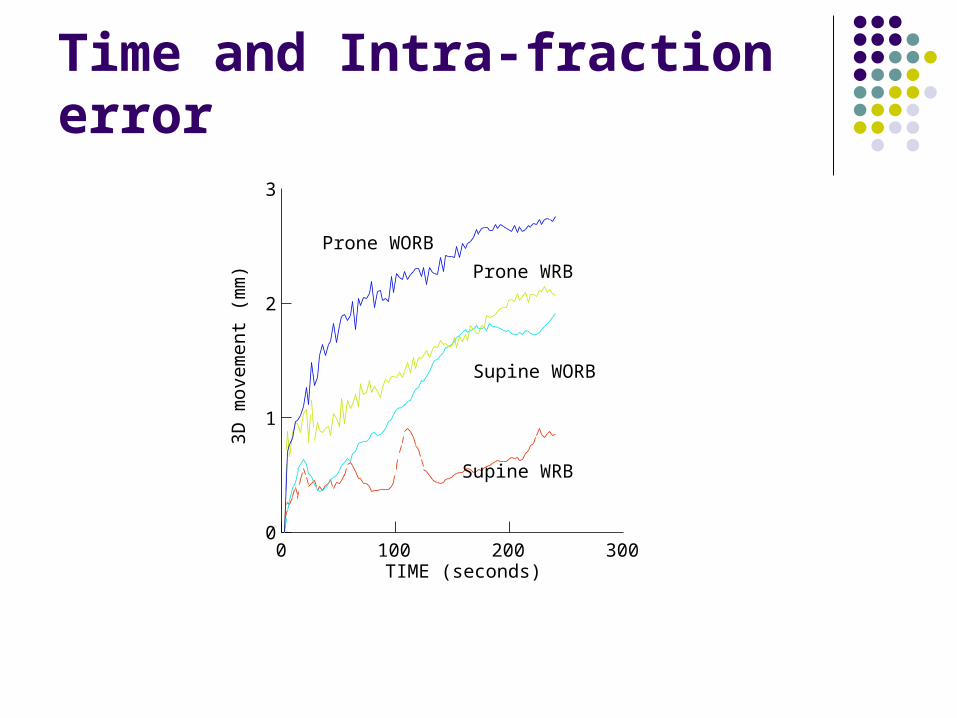
Time and Intra-fraction error
0 100 200 300TIME (seconds)
0
1
2
3
3D m
ovem
ent
(mm
)
Supine WRB
Supine WORB
Prone WORB
Prone WRB
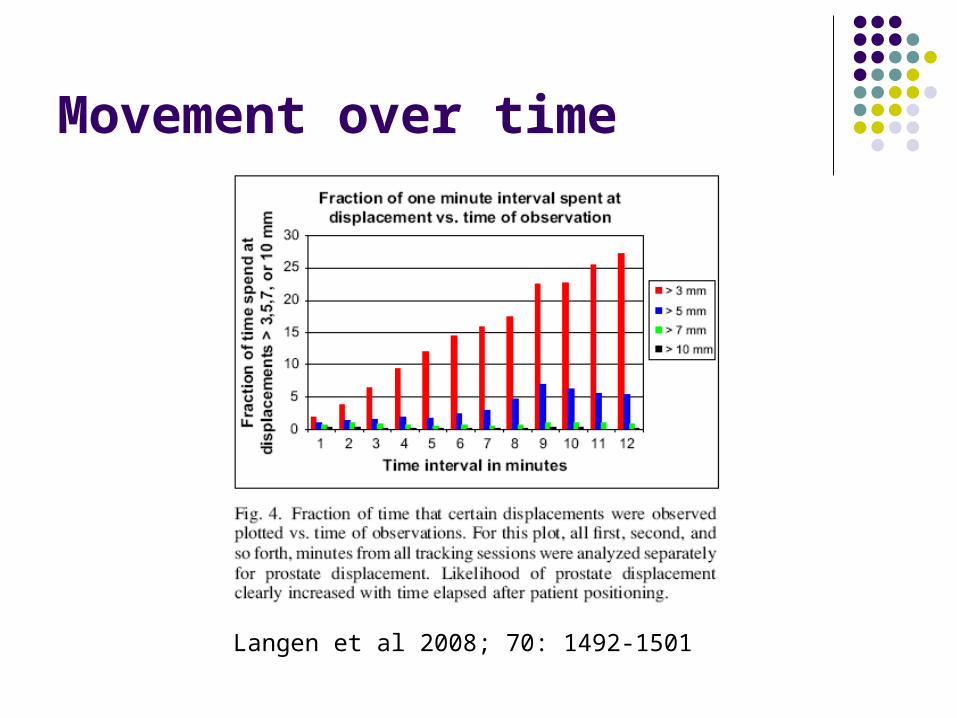
Movement over time
Langen et al 2008; 70: 1492-1501
Randomized Trials
Randomized trials provide non-biased answers to the a defined question. If proton therapy is compared to IMRT we will know if the proton therapy technique employed is superior or less toxic to IMRT. However, which type of proton therapy will be used IG with an
active level threshold with MRI simulation and patient specific optimization.
What will happen with uniform scanning, IMPT, integration with chemotherapy, hypofractionated regimes, dose escalation.
Furthermore, it will take several years to propose write and accrue patients. Followed by several years before and answer for a given proton technique the answer may be irrelevant at the time the results are available
Randomized Trials
No comparison was done for 2D to 3D or from 3D to IMRT.
Dosimetric analysis suggested a benefit for 3D and IMRT and clinical results followed.
The benefit for Proton therapy compared to IMRT is larger than for 3D vs. IMRT for prostate cancer.
Surrogates, as the studies quoted before, are available that show a clinical benefit for proton therapy the question that will remain will be magnitude of the benefit.
Randomized Trials
Will resources be better spend in questions that can only be answered with this type of design? Hypofractionation for proton therapy Dose escalation Integration of chemotherapeutic/other agents
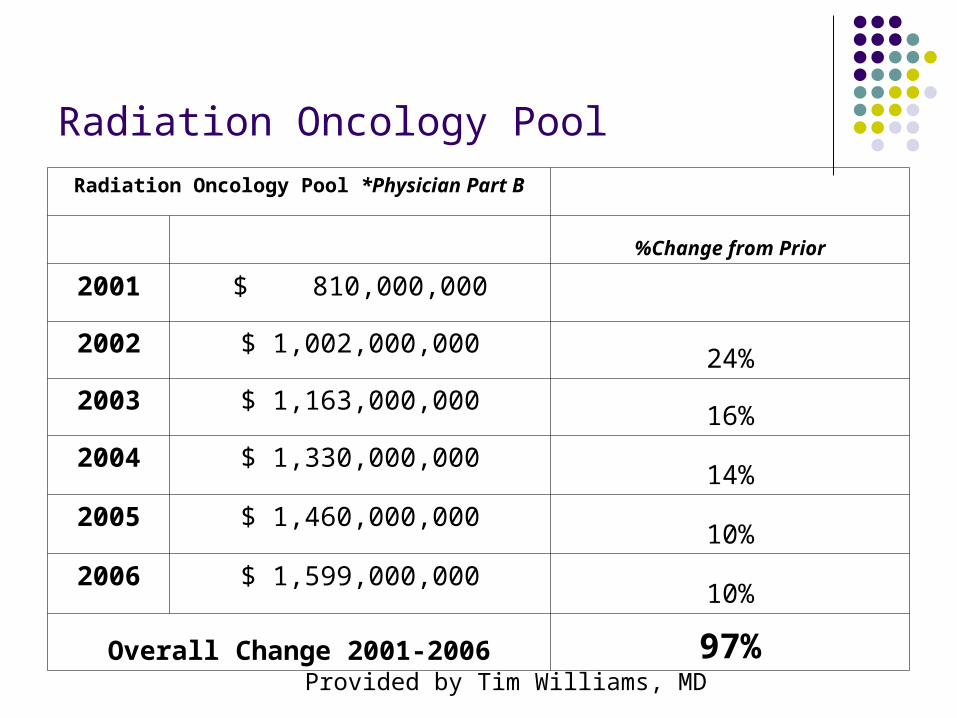
Radiation Oncology Pool
Radiation Oncology Pool *Physician Part B
%Change from Prior
2001 $ 810,000,000
2002 $ 1,002,000,000 24%
2003 $ 1,163,000,000 16%
2004 $ 1,330,000,000 14%
2005 $ 1,460,000,000 10%
2006 $ 1,599,000,00010%
Overall Change 2001-2006 97%Provided by Tim Williams, MD
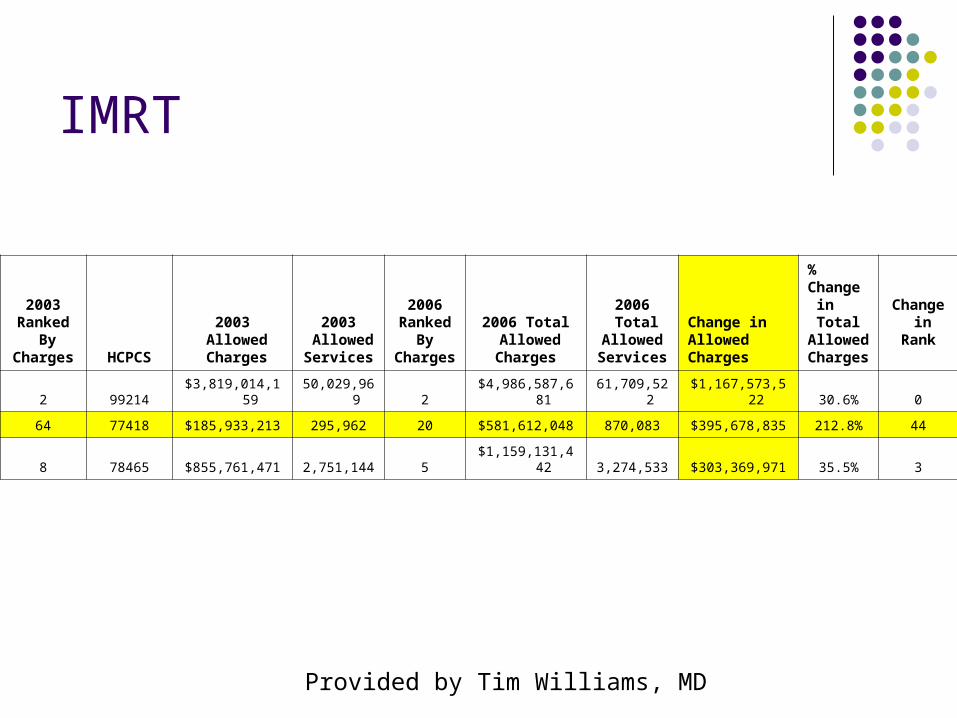
IMRT
2003Ranked
ByCharge
s HCPCS
2003 Allowed Charges
2003 Allowed Services
2006Ranke
dBy
Charges
2006 Total AllowedCharges
2006 Total
AllowedServices
Change inAllowedCharges
%Chang
e in TotalAllowe
dCharge
s
Change
inRank
2 99214 $3,819,014,159 50,029,969 2 $4,986,587,681 61,709,522 $1,167,573,522 30.6% 0
64 77418 $185,933,213 295,962 20 $581,612,048 870,083 $395,678,835 212.8% 44
8 78465 $855,761,471 2,751,144 5 $1,159,131,442 3,274,533 $303,369,971 35.5% 3
Provided by Tim Williams, MD
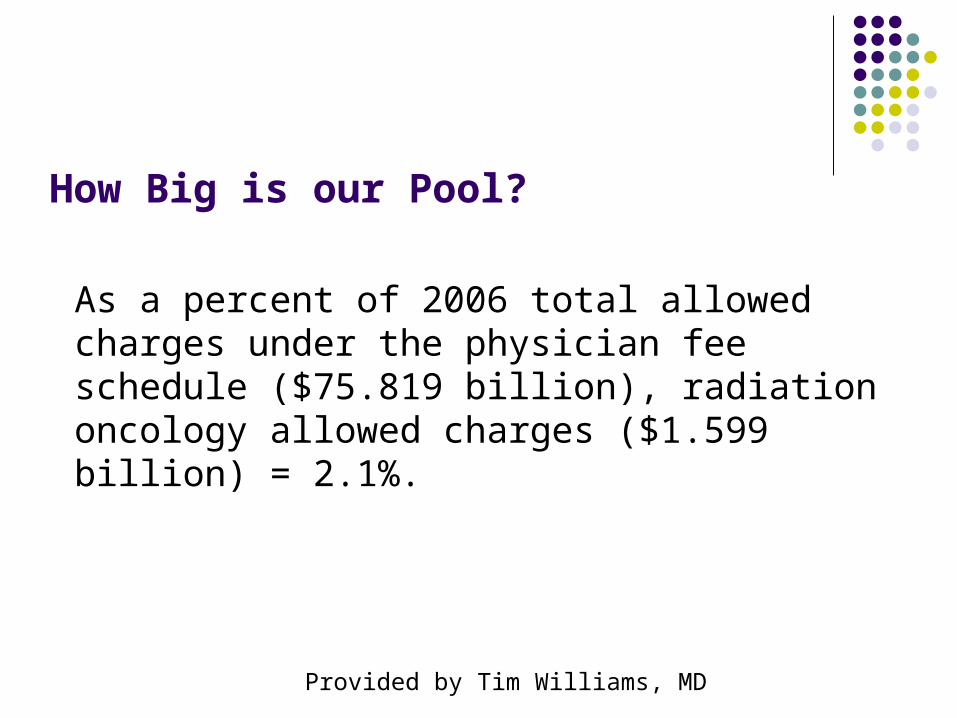
How Big is our Pool?
As a percent of 2006 total allowed charges under the physician fee schedule ($75.819 billion), radiation oncology allowed charges ($1.599 billion) = 2.1%.
Provided by Tim Williams, MD
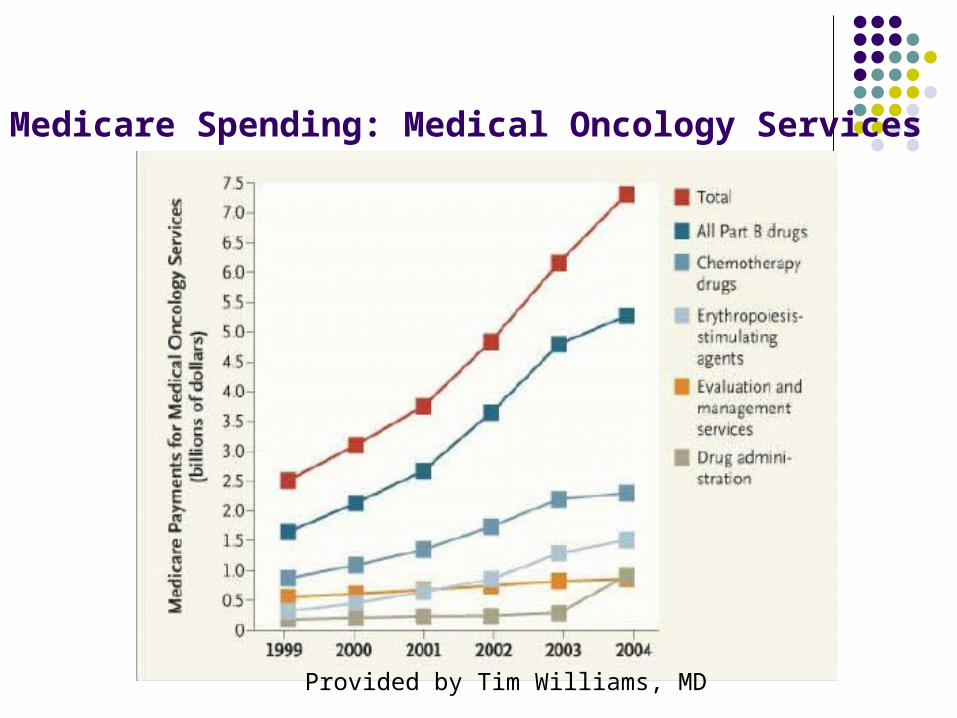
Medicare Spending: Medical Oncology Services
Provided by Tim Williams, MD
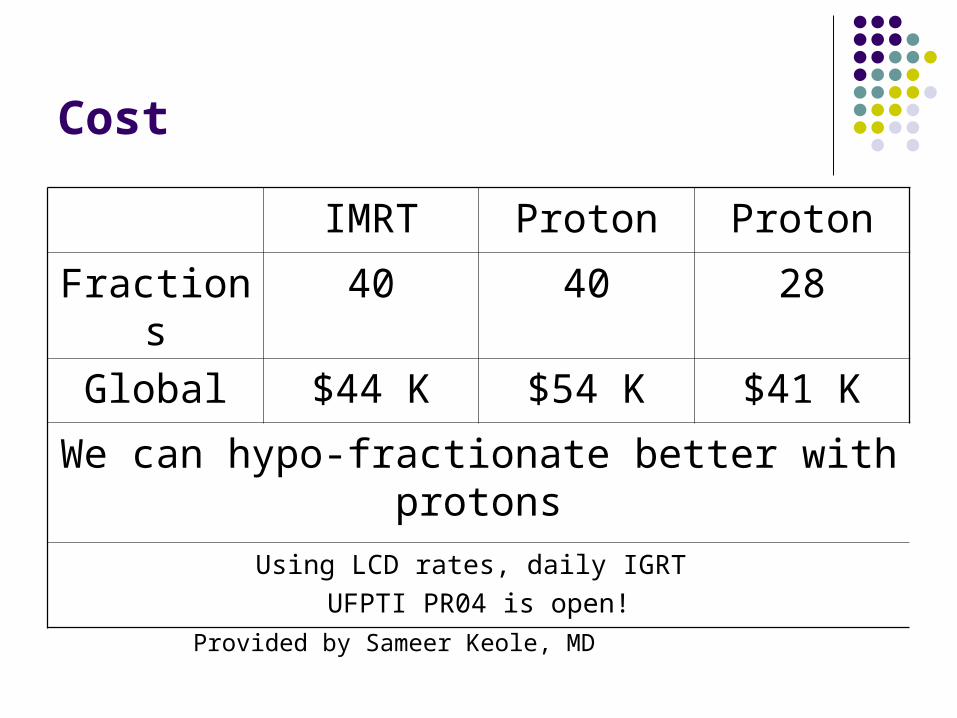
Cost
IMRT Proton Proton
Fractions 40 40 28
Global $44 K $54 K $41 K
We can hypo-fractionate better with protons
Using LCD rates, daily IGRT
UFPTI PR04 is open!
Provided by Sameer Keole, MD
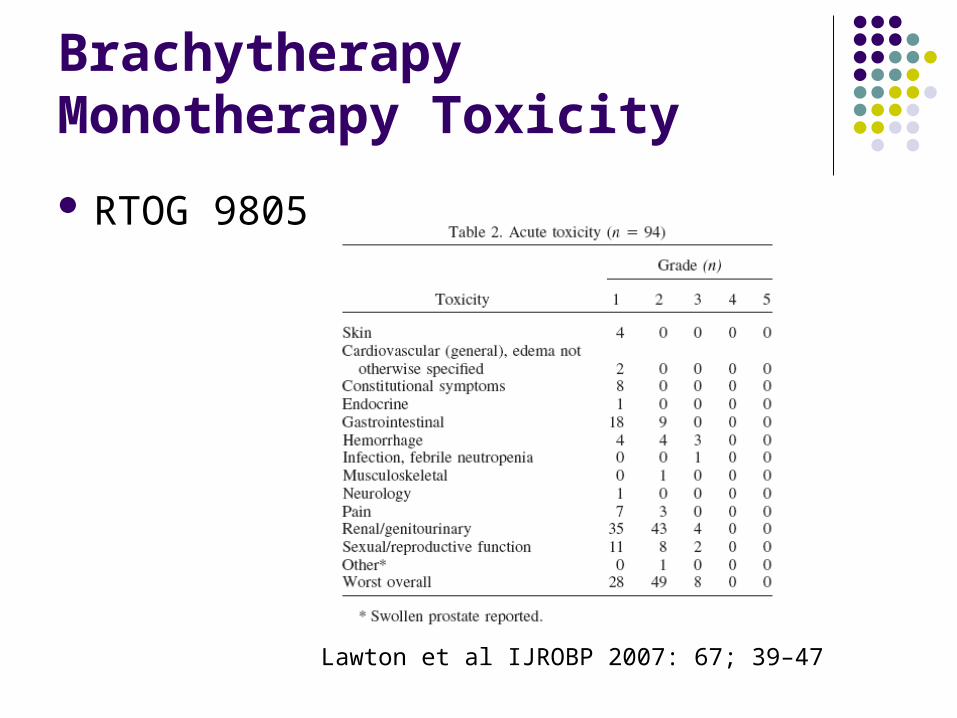
Brachytherapy Monotherapy Toxicity
RTOG 9805
Lawton et al IJROBP 2007: 67; 39–47
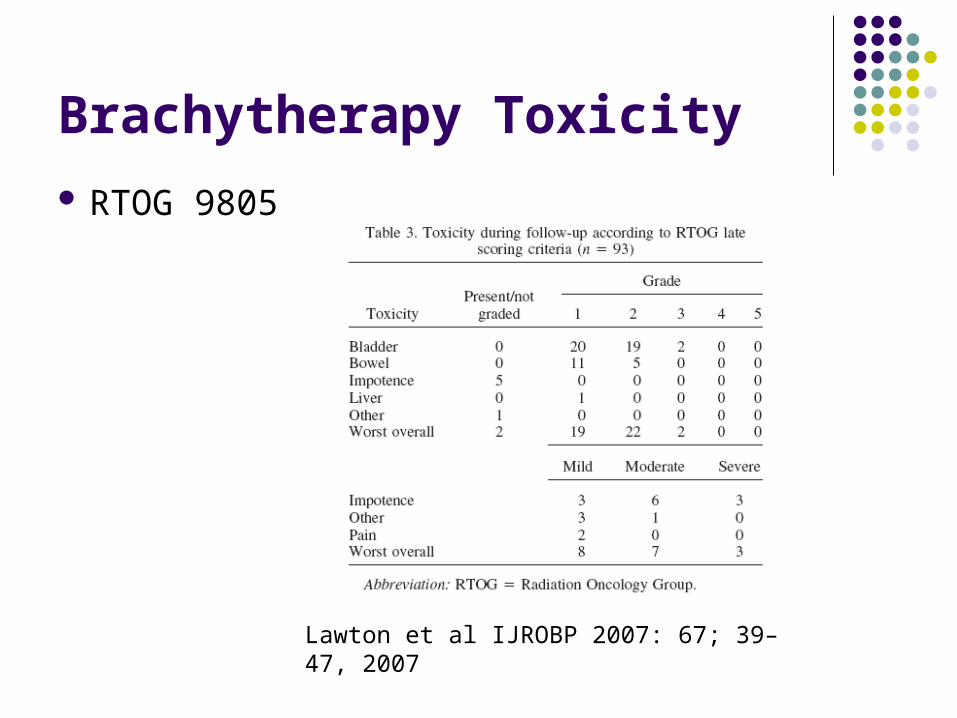
Brachytherapy Toxicity
RTOG 9805
Lawton et al IJROBP 2007: 67; 39–47, 2007
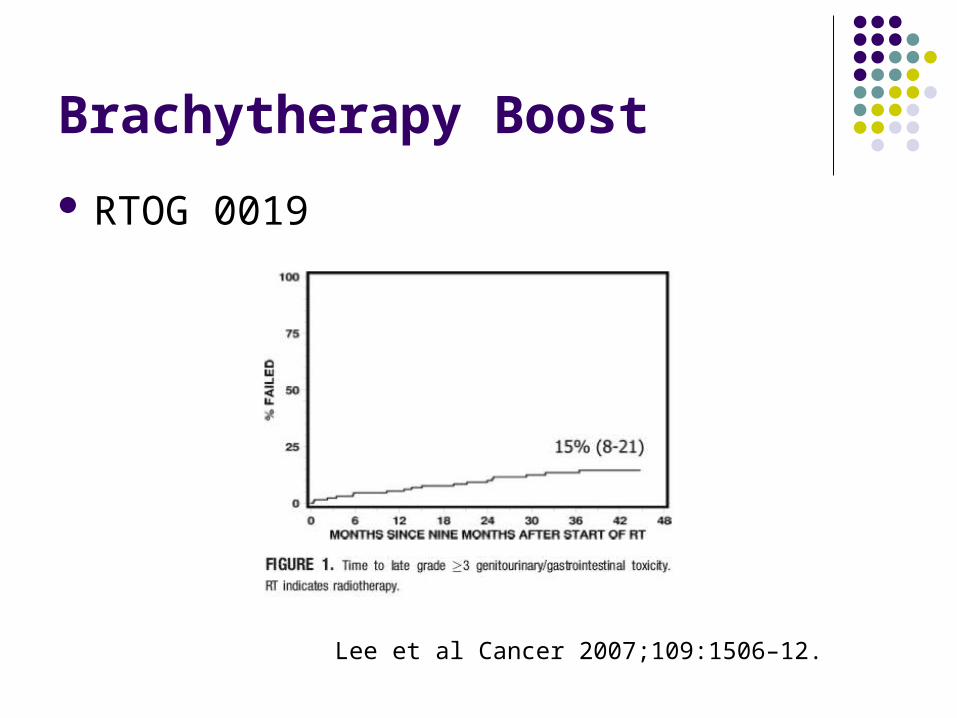
Brachytherapy Boost
RTOG 0019
Lee et al Cancer 2007;109:1506–12.
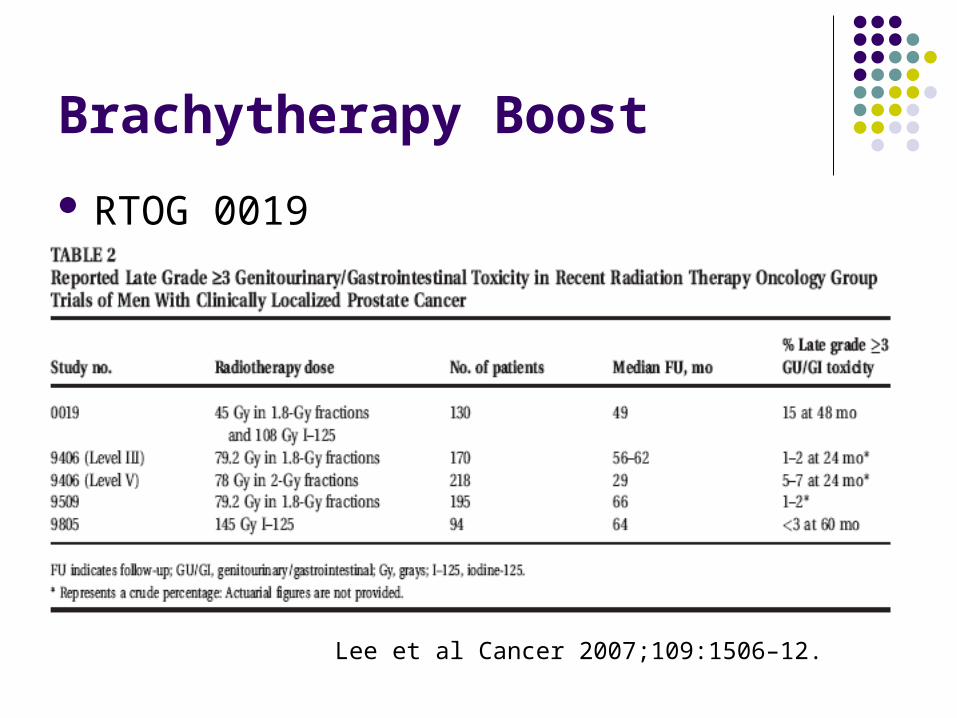
Brachytherapy Boost
RTOG 0019
Lee et al Cancer 2007;109:1506–12.
Summary
Acute toxicity is high. Late toxicity profile for IMRT and
brachytherapy is similar for monotherapy and high for combined modality.
Is an invasive procedure. Control rates are not better than
conventional.
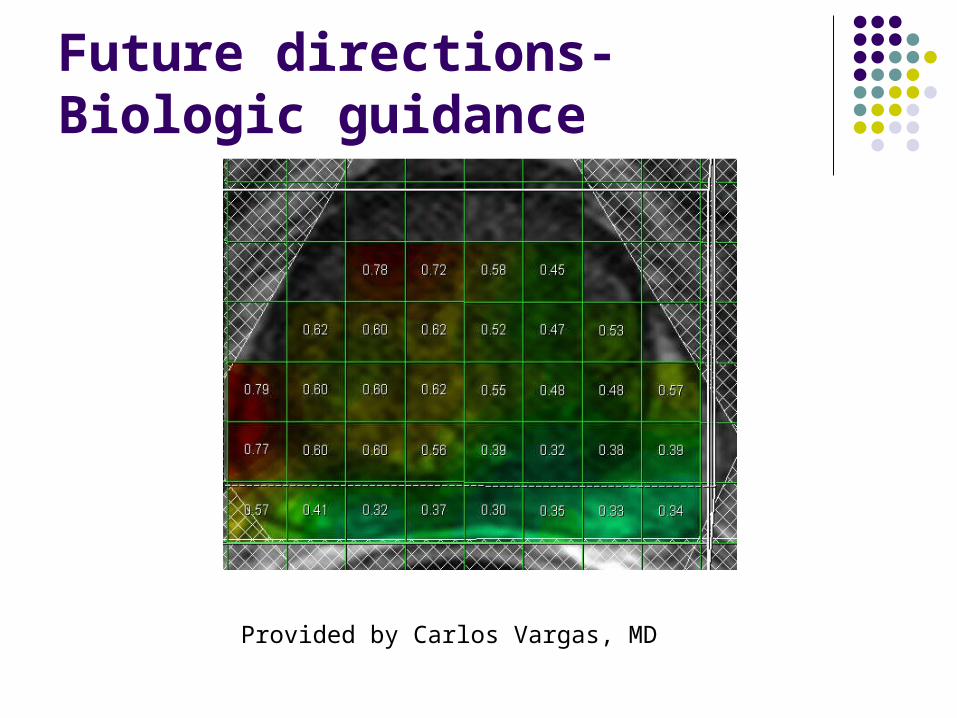
Future directions-Biologic guidance
Provided by Carlos Vargas, MD
At the end
I. Scanned proton therapy will decrease exposure outside the field potentially decreasing second malignancies.
II. Optimally done proton plans will decrease doses to normal structures.
III. Image guided proton therapy is superior to image guided IMRT
IV. Shorter treatment and beam on times will decrease intra-fraction error further reducing necessary margins and decreasing doses to normal structures
V. Lower integral doses may allow the appropriate use with systemic agents
VI. Hypofractionated proton courses as proposed by us and implemented at UF are cheaper than IMRT (44-45fx)
In summary
Prostate is in an ideal location for optimal proton therapy.
Current DS proton therapy for prostate cancer is superior to IMRT.
However, we do not stop here US and IMPT will further improve our treatments and the clinical benefit.