protein structure femtosecond structural dynamics drives...
TRANSCRIPT

PROTEIN STRUCTURE
Femtosecond structural dynamicsdrives the trans/cis isomerization inphotoactive yellow proteinKanupriya Pande,1,2 Christopher D. M. Hutchison,3 Gerrit Groenhof,4 Andy Aquila,5
Josef S. Robinson,5 Jason Tenboer,1 Shibom Basu,6 Sébastien Boutet,5
Daniel P. DePonte,5 Mengning Liang,5 Thomas A. White,2 Nadia A. Zatsepin,7
Oleksandr Yefanov,2 Dmitry Morozov,4 Dominik Oberthuer,2 Cornelius Gati,2
Ganesh Subramanian,7 Daniel James,7 Yun Zhao,7 Jake Koralek,5 Jennifer Brayshaw,1
Christopher Kupitz,1 Chelsie Conrad,6 Shatabdi Roy-Chowdhury,6 Jesse D. Coe,6
Markus Metz,2 Paulraj Lourdu Xavier,2,8 Thomas D. Grant,9 Jason E. Koglin,5
Gihan Ketawala,6 Raimund Fromme,6 Vukica Šrajer,10 Robert Henning,10
John C. H. Spence,7 Abbas Ourmazd,1 Peter Schwander,1 Uwe Weierstall,7
Matthias Frank,11 Petra Fromme,6 Anton Barty,2 Henry N. Chapman,2,12
Keith Moffat,10,13 Jasper J. van Thor,3 Marius Schmidt1*
A variety of organisms have evolved mechanisms to detect and respond to light, in which theresponse is mediated by protein structural changes after photon absorption. The initial stepis often the photoisomerization of a conjugated chromophore. Isomerization occurs onultrafast time scales and is substantially influenced by the chromophore environment. Herewe identify structural changes associated with the earliest steps in the trans-to-cisisomerization of the chromophore in photoactive yellow protein. Femtosecond hard x-raypulses emitted by the Linac Coherent Light Source were used to conduct time-resolved serialfemtosecond crystallography on photoactive yellow protein microcrystals over a time rangefrom 100 femtoseconds to 3 picoseconds to determine the structural dynamics of thephotoisomerization reaction.
Trans-to-cis isomerization constitutes amajorclass of chemical reactions of critical im-portance to biology, an example of which isthe light-dependent isomerization of a reti-nal chromophore that underlies vision (1).
Because isomerization occurs on the femtosecondto picosecond time scale, ultrafast time-resolvedmethods are necessary to follow the reaction inreal time. The spectral response after photon ab-sorption reveals the dynamics of the moleculesinvolved (2–5) but does not directly observe the
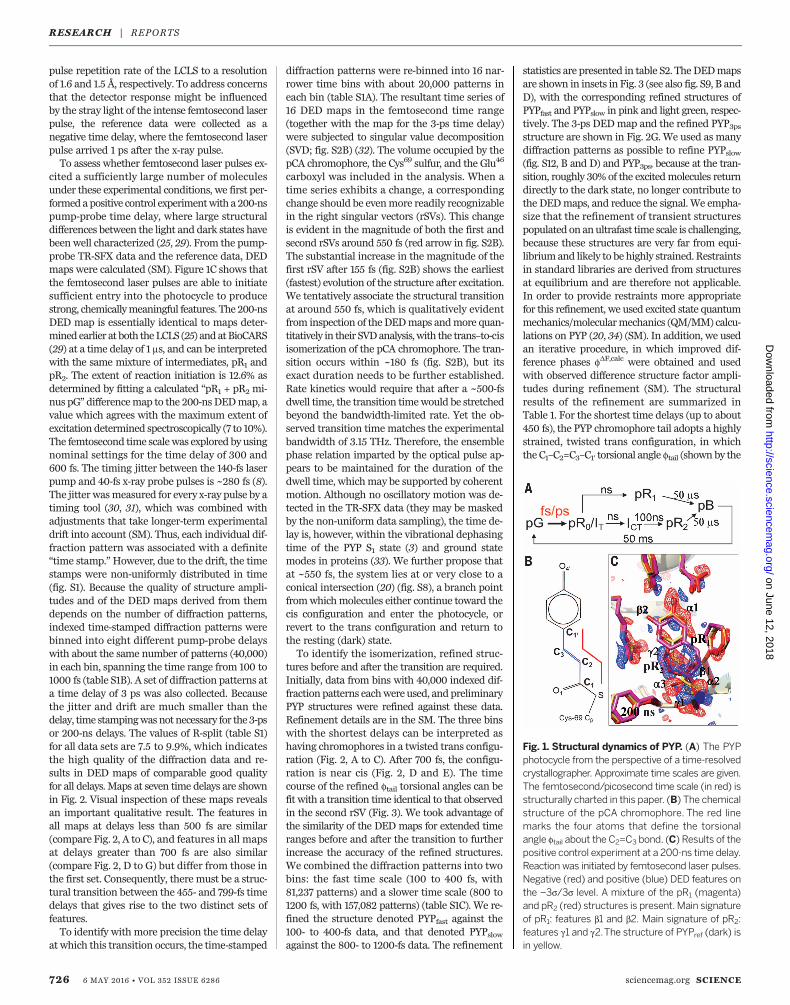
associated structural changes, which have to beinferred by computational approaches (6). Untilrecently, it has been impossible to directly deter-mine the structure of molecules on ultrafast timescales. With the recent availability of hard x-raypulses on the femtosecond time scale emitted byfree electron laser (FEL) sources such as theLinac Coherent Light Source (LCLS), the ultra-fast femtosecond-to-picosecond time scale hasbecome experimentally accessible (7–11). Photo-chemical reactions (12) are initiated by photonabsorption, which promotes electrons into the ex-cited state. Thereafter, the nuclei experience andthe structure evolves on the excited state poten-tial energy surface (PES) (13, 14). The shape of thesurface controls the subsequent nuclear dynam-ics. After returning to the ground state PES, thereaction continues and is driven thermally. Al-though structures of longer-lived excited state in-termediates have been characterizedwith ~100-pstime resolution at synchrotrons (15–19), the femto-second structural dynamics of ultrafast photo-chemical reactions can only be investigated withan x-ray FEL (11). The photoactive yellow protein(PYP) is an ideal macromolecular system withwhich to investigate ultrafast trans-to-cis isomer-ization. Its chromophore, p-coumaric acid (pCA),can be photoexcited by absorbing a photon in theblue region of the spectrum.Upon photon absorp-tion, PYP enters a reversible photocycle involvingnumerous intermediates (Fig. 1A). The primaryphotochemical event that controls entry into thephotocycle is the isomerization of pCA about its
C2=C3 double bond (see Fig. 1B for the pCA geom-etry). The pCA chromophore remains electroni-cally excited for a few hundred femtoseconds(3, 5, 20). Excited state dynamics is thought todrive the configurational change from trans to cis(3, 21). The chromophore pocket within the PYPprotein is sufficiently flexible to allow certain rel-atively large atomic displacements, but also im-poses structural constraints that may affect thepathway and dynamics of isomerization (22, 23).In particular, the pCA chromophore is constrainedby a covalent bond to the Cys69 side chain of PYP(Fig. 1B), by unusually short hydrogen bonds be-tween its phenolate oxygen and nearby glutamateand tyrosine side chains (24), and by a hydrogenbond between the carbonyl oxygen of its tail andthe main-chain amide of Cys69.Previously,we showed that time-resolvedpump-
probe serial femtosecond crystallography (TR-SFX)could be successfully carried out on PYP on thenanosecond-to-microsecond time scale. Differ-ence electron density (DED) maps of very highquality,which compare the structures before (dark)and after (light) absorption of a photon (25), wereobtained at near-atomic (1.6 Å) resolution. Theseexperiments used a nanosecond laser pulse to ini-tiate isomerization and subsequent structuralchanges. An overall reaction yield as high as 40%(25) could be reached. However, achieving femto-second time resolution requires that a femtosecondpump laser pulse be used, which restricts the re-action yield to themuch lower value of theprimaryquantum yield (around 10%) and correspondinglyreduces the structural signal. The energy of femto-second pulses (i.e., the number of photons perpulse) must also be limited to avoid damaging ef-fects from their significantly higher peak power.Here, we present results of TR-SFX experimentscovering the time range from 100 fs to 3 ps. Wedirectly followed the trans-to-cis isomerization ofthe pCA chromophore and the concomitant struc-tural changes in its protein environment in realtime. Full details of the experiment and data anal-ysis are provided in the supplementary materials(SM). Light-initiated structural changes in PYPwere investigated at the Coherent X-ray Imaging(CXI) instrument of the LCLS (26). Electronic exci-tation was initiated in microcrystals of PYP byfemtosecond pump laser pulses [wavelength (l) =450nm]. Permanent bleaching of the chromophorewas avoided by limiting the laser pulse energy to0.8mJ/mm2 (5.7 GW/mm2). Laser pulse duration,spectral distribution, and phase were character-ized by second harmonic generation frequency-resolvedoptical gating (SHG-FROG) (27). Thepulseduration was 140 ± 5 fs and had both positivegroup delay dispersion and third-order disper-sion to maximize the conversion to the excitedstate (28). Offline spectroscopic experiments onthin crushed crystals of PYP had established thatphotoexcitation with femtosecond laser pulsesunder comparable conditions could be as high as10% without inducing damage (SM). The struc-tural changes induced by the laser pulse wereprobedwith40-fs x-ray FELpulses at 9 keV (1.36Å).Both the pump-probe and the reference x-raydiffraction data were collected at the full 120-Hz
SCIENCE sciencemag.org 6 MAY 2016 • VOL 352 ISSUE 6286 725
1Department of Physics, University of Wisconsin–Milwaukee,Milwaukee, WI 53211, USA. 2Center for Free Electron LaserScience, Deutsches Elektronen Synchrotron, Notkestrasse 85,22607 Hamburg, Germany. 3Faculty of Natural Sciences,Department of Life Sciences, Imperial College, London SW72AZ, UK. 4Nanoscience Center and Department of Chemistry,University of Jyväskylä, Post Office Box 35, 40014 Jyväskylä,Finland. 5Linac Coherent Light Source, SLAC NationalAccelerator Laboratory, Sand Hill Road, Menlo Park, CA 94025,USA. 6School of Molecular Sciences and Biodesign Center forApplied Structural Discovery, Arizona State University, Tempe,AZ 85287, USA. 7Department of Physics, Arizona StateUniversity, Tempe, AZ 85287, USA. 8IMPRS-UFAST, Max PlanckInstitute for Structure and Dynamics of Matter, LuruperChaussee 149, 22761 Hamburg, Germany. 9Hauptman-Woodward Institute, State University of New York at Buffalo,700 Ellicott Street, Buffalo, NY 14203, USA. 10Center forAdvanced Radiation Sources, University of Chicago, Chicago, IL60637, USA. 11Lawrence Livermore National Laboratory,Livermore, CA 94550, USA. 12Center for Ultrafast Imaging,University of Hamburg, Luruper Chaussee 149, 22761 Hamburg,Germany. 13Department of Biochemistry and Molecular Biologyand Institute for Biophysical Dynamics, University of Chicago,Chicago, IL 60637, USA.*Corresponding author. Email: [email protected]
RESEARCH | REPORTSon June 12, 2018
http://science.sciencemag.org/
Dow
nloaded from
pulse repetition rate of the LCLS to a resolutionof 1.6 and 1.5 Å, respectively. To address concernsthat the detector response might be influencedby the stray light of the intense femtosecond laserpulse, the reference data were collected as anegative time delay, where the femtosecond laserpulse arrived 1 ps after the x-ray pulse.To assess whether femtosecond laser pulses ex-
cited a sufficiently large number of moleculesunder these experimental conditions, we first per-formedapositive control experimentwith a 200-nspump-probe time delay, where large structuraldifferences between the light and dark states havebeenwell characterized (25, 29). From the pump-probe TR-SFX data and the reference data, DEDmaps were calculated (SM). Figure 1C shows thatthe femtosecond laser pulses are able to initiatesufficient entry into the photocycle to producestrong, chemicallymeaningful features. The 200-nsDED map is essentially identical to maps deter-minedearlier at both theLCLS (25) andatBioCARS(29) at a time delay of 1 ms, and can be interpretedwith the same mixture of intermediates, pR1 andpR2. The extent of reaction initiation is 12.6% asdetermined by fitting a calculated “pR1 + pR2 mi-nus pG” differencemap to the 200-ns DEDmap, avalue which agrees with the maximum extent ofexcitation determined spectroscopically (7 to 10%).The femtosecond time scalewas explored by usingnominal settings for the time delay of 300 and600 fs. The timing jitter between the 140-fs laserpump and 40-fs x-ray probe pulses is ~280 fs (8).The jitter wasmeasured for every x-ray pulse by atiming tool (30, 31), which was combined withadjustments that take longer-term experimentaldrift into account (SM). Thus, each individual dif-fraction pattern was associated with a definite“time stamp.”However, due to the drift, the timestamps were non-uniformly distributed in time(fig. S1). Because the quality of structure ampli-tudes and of the DED maps derived from themdepends on the number of diffraction patterns,indexed time-stamped diffraction patterns werebinned into eight different pump-probe delayswith about the same number of patterns (40,000)in each bin, spanning the time range from 100 to1000 fs (table S1B). A set of diffraction patterns ata time delay of 3 ps was also collected. Becausethe jitter and drift are much smaller than thedelay, time stampingwasnot necessary for the 3-psor 200-ns delays. The values of R-split (table S1)for all data sets are 7.5 to 9.9%, which indicatesthe high quality of the diffraction data and re-sults in DED maps of comparable good qualityfor all delays. Maps at seven time delays are shownin Fig. 2. Visual inspection of these maps revealsan important qualitative result. The features inall maps at delays less than 500 fs are similar(compare Fig. 2, A to C), and features in all mapsat delays greater than 700 fs are also similar(compare Fig. 2, D to G) but differ from those inthe first set. Consequently, there must be a struc-tural transition between the 455- and 799-fs timedelays that gives rise to the two distinct sets offeatures.To identify with more precision the time delay
at which this transition occurs, the time-stamped
diffraction patterns were re-binned into 16 nar-rower time bins with about 20,000 patterns ineach bin (table S1A). The resultant time series of16 DED maps in the femtosecond time range(together with the map for the 3-ps time delay)were subjected to singular value decomposition(SVD; fig. S2B) (32). The volume occupied by thepCA chromophore, the Cys69 sulfur, and the Glu46
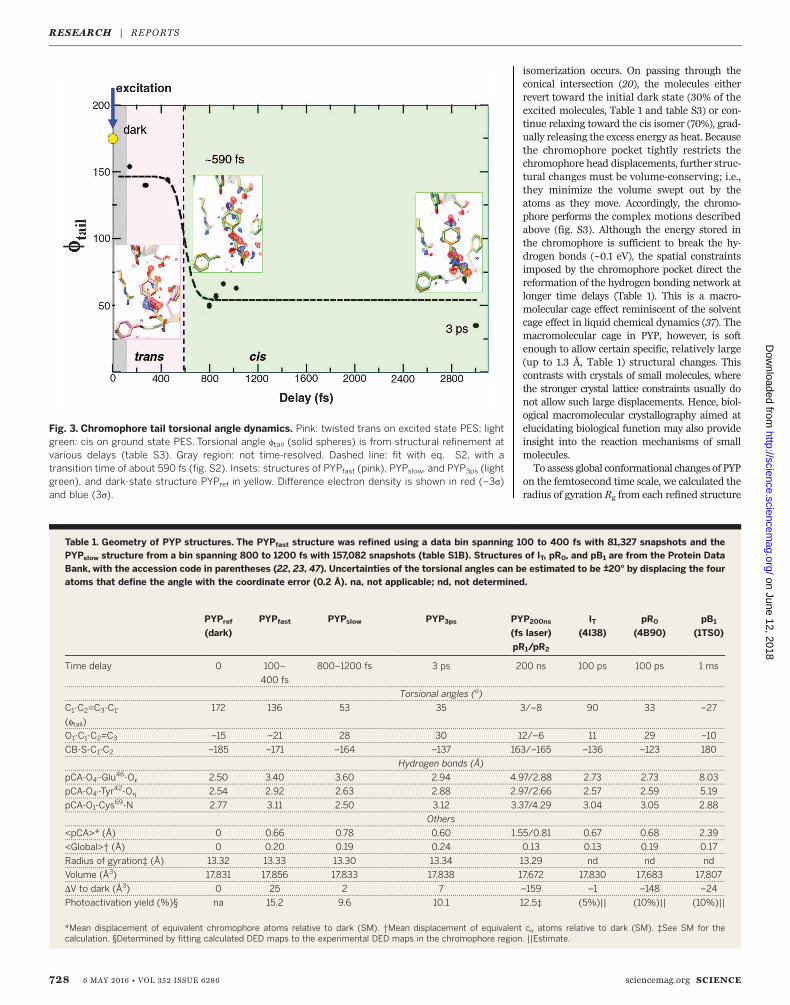
carboxyl was included in the analysis. When atime series exhibits a change, a correspondingchange should be evenmore readily recognizablein the right singular vectors (rSVs). This changeis evident in the magnitude of both the first andsecond rSVs around 550 fs (red arrow in fig. S2B).The substantial increase in the magnitude of thefirst rSV after 155 fs (fig. S2B) shows the earliest(fastest) evolution of the structure after excitation.We tentatively associate the structural transitionat around 550 fs, which is qualitatively evidentfrom inspection of theDEDmaps andmore quan-titatively in their SVDanalysis,with the trans–to-cisisomerization of the pCA chromophore. The tran-sition occurs within ~180 fs (fig. S2B), but itsexact duration needs to be further established.Rate kinetics would require that after a ~500-fsdwell time, the transition timewould be stretchedbeyond the bandwidth-limited rate. Yet the ob-served transition time matches the experimentalbandwidth of 3.15 THz. Therefore, the ensemblephase relation imparted by the optical pulse ap-pears to be maintained for the duration of thedwell time, whichmay be supported by coherentmotion. Although no oscillatory motion was de-tected in the TR-SFX data (they may be maskedby the non-uniform data sampling), the time de-lay is, however, within the vibrational dephasingtime of the PYP S1 state (3) and ground statemodes in proteins (33). We further propose thatat ~550 fs, the system lies at or very close to aconical intersection (20) (fig. S8), a branch pointfromwhichmolecules either continue toward thecis configuration and enter the photocycle, orrevert to the trans configuration and return tothe resting (dark) state.To identify the isomerization, refined struc-
tures before and after the transition are required.Initially, data from bins with 40,000 indexed dif-fraction patterns eachwere used, andpreliminaryPYP structures were refined against these data.Refinement details are in the SM. The three binswith the shortest delays can be interpreted ashaving chromophores in a twisted trans configu-ration (Fig. 2, A to C). After 700 fs, the configu-ration is near cis (Fig. 2, D and E). The timecourse of the refined ftail torsional angles can befit with a transition time identical to that observedin the second rSV (Fig. 3). We took advantage ofthe similarity of the DED maps for extended timeranges before and after the transition to furtherincrease the accuracy of the refined structures.We combined the diffraction patterns into twobins: the fast time scale (100 to 400 fs, with81,237 patterns) and a slower time scale (800 to1200 fs, with 157,082 patterns) (table S1C). We re-fined the structure denoted PYPfast against the100- to 400-fs data, and that denoted PYPslowagainst the 800- to 1200-fs data. The refinement
statistics are presented in table S2. TheDEDmapsare shown in insets in Fig. 3 (see also fig. S9, B andD), with the corresponding refined structures ofPYPfast and PYPslow in pink and light green, respec-tively. The 3-ps DEDmap and the refined PYP3psstructure are shown in Fig. 2G. We used as manydiffraction patterns as possible to refine PYPslow(fig. S12, B and D) and PYP3ps, because at the tran-sition, roughly 30% of the excitedmolecules returndirectly to the dark state, no longer contribute tothe DEDmaps, and reduce the signal. We empha-size that the refinement of transient structurespopulated onanultrafast time scale is challenging,because these structures are very far from equi-libriumand likely to be highly strained. Restraintsin standard libraries are derived from structuresat equilibrium and are therefore not applicable.In order to provide restraints more appropriatefor this refinement, we used excited state quantummechanics/molecularmechanics (QM/MM) calcu-lations on PYP (20, 34) (SM). In addition, we usedan iterative procedure, in which improved dif-ference phases fDF,calc were obtained and usedwith observed difference structure factor ampli-tudes during refinement (SM). The structuralresults of the refinement are summarized inTable 1. For the shortest time delays (up to about450 fs), the PYP chromophore tail adopts a highlystrained, twisted trans configuration, in whichthe C1–C2=C3–C1′ torsional angle ftail (shownby the
726 6 MAY 2016 • VOL 352 ISSUE 6286 sciencemag.org SCIENCE
Fig. 1. Structural dynamics of PYP. (A) The PYPphotocycle from the perspective of a time-resolvedcrystallographer. Approximate time scales are given.The femtosecond/picosecond time scale (in red) isstructurally charted in this paper. (B) The chemicalstructure of the pCA chromophore. The red linemarks the four atoms that define the torsionalangle ftail about the C2=C3 bond. (C) Results of thepositive control experiment at a 200-ns time delay.Reaction was initiated by femtosecond laser pulses.Negative (red) and positive (blue) DED features onthe –3s/3s level. A mixture of the pR1 (magenta)and pR2 (red) structures is present. Main signatureof pR1: features b1 and b2. Main signature of pR2:features g1 and g2.The structure of PYPref (dark) isin yellow.
RESEARCH | REPORTSon June 12, 2018
http://science.sciencemag.org/
Dow
nloaded from
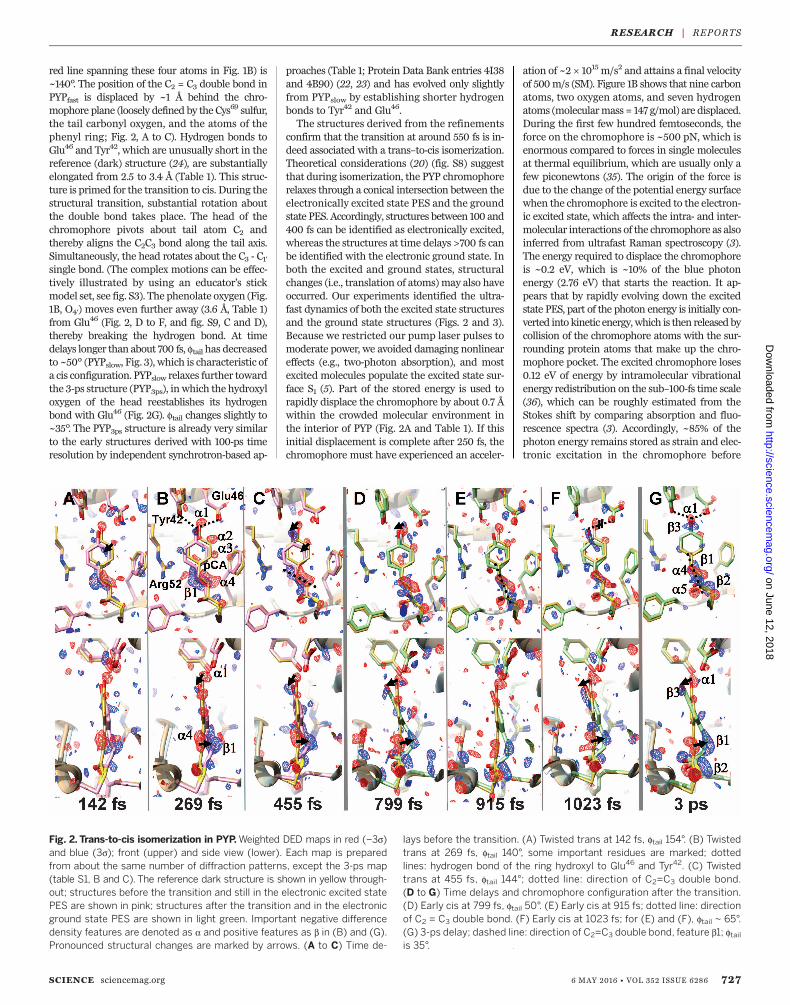
red line spanning these four atoms in Fig. 1B) is~140°. The position of the C2 = C3 double bond inPYPfast is displaced by ~1 Å behind the chro-mophore plane (loosely defined by the Cys69 sulfur,the tail carbonyl oxygen, and the atoms of thephenyl ring; Fig. 2, A to C). Hydrogen bonds toGlu46 and Tyr42, which are unusually short in thereference (dark) structure (24), are substantiallyelongated from 2.5 to 3.4 Å (Table 1). This struc-ture is primed for the transition to cis. During thestructural transition, substantial rotation aboutthe double bond takes place. The head of thechromophore pivots about tail atom C2 andthereby aligns the C2C3 bond along the tail axis.Simultaneously, the head rotates about the C3 - C1′single bond. (The complex motions can be effec-tively illustrated by using an educator’s stickmodel set, see fig. S3). The phenolate oxygen (Fig.1B, O4′) moves even further away (3.6 Å, Table 1)from Glu46 (Fig. 2, D to F, and fig. S9, C and D),thereby breaking the hydrogen bond. At timedelays longer than about 700 fs, ftail has decreasedto ~50° (PYPslow, Fig. 3), which is characteristic ofa cis configuration. PYPslow relaxes further towardthe 3-ps structure (PYP3ps), inwhich the hydroxyloxygen of the head reestablishes its hydrogenbond with Glu46 (Fig. 2G). ftail changes slightly to~35°. The PYP3ps structure is already very similarto the early structures derived with 100-ps timeresolution by independent synchrotron-based ap-
proaches (Table 1; Protein Data Bank entries 4I38and 4B90) (22, 23) and has evolved only slightlyfrom PYPslow by establishing shorter hydrogenbonds to Tyr42 and Glu46.The structures derived from the refinements
confirm that the transition at around 550 fs is in-deed associated with a trans–to-cis isomerization.Theoretical considerations (20) (fig. S8) suggestthat during isomerization, the PYP chromophorerelaxes through a conical intersection between theelectronically excited state PES and the groundstate PES. Accordingly, structures between 100 and400 fs can be identified as electronically excited,whereas the structures at time delays >700 fs canbe identified with the electronic ground state. Inboth the excited and ground states, structuralchanges (i.e., translation of atoms) may also haveoccurred. Our experiments identified the ultra-fast dynamics of both the excited state structuresand the ground state structures (Figs. 2 and 3).Because we restricted our pump laser pulses tomoderate power, we avoided damaging nonlineareffects (e.g., two-photon absorption), and mostexcited molecules populate the excited state sur-face S1 (5). Part of the stored energy is used torapidly displace the chromophore by about 0.7 Åwithin the crowded molecular environment inthe interior of PYP (Fig. 2A and Table 1). If thisinitial displacement is complete after 250 fs, thechromophore must have experienced an acceler-
ation of ~2 × 10¹⁵ m/s2 and attains a final velocityof 500m/s (SM). Figure 1B shows that nine carbonatoms, two oxygen atoms, and seven hydrogenatoms (molecularmass = 147 g/mol) are displaced.During the first few hundred femtoseconds, theforce on the chromophore is ~500 pN, which isenormous compared to forces in single moleculesat thermal equilibrium, which are usually only afew piconewtons (35). The origin of the force isdue to the change of the potential energy surfacewhen the chromophore is excited to the electron-ic excited state, which affects the intra- and inter-molecular interactions of the chromophore as alsoinferred from ultrafast Raman spectroscopy (3).The energy required to displace the chromophoreis ~0.2 eV, which is ~10% of the blue photonenergy (2.76 eV) that starts the reaction. It ap-pears that by rapidly evolving down the excitedstate PES, part of the photon energy is initially con-verted into kinetic energy,which is then releasedbycollision of the chromophore atoms with the sur-rounding protein atoms that make up the chro-mophore pocket. The excited chromophore loses0.12 eV of energy by intramolecular vibrationalenergy redistribution on the sub–100-fs time scale(36), which can be roughly estimated from theStokes shift by comparing absorption and fluo-rescence spectra (3). Accordingly, ~85% of thephoton energy remains stored as strain and elec-tronic excitation in the chromophore before
SCIENCE sciencemag.org 6 MAY 2016 • VOL 352 ISSUE 6286 727
Fig. 2. Trans-to-cis isomerization in PYP.Weighted DED maps in red (–3s)and blue (3s); front (upper) and side view (lower). Each map is preparedfrom about the same number of diffraction patterns, except the 3-ps map(table S1, B and C). The reference dark structure is shown in yellow through-out; structures before the transition and still in the electronic excited statePES are shown in pink; structures after the transition and in the electronicground state PES are shown in light green. Important negative differencedensity features are denoted as a and positive features as b in (B) and (G).Pronounced structural changes are marked by arrows. (A to C) Time de-
lays before the transition. (A) Twisted trans at 142 fs, ftail 154°. (B) Twistedtrans at 269 fs, ftail 140°, some important residues are marked; dottedlines: hydrogen bond of the ring hydroxyl to Glu46 and Tyr42. (C) Twistedtrans at 455 fs, ftail 144°; dotted line: direction of C2=C3 double bond.(D to G) Time delays and chromophore configuration after the transition.(D) Early cis at 799 fs, ftail 50°. (E) Early cis at 915 fs; dotted line: directionof C2 = C3 double bond. (F) Early cis at 1023 fs; for (E) and (F), ftail ~ 65°.(G) 3-ps delay; dashed line: direction of C2=C3 double bond, feature b1; ftailis 35°.
RESEARCH | REPORTSon June 12, 2018
http://science.sciencemag.org/
Dow
nloaded from
isomerization occurs. On passing through theconical intersection (20), the molecules eitherrevert toward the initial dark state (30% of theexcited molecules, Table 1 and table S3) or con-tinue relaxing toward the cis isomer (70%), grad-ually releasing the excess energy as heat. Becausethe chromophore pocket tightly restricts thechromophore head displacements, further struc-tural changes must be volume-conserving; i.e.,they minimize the volume swept out by theatoms as they move. Accordingly, the chromo-phore performs the complex motions describedabove (fig. S3). Although the energy stored inthe chromophore is sufficient to break the hy-drogen bonds (~0.1 eV), the spatial constraintsimposed by the chromophore pocket direct thereformation of the hydrogen bonding network atlonger time delays (Table 1). This is a macro-molecular cage effect reminiscent of the solventcage effect in liquid chemical dynamics (37). Themacromolecular cage in PYP, however, is softenough to allow certain specific, relatively large(up to 1.3 Å, Table 1) structural changes. Thiscontrasts with crystals of small molecules, wherethe stronger crystal lattice constraints usually donot allow such large displacements. Hence, biol-ogical macromolecular crystallography aimed atelucidating biological function may also provideinsight into the reaction mechanisms of smallmolecules.To assess global conformational changes of PYP
on the femtosecond time scale, we calculated theradius of gyration Rg from each refined structure
728 6 MAY 2016 • VOL 352 ISSUE 6286 sciencemag.org SCIENCE
Table 1. Geometry of PYP structures. The PYPfast structure was refined using a data bin spanning 100 to 400 fs with 81,327 snapshots and thePYPslow structure from a bin spanning 800 to 1200 fs with 157,082 snapshots (table S1B). Structures of IT, pR0, and pB1 are from the Protein DataBank, with the accession code in parentheses (22, 23, 47). Uncertainties of the torsional angles can be estimated to be ±20° by displacing the fouratoms that define the angle with the coordinate error (0.2 Å). na, not applicable; nd, not determined.
PYPref
(dark)
PYPfast PYPslow PYP3ps PYP200ns
(fs laser)
pR1/pR2
IT(4I38)
pR0
(4B90)
pB1
(1TS0)
Time delay 0 100–
400 fs
800–1200 fs 3 ps 200 ns 100 ps 100 ps 1 ms
.. .. ... ... .. ... .. ... ... .. ... ... .. ... .. ... ... .. ... ... .. ... ... .. ... .. ... ... .. ... ... .. ... .. ... ... .. ... ... .. ... ... .. ... .. ... ... .. ... ... .. ... .. ... ... .. ... ... .. ... ... .. ... .. ... ... .. ... ... .. ... .. ... ... .. ... ... .. ... ... .. ... .. ... ... .. ... ... .. ... .. ... ... .. ... ... .. ... ... .. ... .. ... ... .. ... ... .. ... .. ... ... .. ... ... .. ... ... .. ... .. ... ... .. ... ... .
Torsional angles (o).. .. ... ... .. ... .. ... ... .. ... ... .. ... .. ... ... .. ... ... .. ... ... .. ... .. ... ... .. ... ... .. ... .. ... ... .. ... ... .. ... ... .. ... .. ... ... .. ... ... .. ... .. ... ... .. ... ... .. ... ... .. ... .. ... ... .. ... ... .. ... .. ... ... .. ... ... .. ... ... .. ... .. ... ... .. ... ... .. ... .. ... ... .. ... ... .. ... ... .. ... .. ... ... .. ... ... .. ... .. ... ... .. ... ... .. ... ... .. ... .. ... ... .. ... ... .
C1-C2=C3-C1′
(ftail)
172 136 53 35 3/–8 90 33 –27
.. .. ... ... .. ... .. ... ... .. ... ... .. ... .. ... ... .. ... ... .. ... ... .. ... .. ... ... .. ... ... .. ... .. ... ... .. ... ... .. ... ... .. ... .. ... ... .. ... ... .. ... .. ... ... .. ... ... .. ... ... .. ... .. ... ... .. ... ... .. ... .. ... ... .. ... ... .. ... ... .. ... .. ... ... .. ... ... .. ... .. ... ... .. ... ... .. ... ... .. ... .. ... ... .. ... ... .. ... .. ... ... .. ... ... .. ... ... .. ... .. ... ... .. ... ... .
O1-C1-C2=C3 –15 –21 28 30 12/–6 11 29 –10.. .. ... ... .. ... .. ... ... .. ... ... .. ... .. ... ... .. ... ... .. ... ... .. ... .. ... ... .. ... ... .. ... .. ... ... .. ... ... .. ... ... .. ... .. ... ... .. ... ... .. ... .. ... ... .. ... ... .. ... ... .. ... .. ... ... .. ... ... .. ... .. ... ... .. ... ... .. ... ... .. ... .. ... ... .. ... ... .. ... .. ... ... .. ... ... .. ... ... .. ... .. ... ... .. ... ... .. ... .. ... ... .. ... ... .. ... ... .. ... .. ... ... .. ... ... .
CB-S-C1-C2 –185 –171 –164 –137 163/–165 –136 –123 180.. .. ... ... .. ... .. ... ... .. ... ... .. ... .. ... ... .. ... ... .. ... ... .. ... .. ... ... .. ... ... .. ... .. ... ... .. ... ... .. ... ... .. ... .. ... ... .. ... ... .. ... .. ... ... .. ... ... .. ... ... .. ... .. ... ... .. ... ... .. ... .. ... ... .. ... ... .. ... ... .. ... .. ... ... .. ... ... .. ... .. ... ... .. ... ... .. ... ... .. ... .. ... ... .. ... ... .. ... .. ... ... .. ... ... .. ... ... .. ... .. ... ... .. ... ... .
Hydrogen bonds (Å).. .. ... ... .. ... .. ... ... .. ... ... .. ... .. ... ... .. ... ... .. ... ... .. ... .. ... ... .. ... ... .. ... .. ... ... .. ... ... .. ... ... .. ... .. ... ... .. ... ... .. ... .. ... ... .. ... ... .. ... ... .. ... .. ... ... .. ... ... .. ... .. ... ... .. ... ... .. ... ... .. ... .. ... ... .. ... ... .. ... .. ... ... .. ... ... .. ... ... .. ... .. ... ... .. ... ... .. ... .. ... ... .. ... ... .. ... ... .. ... .. ... ... .. ... ... .
pCA-O4′-Glu46-Oe 2.50 3.40 3.60 2.94 4.97/2.88 2.73 2.73 8.03
.. .. ... ... .. ... .. ... ... .. ... ... .. ... .. ... ... .. ... ... .. ... ... .. ... .. ... ... .. ... ... .. ... .. ... ... .. ... ... .. ... ... .. ... .. ... ... .. ... ... .. ... .. ... ... .. ... ... .. ... ... .. ... .. ... ... .. ... ... .. ... .. ... ... .. ... ... .. ... ... .. ... .. ... ... .. ... ... .. ... .. ... ... .. ... ... .. ... ... .. ... .. ... ... .. ... ... .. ... .. ... ... .. ... ... .. ... ... .. ... .. ... ... .. ... ... .
pCA-O4′-Tyr42-Oh 2.54 2.92 2.63 2.88 2.97/2.66 2.57 2.59 5.19
.. .. ... ... .. ... .. ... ... .. ... ... .. ... .. ... ... .. ... ... .. ... ... .. ... .. ... ... .. ... ... .. ... .. ... ... .. ... ... .. ... ... .. ... .. ... ... .. ... ... .. ... .. ... ... .. ... ... .. ... ... .. ... .. ... ... .. ... ... .. ... .. ... ... .. ... ... .. ... ... .. ... .. ... ... .. ... ... .. ... .. ... ... .. ... ... .. ... ... .. ... .. ... ... .. ... ... .. ... .. ... ... .. ... ... .. ... ... .. ... .. ... ... .. ... ... .
pCA-O1-Cys69-N 2.77 3.11 2.50 3.12 3.37/4.29 3.04 3.05 2.88
.. .. ... ... .. ... .. ... ... .. ... ... .. ... .. ... ... .. ... ... .. ... ... .. ... .. ... ... .. ... ... .. ... .. ... ... .. ... ... .. ... ... .. ... .. ... ... .. ... ... .. ... .. ... ... .. ... ... .. ... ... .. ... .. ... ... .. ... ... .. ... .. ... ... .. ... ... .. ... ... .. ... .. ... ... .. ... ... .. ... .. ... ... .. ... ... .. ... ... .. ... .. ... ... .. ... ... .. ... .. ... ... .. ... ... .. ... ... .. ... .. ... ... .. ... ... .
Others.. .. ... ... .. ... .. ... ... .. ... ... .. ... .. ... ... .. ... ... .. ... ... .. ... .. ... ... .. ... ... .. ... .. ... ... .. ... ... .. ... ... .. ... .. ... ... .. ... ... .. ... .. ... ... .. ... ... .. ... ... .. ... .. ... ... .. ... ... .. ... .. ... ... .. ... ... .. ... ... .. ... .. ... ... .. ... ... .. ... .. ... ... .. ... ... .. ... ... .. ... .. ... ... .. ... ... .. ... .. ... ... .. ... ... .. ... ... .. ... .. ... ... .. ... ... .
<pCA>* (Å) 0 0.66 0.78 0.60 1.55/0.81 0.67 0.68 2.39.. .. ... ... .. ... .. ... ... .. ... ... .. ... .. ... ... .. ... ... .. ... ... .. ... .. ... ... .. ... ... .. ... .. ... ... .. ... ... .. ... ... .. ... .. ... ... .. ... ... .. ... .. ... ... .. ... ... .. ... ... .. ... .. ... ... .. ... ... .. ... .. ... ... .. ... ... .. ... ... .. ... .. ... ... .. ... ... .. ... .. ... ... .. ... ... .. ... ... .. ... .. ... ... .. ... ... .. ... .. ... ... .. ... ... .. ... ... .. ... .. ... ... .. ... ... .
<Global>† (Å) 0 0.20 0.19 0.24 0.13 0.13 0.19 0.17.. .. ... ... .. ... .. ... ... .. ... ... .. ... .. ... ... .. ... ... .. ... ... .. ... .. ... ... .. ... ... .. ... .. ... ... .. ... ... .. ... ... .. ... .. ... ... .. ... ... .. ... .. ... ... .. ... ... .. ... ... .. ... .. ... ... .. ... ... .. ... .. ... ... .. ... ... .. ... ... .. ... .. ... ... .. ... ... .. ... .. ... ... .. ... ... .. ... ... .. ... .. ... ... .. ... ... .. ... .. ... ... .. ... ... .. ... ... .. ... .. ... ... .. ... ... .
Radius of gyration‡ (Å) 13.32 13.33 13.30 13.34 13.29 nd nd nd.. .. ... ... .. ... .. ... ... .. ... ... .. ... .. ... ... .. ... ... .. ... ... .. ... .. ... ... .. ... ... .. ... .. ... ... .. ... ... .. ... ... .. ... .. ... ... .. ... ... .. ... .. ... ... .. ... ... .. ... ... .. ... .. ... ... .. ... ... .. ... .. ... ... .. ... ... .. ... ... .. ... .. ... ... .. ... ... .. ... .. ... ... .. ... ... .. ... ... .. ... .. ... ... .. ... ... .. ... .. ... ... .. ... ... .. ... ... .. ... .. ... ... .. ... ... .
Volume (Å3) 17,831 17,856 17,833 17,838 17,672 17,830 17,683 17,807.. .. ... ... .. ... .. ... ... .. ... ... .. ... .. ... ... .. ... ... .. ... ... .. ... .. ... ... .. ... ... .. ... .. ... ... .. ... ... .. ... ... .. ... .. ... ... .. ... ... .. ... .. ... ... .. ... ... .. ... ... .. ... .. ... ... .. ... ... .. ... .. ... ... .. ... ... .. ... ... .. ... .. ... ... .. ... ... .. ... .. ... ... .. ... ... .. ... ... .. ... .. ... ... .. ... ... .. ... .. ... ... .. ... ... .. ... ... .. ... .. ... ... .. ... ... .
DV to dark (Å3) 0 25 2 7 –159 –1 –148 –24.. .. ... ... .. ... .. ... ... .. ... ... .. ... .. ... ... .. ... ... .. ... ... .. ... .. ... ... .. ... ... .. ... .. ... ... .. ... ... .. ... ... .. ... .. ... ... .. ... ... .. ... .. ... ... .. ... ... .. ... ... .. ... .. ... ... .. ... ... .. ... .. ... ... .. ... ... .. ... ... .. ... .. ... ... .. ... ... .. ... .. ... ... .. ... ... .. ... ... .. ... .. ... ... .. ... ... .. ... .. ... ... .. ... ... .. ... ... .. ... .. ... ... .. ... ... .
Photoactivation yield (%)§ na 15.2 9.6 10.1 12.5‡ (5%)|| (10%)|| (10%)||.. .. ... ... .. ... .. ... ... .. ... ... .. ... .. ... ... .. ... ... .. ... ... .. ... .. ... ... .. ... ... .. ... .. ... ... .. ... ... .. ... ... .. ... .. ... ... .. ... ... .. ... .. ... ... .. ... ... .. ... ... .. ... .. ... ... .. ... ... .. ... .. ... ... .. ... ... .. ... ... .. ... .. ... ... .. ... ... .. ... .. ... ... .. ... ... .. ... ... .. ... .. ... ... .. ... ... .. ... .. ... ... .. ... ... .. ... ... .. ... .. ... ... .. ... ... .
*Mean displacement of equivalent chromophore atoms relative to dark (SM). †Mean displacement of equivalent ca atoms relative to dark (SM). ‡See SM for thecalculation. §Determined by fitting calculated DED maps to the experimental DED maps in the chromophore region. ||Estimate.
Fig. 3. Chromophore tail torsional angle dynamics. Pink: twisted trans on excited state PES; lightgreen: cis on ground state PES. Torsional angle ftail (solid spheres) is from structural refinement atvarious delays (table S3). Gray region: not time-resolved. Dashed line: fit with eq. S2, with atransition time of about 590 fs (fig. S2). Insets: structures of PYPfast (pink), PYPslow, and PYP3ps (lightgreen), and dark-state structure PYPref in yellow. Difference electron density is shown in red (–3s)and blue (3s).
RESEARCH | REPORTSon June 12, 2018
http://science.sciencemag.org/
Dow
nloaded from

(SM). Rg fluctuates by only 0.2% in all structuresfrom 200 fs to 200 ns (Table 1). An increase of Rg
by up to 1 Å, determined by others using x-rayscattering in solution upon photodissociation ofCO from CO-myoglobin (9), was not observed inour PYP crystals. Concomitant systematic largevolume changes were also not apparent in PYPcrystals over the first 3 ps that our data span.Our data show no evidence for a protein quake(9, 10, 38), characterized by an ultrafast and largechange in Rg that occurs significantly before alarge volume change. The reason for this is un-clear and will require further experiments.Ultrafast fluorescence and transient absorption
spectroscopy of PYP have shown that excited statedecay is multi-phasic (3, 5, 39). The fast (sub-picosecond) time constants are significantly moreproductive in creating the cis-like photoproductthan the slow (picosecond) time constants; thelong-lived excited state population primarily de-caysback to thegroundstate (5,36).With excitationat 450 nm, at least 50% of the total isomerizationyield is generated with a dominant ~600-fs timeconstant (5), which agrees with our observationof a transition at ~550 fs. It should be noted thata ground state intermediate with a 3- to 6-ps lifetime has been proposed by ultrafast spectroscopy(36). However, under the conditions used here,the peak concentration of this intermediate is ex-pected to be small (5). In contrast to spectroscopictechniques that reported vibrational coherencewith 50 cm−1 and 150 cm−1 frequency (3, 40), wecould not unambiguously detect oscillations inour data. Intense femtosecond optical pumping ofPYP crystals generates both excited state andground state vibrational coherences within the3.15-THz experimental bandwidth (41). It willbe an important goal of future experiments tostructurally characterize these coherences usingfemtosecond TR-SFX. Nevertheless, our data showthat before 400 fs, there are large distortions cor-responding to a Franck-Condon (FC) excited state(42). The nuclear dynamics of the FC excited stateat 100 to 200 fs agrees with the conclusions fromultrafast spectroscopy (3, 42–45) that also suggesta distortion of the C2=C3 double bond on similartime scales, as in the PYPfast structure. The isom-erization at 550 fs through the conical intersec-tion between the excited state and ground statePES is in reasonable agreementwith the time scalesfor isomerization reported by others (3, 5, 42, 46).After passing through the conical intersection, thechromophore is cis-like and still highly strained.Thetransiently broken hydrogen bond is reestablished
quickly as the structure relaxes, exemplified bythe PYP3ps structure (Fig. 3). Further relaxationon the ground state PES completes the initialphase of the isomerization.
REFERENCES AND NOTES
1. G. Wald, Science 162, 230–239 (1968).2. Y. Mizutani, T. Kitagawa, Science 278, 443–446 (1997).3. R. Nakamura, N. Hamada, H. Ichida, F. Tokunaga,
Y. Kanematsu, J. Chem. Phys. 127, 215102 (2007).4. P. M. Champion, Science 310, 980–982 (2005).5. C. N. Lincoln, A. E. Fitzpatrick, J. J. van Thor, Phys. Chem.
Chem. Phys. 14, 15752–15764 (2012).6. A. Warshel, Nature 260, 679–683 (1976).7. M. P. Minitti et al., Phys. Rev. Lett. 114, 1–5 (2015).8. J. M. Glownia et al., Opt. Express 18, 17620–17630
(2010).9. M. Levantino et al., Nat. Commun. 6, 6772 (2015).10. D. Arnlund et al., Nat. Methods 11, 923–926 (2014).11. T. R. M. Barends et al., Science 350, 445–450 (2015).12. P. Coppens, Struct. Dyn. 2, 020901-1–020901-8 (2015).13. A. H. Zewail, Angew. Chem. Int. Ed. Engl. 39, 2586–2631
(2000).14. M. Gao et al., Nature 496, 343–346 (2013).15. S. Techert, F. Schotte, M. Wulff, Phys. Rev. Lett. 86,
2030–2033 (2001).16. C. D. Kim, S. Pillet, G. Wu, W. K. Fullagar, P. Coppens, Acta
Crystallogr. A 58, 133–137 (2002).17. J. B. Benedict et al., Chem. Commun. (Camb.) 47, 1704–1706
(2011).18. H. Ihee et al., Science 309, 1223–1227 (2005).19. R. Neutze et al., Phys. Rev. Lett. 87, 195508 (2001).20. G. Groenhof et al., J. Am. Chem. Soc. 126, 4228–4233
(2004).21. D. S. Larsen et al., Biophys. J. 86, 2538–2550 (2004).22. Y. O. Jung et al., Nat. Chem. 5, 212–220 (2013).23. F. Schotte et al., Proc. Natl. Acad. Sci. U.S.A. 109, 19256–19261
(2012).24. S. Anderson, S. Crosson, K. Moffat, Acta Crystallogr. D Biol.
Crystallogr. 60, 1008–1016 (2004).25. J. Tenboer et al., Science 346, 1242–1246 (2014).26. M. Liang et al., J. Synchrotron Radiat. 22, 514–519 (2015).27. R. Trebino et al., Rev. Sci. Instrum. 68, 3277–3295 (1997).28. C. J. Bardeen, Q. Wang, C. V. Shank, Phys. Rev. Lett. 75,
3410–3413 (1995).29. M. Schmidt et al., Acta Crystallogr. D Biol. Crystallogr. 69,
2534–2542 (2013).30. N. Hartmann et al., Nat. Photonics 8, 706–709 (2014).31. M. R. Bionta et al., Opt. Express 19, 21855–21865 (2011).32. M. Schmidt, S. Rajagopal, Z. Ren, K. Moffat, Biophys. J. 84,
2112–2129 (2003).33. K. D. Rector, M. D. Fayer, Laser Chem. 19, 19–34 (1999).34. G. Groenhof, Methods Mol. Biol. 924, 43–66 (2012).35. M. Rief, H. Grubmüller, ChemPhysChem 3, 255–261
(2002).36. D. S. Larsen et al., Biophys. J. 87, 1858–1872 (2004).37. F. Patron, S. A. Adelman, Chem. Phys. 152, 121–131 (1991).38. L. Genberg, L. Richard, G. McLendon, R. J. D. Miller, Science
251, 1051–1054 (1991).39. M. Vengris et al., Biophys. J. 87, 1848–1857 (2004).40. N. Mataga et al., Chem. Phys. Lett. 352, 220–225 (2002).41. A. T. N. Kumar, F. Rosca, A. Widom, P. M. Champion, J. Chem.
Phys. 114, 6795–6815 (2001).42. M. Creelman, M. Kumauchi, W. D. Hoff, R. A. Mathies, J. Phys.
Chem. B 118, 659–667 (2014).43. M. L. Groot et al., Biochemistry 42, 10054–10059 (2003).
44. K. Heyne et al., J. Am. Chem. Soc. 127, 18100–18106(2005).
45. L. J. van Wilderen et al., Proc. Natl. Acad. Sci. U.S.A. 103,15050–15055 (2006).
46. S. Devanathan et al., Biophys. J. 77, 1017–1023 (1999).47. H. Ihee et al., Proc. Natl. Acad. Sci. U.S.A. 102, 7145–7150
(2005).
ACKNOWLEDGMENTS
This work is supported by the NSF Science and TechnologyCenter BioXFEL (grant NSF-1231306); by NIH grantsR01GM095583 (P.F.), R01EY024363 (K.M.), and R24GM111072(V.S., R.H., and K.M.); Helmholtz Association Virtual InstituteDynamic Pathways (H.C.); and grant NSF-0952643 (M.S.). K.P. ispartly supported by grant NSF-1158138 (to D. Saldin and M.S.)and Federal Ministry of Education and Research, Germany (BMBF)grant 05K14CHA (to H.C.). J.J.v.T. acknowledges support fromthe Engineering and Physical Sciences Research Council via grantagreement EP/M000192/1. G.G. and D.M. are supported by theAcademy of Finland, D.O. by BMBF project 05K13GUK, and M.M. bythe European Union through grant FP7-PEOPLE-2011-ITN NanoMem.Use of the LCLS, SLAC National Accelerator Laboratory, issupported by the U.S. Department of Energy, Office of Science,Office of Basic Energy Sciences, under contract DE-AC02-76SF00515.Part of this work was performed under the auspices of the U.S.Department of Energy by Lawrence Livermore National Laboratory(LLNL) under contract DE-AC52-07NA27344, and M.F. wassupported by LLNL Lab-Directed Research and DevelopmentProject 012-ERD-031. C.G. thanks the PIER Helmholtz GraduateSchool for financial support. Parts of the sample injector used atLCLS for this research were funded by NIH grant P41GM103393,formerly P41RR001209. We thank the Moscow State Universitysupercomputing center and the Finnish IT Center for Science(CSC-IT) Center for Science, Finland, for computing resources.We thank M. Hunter for valuable discussions, T. Graen for help withthe computer simulations, and C. Li for assistance with injectors.The PYPref, PYPfast, PYPslow, PYP3ps, and PYP200ns structures aredeposited in the Protein Data Bank together with their respectiveweighted difference structure factor amplitudes under accessioncodes 5HD3, 5HDC, 5HDD, 5HDS, and 5HD5, respectively. M.S.prepared the proposal with input from J.J.vT., K.M., V.S., J.C.H.S.,H.N.C., A.O., and P.F.; A.A., S.B., M.L., J.S.R., and J.E.K. operatedthe CXI instrument, including the time tool and the femtosecondlaser; and K.P., A.B., J.T., S.B., T.A.W., N.Z., O.Y., and T.D.G.analyzed the SFX data. C.D.M.H and J.J.vT. set up the FROG atthe CXI instrument; G.G. and D.M. performed QM/MM calculations;J.T., J.B., D.O., P.L.X., C.G., C.K., and M.S. prepared proteinand grew nano- and microcrystals; D.DeP., C.K., C.C., S.R.-C.,J.D.C., M.M., G. K., and U.W. provided and operated the injectorsystem; M.F., R.F., M.S., J.T., P.F., D.O., and C.G. wrote theelectronic log; M.F., M.S, J.T., J.S.R., J.J.vT., and K.M. discussedfemtosecond laser excitation; J.T., M.S, V.S, R.H, C.D.M.H., andJ.J.vT. performed preliminary ultrafast experiments on crystals;M.S. calculated and analyzed the difference maps; and M.S.,K.P., K.M., G.G., P.F., and J.J.vT. wrote the manuscript, withimprovements from all authors.
SUPPLEMENTARY MATERIALS
www.sciencemag.org/content/352/6286/725/suppl/DC1Materials and MethodsSupplementary TextFigs. S1 to S12Tables S1 to S5References (48–84)
27 September 2015; accepted 5 April 201610.1126/science.aad5081
SCIENCE sciencemag.org 6 MAY 2016 • VOL 352 ISSUE 6286 729
RESEARCH | REPORTSon June 12, 2018
http://science.sciencemag.org/
Dow
nloaded from
proteinFemtosecond structural dynamics drives the trans/cis isomerization in photoactive yellow
Moffat, Jasper J. van Thor and Marius SchmidtAbbas Ourmazd, Peter Schwander, Uwe Weierstall, Matthias Frank, Petra Fromme, Anton Barty, Henry N. Chapman, KeithThomas D. Grant, Jason E. Koglin, Gihan Ketawala, Raimund Fromme, Vukica Srajer, Robert Henning, John C. H. Spence, Brayshaw, Christopher Kupitz, Chelsie Conrad, Shatabdi Roy-Chowdhury, Jesse D. Coe, Markus Metz, Paulraj Lourdu Xavier,Morozov, Dominik Oberthuer, Cornelius Gati, Ganesh Subramanian, Daniel James, Yun Zhao, Jake Koralek, Jennifer
DmitryBasu, Sébastien Boutet, Daniel P. DePonte, Mengning Liang, Thomas A. White, Nadia A. Zatsepin, Oleksandr Yefanov, Kanupriya Pande, Christopher D. M. Hutchison, Gerrit Groenhof, Andy Aquila, Josef S. Robinson, Jason Tenboer, Shibom
DOI: 10.1126/science.aad5081 (6286), 725-729.352Science
, this issue p. 725Scienceisomerization of the chromophore in photoactive yellow protein and the associated structural changes in the protein.femtosecond crystallography in the time range of 100 fs to 3 ms. This allowed for the real-time tracking of the trans-cis
used x-ray pulses emitted by a free electron laser source to conduct time-resolved serialet al.the protein. Pande structural change in a protein that begins when absorption of a photon causes isomerization of a chromophore bound to
Many biological processes depend on detecting and responding to light. The response is often mediated by aVisualizing a response to light
ARTICLE TOOLS http://science.sciencemag.org/content/352/6286/725
MATERIALSSUPPLEMENTARY http://science.sciencemag.org/content/suppl/2016/05/04/352.6286.725.DC1
REFERENCES
http://science.sciencemag.org/content/352/6286/725#BIBLThis article cites 82 articles, 12 of which you can access for free
PERMISSIONS http://www.sciencemag.org/help/reprints-and-permissions
Terms of ServiceUse of this article is subject to the
is a registered trademark of AAAS.Sciencelicensee American Association for the Advancement of Science. No claim to original U.S. Government Works. The title Science, 1200 New York Avenue NW, Washington, DC 20005. 2017 © The Authors, some rights reserved; exclusive
(print ISSN 0036-8075; online ISSN 1095-9203) is published by the American Association for the Advancement ofScience
on June 12, 2018
http://science.sciencemag.org/
Dow
nloaded from