protein interaction computational (inferred) experimental (observed)
Post on 20-Dec-2015
225 views
TRANSCRIPT

Protein interaction
• Computational (inferred)
• Experimental (observed)

Inference of Protein function

Guilt by association
Five methods for inferring functional interactions: Complexes, PathwaysRosetta stone Phylogenetic profiles Expression profiles Gene neighbors Operon method
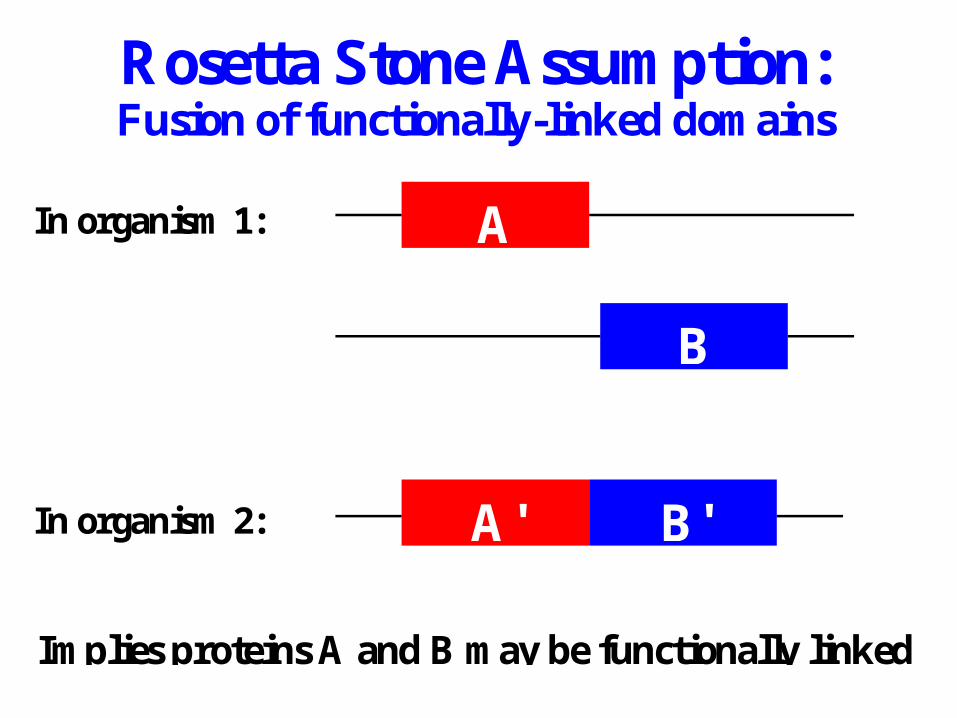
Rosetta Stone Assumption: Fusion of functionally-linked domains
In organism 1:
A
In organism 2:
Implies proteins A and B may be functionally linked
A
A'
B
B'

Five Known Rosetta Stone Links:
Marcotte et al., Science, 285, pp. 751-753 (1999)
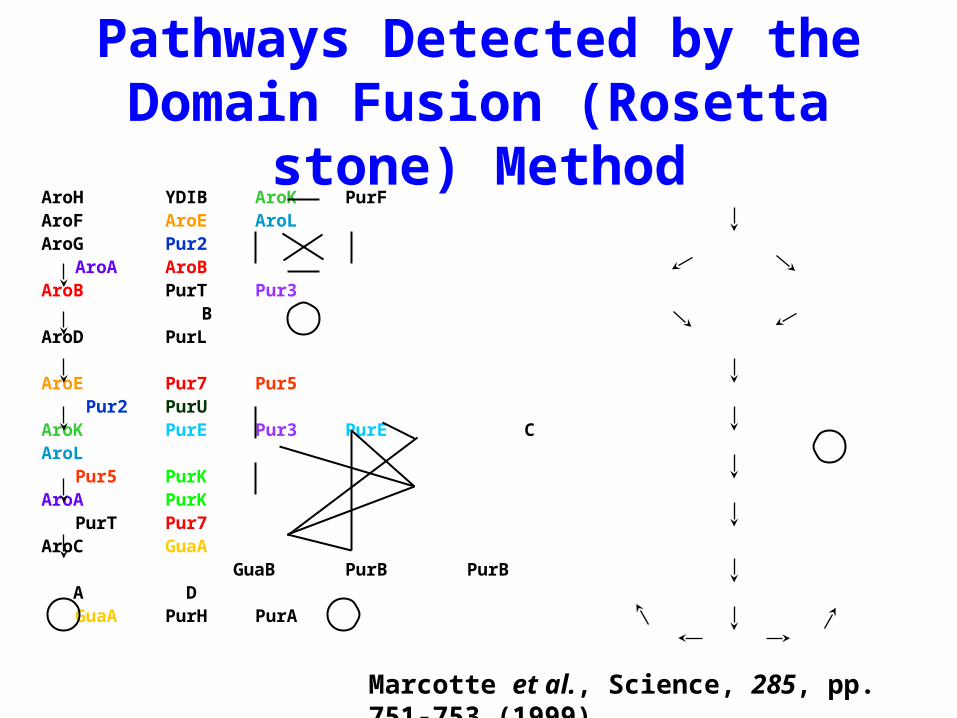
Pathways Detected by the Domain Fusion (Rosetta stone) Method
AroH YDIB AroK PurFAroF AroE AroLAroG Pur2
AroA AroBAroB PurT Pur3
BAroD PurL
AroE Pur7 Pur5 Pur2 PurU
AroK PurE Pur3 PurE CAroL
Pur5 PurKAroA PurK
PurT Pur7AroC GuaA
GuaB PurB PurB A D
GuaA PurH PurA
Marcotte et al., Science, 285, pp. 751-753 (1999)
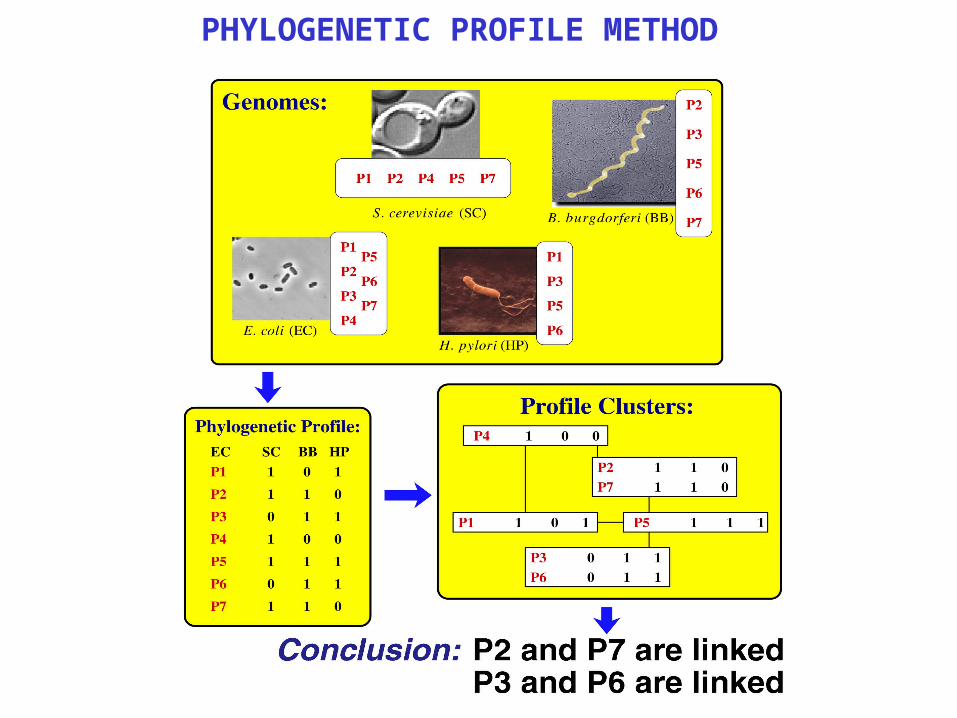
PHYLOGENETIC PROFILE METHOD
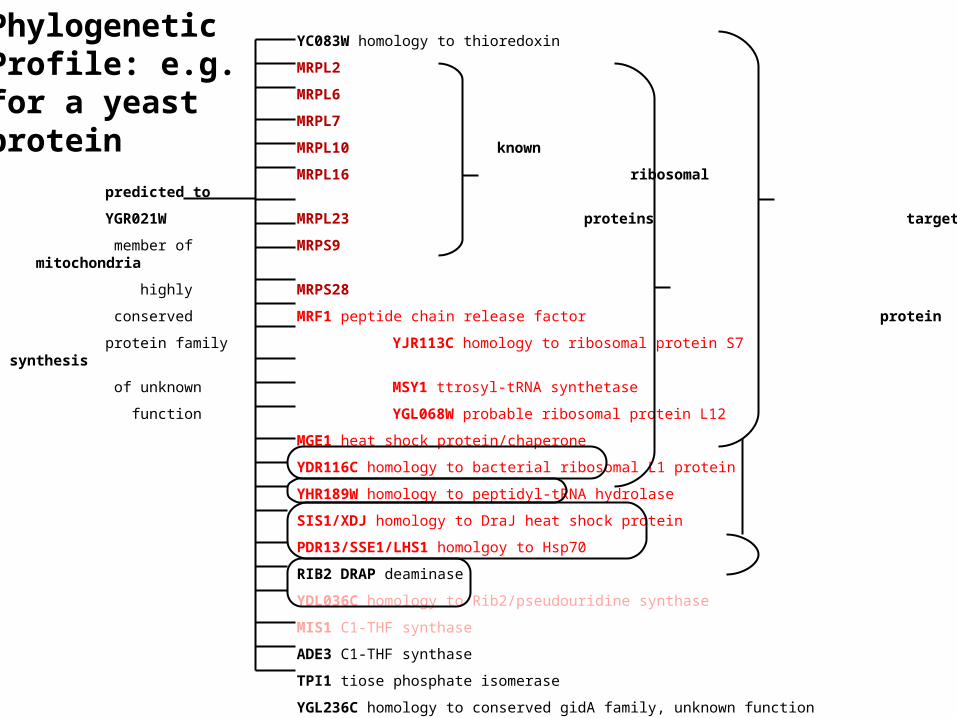
YC083W homology to thioredoxin
MRPL2
MRPL6
MRPL7
MRPL10 known
MRPL16 ribosomal predicted to
YGR021W MRPL23 proteins target
member of MRPS9 mitochondria
highly MRPS28
conserved MRF1 peptide chain release factor protein
protein family YJR113C homology to ribosomal protein S7 synthesis
of unknown MSY1 ttrosyl-tRNA synthetase
function YGL068W probable ribosomal protein L12
MGE1 heat shock protein/chaperone
YDR116C homology to bacterial ribosomal L1 protein
YHR189W homology to peptidyl-tRNA hydrolase
SIS1/XDJ homology to DraJ heat shock protein
PDR13/SSE1/LHS1 homolgoy to Hsp70
RIB2 DRAP deaminase
YDL036C homology to Rib2/pseudouridine synthase
MIS1 C1-THF synthase
ADE3 C1-THF synthase
TPI1 tiose phosphate isomerase
YGL236C homology to conserved gidA family, unknown function
YOL060C homology to hypothetical C. elegans protein M02F4.4
PhylogeneticProfile: e.g.for a yeast protein
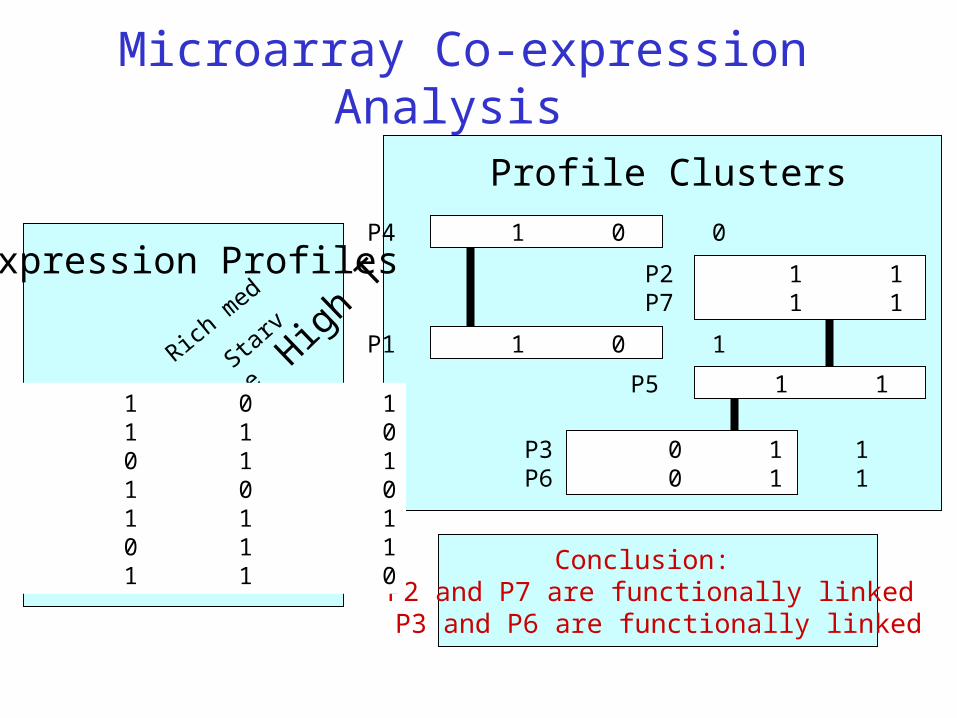
Microarray Co-expression Analysis
Conclusion: P2 and P7 are functionally linked P3 and P6 are functionally linked
Expression Profiles
Rich m
ed
Starve
High T
P1 1 0 1P2 1 1 0P3 0 1 1P4 1 0 0P5 1 1 1P6 0 1 1P7 1 1 0
Profile Clusters
P4 1 0 0
P1 1 0 1
P5 1 1 1
P2 1 1 0 P7 1 1 0
P3 0 1 1 P6 0 1 1

Inferring Functional Linkages from the Gene Neighbor Method
genome 1
. . .genome 2 genome 3 genome 4
A
AA
A
B
B
BB
C
C
CC
A
B
C
A statistically significant correlation is observed between the positions of proteins A and B across multiple genomes. A functional relationship is inferred between proteins A and B, but not between the other pairs of proteins:
gene A gene B gene C
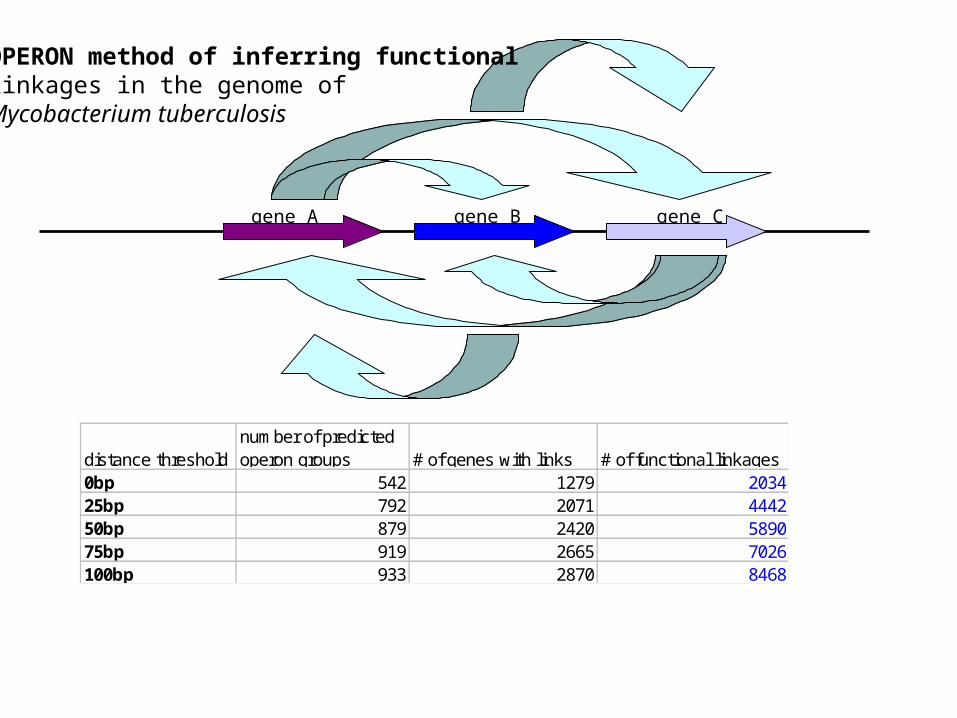
OPERON method of inferring functional linkages in the genome of Mycobacterium tuberculosis
distance thresholdnumber of predicted operon groups # of genes with links # of functional linkages
0bp 542 1279 203425bp 792 2071 444250bp 879 2420 589075bp 919 2665 7026100bp 933 2870 8468

Examples of Inferred Protein Networks
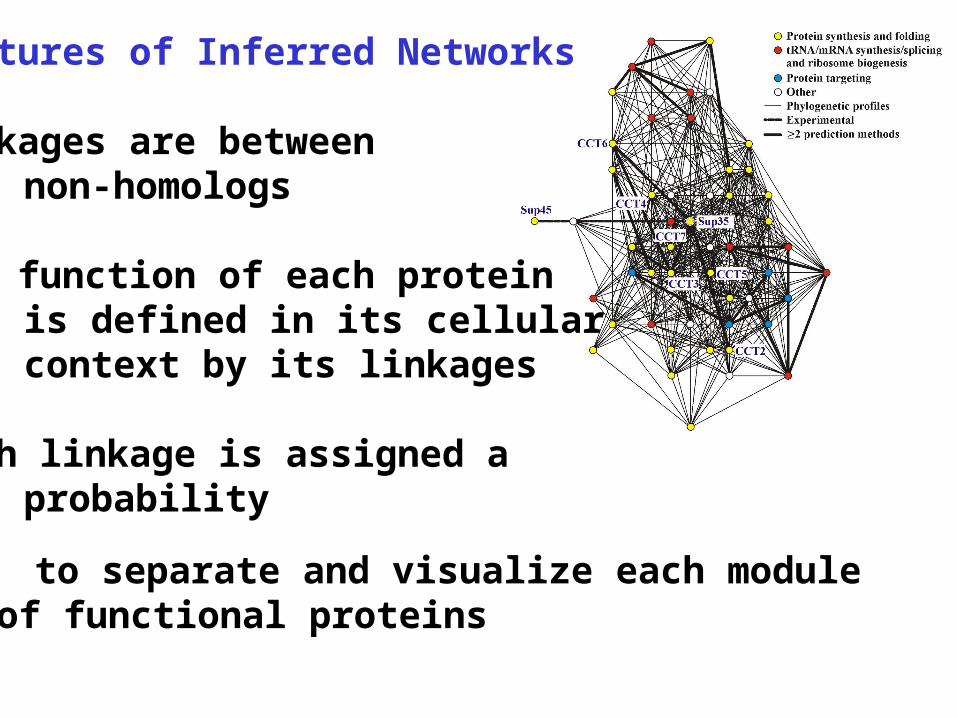
Features of Inferred Networks
Linkages are between non-homologs
The function of each proteinis defined in its cellularcontext by its linkages
Each linkage is assigned a probability
Need to separate and visualize each moduleof functional proteins

Prions
• Can spontaneously change shape (10-5)
• Can induce shape change in other proteins
• Contagious, inheritable
• Sup35– Translation termination factor– Prion: reads through stop codons
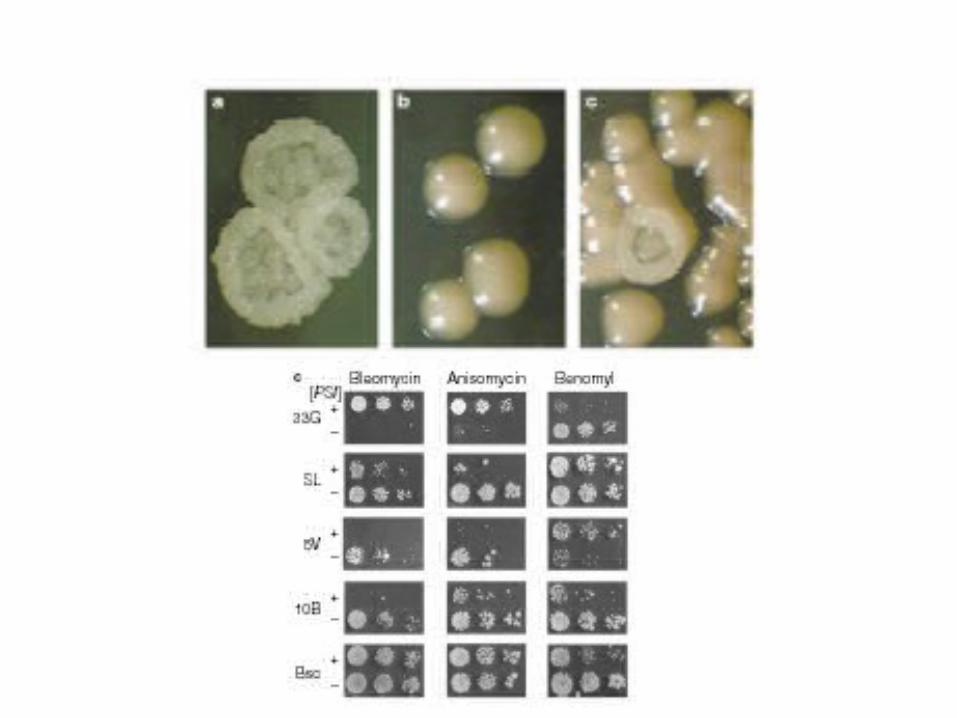
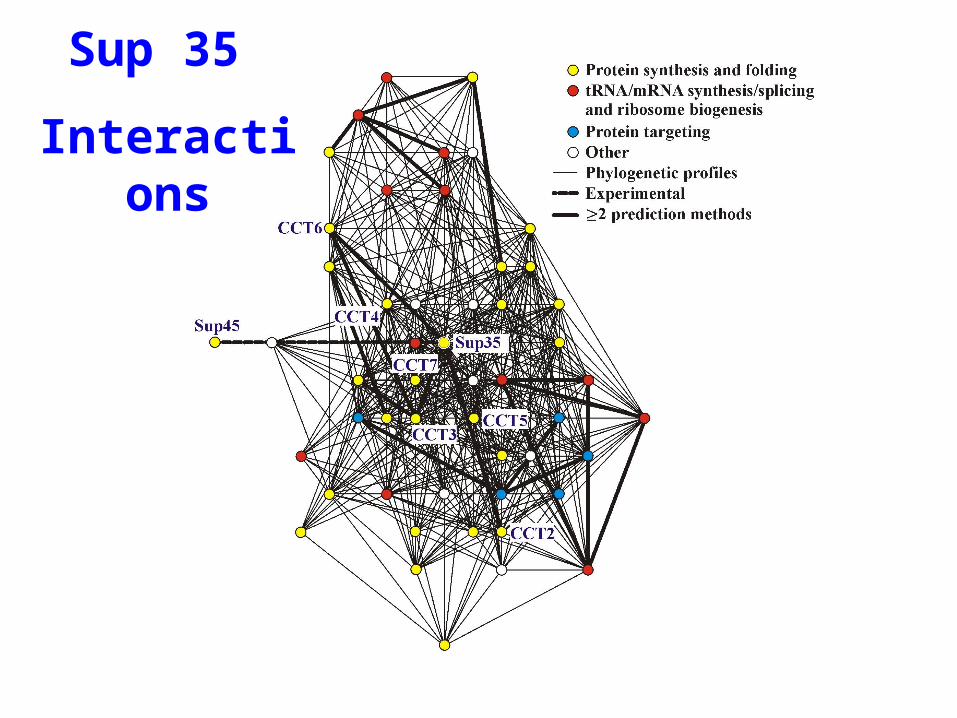
Sup 35
Interactions

A Network of Proteins Related to Flagella
fliA
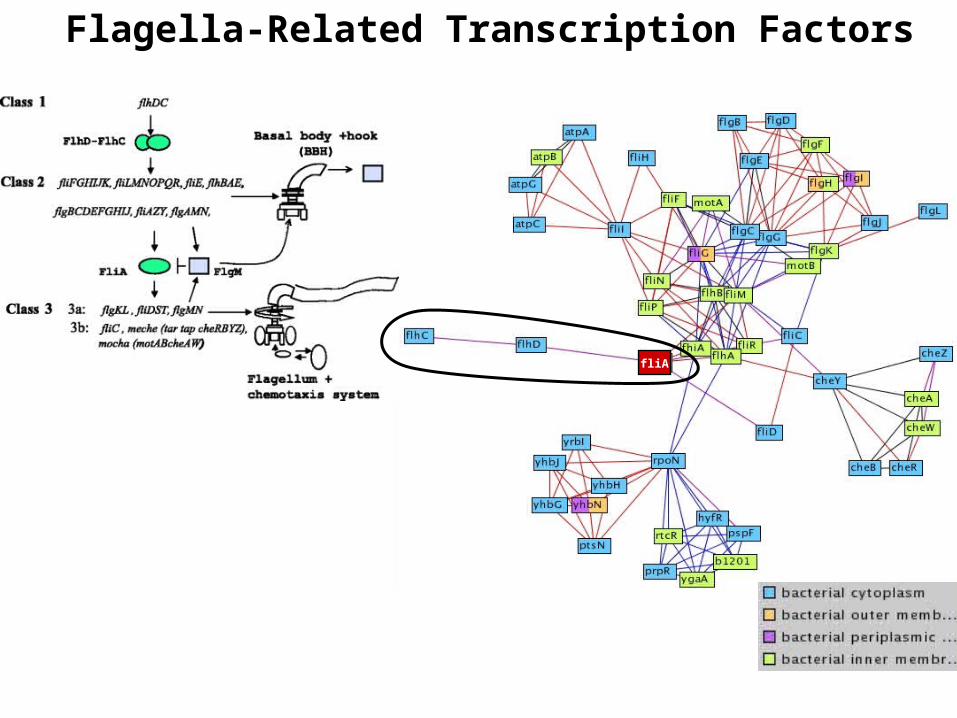
fliA
Flagella-Related Transcription Factors

fliA
Flagella-Specific ATP Synthase
fliA
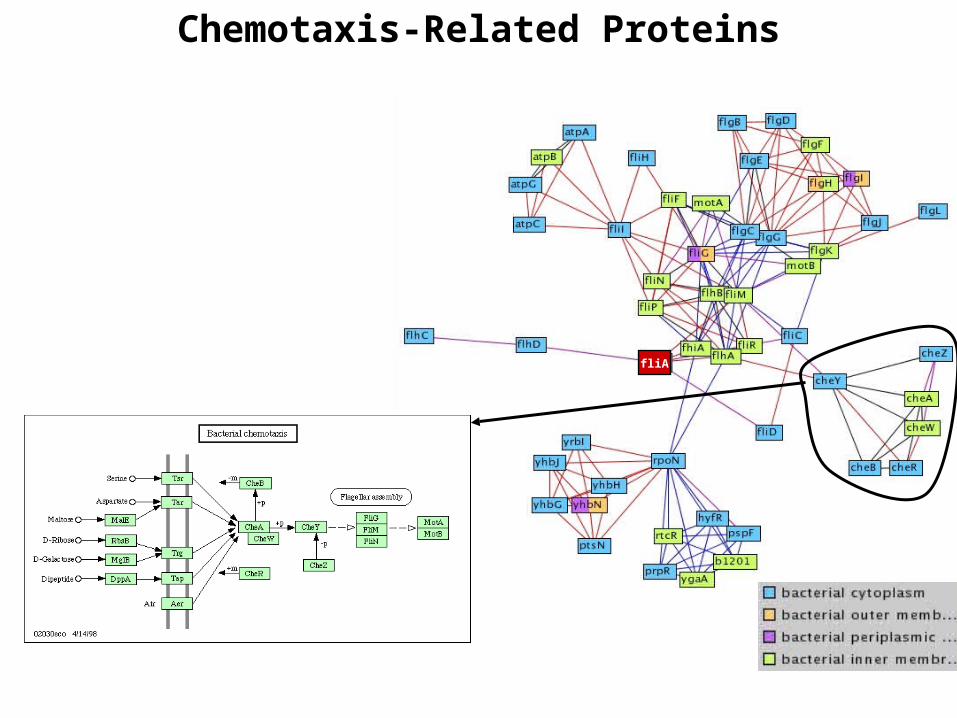
Chemotaxis-Related Proteins
Quantitative Assessment of Inferred Protein Linkages

Assessing Functional Linkages by method of Keyword Recovery
X A Y
Z
Is the linkage inferred between A and Y valid ?
Compare the keyword annotations common toA and Y, with the number expected at random= “signal-to-noise”

Assessing Inference of Linkages by Recovery of Keywords
YEAST GENOME (Marcotte et al. Nature, 1999)
Inferrence Method # functional Signal links to noise
Individual Methods:Experiment (2-hybrid) 500 8Phylogenetic Profiles 20,749 5Rosetta Stone 50,459 3Correlated mRNA expression 26,013 2
Combined methods:
Links by ≥ 2 methods 1,271 8

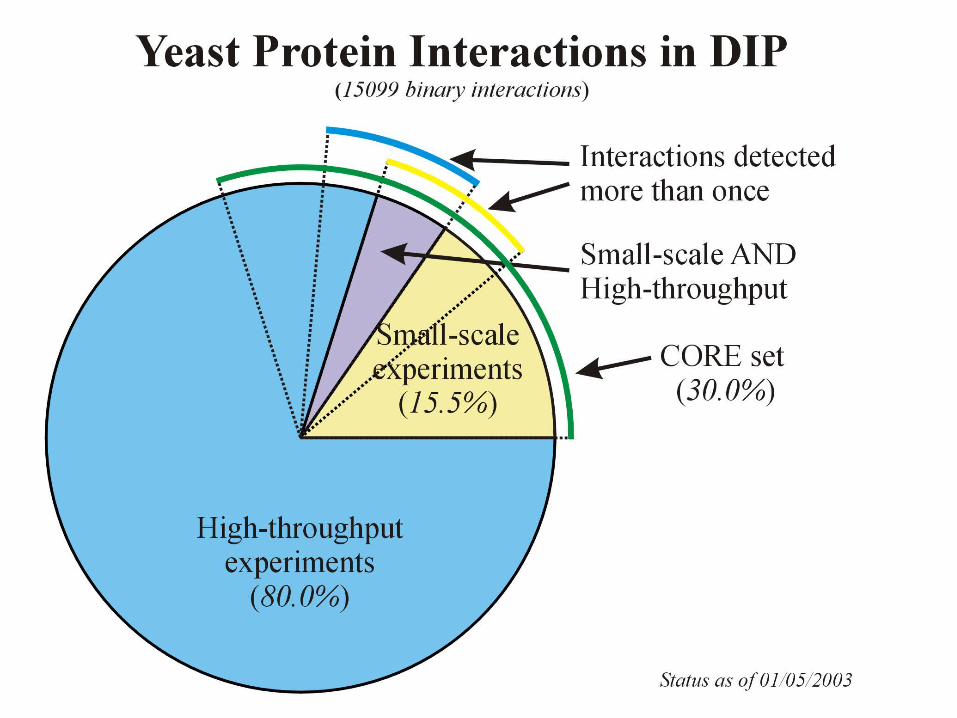
Observed Functional Linkages
Database of Interacting Proteins
www.dip.doe-mbi.ucla.edu
Experimentally detected interactions from the scientific literature
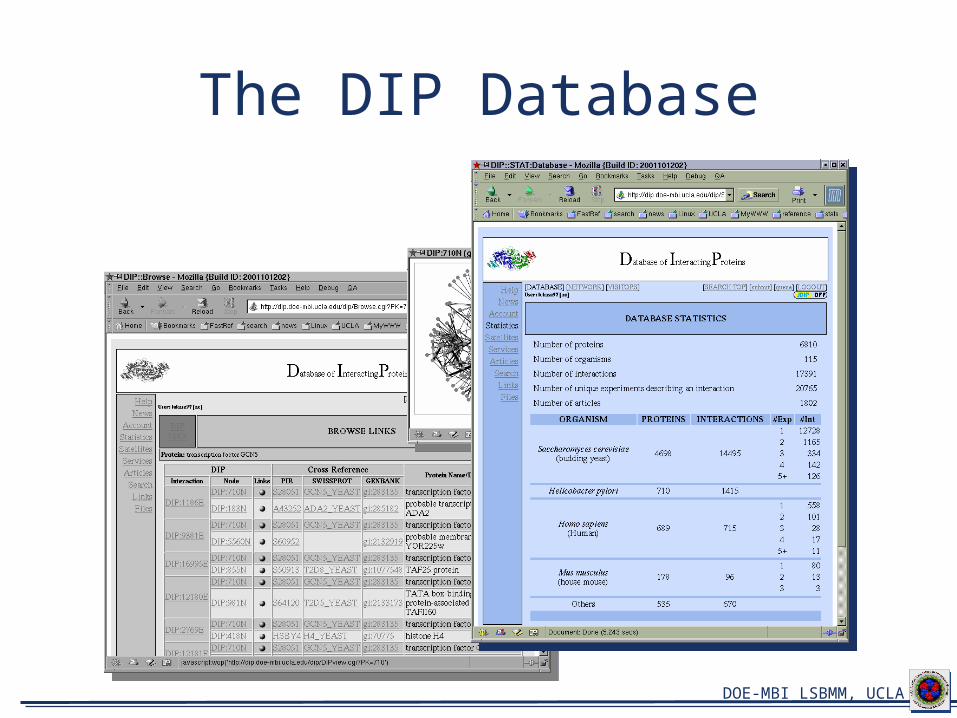
The DIP Database
DOE-MBI LSBMM, UCLA

Paul D. Boyer Nature (1999) XRay structure Stock et al. Science (1999)
Two-hybrid assayMoritani C et al. Biochim Biophys (1996)
ATP Synthase ATP Synthase in DIP
HOW PROTEIN INTERACTIONS ARE REPRESENTED IN DIP
0
50
100
150
200
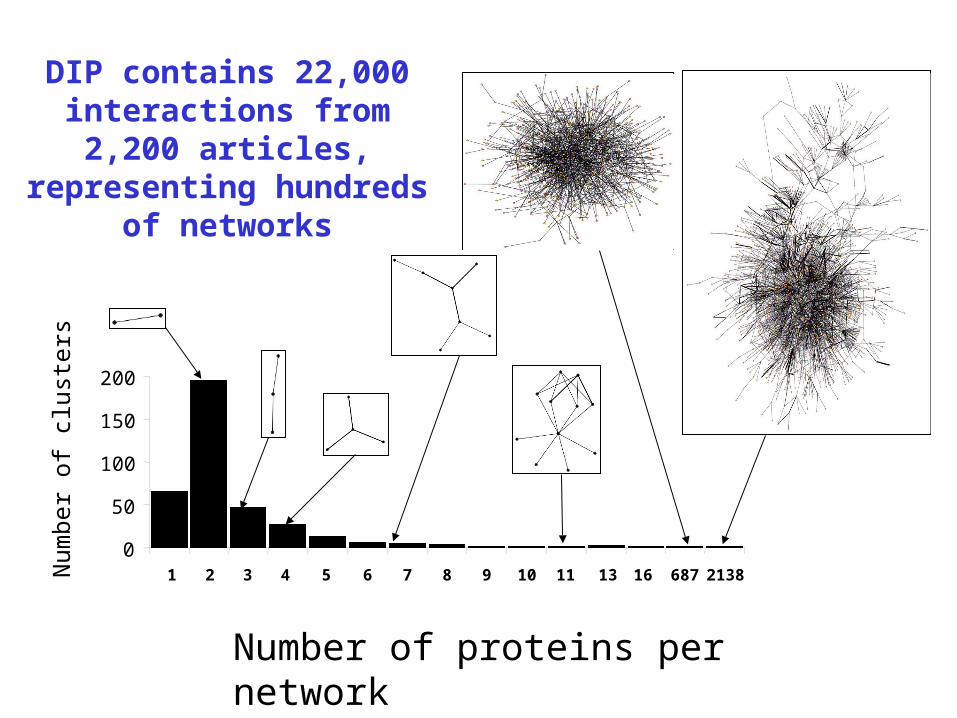
1 2 3 4 5 6 7 8 9 10 11 13 16 687 2138
Number of proteins per network
Num
ber
of c
lust
ers
DIP contains 22,000 interactions from 2,200 articles,
representing hundreds of networks
Assessing DIP reliability with mRNA expression data (ERP)

Coexpression MeasureCoexpression Measure
i ii BAd 2)(
Euclidean distance
Protein A
Pro
tein
B
expression levellog(e/eref)
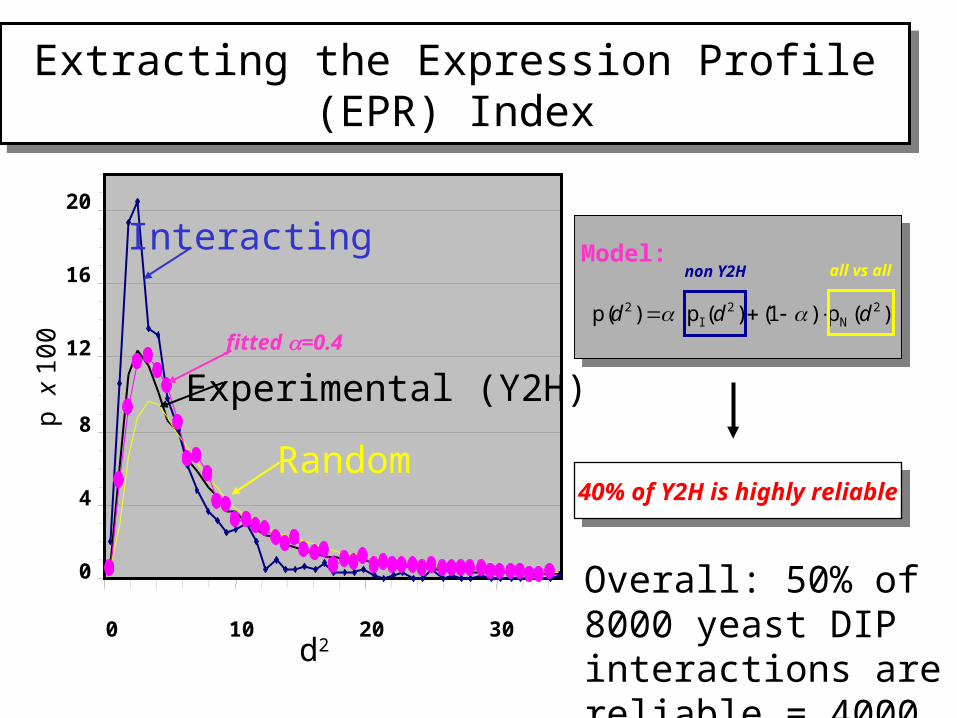
Extracting the Expression Profile (EPR) IndexExtracting the Expression Profile (EPR) Index
0
4
8
12
16
20
0 10 20 30d2
p x
100
)(p)1()(p)p( 2N
2I
2 ddd
Model:non Y2H all vs all
40% of Y2H is highly reliable40% of Y2H is highly reliable
Overall: 50% of 8000 yeast DIP interactions are reliable = 4000
Interacting
Experimental (Y2H)
Random
fitted =0.4
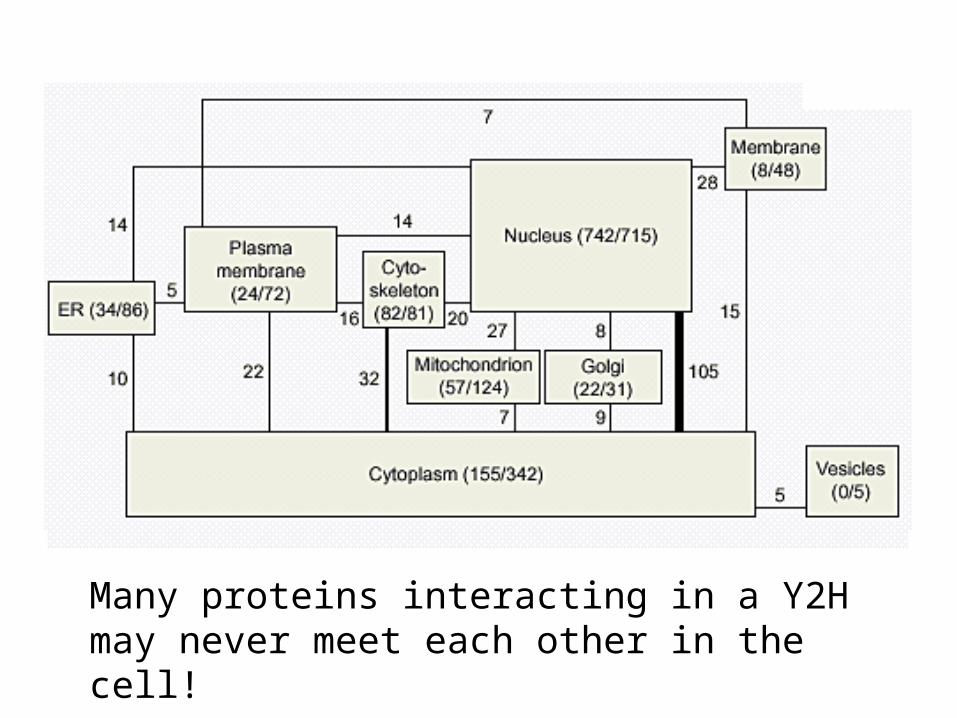
Many proteins interacting in a Y2H may never meet each other in the cell!

Expression Profile Data Assesses Interaction Data(EPR Index; Deane et al. Molec & Cell Proteomics, 2002)
DOE-MBI LSBMM, UCLA
Uetz, P. et al.; Nature 403: 623-627 (2000)Uetz, P. et al.; Nature 403: 623-627 (2000)
Ito, T. et al.; PNAS 97:1143-47 (2000)Ito, T. et al.; PNAS 98:4569-74 (2001)
Ito, T. et al.; PNAS 97:1143-47 (2000)Ito, T. et al.; PNAS 98:4569-74 (2001)
Ho, Y. et al.; Nature 415:180-183 (2002)Ho, Y. et al.; Nature 415:180-183 (2002)
Gavin, A.C. et al.; Nature 415: 141-147 (2002) Gavin, A.C. et al.; Nature 415: 141-147 (2002)
7.8+/-3.7%
19.5+/-3.7%
48.7+/-6.9%
89.5+/-6.6%
Measured vs Inferred Functional Interactions
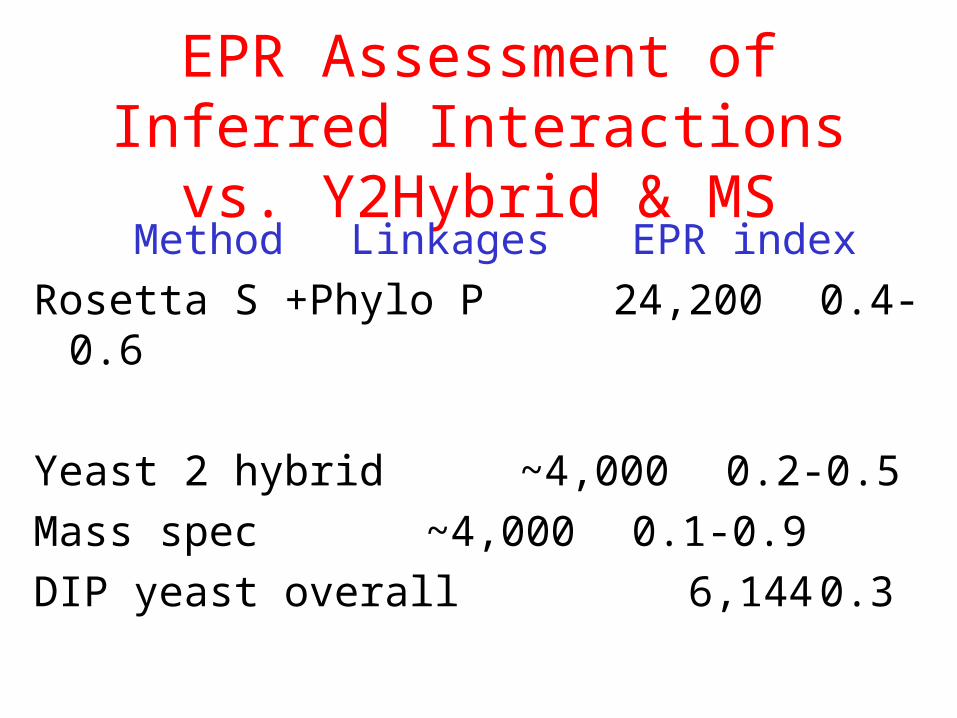
EPR Assessment of Inferred Interactions vs. Y2Hybrid & MS
Method Linkages EPR index
Rosetta S +Phylo P 24,200 0.4-0.6
Yeast 2 hybrid ~4,000 0.2-0.5
Mass spec ~4,000 0.1-0.9
DIP yeast overall 6,144 0.3
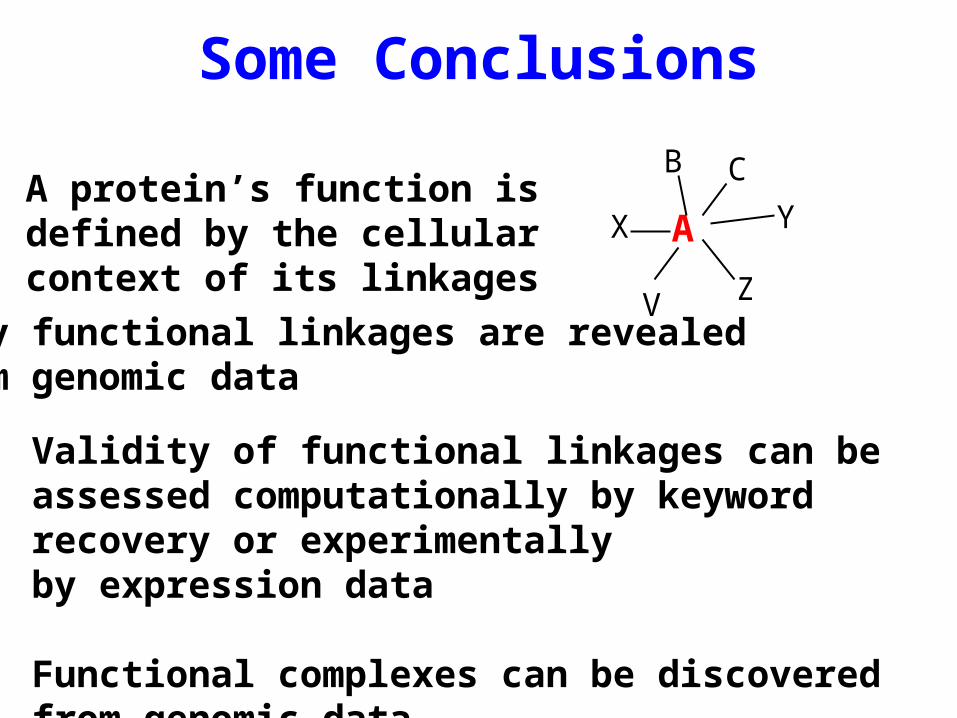
Some Conclusions
AX Y
Z
B
V
CA protein’s function is defined by the cellular context of its linkages
Many functional linkages are revealed from genomic data
Validity of functional linkages can be assessed computationally by keyword recovery or experimentallyby expression data
Functional complexes can be discovered from genomic data