protected areas in today's world: their values and benefits for the
TRANSCRIPT
36CBD Technical Series No. 36Secretariat of the
Convention on Biological Diversity
Protected Areas in Today’s World: Their Values and Benefits for the Welfare of the Planet
Protected Areas in Today’s World: Their Values and Benefits for the
Welfare of the Planet
CBD Technical Series No. 36
Protected Areas in Today’s World: Their Values and Benefits for the Welfare of the Planet
ii
Published by the Secretariat of the Convention on Biological Diversity. ISBN: 92-9225-082-5 Copyright © 2008, Secretariat of the Convention on Biological Diversity
The designations employed and the presentation of material in this publication do not imply the expres-sion of any opinion whatsoever on the part of the Secretariat of the Convention on Biological Diversity concerning the legal status of any country, territory, city or area or of its authorities, or concerning the delimitation of its frontiers or boundaries.
The views reported in this publication do not necessarily represent those of the Convention on Biological Diversity nor those of the reviewers.
This publication may be reproduced for educational or non-profit purposes without special permission from the copyright holders, provided acknowledgement of the source is made. The Secretariat of the Convention would appreciate receiving a copy of any publications that uses this document as a source.
CitationSecretariat of the Convention on Biological Diversity (2008). Protected Areas in Today’s World: Their Values and Benefits for the Welfare of the Planet. Montreal, Technical Series no. 36, i-vii + 96 pages.
Compiled by Lisa Janishevski, Kieran Noonan-Mooney, Sarat Babu Gidda and Kalemani Jo Mulongoy
For further information, please contactSecretariat of the Convention on Biological DiversityWorld Trade Centre413 St. Jacques Street, Suite 800Montreal, Quebec, Canada H2Y 1N9Phone: 1 (514) 288 2220Fax: 1 (514) 288 6588E-mail: [email protected]: http://www.cbd.int
Typesetting: Black Eye Design
Cover Photos
top to bottom: Rangers walking: Virunga National Park, Democratic Republic of Congo (credit Charles Besançon). Ocean scene: Bonifacio Transboundary Marine Park, Sardinia (credit Charles Besançon), Hindu Temple, Cambodia (credit Stuart Chape), Kouchibouguac National Park, Canada (credit Gilles Daigle)
ContentsForeword
Dr. Ahmed Djoghlaf ....................................................................................................................................... v
PreFACe ................................................................................................................................................................ vi
1. ProTeCTed AreAS — For LIFe’S SAKeNikita (Nik) Lopoukhine ................................................................................................................................ 1
2. ProTeCTed AreAS ANd PoVerTY redUCTIoNLea M. Scherl and Lucy Emerton .................................................................................................................. 4
3. PoVerTY ANd ProTeCTed AreASStephanie Mansourian, Liza Higgins-Zogib, Nigel Dudley and Sue Stolton ............................................. 18
4. LoCAL BeNeFITS oF ProTeCTed AreAS: PerSPeCTIVeS ANd eXPerIeNCeS oF CoNSerVATIoN INTerNATIoNALKatrina Brandon and Aaron Bruner .......................................................................................................... 29
5. drINKING wATer ANd ProTeCTed AreASNigel Dudley and Sue Stolton ...................................................................................................................... 37
6. ProTeCTed AreAS ANd PLANT AGroBIodIVerSITYSue Stolton, Nigel Maxted, Shelagh Kell, Brian Ford-Lloyd and Nigel Dudley ......................................... 42
7. THe SPIrITUAL dIMeNSIoN oF ProTeCTed AreAS: oVerLooKed ANd UNderVALUedLiza Higgins-Zogib ....................................................................................................................................... 50
8. dIVerSIFYING ProTeCTed AreA GoVerNANCe: eCoLoGICAL, SoCIAL, ANd eCoNoMIC BeNeFITSAshish Kothari .............................................................................................................................................. 57
9. ProTeCTed AreAS ANd HUMAN weLL-BeING: eXPerIeNCeS FroM INdoNeSIA, MeXICo, PerU ANd VeNeZUeLALuis Pabon-Zamora, Akhmad Fauzi, Abdul Halim, Juan Bezaury-Creel, EduardoVega-Lopez, Fernando Leon, Lila Gil and Vanessa Cartaya ........................................................................................................... 67
10. IMProVING ProTeCTed AreA FINANCe THroUGH ToUrISMPaul Eagles and Oliver Hillel ....................................................................................................................... 77
11. eCoSYSTeMS ANd HUMAN weLL-BeING: UNeSCo BIoSPHere reSerVeS AS LeArNING LABorATorIeS For SUSTAINABLe deVeLoPMeNTAna Persic, Salvatore Arico, Guillen Calvo and Natarajan Ishwaran ....................................................... 87
INdeX BY AUTHor ............................................................................................................................................ 96

v
Foreword
Foreword
Protected areas are important tools for the conservation of biological diversity and are cornerstones of sustainable development strategies. Aside from their environmental benefits, they can also generate sig-nificant economic resources. As such protected areas are crucial for attaining the objectives of the Convention on Biological Diversity and meeting the 2010 biodiversity target and the Millennium Development Goals.
Currently numbering in excess of 100,000 and covering about 11.6% of the Earth’s terrestrial surface, protected areas harbor great bio-logical richness and are a major source of material and non-material
wealth. They represent important stocks of natural, cultural and social capital, supporting the livelihood and wellbeing of many. For example a study conducted in 2003 found that 33 of the world’s 105 largest cities obtain a significant proportion of their drinking water from protected areas. Providing this water through other means would likely be a costly endeavor and beyond the means of some cities.
In addition to the biodiversity benefits and ecosystem services that protected areas provide, they can also create investment opportunities and employment. For example, in Guatemala, the Maya Biosphere Reserve generates an annual income of approximately US $47 million while creating employment for 7,000 people. In addition protected areas can help guard against environmental disturbances and the impacts of climate change by helping society to both mitigate and adapt to stressors. As an illustration it has been estimated that protected coral reef ecosystems provide coastal protection services worth $ 9 billion per year. This technical series reviews these benefits as well as examines the importance of protected areas to local communities, tourism, agrobiodiversity, spirituality, capacity building, poverty reduction, and sustainable development.
Unfortunately, despite the significant monetary and non-monetary values of protected areas their importance remains poorly understood and greatly undervalued. As a result protected areas, in many instances, do not receive adequate financing or resources, making their effective management a challenging task.
The articles presented in this technical series illustrate the ecological, economic, social and cultural benefits that protected areas provide, in an attempt to develop a greater understanding of the role of protected areas in both conserving biological diversity and in supporting human wellbeing. I would like to thank all the authors for their contributions as well as express my deepest gratitude to the Governments of Belgium and Italy for making available the necessary financial resources to publish this technical series in time for the second meeting of the Ad Hoc Open-ended Working Group on Protected Areas.
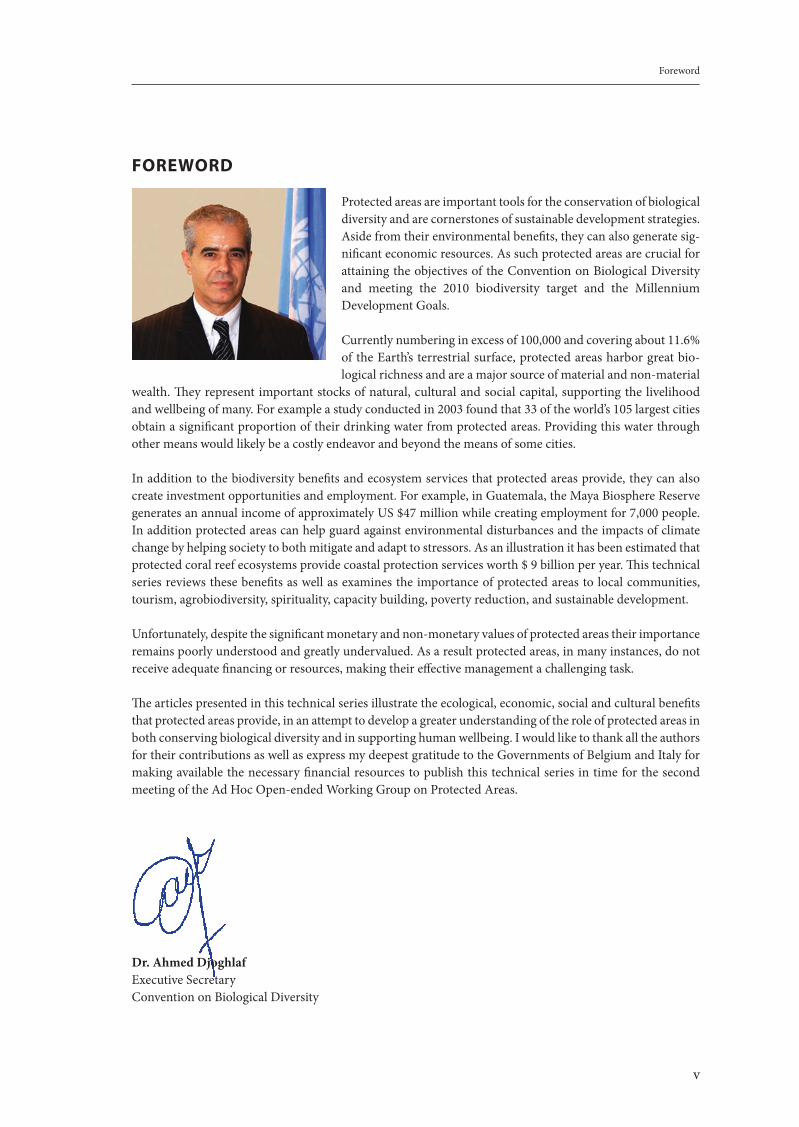
Dr. Ahmed DjoghlafExecutive SecretaryConvention on Biological Diversity
Protected Areas in Today’s World: Their Values and Benefits for the Welfare of the Planet
vi
PreFACe
Clean water, clean air, access to food sources, buffers of weather events, cultural and spritual values, and raw materials for consumers, are some of the ecosystem services that ensure the well-being of humanity, especially the poor who most directly rely on them. Degradation of land- and seascapes triggers losses in biological diversity and ecosystem services, ultimately diminishing not only quality of life, but cultural and material wealth as well. Well-managed protected areas are a proven mechanism in the conservation and maintenance of healthy ecosystems and the services they provide. The immense value of protected areas is such that they should be cherished: green emeralds of the terrestrial realm and blue sapphires of the oceans. Indeed, they are of greater significance than any jewel. Without healthy ecosystems, lasting and sustained social and economic development is impossible.
This edition of the Convention on Biological Diversity (CBD) Technical Series showcases articles from some of the most ardent guardians of these jewels. Intrinsic and extrinsic uses and importance of protected areas around the globe are presented to provide practical ammunition in the decision-making process. Chapter 1 serves as an introduction to the multiple ways people benefit from protected areas that are later described more fully in each article.
Chapter 2 describes the results of studies and analyses addressing the links between conservation and poverty reduction including social, cultural, governance and economic perspectives, important to local subsistence and national economies. The contribution of protected areas to the well-being of the people who live in and around them is described in Chapter 3. In Chapter 4, key case studies from the experience of Conservation International and community practitioners are presented including values of innate ecosystem services to direct benefits from conservation activities.
Around a third of the world’s largest cities rely on protected forests to help to maintain good quality drinking water supplies. In Chapter 5 we find that many protected areas provide important and sometimes under-valued additional benefits in terms of their water services. Compensation for communities that protect these forests is also discussed. Chapter 6 explores many successful examples of agrobiodiversity conservation in protected areas world wide but also shows how these areas are under threat. While protected areas are a first step in conservation, specific management actions may also be needed to maximise agrobiodiversity conservation.
The interaction of spiritual elements, faith groups, and protected areas is considered in Chapter 7. A call is made for protected area managers, administrators, and policy-makers to acknowledge these important values and their potential to contribute to the targets of the CBD. Chapter 8 explores the potential of new kinds of protected area governance, moving away from conventional government managed models, and towards more collaborative and community-based models.
Chapter 9 presents examples from Indonesia, Mexico, Peru and Venezuela of protected area costs and benefits to human well-being, specifically within the sectors of tourism and fisheries and also considering carbon storage functions, water issues, and benefits of protected areas to national economies. Chapter 10 discusses protected areas as major tourism assets, particularly for developing countries. Practical examples of how tour-ism can contribute significantly more than it does today to funding implementation of the CBD Programme of Work on Protected Areas (PoWPA). The UNESCO Biosphere Reserves are presented in Chapter 11 as laboratories for sustainable development. The article highlights the resulting socio-economic and poverty reduction benefits, which contribute to human well-being.
These articles taken as a whole provide strong and compelling evidence of the ways in which humans benefit from protected areas, and often with high overall returns on initial investments made. These emeralds and sapphires are cherished for their vast expanses and inherent beauty, but they also make an offer the world
vii
Preface
cannot afford to refuse- the chance at a sustainable future for all human beings as jewels in the crown of the PoWPA.Chapter 9 presents examples from Indonesia, Mexico, Peru and Venezuela of protected area costs and benefits to human well-being, specifically within the sectors of tourism and fisheries and also consider-ing carbon storage functions, water issues, and benefits of protected areas to national economies. Chapter 10 discusses protected areas as major tourism assets, particularly for developing countries. Practical examples of how tourism can contribute significantly more than it does today to funding implementation of the CBD Programme of Work on Protected Areas (PoWPA). The UNESCO Biosphere Reserves are presented in Chapter 11 as laboratories for sustainable development. The article highlights the resulting socio-economic and poverty reduction benefits, which contribute to human well-being.
These articles taken as a whole provide strong and compelling evidence of the ways in which humans benefit from protected areas, and often with high overall returns on initial investments made. These emeralds and sapphires are cherished for their vast expanses and inherent beauty, but they also make an offer the world cannot afford to refuse- the chance at a sustainable future for all human beings as jewels in the crown of the PoWPA.

1
Protected Areas — For Life’s Sake
ProTeCTed AreAS — For LIFe’S SAKe1.
Nikita (Nik) LopoukhineIUCN World Commission on Protected Areas
Throughout the history of protected areas the common thread is the focus on providing for life now and into the future. Indeed, the Convention on Biological Diversity recognizes protected areas as a fundamental tool for safeguarding biodiversity, life itself. The intrinsic values of biodiversity are arguably reason enough for safeguarding life through protected areas.
Yet, an equally valuable argument can be made that human well-being is dependent directly and indirectly on biodiversity. Nature’s genetic, species and ecosystem diversity is a source of fibre, food and ecosystem services, such as fresh water and clean air, assures the well being of humans around the world. A sound environment with a full complement of species underpins economic stability and human livelihoods over time.
Protected areas are the critical tool to conserve biodiversity in the face of the global crisis of species extinc-tion and the loss of the world’s natural capacity to support all life and human existence. At the same time, the protected resources are often essential to assuring healthy communities.
Protected areas provide for life’s essentials. They protect natural resources that are critical to many people on earth. Within these areas, genetic diversity is permitted to evolve in response to natural selection pressures. These genetic resources are a source of many new products. As well, they serve to protect major ecosystem services essential to us all. Water, food, clothes, shelter, transport, and medicines are thus available within and beyond the borders of protected areas.
Protected areas provide for life’s diversity in safeguarding species and habitats. Each species is a product of millions of years of evolution. Each species contributes to the extraordinary variety of living creatures on earth. The wonder of the plant world and the intrinsic values of each living thing are but one aspect of the need to protect - there is also the ethical obligation of humankind towards other species. Moreover, protecting the awe inspiring features of the earth — the great mountain ranges, glaciated landscapes, volcanoes, canyons, river systems, lakes and vast wetlands, deserts and vast grasslands along with the world’s oceans, islands reefs and atolls — are central to the global tourism industry.
Protected Areas act as life’s buffers while serving as sanctuaries and strongholds of species in the face of climate change. Retaining the full complement of species, keeps diseases in check and curbs the expansion of pests. Managing resources by taking in the whole ecosystem into consideration is a key way of ensuring ecological resilience. Protected landscapes shelter humans from tsunamis, landslides and hurricanes that are subject to increased intensity brought on by climate change. Sound natural systems resist damaging erosion, soil loss, or water quality loss.
Protected areas are economic engines. They provide for life’s jobs and livelihoods as a traditional destination for the global tourism industry. Outdoor equipment industries have sprung up and are critical to regional economies. Significant employment is dependent on parks and protected areas. At the same time these areas protect resources of immense economic value such as water and fisheries. The pharmaceutical industry has benefited greatly from the genetic diversity of species and safeguarding species in protected areas will ensure the possibility of discovery of future medicines. As well the economic spin- offs from literature, film and television adds to the positive side of the ledger of the values of protected areas.
Globally - protected areas serve as indicators of achievement of the Millennium Development Goals. At the local level, protected areas contain landscapes with a sense of place and meaning to nations and its people. They offer opportunity for involvement with restoration and other conservation activities. Such activities
Protected Areas in Today’s World: Their Values and Benefits for the Welfare of the Planet
2
enhance social outcomes, sometimes dramatically, when delinquent youth are transformed into engaged community members.
Protected areas provide the settings for healthy outdoor living and recreation. Exploring a protected area offers not only the opportunity to understand nature but also for exercise and education. They provide a sense of adventure and challenge, including self-discovery. Achieving personal development goals increases the mental well-being of humans. Much evidence has been accumulated on the recuperative force of nature on recovering patients.
Most importantly, protected areas are the setting for providing some of life’s most joyous moments. It is within these areas that our spirits can soar and our soul can be replenished. We can feel joy in the beauty of the place, from the feeling of solitude, or from having an interaction with wildlife. Protected areas are places where one has time to relax and unwind and to share a special moment or adventure with family and friends. These joyous experiences become embedded as a memorable moment and for many, they can be a life-transforming event.
The joy of being in a special place has inspired human creativity from ancient to modern times. Many paint-ings, carvings, fabrics, decorations, and sculpture derived from an experience in a protected area enrich our lives. These areas have equally inspired writers, poets, and philosophers to produce books, movies, and documentaries.
Not to be overlooked is the spiritual and heritage value of protected areas. Areas with sacred places yield a reverence for place and the associated species or the ecosystem enveloping the sacred site. Cultural landscapes forged by repetitive human practices often results in a symbiotic relationship of species that are dependent on the practices. The cultural richness and layers of meaning of these areas yield intertwined stories of humans and nature living in harmony.
Protected areas bring tremendous cultural, ecological, spiritual, and scientific benefits to society. They are critical to preserving global biodiversity and stemming the extinction crisis. Today there are more than 100,000 protected areas worldwide comprising about 12 percent of the Earth’s surface. The development of a network of protected areas throughout the world is one of the greatest conservation achievements of the twentieth century, yet coverage is inconsistent across countries and ecoregions, and many areas are facing major threats to their viability. For example, the world’s coastal and ocean environments are among the most threatened areas, yet only a small proportion of them are protected.
As the world’s population grows and the demands on natural resources increase, protected areas become both more important and more threatened. Whether or not these areas are well protected—and many are not—they increasingly face external threats that are difficult or impossible to control. These include climate change, development beyond their boundaries, water limitations and pollution, invasive species, and inter-rupted wildlife migration corridors. These threats will only intensify in the decades ahead.
Compounding these challenges is an increasingly youthful populace that is more focused on digital video entertainment, television, and internet-based social networking than on the natural world and outdoor activi-ties. Half of the world’s population is now under the age of 25 and their perceptions of parks, refuges, and other protected areas will define the future of these places. If the conservation ethic is not instilled in the youth of today, the protected areas of tomorrow will be subject to neglect and encroachment.
The challenge is how do we convey the importance of conservation to today’s youth? The promise, excitement, and ecological, social, and economic importance of protected areas must be understood by the young people of today; otherwise the will to protect them in the future will diminish.

3
Protected Areas — For Life’s Sake
Let us not miss out on the opportunity that the world’s protected areas can provide in addressing the serious issues we face in the world. Protected areas are for life’s sake.
Protected Areas in Today’s World: Their Values and Benefits for the Welfare of the Planet
4
ProTeCTed AreAS CoNTrIBUTING To PoVerTY redUCTIoN2.
Lea M. Scherl1 and Lucy Emerton2
1The Nature Conservancy, 2IUCN, The World Conservation Union
It is now well established in academic literature and in broad international policy frameworks that there are both practical and ethical reasons for protected areas and other conservation initiatives to endeavor to contribute to poverty reduction3. “Biodiversity should be conserved both for its value as a local livelihoods resource and as a national and global public good”4. The practical reasons have been acknowledged for a long time and recognize the fact that protected areas, corridor and other conservation efforts co-exists with poverty in many areas around the globe. The imperative therefore is to find approaches to deal with such co-existences. Moreover, with the increasing advocacy for and recognition of indigenous and local communities’ rights it becomes very difficult in any democratic country to justify approaches for managing protected areas which do not take those rights into account.5 In the last few years the recognition of an ethical imperative to address protected areas and poverty reduction linkages has been growing and it is now considered unacceptable that the poorest people should pay a disproportionate cost of conserving globally important biodiversity6. “Protected Areas should strive to contribute to poverty reduction at the local level and at the very minimum must not contribute to or exacerbate poverty.”7. The principles of at least “do no harm” and respect for human rights must be observed — local and indigenous communities should not be worse off than what they are already as a result of a conservation initiative.8
2.1 INTrodUCTIoN
There is no doubt a growing awareness of the importance of conservation and protected areas to poverty reduction and sustainable development. “In order to achieve their potential both to conserve biodiversity and to assist in reducing poverty, protected areas should be integrated within a broad sustainable development planning agenda”9. Large scale territorial and development planning and landscape approaches to resource use allocation are increasingly taking into account not only ecosystem connectivity and the maintenance of biophysical corridors, but also that conservation, as a land and sea use option, is an integral part of sustain-able development. Environmental sustainability is one of the Millennium Development Goals (MDG7) and one indicator to measure environmental sustainability is the percentage of area under protection. However many are also arguing that the maintenance of environmental services and the stewardship of ecosystems as
1 Lea M. Scherl is Senior Social Scientist for The Nature Conservancy (Asia Pacific Region): [email protected].
2 Lucy Emerton is Head, Global Economics & the Environment Programme for IUCN, The World Conservation Union: [email protected].
3 Scherl, L.M. Wilson, A., Wild, R., Blockhus, J., Franks, P., McNeely, J., and McShane, T. (2004,) Can Protected Areas Contribute to Poverty Reduction? Opportunities and Limitations. IUCN, Cambridge and Gland (Translated Portuguese version, 2006).
4 World Parks Congress, Durban 2003, Rec. 5.29.
5 Scherl, LM. 2005 Protected Areas and Local and Indigenous Communities. In McNeely, J.A. (ed.). Friends for life: New Partnerships in Support of Protected Areas, pp. 101-112.IUCN, Gland, Switzerland.
6 A Global Environmental Facility Local Benefits Study shows that 72 out of 88 GEF projects that supported Protected Areas involved restricting resource use by local people, but only 40% of these made any attempt to address negative social impacts, and only 20% reported success (GEF. 2006. The Role of Local Benefits in Global Environmental Programs, Global Environment Facility Evaluation Office, Washington DC.)
7 As in 4 above.
8 Scherl, L. M. 2006. Social justice and human rights in conservation: An ethical consideration for future policies and actions. In Policy Matters — Poverty, Wealth and Conservation — Issue No. 14, pp. 88-92. Published by the IUCN Commission on Environmental, Economic and Social Policy (CEESP). Also addressing this issue is at the core of a global taskforce on Protected Areas, Equity and Livelihoods of two IUCN Commissions (World Commission on Protected Areas and Commission on Environment, Economics and Social Policy).
9 As in 4 above.
5
Protected Areas Contributing to Poverty Reduction
a result of conservation efforts are essential to achieve the other Millennium Development Goals — currently a major force driving macroeconomic policy formulation, donor agendas and sectoral investments.10 At the same time biodiversity loss and natural ecosystem degradation are significant barriers to the achievement of the MDG targets for 2015, and may ultimately undermine any progress that is made towards meeting them11. Although it can be easily argued that biodiversity underpins socio-economic wellbeing — and conservation can bring large payoffs in development and poverty reduction terms12 — the linkages between biodiversity, poverty reduction and economic development are often overlooked. In all too many cases “conservation” goals are seen as being distinct from (and sometimes in conflict with) “economic” goals. An artificial choice or a trade-off is too often created between investing in biodiversity and investing in poverty reduction.
In the specific context of the Convention of Biological Diversity, the Program of Work on Protected Areas (CBD PoW on PA), adopted during the seventh meeting of the Conference of Parties, in Kuala Lumpur in 2004, includes a number of principles related to equity and benefit sharing. The general purpose of the CBD PoW on PA is to bring to the attention of the Parties and development agencies the need to integrate their development strategies (for instance strategies for assistance to countries, strategies for poverty reduction and national and development strategies), their objectives related to protected areas, and to reflect the contribution of protected areas for sustainable development, as a means to achieve the Millennium Development Goals,in particular Goal 7. The objectives of the Convention as being: “……reducing significantly the actual loss of biodiversity at a global, regional, national and sub-national levels and contribute to poverty reduction and the search for sustainable development”. One of the Key elements of the Program of Work on Protected Areas is governance, participation, equity and benefit sharing. Some specific CBD targets for all countries include, by 2008 developing mechanisms for the equitable sharing of costs and benefits of protected areas. In particular signatory countries should:
Use conservation benefits to alleviate poverty; •Stop relocation or sedentarisation of communities without their prior informed consent; and •Understand the priorities, capacities, practices and values of indigenous peoples and local •communities.
If we want to go beyond simply doing “no harm” when creating a protected area to achieving benefits for local communities which are greater than the costs associated with such actions we need to start understand-ing the many values and benefits of protected areas and conservation initiatives. Failing to understand that conservation offers a basic tool for contributing to poverty reduction, strengthening livelihoods and sustain-ing economic growth runs the risk of incurring far-reaching economic and development costs — especially for the poorest and most vulnerable sectors of the world’s population. Below we discuss results from recent studies and analyses that examine the links between conservation and poverty reduction. A variety of social, cultural, governance and economic perspectives, all of which are important to local subsistence and national economies, are discussed. These studies and analyses cover a variety of ecosystems, including marine, forests, freshwater systems and wetlands and focus on regions throughout the world.
10 Koziell, I. and C. McNeill. 2002. Building on Hidden Opportunities to Achieve the Millennium Development Goals: Poverty Reduction through Conservation and Sustainable Use of Biodiversity. IIED London and UNDP Equator Initiative New York. And Roe, D. ed. 2005. The Millenium Development Goals and Conservation: Managing Nature’s Wealth for society’s Health. IIED.
11 Millennium Ecosystem Assessment. 2005. Ecosystems and Human Well-being: Synthesis. Island Press, Washington DC.
12 Devarajan, S., J. Miller and E. Swanson. 2002. ‘Goals for Development: History, Prospects, and Costs’. Policy Research Working Paper 2819, Office of the Vice President, World Bank, Washington DC.
Protected Areas in Today’s World: Their Values and Benefits for the Welfare of the Planet
6
2.2 THe SoCIAL, CULTUrAL ANd GoVerNANCe VALUeS oF ProTeCTed AreAS To PoV-erTY redUCTIoN13
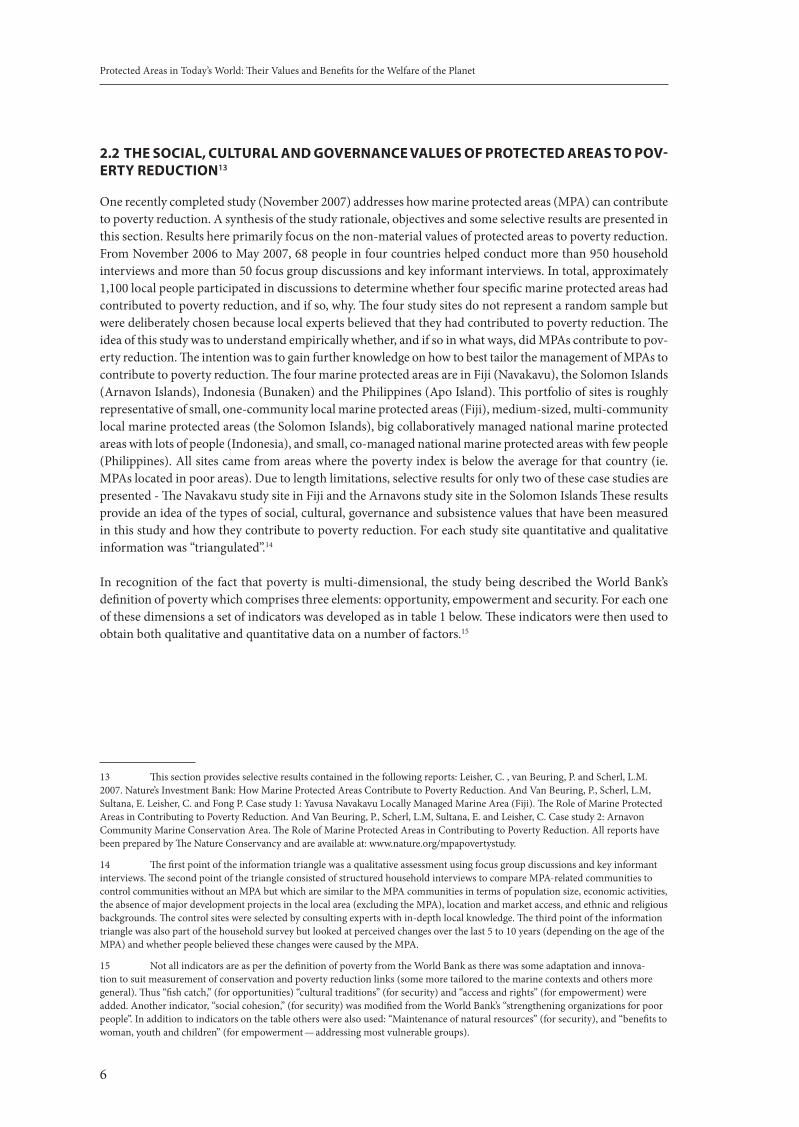
One recently completed study (November 2007) addresses how marine protected areas (MPA) can contribute to poverty reduction. A synthesis of the study rationale, objectives and some selective results are presented in this section. Results here primarily focus on the non-material values of protected areas to poverty reduction. From November 2006 to May 2007, 68 people in four countries helped conduct more than 950 household interviews and more than 50 focus group discussions and key informant interviews. In total, approximately 1,100 local people participated in discussions to determine whether four specific marine protected areas had contributed to poverty reduction, and if so, why. The four study sites do not represent a random sample but were deliberately chosen because local experts believed that they had contributed to poverty reduction. The idea of this study was to understand empirically whether, and if so in what ways, did MPAs contribute to pov-erty reduction. The intention was to gain further knowledge on how to best tailor the management of MPAs to contribute to poverty reduction. The four marine protected areas are in Fiji (Navakavu), the Solomon Islands (Arnavon Islands), Indonesia (Bunaken) and the Philippines (Apo Island). This portfolio of sites is roughly representative of small, one-community local marine protected areas (Fiji), medium-sized, multi-community local marine protected areas (the Solomon Islands), big collaboratively managed national marine protected areas with lots of people (Indonesia), and small, co-managed national marine protected areas with few people (Philippines). All sites came from areas where the poverty index is below the average for that country (ie. MPAs located in poor areas). Due to length limitations, selective results for only two of these case studies are presented - The Navakavu study site in Fiji and the Arnavons study site in the Solomon Islands These results provide an idea of the types of social, cultural, governance and subsistence values that have been measured in this study and how they contribute to poverty reduction. For each study site quantitative and qualitative information was “triangulated”.14
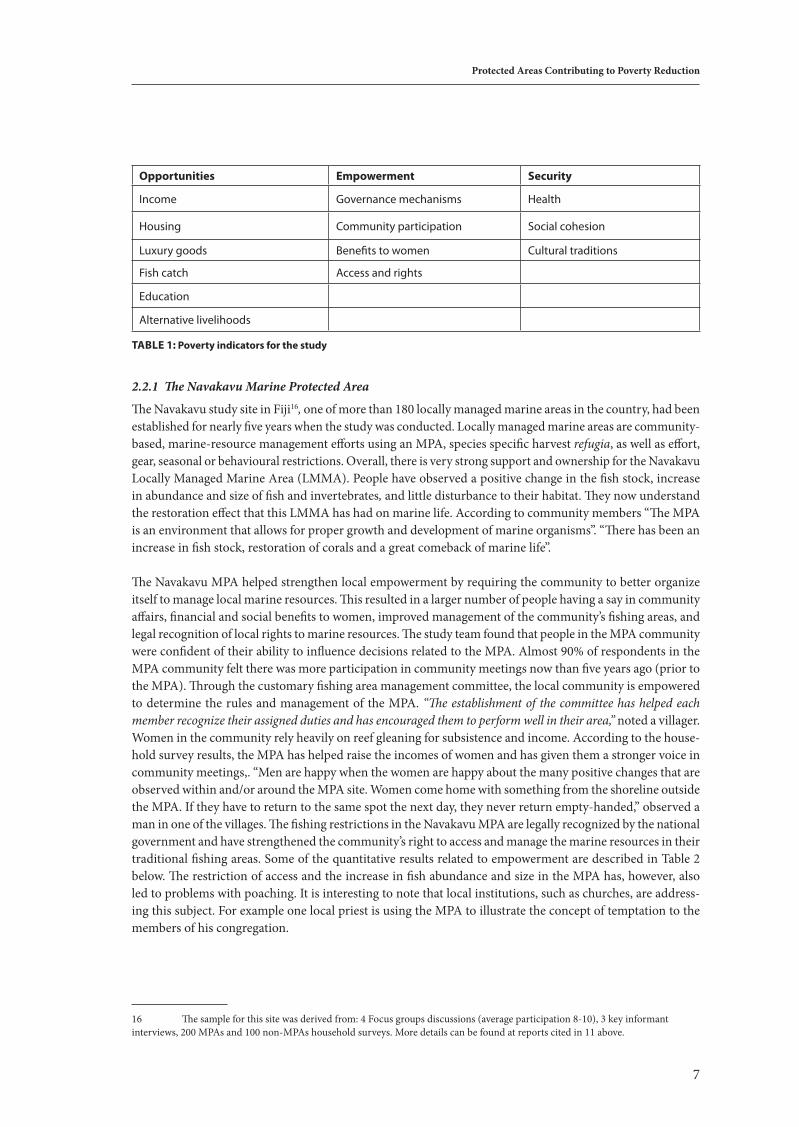
In recognition of the fact that poverty is multi-dimensional, the study being described the World Bank’s definition of poverty which comprises three elements: opportunity, empowerment and security. For each one of these dimensions a set of indicators was developed as in table 1 below. These indicators were then used to obtain both qualitative and quantitative data on a number of factors.15
13 This section provides selective results contained in the following reports: Leisher, C. , van Beuring, P. and Scherl, L.M. 2007. Nature’s Investment Bank: How Marine Protected Areas Contribute to Poverty Reduction. And Van Beuring, P., Scherl, L.M, Sultana, E. Leisher, C. and Fong P. Case study 1: Yavusa Navakavu Locally Managed Marine Area (Fiji). The Role of Marine Protected Areas in Contributing to Poverty Reduction. And Van Beuring, P., Scherl, L.M, Sultana, E. and Leisher, C. Case study 2: Arnavon Community Marine Conservation Area. The Role of Marine Protected Areas in Contributing to Poverty Reduction. All reports have been prepared by The Nature Conservancy and are available at: www.nature.org/mpapovertystudy.
14 The first point of the information triangle was a qualitative assessment using focus group discussions and key informant interviews. The second point of the triangle consisted of structured household interviews to compare MPA-related communities to control communities without an MPA but which are similar to the MPA communities in terms of population size, economic activities, the absence of major development projects in the local area (excluding the MPA), location and market access, and ethnic and religious backgrounds. The control sites were selected by consulting experts with in-depth local knowledge. The third point of the information triangle was also part of the household survey but looked at perceived changes over the last 5 to 10 years (depending on the age of the MPA) and whether people believed these changes were caused by the MPA.
15 Not all indicators are as per the definition of poverty from the World Bank as there was some adaptation and innova-tion to suit measurement of conservation and poverty reduction links (some more tailored to the marine contexts and others more general). Thus “fish catch,” (for opportunities) “cultural traditions” (for security) and “access and rights” (for empowerment) were added. Another indicator, “social cohesion,” (for security) was modified from the World Bank’s “strengthening organizations for poor people”. In addition to indicators on the table others were also used: “Maintenance of natural resources” (for security), and “benefits to woman, youth and children” (for empowerment — addressing most vulnerable groups).
7
Protected Areas Contributing to Poverty Reduction
opportunities empowerment Security
Income Governance mechanisms Health
Housing Community participation Social cohesion
Luxury goods Benefits to women Cultural traditions
Fish catch Access and rights
Education
Alternative livelihoods
TABLe 1: Poverty indicators for the study
2.2.1 The Navakavu Marine Protected Area
The Navakavu study site in Fiji16, one of more than 180 locally managed marine areas in the country, had been established for nearly five years when the study was conducted. Locally managed marine areas are community-based, marine-resource management efforts using an MPA, species specific harvest refugia, as well as effort, gear, seasonal or behavioural restrictions. Overall, there is very strong support and ownership for the Navakavu Locally Managed Marine Area (LMMA). People have observed a positive change in the fish stock, increase in abundance and size of fish and invertebrates, and little disturbance to their habitat. They now understand the restoration effect that this LMMA has had on marine life. According to community members “The MPA is an environment that allows for proper growth and development of marine organisms”. “There has been an increase in fish stock, restoration of corals and a great comeback of marine life”.
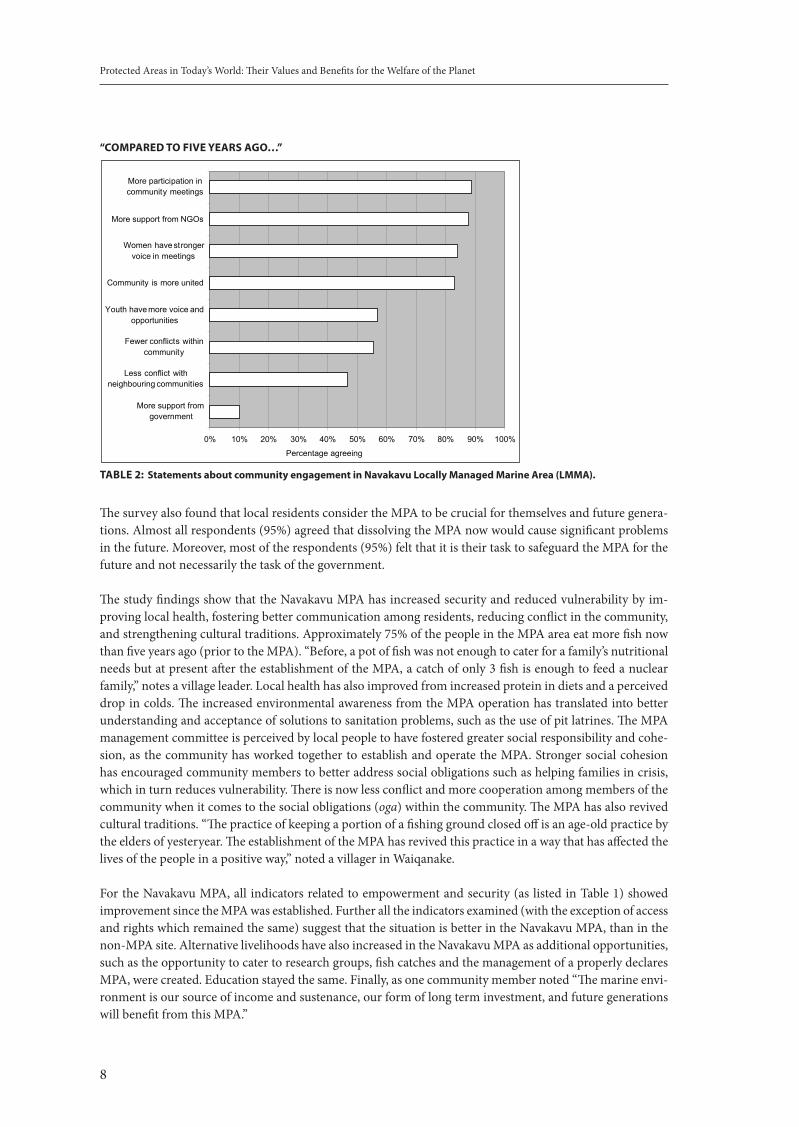
The Navakavu MPA helped strengthen local empowerment by requiring the community to better organize itself to manage local marine resources. This resulted in a larger number of people having a say in community affairs, financial and social benefits to women, improved management of the community’s fishing areas, and legal recognition of local rights to marine resources. The study team found that people in the MPA community were confident of their ability to influence decisions related to the MPA. Almost 90% of respondents in the MPA community felt there was more participation in community meetings now than five years ago (prior to the MPA). Through the customary fishing area management committee, the local community is empowered to determine the rules and management of the MPA. “The establishment of the committee has helped each member recognize their assigned duties and has encouraged them to perform well in their area,” noted a villager. Women in the community rely heavily on reef gleaning for subsistence and income. According to the house-hold survey results, the MPA has helped raise the incomes of women and has given them a stronger voice in community meetings,. “Men are happy when the women are happy about the many positive changes that are observed within and/or around the MPA site. Women come home with something from the shoreline outside the MPA. If they have to return to the same spot the next day, they never return empty-handed,” observed a man in one of the villages. The fishing restrictions in the Navakavu MPA are legally recognized by the national government and have strengthened the community’s right to access and manage the marine resources in their traditional fishing areas. Some of the quantitative results related to empowerment are described in Table 2 below. The restriction of access and the increase in fish abundance and size in the MPA has, however, also led to problems with poaching. It is interesting to note that local institutions, such as churches, are address-ing this subject. For example one local priest is using the MPA to illustrate the concept of temptation to the members of his congregation.
16 The sample for this site was derived from: 4 Focus groups discussions (average participation 8-10), 3 key informant interviews, 200 MPAs and 100 non-MPAs household surveys. More details can be found at reports cited in 11 above.
Protected Areas in Today’s World: Their Values and Benefits for the Welfare of the Planet
8
“CoMPAred To FIVe YeArS AGo…”
TABLe 2: Statements about community engagement in Navakavu Locally Managed Marine Area (LMMA).
The survey also found that local residents consider the MPA to be crucial for themselves and future genera-tions. Almost all respondents (95%) agreed that dissolving the MPA now would cause significant problems in the future. Moreover, most of the respondents (95%) felt that it is their task to safeguard the MPA for the future and not necessarily the task of the government.
The study findings show that the Navakavu MPA has increased security and reduced vulnerability by im-proving local health, fostering better communication among residents, reducing conflict in the community, and strengthening cultural traditions. Approximately 75% of the people in the MPA area eat more fish now than five years ago (prior to the MPA). “Before, a pot of fish was not enough to cater for a family’s nutritional needs but at present after the establishment of the MPA, a catch of only 3 fish is enough to feed a nuclear family,” notes a village leader. Local health has also improved from increased protein in diets and a perceived drop in colds. The increased environmental awareness from the MPA operation has translated into better understanding and acceptance of solutions to sanitation problems, such as the use of pit latrines. The MPA management committee is perceived by local people to have fostered greater social responsibility and cohe-sion, as the community has worked together to establish and operate the MPA. Stronger social cohesion has encouraged community members to better address social obligations such as helping families in crisis, which in turn reduces vulnerability. There is now less conflict and more cooperation among members of the community when it comes to the social obligations (oga) within the community. The MPA has also revived cultural traditions. “The practice of keeping a portion of a fishing ground closed off is an age-old practice by the elders of yesteryear. The establishment of the MPA has revived this practice in a way that has affected the lives of the people in a positive way,” noted a villager in Waiqanake.
For the Navakavu MPA, all indicators related to empowerment and security (as listed in Table 1) showed improvement since the MPA was established. Further all the indicators examined (with the exception of access and rights which remained the same) suggest that the situation is better in the Navakavu MPA, than in the non-MPA site. Alternative livelihoods have also increased in the Navakavu MPA as additional opportunities, such as the opportunity to cater to research groups, fish catches and the management of a properly declares MPA, were created. Education stayed the same. Finally, as one community member noted “The marine envi-ronment is our source of income and sustenance, our form of long term investment, and future generations will benefit from this MPA.”
“Compared to five years ago…”
0% 10% 20% 30% 40% 50% 60% 70% 80% 90% 100%
More support fromgovernment
Less conflict withneighbouring communities
Fewer conflicts withincommunity
Youth have more voice andopportunities
Community is more united
Women have strongervoice in meetings
More support from NGOs
More participation incommunity meetings
Percentage agreeing
Table 2: Statements about community engagement in Navakavu Locally Managed Marine Area
(LMMA).
The survey also found that local residents consider the MPA to be crucial for themselves and future
generations. Almost all respondents (95%) agreed that dissolving the MPA now would cause significant
problems in the future. Moreover, most of the respondents (95%) felt that it is their task to safeguard the
MPA for the future and not necessarily the task of the government.
The study findings show that the Navakavu MPA has increased security and reduced vulnerability by
improving local health, fostering better communication among residents, reducing conflict in the community,
and strengthening cultural traditions. Approximately 75% of the people in the MPA area eat more fish now
than five years ago (prior to the MPA). “Before, a pot of fish was not enough to cater for a family’s
nutritional needs but at present after the establishment of the MPA, a catch of only 3 fish is enough to feed a
nuclear family,” notes a village leader. Local health has also improved from increased protein in diets and a
perceived drop in colds. The increased environmental awareness from the MPA operation has translated into
better understanding and acceptance of solutions to sanitation problems, such as the use of pit latrines. The
MPA management committee is perceived by local people to have fostered greater social responsibility and
cohesion, as the community has worked together to establish and operate the MPA. Stronger social cohesion
has encouraged community members to better address social obligations such as helping families in crisis,
which in turn reduces vulnerability. There is now less conflict and more cooperation among members of the
community when it comes to the social obligations (oga) within the community. The MPA has also revived
cultural traditions. “The practice of keeping a portion of a fishing ground closed off is an age-old practice by
the elders of yesteryear. The establishment of the MPA has revived this practice in a way that has affected the
lives of the people in a positive way,” noted a villager in Waiqanake.
6
9
Protected Areas Contributing to Poverty Reduction
2.2.2 The Arnavon Islands Community Marine Conservation Area
The Solomon Islands’ Arnavon Islands Community Marine Conservation Area is located between the prov-inces of Choiseul and Isabel.17 The MPA, established in 1995, consists of three small islands and their associated coral reefs. The communities of Waghena, Kia and Katupika co-manage the MPA in partnership with the provincial governments, the national government, and The Nature Conservancy. Almost all livelihoods in the three communities depend on the marine environment. These include fishing, sea cucumber harvesting, trochus shell collection (for the making of buttons), and seaweed farming. Overall, the MPA communities perceive that life is harder than it was ten years ago. Yet when compared with the non-MPA control sites, in many respects, the Arnavons’ communities are better off. When compared to non-MPA communities The Arnavons’ communities have better housing, a greater percentage of children attending school, and several new livelihoods strategies that provide some alternatives to fishing.
The Arnavons Islands MPA clearly helped empower local people to improve their lives. The MPA Management Committee empowered the communities to use this multi-stakeholder committee to voice concerns, discuss issues, and plan actions on topics far beyond the MPA itself. The management committee, for example, brought the community and government representatives into more direct dialogue, which resulted in greater government support, especially related to fisheries and basic health care. This improved dialogue and decision-making has helped strengthen local governance. As women have become involved in seaweed farming, the weaving of mats, and the making of cultural dancing clothes, they have become more powerful and have been able to earn income. More than 85% of respondents in the MPA communities said women now have a stronger voice in community meetings. Women are also keen to participate more actively in the management of the MPA as they do not participate much currently.
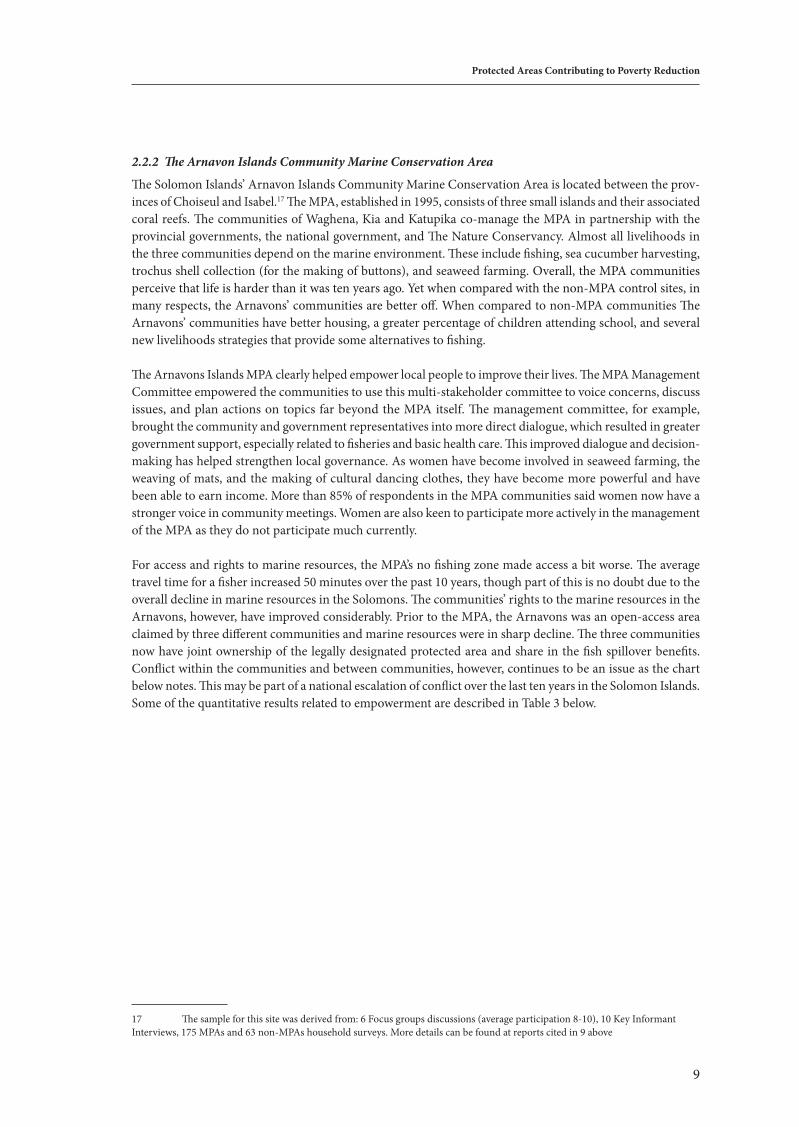
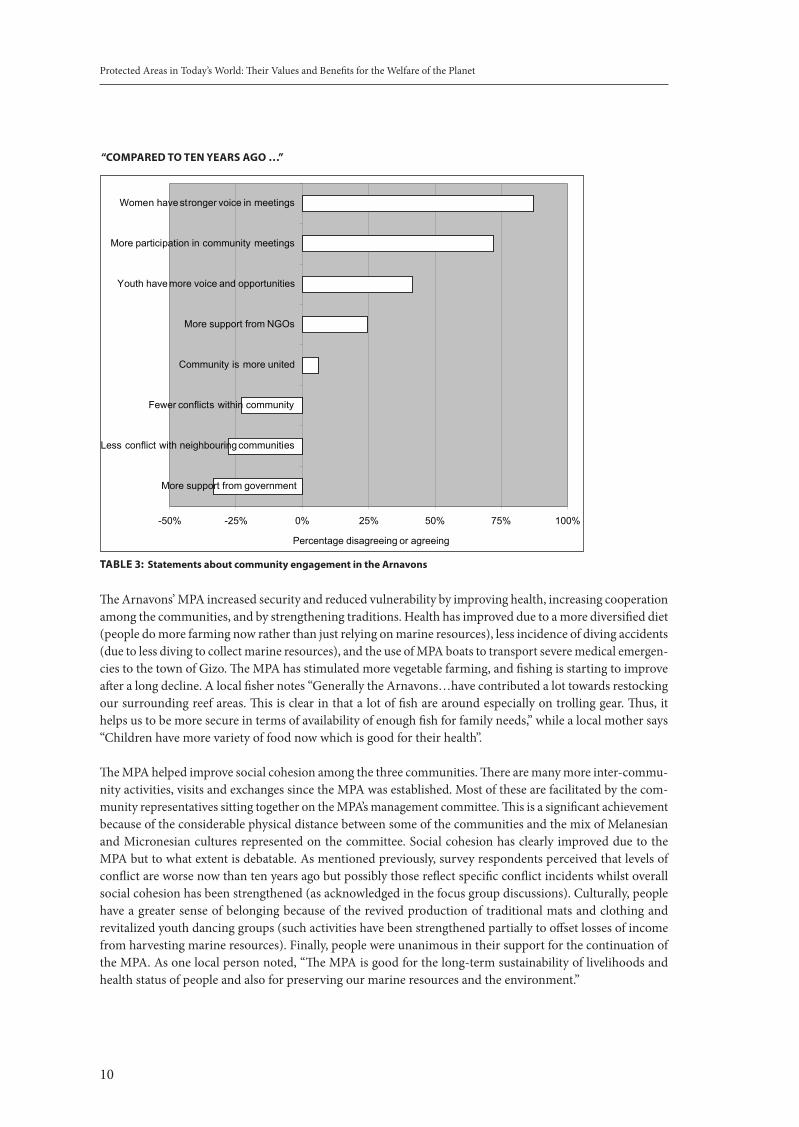
For access and rights to marine resources, the MPA’s no fishing zone made access a bit worse. The average travel time for a fisher increased 50 minutes over the past 10 years, though part of this is no doubt due to the overall decline in marine resources in the Solomons. The communities’ rights to the marine resources in the Arnavons, however, have improved considerably. Prior to the MPA, the Arnavons was an open-access area claimed by three different communities and marine resources were in sharp decline. The three communities now have joint ownership of the legally designated protected area and share in the fish spillover benefits. Conflict within the communities and between communities, however, continues to be an issue as the chart below notes. This may be part of a national escalation of conflict over the last ten years in the Solomon Islands. Some of the quantitative results related to empowerment are described in Table 3 below.
17 The sample for this site was derived from: 6 Focus groups discussions (average participation 8-10), 10 Key Informant Interviews, 175 MPAs and 63 non-MPAs household surveys. More details can be found at reports cited in 9 above
Protected Areas in Today’s World: Their Values and Benefits for the Welfare of the Planet
10
“CoMPAred To TeN YeArS AGo …”
TABLe 3: Statements about community engagement in the Arnavons
The Arnavons’ MPA increased security and reduced vulnerability by improving health, increasing cooperation among the communities, and by strengthening traditions. Health has improved due to a more diversified diet (people do more farming now rather than just relying on marine resources), less incidence of diving accidents (due to less diving to collect marine resources), and the use of MPA boats to transport severe medical emergen-cies to the town of Gizo. The MPA has stimulated more vegetable farming, and fishing is starting to improve after a long decline. A local fisher notes “Generally the Arnavons…have contributed a lot towards restocking our surrounding reef areas. This is clear in that a lot of fish are around especially on trolling gear. Thus, it helps us to be more secure in terms of availability of enough fish for family needs,” while a local mother says “Children have more variety of food now which is good for their health”.
The MPA helped improve social cohesion among the three communities. There are many more inter-commu-nity activities, visits and exchanges since the MPA was established. Most of these are facilitated by the com-munity representatives sitting together on the MPA’s management committee. This is a significant achievement because of the considerable physical distance between some of the communities and the mix of Melanesian and Micronesian cultures represented on the committee. Social cohesion has clearly improved due to the MPA but to what extent is debatable. As mentioned previously, survey respondents perceived that levels of conflict are worse now than ten years ago but possibly those reflect specific conflict incidents whilst overall social cohesion has been strengthened (as acknowledged in the focus group discussions). Culturally, people have a greater sense of belonging because of the revived production of traditional mats and clothing and revitalized youth dancing groups (such activities have been strengthened partially to offset losses of income from harvesting marine resources). Finally, people were unanimous in their support for the continuation of the MPA. As one local person noted, “The MPA is good for the long-term sustainability of livelihoods and health status of people and also for preserving our marine resources and the environment.”
open-access area claimed by three different communities and marine resources were in sharp decline. The
three communities now have joint ownership of the legally designated protected area and share in the fish
spillover benefits. Conflict within the communities and between communities, however, continues to be an
issue as the chart below notes. This may be part of a national escalation of conflict over the last ten years in
the Solomon Islands. Some of the quantitative results related to empowerment are described in Table 3
below.
“Compared to ten years ago …”
-50% -25% 0% 25% 50% 75% 100%
More support from government
Less conflict with neighbouring communities
Fewer conflicts within community
Community is more united
More support from NGOs
Youth have more voice and opportunities
More participation in community meetings
Women have stronger voice in meetings
Percentage disagreeing or agreeing
Table 3: Statements about community engagement in the Arnavons
The Arnavons’ MPA increased security and reduced vulnerability by improving health, increasing
cooperation among the communities, and by strengthening traditions. Health has improved due to a more
diversified diet (people do more farming now rather than just relying on marine resources), less incidence of
diving accidents (due to less diving to collect marine resources), and the use of MPA boats to transport
severe medical emergencies to the town of Gizo. The MPA has stimulated more vegetable farming, and
fishing is starting to improve after a long decline. A local fisher notes “Generally the Arnavons…have
contributed a lot towards restocking our surrounding reef areas. This is clear in that a lot of fish are around
especially on trolling gear. Thus, it helps us to be more secure in terms of availability of enough fish for
family needs,” while a local mother says “Children have more variety of food now which is good for their
health”.
8
11
Protected Areas Contributing to Poverty Reduction
For this site all indicators related to empowerment and security (those listed in Table 1) showed improve-ment since the MPA was established. Further when compared to the non-MPA site, (with the exception of access and rights which remained the same) all indicators suggest that the situation in better in the MPA site. Alternative livelihoods also improved.
In addition to opportunity, empowerment and security dimensions, protected areas constitute an important stock of natural capital, yielding flows of economically valuable goods and services which benefit human popu-lations living both on and off-site. Protected area goods and services typically have a particularly important economic role for the poorest members of a community. The next section of this paper describes some of the broad and specific economic values of protected areas for both poverty alleviation and reduction.
2.3 THe eCoNoMIC VALUe oF ProTeCTed AreAS For PoVerTY redUCTIoN
2.3.1 How protected areas support national and local economies
Despite the critical and obvious links between protected areas, biodiversity conservation and economic de-velopment, economists have, paradoxically, paid little attention to investing in protected areas in order to support poverty reduction goals. There remain glaring — and potentially misleading — gaps in most of the indicators and statistics that are used to inform economic and development planning, as they rarely count the contribution of ecosystem goods and services. Yet the scant data that does exist presents convincing evidence that protected areas generate significant multiplier effects across a national economy, and that their economic value to the livelihoods of the poorest and most vulnerable sectors of society is very high. Lao People’s Democratic Republic is an example of this point.
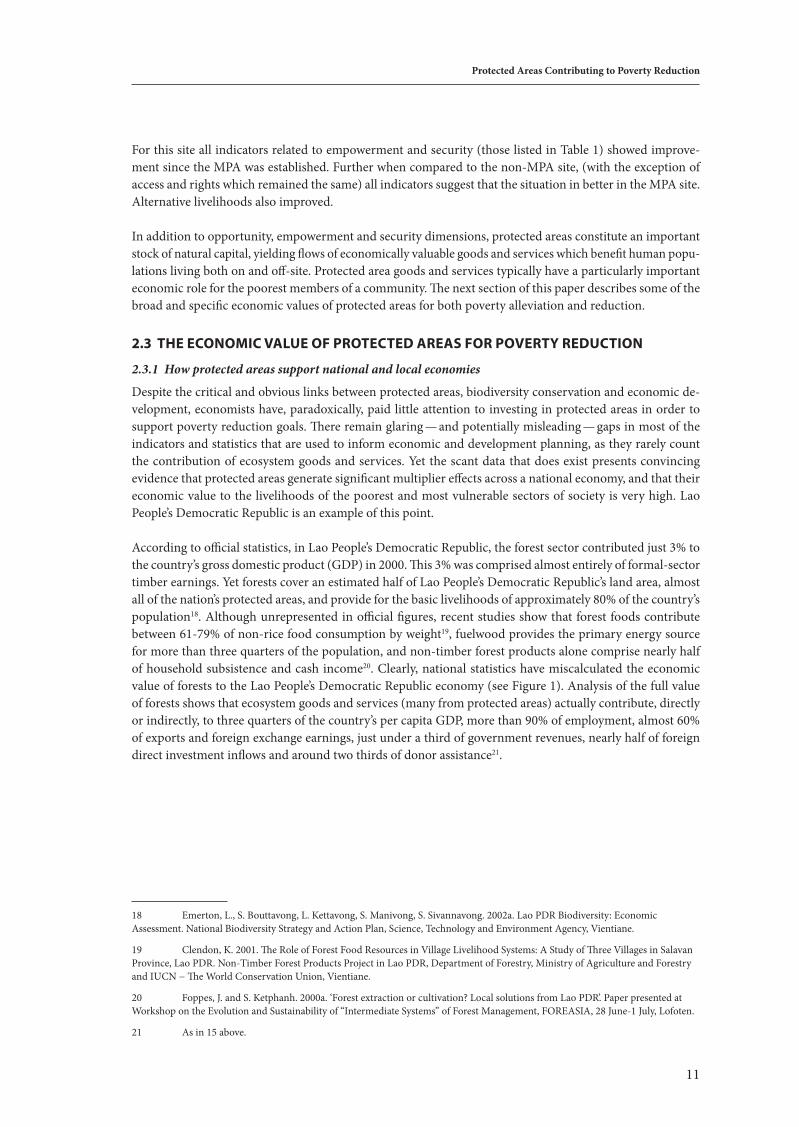
According to official statistics, in Lao People’s Democratic Republic, the forest sector contributed just 3% to the country’s gross domestic product (GDP) in 2000. This 3% was comprised almost entirely of formal-sector timber earnings. Yet forests cover an estimated half of Lao People’s Democratic Republic’s land area, almost all of the nation’s protected areas, and provide for the basic livelihoods of approximately 80% of the country’s population18. Although unrepresented in official figures, recent studies show that forest foods contribute between 61-79% of non-rice food consumption by weight19, fuelwood provides the primary energy source for more than three quarters of the population, and non-timber forest products alone comprise nearly half of household subsistence and cash income20. Clearly, national statistics have miscalculated the economic value of forests to the Lao People’s Democratic Republic economy (see Figure 1). Analysis of the full value of forests shows that ecosystem goods and services (many from protected areas) actually contribute, directly or indirectly, to three quarters of the country’s per capita GDP, more than 90% of employment, almost 60% of exports and foreign exchange earnings, just under a third of government revenues, nearly half of foreign direct investment inflows and around two thirds of donor assistance21.
18 Emerton, L., S. Bouttavong, L. Kettavong, S. Manivong, S. Sivannavong. 2002a. Lao PDR Biodiversity: Economic Assessment. National Biodiversity Strategy and Action Plan, Science, Technology and Environment Agency, Vientiane.
19 Clendon, K. 2001. The Role of Forest Food Resources in Village Livelihood Systems: A Study of Three Villages in Salavan Province, Lao PDR. Non-Timber Forest Products Project in Lao PDR, Department of Forestry, Ministry of Agriculture and Forestry and IUCN − The World Conservation Union, Vientiane.
20 Foppes, J. and S. Ketphanh. 2000a. ‘Forest extraction or cultivation? Local solutions from Lao PDR’. Paper presented at Workshop on the Evolution and Sustainability of “Intermediate Systems” of Forest Management, FOREASIA, 28 June-1 July, Lofoten.
21 As in 15 above.
Protected Areas in Today’s World: Their Values and Benefits for the Welfare of the Planet
12
FIGUre 1: The contribution of biodiversity-based and biodiversity-dependent income to key national development
indicators in Lao Pdr (average per year 1995-2000)
From: Emerton et al 2002a
Examining one site in Lao People’s Democratic Republic underlines even more strongly the high, and yet largely hidden, value of protected areas to development and poverty reduction. Nam Et and Phou Loei (NEPL) National Protected Area are located mainly in Houaphan Province of the Northern Region. The Northern Region has the highest prevalence of poverty in the country. Within the Northern Region poverty is highest in Houaphan Province, where three quarters of the population were classified as poor in 1998 with an equivalent 2002 per capita GDP of just $204 (as against a national average of some $350 at that time)22.
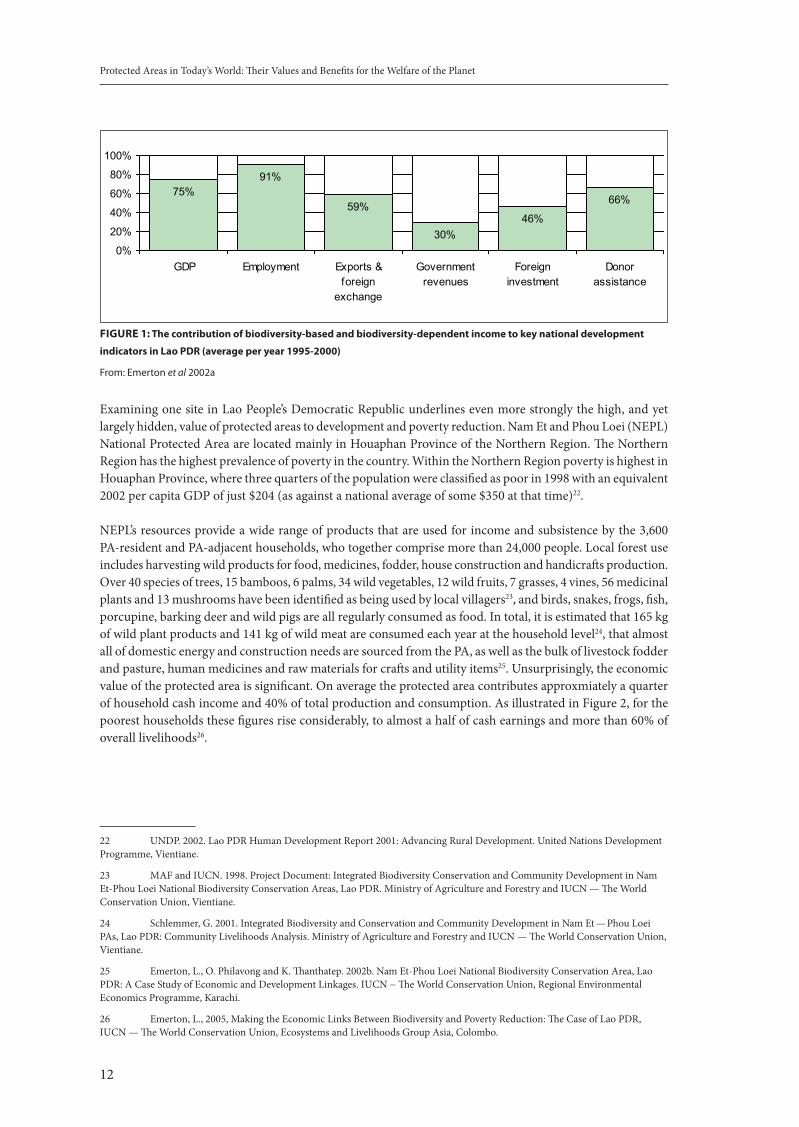
NEPL’s resources provide a wide range of products that are used for income and subsistence by the 3,600 PA-resident and PA-adjacent households, who together comprise more than 24,000 people. Local forest use includes harvesting wild products for food, medicines, fodder, house construction and handicrafts production. Over 40 species of trees, 15 bamboos, 6 palms, 34 wild vegetables, 12 wild fruits, 7 grasses, 4 vines, 56 medicinal plants and 13 mushrooms have been identified as being used by local villagers23, and birds, snakes, frogs, fish, porcupine, barking deer and wild pigs are all regularly consumed as food. In total, it is estimated that 165 kg of wild plant products and 141 kg of wild meat are consumed each year at the household level24, that almost all of domestic energy and construction needs are sourced from the PA, as well as the bulk of livestock fodder and pasture, human medicines and raw materials for crafts and utility items25. Unsurprisingly, the economic value of the protected area is significant. On average the protected area contributes approxmiately a quarter of household cash income and 40% of total production and consumption. As illustrated in Figure 2, for the poorest households these figures rise considerably, to almost a half of cash earnings and more than 60% of overall livelihoods26.
22 UNDP. 2002. Lao PDR Human Development Report 2001: Advancing Rural Development. United Nations Development Programme, Vientiane.
23 MAF and IUCN. 1998. Project Document: Integrated Biodiversity Conservation and Community Development in Nam Et-Phou Loei National Biodiversity Conservation Areas, Lao PDR. Ministry of Agriculture and Forestry and IUCN — The World Conservation Union, Vientiane.
24 Schlemmer, G. 2001. Integrated Biodiversity and Conservation and Community Development in Nam Et — Phou Loei PAs, Lao PDR: Community Livelihoods Analysis. Ministry of Agriculture and Forestry and IUCN — The World Conservation Union, Vientiane.
25 Emerton, L., O. Philavong and K. Thanthatep. 2002b. Nam Et-Phou Loei National Biodiversity Conservation Area, Lao PDR: A Case Study of Economic and Development Linkages. IUCN − The World Conservation Union, Regional Environmental Economics Programme, Karachi.
26 Emerton, L., 2005, Making the Economic Links Between Biodiversity and Poverty Reduction: The Case of Lao PDR, IUCN — The World Conservation Union, Ecosystems and Livelihoods Group Asia, Colombo.
75%91%
59%
30%46%
66%
0%
20%
40%
60%
80%
100%
GDP Employment Exports &foreign
exchange
Governmentrevenues
Foreigninvestment
Donorassistance
13
Protected Areas Contributing to Poverty Reduction
FIGUre 2: The role of protected area resources in household livelihoods around Nam et and Phou Loei Protected Areas
From: Emerton et al 2002b
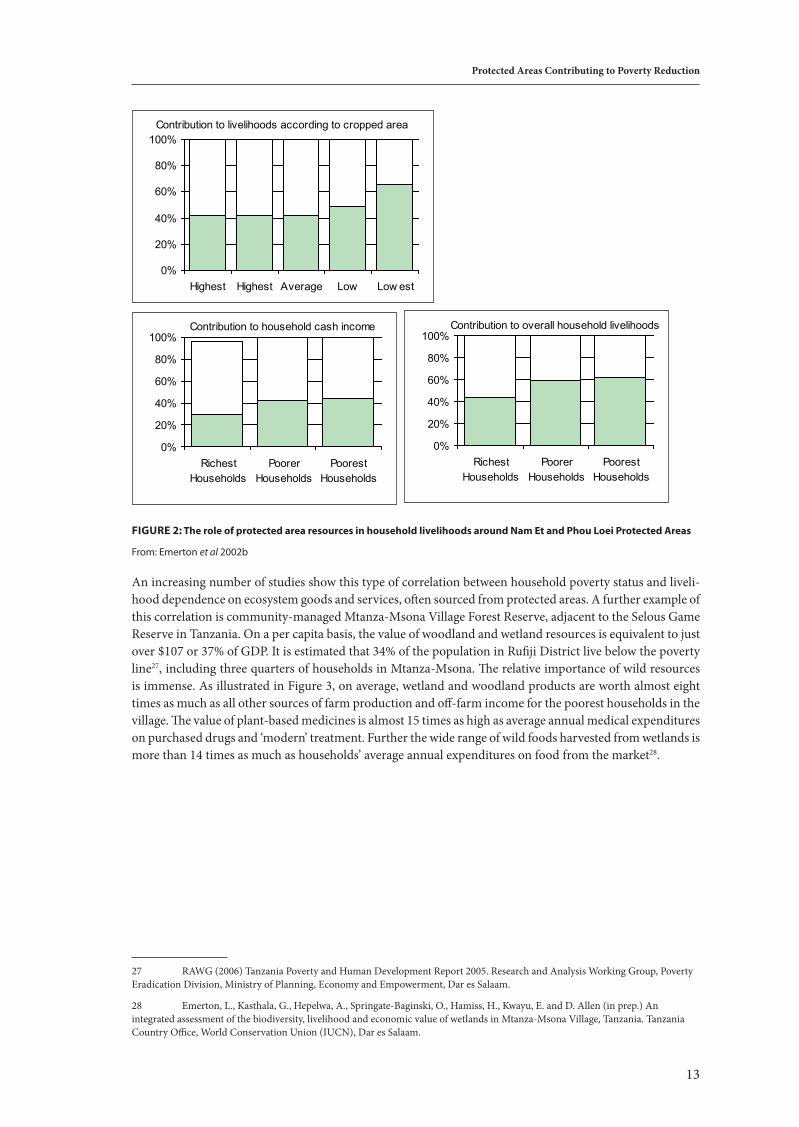
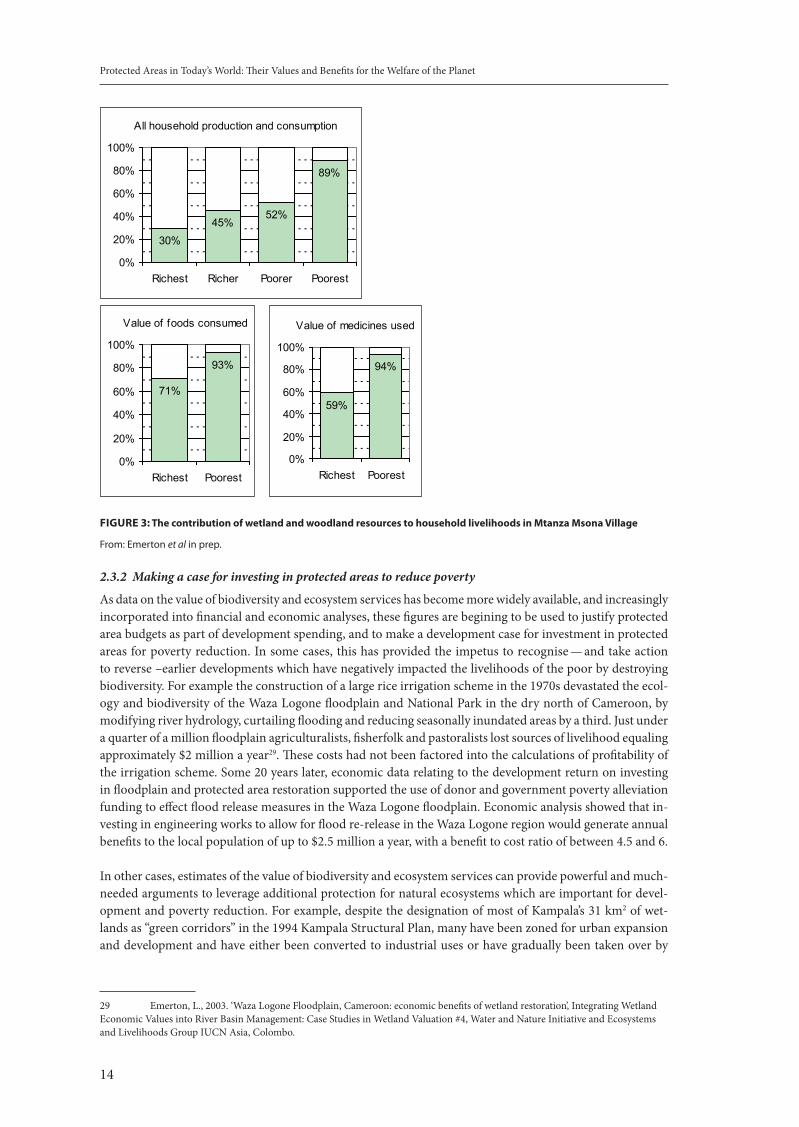
An increasing number of studies show this type of correlation between household poverty status and liveli-hood dependence on ecosystem goods and services, often sourced from protected areas. A further example of this correlation is community-managed Mtanza-Msona Village Forest Reserve, adjacent to the Selous Game Reserve in Tanzania. On a per capita basis, the value of woodland and wetland resources is equivalent to just over $107 or 37% of GDP. It is estimated that 34% of the population in Rufiji District live below the poverty line27, including three quarters of households in Mtanza-Msona. The relative importance of wild resources is immense. As illustrated in Figure 3, on average, wetland and woodland products are worth almost eight times as much as all other sources of farm production and off-farm income for the poorest households in the village. The value of plant-based medicines is almost 15 times as high as average annual medical expenditures on purchased drugs and ‘modern’ treatment. Further the wide range of wild foods harvested from wetlands is more than 14 times as much as households’ average annual expenditures on food from the market28.
27 RAWG (2006) Tanzania Poverty and Human Development Report 2005. Research and Analysis Working Group, Poverty Eradication Division, Ministry of Planning, Economy and Empowerment, Dar es Salaam.
28 Emerton, L., Kasthala, G., Hepelwa, A., Springate-Baginski, O., Hamiss, H., Kwayu, E. and D. Allen (in prep.) An integrated assessment of the biodiversity, livelihood and economic value of wetlands in Mtanza-Msona Village, Tanzania. Tanzania Country Office, World Conservation Union (IUCN), Dar es Salaam.
0%
20%
40%
60%
80%
100%
Highest Highest Average Low Low est
Contribution to livelihoods according to cropped area
0%
20%
40%
60%
80%
100%
RichestHouseholds
PoorerHouseholds
PoorestHouseholds
Contribution to household cash income
0%
20%
40%
60%
80%
100%
RichestHouseholds
PoorerHouseholds
PoorestHouseholds
Contribution to overall household livelihoods
Protected Areas in Today’s World: Their Values and Benefits for the Welfare of the Planet
14
FIGUre 3: The contribution of wetland and woodland resources to household livelihoods in Mtanza Msona Village
From: Emerton et al in prep.
2.3.2 Making a case for investing in protected areas to reduce poverty
As data on the value of biodiversity and ecosystem services has become more widely available, and increasingly incorporated into financial and economic analyses, these figures are begining to be used to justify protected area budgets as part of development spending, and to make a development case for investment in protected areas for poverty reduction. In some cases, this has provided the impetus to recognise — and take action to reverse –earlier developments which have negatively impacted the livelihoods of the poor by destroying biodiversity. For example the construction of a large rice irrigation scheme in the 1970s devastated the ecol-ogy and biodiversity of the Waza Logone floodplain and National Park in the dry north of Cameroon, by modifying river hydrology, curtailing flooding and reducing seasonally inundated areas by a third. Just under a quarter of a million floodplain agriculturalists, fisherfolk and pastoralists lost sources of livelihood equaling approximately $2 million a year29. These costs had not been factored into the calculations of profitability of the irrigation scheme. Some 20 years later, economic data relating to the development return on investing in floodplain and protected area restoration supported the use of donor and government poverty alleviation funding to effect flood release measures in the Waza Logone floodplain. Economic analysis showed that in-vesting in engineering works to allow for flood re-release in the Waza Logone region would generate annual benefits to the local population of up to $2.5 million a year, with a benefit to cost ratio of between 4.5 and 6.
In other cases, estimates of the value of biodiversity and ecosystem services can provide powerful and much-needed arguments to leverage additional protection for natural ecosystems which are important for devel-opment and poverty reduction. For example, despite the designation of most of Kampala’s 31 km2 of wet-lands as “green corridors” in the 1994 Kampala Structural Plan, many have been zoned for urban expansion and development and have either been converted to industrial uses or have gradually been taken over by
29 Emerton, L., 2003. ‘Waza Logone Floodplain, Cameroon: economic benefits of wetland restoration’, Integrating Wetland Economic Values into River Basin Management: Case Studies in Wetland Valuation #4, Water and Nature Initiative and Ecosystems and Livelihoods Group IUCN Asia, Colombo.
30%45%
52%
89%
0%
20%
40%
60%
80%
100%
Richest Richer Poorer Poorest
All household production and consumption
71%
93%
0%
20%
40%
60%
80%
100%
Richest Poorest
Value of foods consumed
59%
94%
0%
20%
40%
60%
80%
100%
Richest Poorest
Value of medicines used
15
Protected Areas Contributing to Poverty Reduction
settlement30. Of the twelve main wetland areas of the city, Nakivubo Swamp is the largest. Nakivubo functions as a buffer through which much of the city’s industrial and domestic wastewaters passes. The wetland plays an appreciable role in treating these wastes before they are discharged into Lake Victoria at Murchison Bay some 3 km to the north east of the main intake for Kampala’s piped water supply.
The value of Nakivubo’s wastewater treatment services, found to be around $2 million a year, provided a pow-erful economic argument for zoning Nakivubo as part of Kamapala’s protected greenbelt, and for curtailing further drainage and reclamation of the wetland31. It showed that Nakivubo fills a critical gap between the level of basic sanitation and safe water service that a poor urban population requires for an adequate standard of living, and that which the government is currently able to to provide through existing infrastructure. In Kampala, the urban poor are simply not in a position to bear such losses or expenditures.
2.3.3 Pro-poor economic and financial tools for protected area conservation
The growing availability of ‘hard’ data on the economic value of protected areas for the poor represents a major step forward in information and understanding. It has helped to demonstrate and to clearly articulate the linkages between protected areas and economic indicators of human well-being. Valuation is, however not an end in itself, but a means to an end — better and more informed decision-making. Unfortunately, better understanding and more accurate quantification of the economic benefits of protected areas is still weakly reflected in both conservation investments, and in the policies, markets and prices which influence the trade-offs and decisions that public policy-makers, local communities, landholders and resource users face when considering protected areas. The development of economic and financial instruments for protected area conservation which are explicitly pro-poor has been a slow process.
One major step forward has been the recognition that the costs of protected areas include benefits or economic opportunities that are diminished or lost, such as the value of foregone output from prohibited resource uses or from wildlife damage to crops. These indirect and opportunity costs are often substantial and are incurred by a wide range of groups, particularly the poor. For example, the opportunity costs of alternative land and re-source uses foregone due to the creation of Khao Yai National Park in Thailand are estimated at approximately US$675,000 a year, almost nine times the direct management costs of the protected area32. In Kenya, the net opportunity cost to farming and pastoralist communities of alternative land uses and earnings foregone due to the establishment of PAs has been estimated at more than US$200 million per year33. The economic losses from restricting marine resource use in and around Mafia Island Marine National Park in Tanzania weigh heavily on local fishing communities − dynamite fishing, for instance, can bring a daily income that is more than 6 times the weekly salary of a fisheries officer, and in total unrestricted marine resource utilisation is worth more than $3.3 million a year34.
In many cases, efforts to generate local benefits — however well-intentioned — come nowhere close to offset-ting the opportunity costs of protected areas35. For example, the costs of Uganda’s Lake Mburo National Park
30 Government of Uganda, 2001, Wetland Sector Strategic Plan 2001-2010, Government of the Republic of Uganda, Kampala.
31 Emerton, L., Iyango, L., Luwum, P., and Malinga, A., 1999, The Economic Value of Nakivubo Urban Wetland, Uganda, Uganda National Wetlands Programme, Kampala and IUCN — The World Conservation Union, Eastern Africa Regional Office, Nairobi.
32 Dixon, J. A. and P. B. Sherman, (1990), Economics of Protected Areas: A New Look at Benefits and Costs. Earthscan Publications Ltd: London.
33 Norton-Griffiths, M., and Southey, C. 1995. “The opportunity costs of biodiversity conservation in Kenya” Ecological Economics 12: 125-139.
34 Andersson, J.E.C. and Z. Ngazi, 1995, Marine resource use and the establishment of a marine park: Mafia Island, Tanzania. Ambio 24(7-8): 475-481.
35 Emerton, L., 2001, ‘The Nature of Benefits and the Benefits of Nature: Why Wildlife Conservation has not Economically Benefited Communities in Africa’, pp. 208-227 in Hulme, D. and Murphree, M. (eds) African Wildlife and Livelihoods: The Promise and Performance of Community Conservation, James Currey: Oxford.
Protected Areas in Today’s World: Their Values and Benefits for the Welfare of the Planet
16
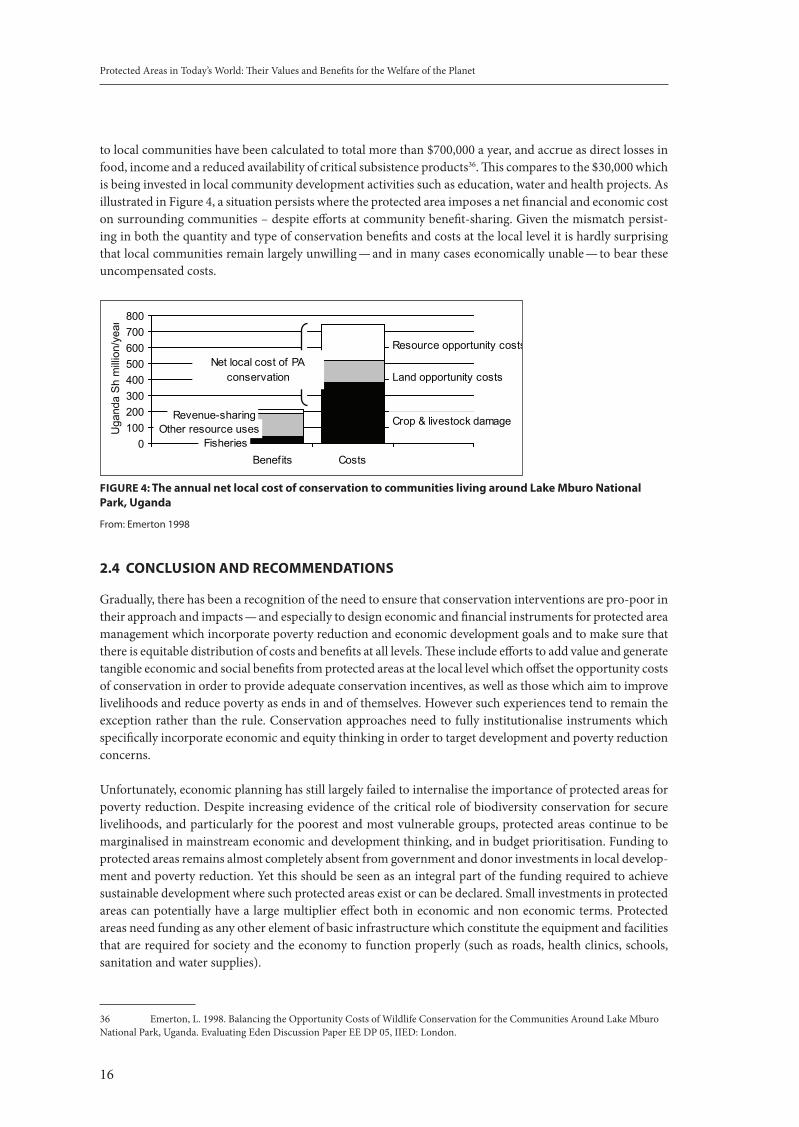
to local communities have been calculated to total more than $700,000 a year, and accrue as direct losses in food, income and a reduced availability of critical subsistence products36. This compares to the $30,000 which is being invested in local community development activities such as education, water and health projects. As illustrated in Figure 4, a situation persists where the protected area imposes a net financial and economic cost on surrounding communities – despite efforts at community benefit-sharing. Given the mismatch persist-ing in both the quantity and type of conservation benefits and costs at the local level it is hardly surprising that local communities remain largely unwilling — and in many cases economically unable — to bear these uncompensated costs.
FIGUre 4: The annual net local cost of conservation to communities living around Lake Mburo National Park, Uganda
From: Emerton 1998
2.4 CoNCLUSIoN ANd reCoMMeNdATIoNS
Gradually, there has been a recognition of the need to ensure that conservation interventions are pro-poor in their approach and impacts — and especially to design economic and financial instruments for protected area management which incorporate poverty reduction and economic development goals and to make sure that there is equitable distribution of costs and benefits at all levels. These include efforts to add value and generate tangible economic and social benefits from protected areas at the local level which offset the opportunity costs of conservation in order to provide adequate conservation incentives, as well as those which aim to improve livelihoods and reduce poverty as ends in and of themselves. However such experiences tend to remain the exception rather than the rule. Conservation approaches need to fully institutionalise instruments which specifically incorporate economic and equity thinking in order to target development and poverty reduction concerns.
Unfortunately, economic planning has still largely failed to internalise the importance of protected areas for poverty reduction. Despite increasing evidence of the critical role of biodiversity conservation for secure livelihoods, and particularly for the poorest and most vulnerable groups, protected areas continue to be marginalised in mainstream economic and development thinking, and in budget prioritisation. Funding to protected areas remains almost completely absent from government and donor investments in local develop-ment and poverty reduction. Yet this should be seen as an integral part of the funding required to achieve sustainable development where such protected areas exist or can be declared. Small investments in protected areas can potentially have a large multiplier effect both in economic and non economic terms. Protected areas need funding as any other element of basic infrastructure which constitute the equipment and facilities that are required for society and the economy to function properly (such as roads, health clinics, schools, sanitation and water supplies).
36 Emerton, L. 1998. Balancing the Opportunity Costs of Wildlife Conservation for the Communities Around Lake Mburo National Park, Uganda. Evaluating Eden Discussion Paper EE DP 05, IIED: London.
0100200300400500600700800
Benefits Costs
Uga
nda
Sh
mill
ion/
year
Crop & livestock damage
Land opportunity costs
Resource opportunity costs
FisheriesOther resource uses
Revenue-sharing
Net local cost of PA conservation
17
Protected Areas Contributing to Poverty Reduction
Efforts to develop governance systems for protected areas that are inclusive of all impacted, particularly the most vulnerable groups, and that respect and acknowledge customary rights are no doubt growing. Empowering local communities is a key factor for such governance systems to contribute to poverty reduction. In all four sites of the study mentioned in Section 2 this was indeed one of the factors of success. Still special attention needs to be paid to ensure that governance systems are transparent, accountable, include woman and youth and are effectively empowering local communities.
There would be little point in generating income from protected areas if when it reaches the local level it creates great inequality, erodes social cohesion and destroys cultural and customary traditions. In many cases, it may be difficult to attain tangible economic benefits from protected areas. This does not mean it is not contributing to poverty reduction. As the study presented in section 2.2 demonstrated there are many indicators that go beyond the economic values perceived as important to poverty reduction. Economic, social and cultural values of protected areas need to be addressed simultaneously to ensure a sustained impact on poverty reduction — acknowledging that poverty is a multi-dimensional concept.
Protected Areas in Today’s World: Their Values and Benefits for the Welfare of the Planet
18
PoVerTY ANd ProTeCTed AreAS3.
Stephanie Mansourian1, Liza Higgins-Zogib1, Nigel Dudley2 and Sue Stolton2
1WWF International, 2Equilibrium Consultants
While most protected areas have primarily been set up to conserve biodiversity they are now increasingly expected to deliver benefits to communities. Providing evidence of the links between poverty reduction and protected areas has occupied researchers for some time. If poverty is defined in a broader and arguably more realistic manner than the one-dollar-a-day definition, it becomes clear that protected areas potentially have a very strong role to play in contributing to poverty reduction. Though much of the evidence illustrating the association between poverty reduction and protected areas remains anecdotal and more research is certainly required, there are many instances where the right types of protected areas, when combined with the appropriate governance systems, have contributed — sometimes considerably — to the well being of the people who live in and around them. The ways in which these areas, primarily set up to conserve biodiversity and now increasingly expected to deliver benefits to communities, can make a difference to elements of poverty are explored in this paper.
3.1 INTrodUCTIoN
Although protected areas were never set up to reduce poverty, they are increasingly expected to do so. As such there have been many attempts to show the positive contribution of protected areas to poverty reduction and development strategies. The complexity of the issue however has rarely been fully addressed. In a recent WWF report entitled “Safety Net: Protected Areas and Poverty Reduction”1, the authors attempted to identify the real and potential contributions that protected areas make to poverty reduction while disaggregating myth from reality. This is all the more important at a time when the Millennium Development Goals (MDGs) have served to re-direct the global community’s focus towards poverty reduction - clearly a fundamentally important goal, but one which has prompted the re-design and re-modelling of many other priorities, including biodiversity projects, to incorporate poverty reduction. Sometimes this reorientation may be appropriate, but in some cases attempts to introduce a poverty reduction angle to the management of protected areas has paradoxically de-valued those protected areas that can truly play a role in poverty reduction
The WWF report mentioned above pays particular attention to problematic definitional issues. The traditional definition of poverty reduction, as bringing people above a US$ 1/day income mark, has come under increas-ing criticism as it omits the non-economic dimensions of poverty and human well being. The one-dollar-a-day definition can be useful under certain circumstances but is clearly an insufficient and overly simplistic method of examining the multi-faceted elements of poverty that people deal with and which impact their relationships with the natural world. As a consequence, many (including the UK Department for International Development (DFID), the Organisation for Economic Co-operation and Development (OECD) and the World Health Organization (WHO)) have elaborated on the definition of poverty and the means of addressing it. When thinking about protected areas and poverty reduction it is important to consider wider dimensions of well being and poverty2. These include:
Subsistence • : non-economic benefits that contribute to well-being, i.e. health, nutrition, clean water and shelter; Economic • : benefits which provide the ability to earn an income, to consume and to have assets;Cultural and spiritual • : pride in community, confidence, living culture, spiritual freedom, education;Environmental services • : role in environmental stability and provision of natural resources;Political • : relating to issues of governance and influence in decision-making processes.
1 Natural Resources Defense Council (2003); What’s On Tap? Grading Drinking Water in U.S. Cities, Natural Resources Defence Council, USA
2 The definition WWF used in its report is based on that of DFID.
19
Poverty and Protected Areas
This broader, and arguably more realistic, conceptualisation of well being and poverty not only more accurately describes the problems facing millions of people, but also allows us to further appreciate the benefits that protected areas can, under the right circumstances, generate for poverty reduction. Drawing on the findings of the ‘Safety Net’ report, this paper explores some of the many ways that protected areas can contribute to poverty reduction in its wider sense and provides a range of recommendations which, if implemented, would strengthen support for protected areas and ensure that their full range of benefits are properly harnessed.
3.2 BeNeFITS FroM ProTeCTed AreAS
Our research provides numerous examples of situations where protected areas clearly provide numerous goods and services of potential value to the poor3. However people’s access to these environmental goods and services and the concrete contributions that they make in bringing people out of poverty, still needs to be properly measured and better understood.
The examples below record some of the contributions that protected areas have made to the different elements of well being as defined above. In some cases, though, the benefits derived from protected areas are important if not essential (e.g. access to clean drinking water) to individual well being, they may not actually reduce poverty (but may contribute to people not falling into poverty). Moreover what many of the examples highlight is that much of the evidence remains anecdotal and causal links are often tenuous. While the potential exists for protected areas to reduce poverty, understanding their exact contribution to this goal, while appreciating their limits, remains a challenge in many instances.
3 Dudley, N, S Mansourian, S Stolton, and S Suksuwan (2008); “Safety Net: Protected Areas and Poverty Reduction”, WWF international, Gland, Switzerland.
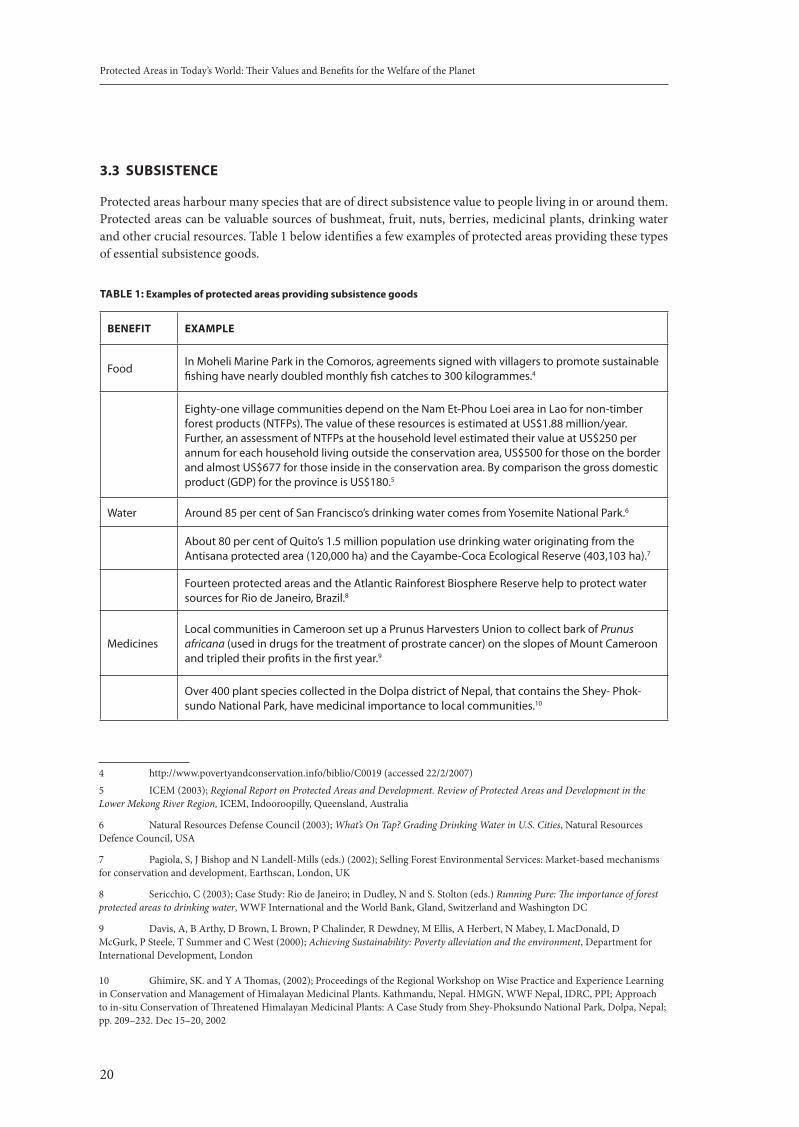
Protected Areas in Today’s World: Their Values and Benefits for the Welfare of the Planet
20
3.3 SUBSISTeNCe
Protected areas harbour many species that are of direct subsistence value to people living in or around them. Protected areas can be valuable sources of bushmeat, fruit, nuts, berries, medicinal plants, drinking water and other crucial resources. Table 1 below identifies a few examples of protected areas providing these types of essential subsistence goods.
TABLe 1: examples of protected areas providing subsistence goods
BeNeFIT eXAMPLe
FoodIn Moheli Marine Park in the Comoros, agreements signed with villagers to promote sustainable fishing have nearly doubled monthly fish catches to 300 kilogrammes.4
Eighty-one village communities depend on the Nam Et-Phou Loei area in Lao for non-timber forest products (NTFPs). The value of these resources is estimated at US$1.88 million/year. Further, an assessment of NTFPs at the household level estimated their value at US$250 per annum for each household living outside the conservation area, US$500 for those on the border and almost US$677 for those inside in the conservation area. By comparison the gross domestic product (GDP) for the province is US$180.5
Water Around 85 per cent of San Francisco’s drinking water comes from Yosemite National Park.6
About 80 per cent of Quito’s 1.5 million population use drinking water originating from the Antisana protected area (120,000 ha) and the Cayambe-Coca Ecological Reserve (403,103 ha).7
Fourteen protected areas and the Atlantic Rainforest Biosphere Reserve help to protect water sources for Rio de Janeiro, Brazil.8
MedicinesLocal communities in Cameroon set up a Prunus Harvesters Union to collect bark of Prunus africana (used in drugs for the treatment of prostrate cancer) on the slopes of Mount Cameroon and tripled their profits in the first year.9
Over 400 plant species collected in the Dolpa district of Nepal, that contains the Shey- Phok-sundo National Park, have medicinal importance to local communities.10
4 http://www.povertyandconservation.info/biblio/C0019 (accessed 22/2/2007)5 ICEM (2003); Regional Report on Protected Areas and Development. Review of Protected Areas and Development in the Lower Mekong River Region, ICEM, Indooroopilly, Queensland, Australia
6 Natural Resources Defense Council (2003); What’s On Tap? Grading Drinking Water in U.S. Cities, Natural Resources Defence Council, USA
7 Pagiola, S, J Bishop and N Landell-Mills (eds.) (2002); Selling Forest Environmental Services: Market-based mechanisms for conservation and development, Earthscan, London, UK
8 Sericchio, C (2003); Case Study: Rio de Janeiro; in Dudley, N and S. Stolton (eds.) Running Pure: The importance of forest protected areas to drinking water, WWF International and the World Bank, Gland, Switzerland and Washington DC
9 Davis, A, B Arthy, D Brown, L Brown, P Chalinder, R Dewdney, M Ellis, A Herbert, N Mabey, L MacDonald, D McGurk, P Steele, T Summer and C West (2000); Achieving Sustainability: Poverty alleviation and the environment, Department for International Development, London
10 Ghimire, SK. and Y A Thomas, (2002); Proceedings of the Regional Workshop on Wise Practice and Experience Learning in Conservation and Management of Himalayan Medicinal Plants. Kathmandu, Nepal. HMGN, WWF Nepal, IDRC, PPI; Approach to in-situ Conservation of Threatened Himalayan Medicinal Plants: A Case Study from Shey-Phoksundo National Park, Dolpa, Nepal; pp. 209–232. Dec 15–20, 2002
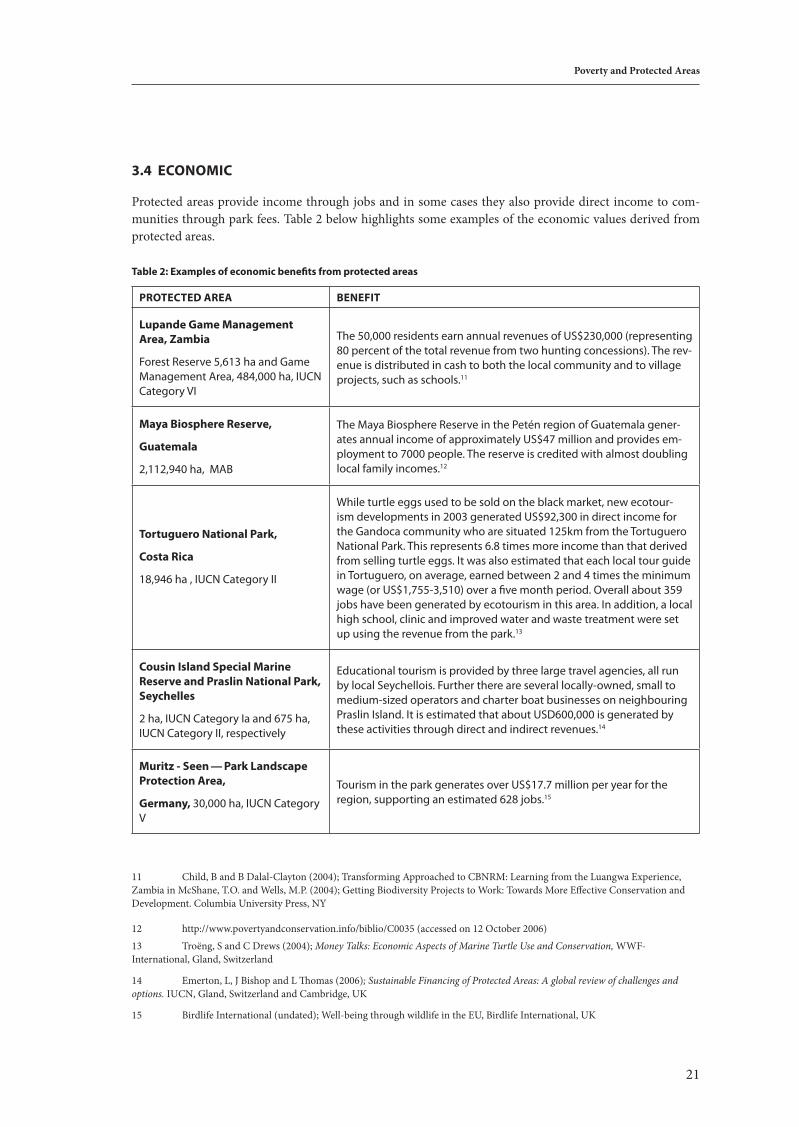
21
Poverty and Protected Areas
3.4 eCoNoMIC
Protected areas provide income through jobs and in some cases they also provide direct income to com-munities through park fees. Table 2 below highlights some examples of the economic values derived from protected areas.
Table 2: examples of economic benefits from protected areas
ProTeCTed AreA BeNeFIT
Lupande Game Management Area, Zambia
Forest Reserve 5,613 ha and Game Management Area, 484,000 ha, IUCN Category VI
The 50,000 residents earn annual revenues of US$230,000 (representing 80 percent of the total revenue from two hunting concessions). The rev-enue is distributed in cash to both the local community and to village projects, such as schools.11
Maya Biosphere reserve,
Guatemala
2,112,940 ha, MAB
The Maya Biosphere Reserve in the Petén region of Guatemala gener-ates annual income of approximately US$47 million and provides em-ployment to 7000 people. The reserve is credited with almost doubling local family incomes.12
Tortuguero National Park,
Costa rica
18,946 ha , IUCN Category II
While turtle eggs used to be sold on the black market, new ecotour-ism developments in 2003 generated US$92,300 in direct income for the Gandoca community who are situated 125km from the Tortuguero National Park. This represents 6.8 times more income than that derived from selling turtle eggs. It was also estimated that each local tour guide in Tortuguero, on average, earned between 2 and 4 times the minimum wage (or US$1,755-3,510) over a five month period. Overall about 359 jobs have been generated by ecotourism in this area. In addition, a local high school, clinic and improved water and waste treatment were set up using the revenue from the park.13
Cousin Island Special Marine reserve and Praslin National Park, Seychelles
2 ha, IUCN Category Ia and 675 ha, IUCN Category II, respectively
Educational tourism is provided by three large travel agencies, all run by local Seychellois. Further there are several locally-owned, small to medium-sized operators and charter boat businesses on neighbouring Praslin Island. It is estimated that about USD600,000 is generated by these activities through direct and indirect revenues.14
Muritz - Seen — Park Landscape Protection Area,
Germany, 30,000 ha, IUCN Category V
Tourism in the park generates over US$17.7 million per year for the region, supporting an estimated 628 jobs.15
11 Child, B and B Dalal-Clayton (2004); Transforming Approached to CBNRM: Learning from the Luangwa Experience, Zambia in McShane, T.O. and Wells, M.P. (2004); Getting Biodiversity Projects to Work: Towards More Effective Conservation and Development. Columbia University Press, NY
12 http://www.povertyandconservation.info/biblio/C0035 (accessed on 12 October 2006)13 Troëng, S and C Drews (2004); Money Talks: Economic Aspects of Marine Turtle Use and Conservation, WWF-International, Gland, Switzerland
14 Emerton, L, J Bishop and L Thomas (2006); Sustainable Financing of Protected Areas: A global review of challenges and options. IUCN, Gland, Switzerland and Cambridge, UK
15 Birdlife International (undated); Well-being through wildlife in the EU, Birdlife International, UK
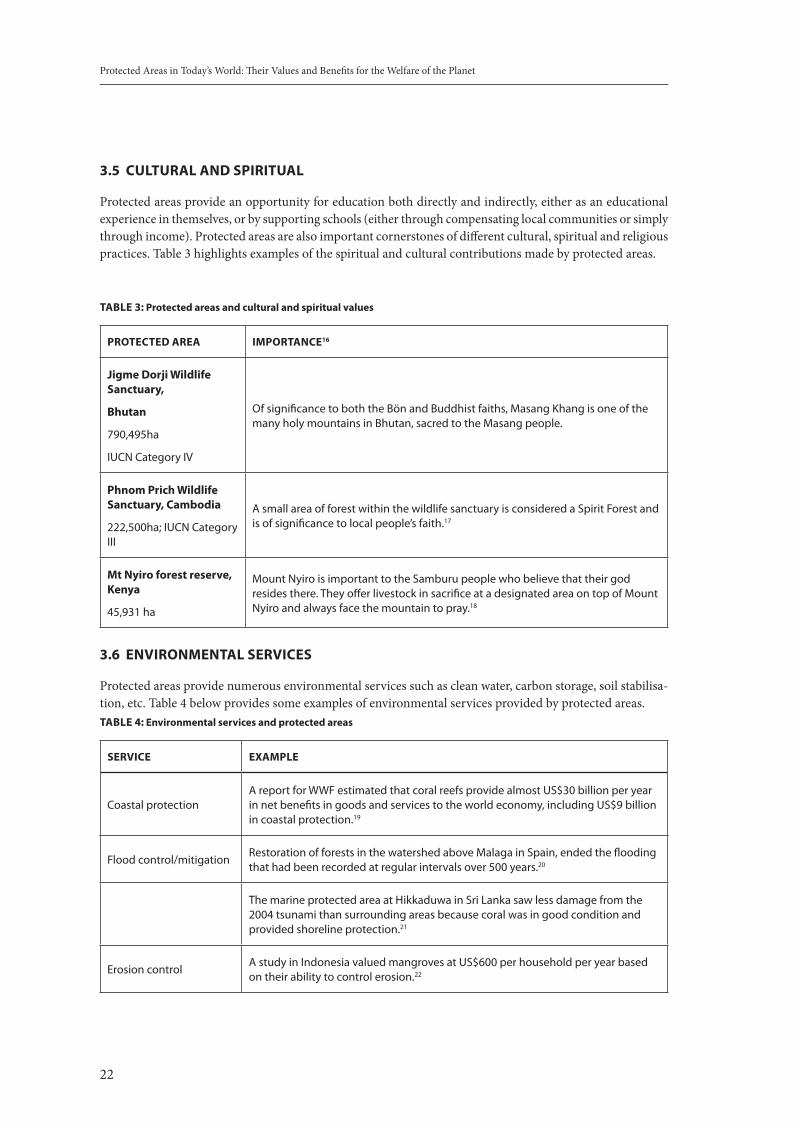
Protected Areas in Today’s World: Their Values and Benefits for the Welfare of the Planet
22
3.5 CULTUrAL ANd SPIrITUAL
Protected areas provide an opportunity for education both directly and indirectly, either as an educational experience in themselves, or by supporting schools (either through compensating local communities or simply through income). Protected areas are also important cornerstones of different cultural, spiritual and religious practices. Table 3 highlights examples of the spiritual and cultural contributions made by protected areas.
TABLe 3: Protected areas and cultural and spiritual values
ProTeCTed AreA IMPorTANCe16
Jigme dorji wildlife Sanctuary,
Bhutan
790,495ha
IUCN Category IV
Of significance to both the Bön and Buddhist faiths, Masang Khang is one of the many holy mountains in Bhutan, sacred to the Masang people.
Phnom Prich wildlife Sanctuary, Cambodia
222,500ha; IUCN Category III
A small area of forest within the wildlife sanctuary is considered a Spirit Forest and is of significance to local people’s faith.17
Mt Nyiro forest reserve, Kenya
45,931 ha
Mount Nyiro is important to the Samburu people who believe that their god resides there. They offer livestock in sacrifice at a designated area on top of Mount Nyiro and always face the mountain to pray.18
3.6 eNVIroNMeNTAL SerVICeS
Protected areas provide numerous environmental services such as clean water, carbon storage, soil stabilisa-tion, etc. Table 4 below provides some examples of environmental services provided by protected areas.TABLe 4: environmental services and protected areas
SerVICe eXAMPLe
Coastal protectionA report for WWF estimated that coral reefs provide almost US$30 billion per year in net benefits in goods and services to the world economy, including US$9 billion in coastal protection.19
Flood control/mitigationRestoration of forests in the watershed above Malaga in Spain, ended the flooding that had been recorded at regular intervals over 500 years.20
The marine protected area at Hikkaduwa in Sri Lanka saw less damage from the 2004 tsunami than surrounding areas because coral was in good condition and provided shoreline protection.21
Erosion controlA study in Indonesia valued mangroves at US$600 per household per year based on their ability to control erosion.22
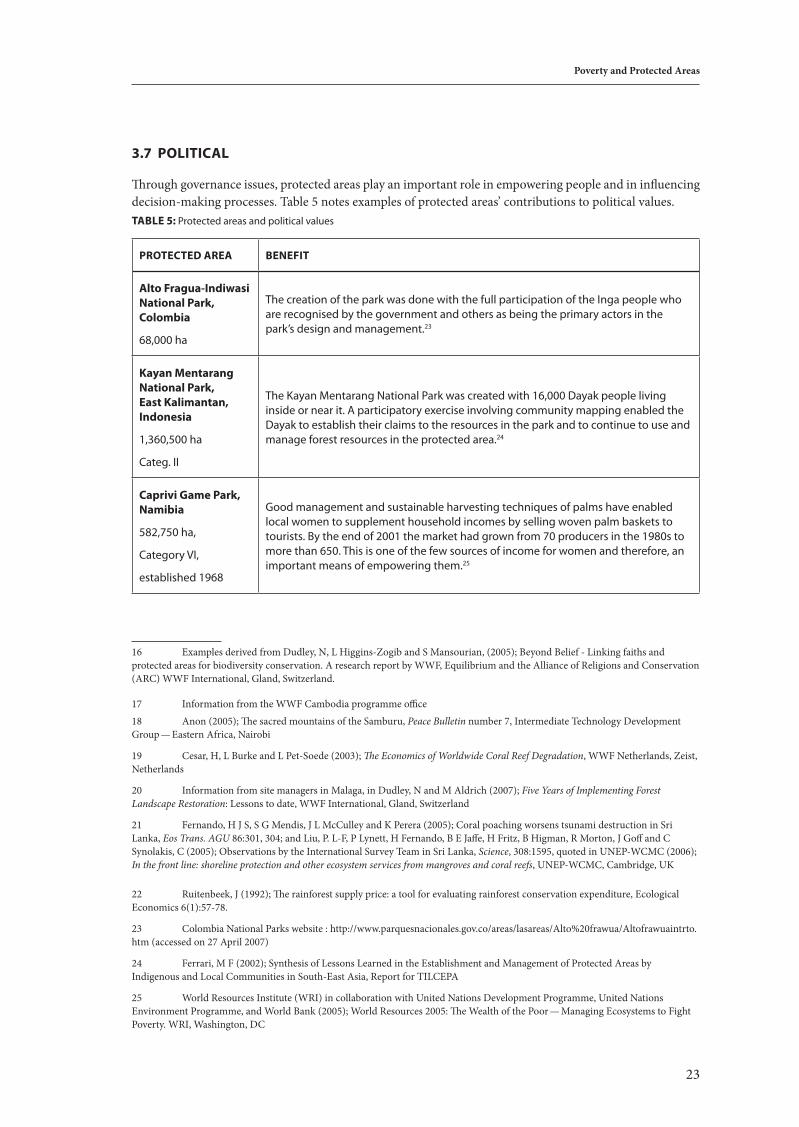
23
Poverty and Protected Areas
3.7 PoLITICAL
Through governance issues, protected areas play an important role in empowering people and in influencing decision-making processes. Table 5 notes examples of protected areas’ contributions to political values.TABLe 5: Protected areas and political values
ProTeCTed AreA BeNeFIT
Alto Fragua-Indiwasi National Park, Colombia
68,000 ha
The creation of the park was done with the full participation of the Inga people who are recognised by the government and others as being the primary actors in the park’s design and management.23
Kayan Mentarang National Park, east Kalimantan, Indonesia
1,360,500 ha
Categ. II
The Kayan Mentarang National Park was created with 16,000 Dayak people living inside or near it. A participatory exercise involving community mapping enabled the Dayak to establish their claims to the resources in the park and to continue to use and manage forest resources in the protected area.24
Caprivi Game Park, Namibia
582,750 ha,
Category VI,
established 1968
Good management and sustainable harvesting techniques of palms have enabled local women to supplement household incomes by selling woven palm baskets to tourists. By the end of 2001 the market had grown from 70 producers in the 1980s to more than 650. This is one of the few sources of income for women and therefore, an important means of empowering them.25
16 Examples derived from Dudley, N, L Higgins-Zogib and S Mansourian, (2005); Beyond Belief - Linking faiths and protected areas for biodiversity conservation. A research report by WWF, Equilibrium and the Alliance of Religions and Conservation (ARC) WWF International, Gland, Switzerland.
17 Information from the WWF Cambodia programme office18 Anon (2005); The sacred mountains of the Samburu, Peace Bulletin number 7, Intermediate Technology Development Group — Eastern Africa, Nairobi
19 Cesar, H, L Burke and L Pet-Soede (2003); The Economics of Worldwide Coral Reef Degradation, WWF Netherlands, Zeist, Netherlands
20 Information from site managers in Malaga, in Dudley, N and M Aldrich (2007); Five Years of Implementing Forest Landscape Restoration: Lessons to date, WWF International, Gland, Switzerland
21 Fernando, H J S, S G Mendis, J L McCulley and K Perera (2005); Coral poaching worsens tsunami destruction in Sri Lanka, Eos Trans. AGU 86:301, 304; and Liu, P. L-F, P Lynett, H Fernando, B E Jaffe, H Fritz, B Higman, R Morton, J Goff and C Synolakis, C (2005); Observations by the International Survey Team in Sri Lanka, Science, 308:1595, quoted in UNEP-WCMC (2006); In the front line: shoreline protection and other ecosystem services from mangroves and coral reefs, UNEP-WCMC, Cambridge, UK
22 Ruitenbeek, J (1992); The rainforest supply price: a tool for evaluating rainforest conservation expenditure, Ecological Economics 6(1):57-78.
23 Colombia National Parks website : http://www.parquesnacionales.gov.co/areas/lasareas/Alto%20frawua/Altofrawuaintrto.htm (accessed on 27 April 2007)
24 Ferrari, M F (2002); Synthesis of Lessons Learned in the Establishment and Management of Protected Areas by Indigenous and Local Communities in South-East Asia, Report for TILCEPA
25 World Resources Institute (WRI) in collaboration with United Nations Development Programme, United Nations Environment Programme, and World Bank (2005); World Resources 2005: The Wealth of the Poor — Managing Ecosystems to Fight Poverty. WRI, Washington, DC
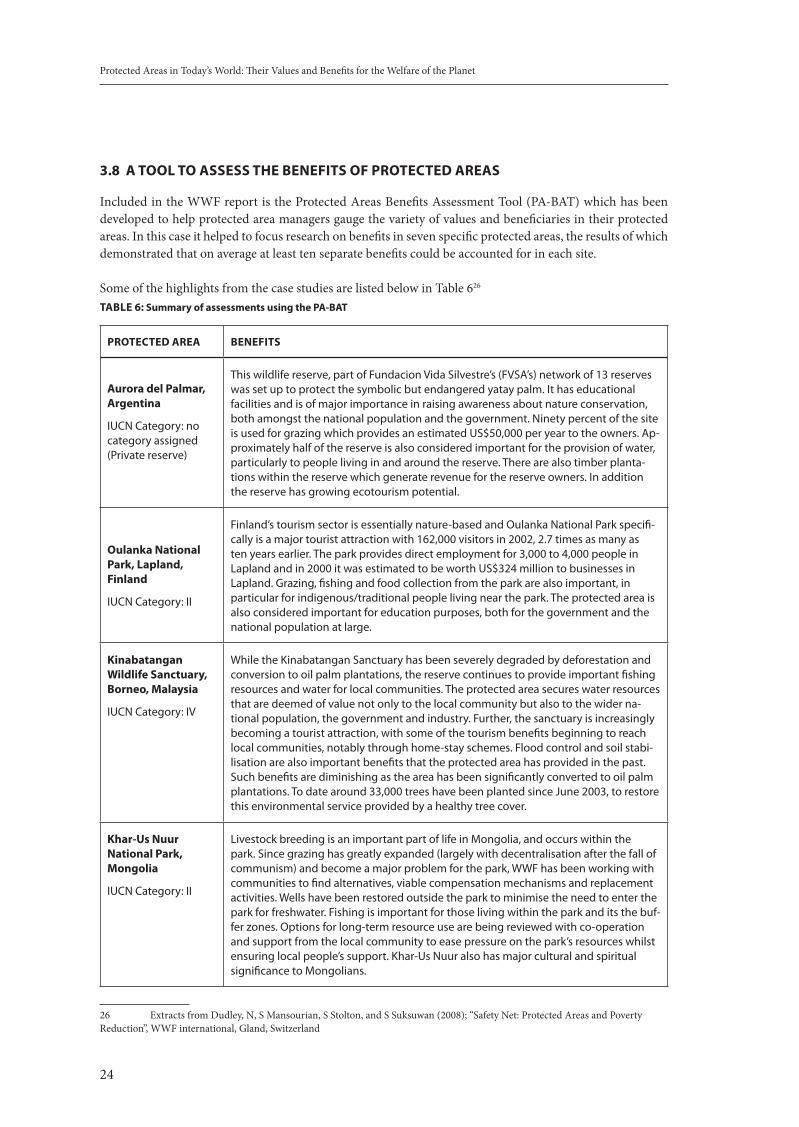
Protected Areas in Today’s World: Their Values and Benefits for the Welfare of the Planet
24
3.8 A TooL To ASSeSS THe BeNeFITS oF ProTeCTed AreAS
Included in the WWF report is the Protected Areas Benefits Assessment Tool (PA-BAT) which has been developed to help protected area managers gauge the variety of values and beneficiaries in their protected areas. In this case it helped to focus research on benefits in seven specific protected areas, the results of which demonstrated that on average at least ten separate benefits could be accounted for in each site.
Some of the highlights from the case studies are listed below in Table 626
TABLe 6: Summary of assessments using the PA-BAT
ProTeCTed AreA BeNeFITS
Aurora del Palmar, Argentina
IUCN Category: no category assigned (Private reserve)
This wildlife reserve, part of Fundacion Vida Silvestre’s (FVSA’s) network of 13 reserves was set up to protect the symbolic but endangered yatay palm. It has educational facilities and is of major importance in raising awareness about nature conservation, both amongst the national population and the government. Ninety percent of the site is used for grazing which provides an estimated US$50,000 per year to the owners. Ap-proximately half of the reserve is also considered important for the provision of water, particularly to people living in and around the reserve. There are also timber planta-tions within the reserve which generate revenue for the reserve owners. In addition the reserve has growing ecotourism potential.
oulanka National Park, Lapland, Finland
IUCN Category: II
Finland’s tourism sector is essentially nature-based and Oulanka National Park specifi-cally is a major tourist attraction with 162,000 visitors in 2002, 2.7 times as many as ten years earlier. The park provides direct employment for 3,000 to 4,000 people in Lapland and in 2000 it was estimated to be worth US$324 million to businesses in Lapland. Grazing, fishing and food collection from the park are also important, in particular for indigenous/traditional people living near the park. The protected area is also considered important for education purposes, both for the government and the national population at large.
Kinabatangan wildlife Sanctuary, Borneo, Malaysia
IUCN Category: IV
While the Kinabatangan Sanctuary has been severely degraded by deforestation and conversion to oil palm plantations, the reserve continues to provide important fishing resources and water for local communities. The protected area secures water resources that are deemed of value not only to the local community but also to the wider na-tional population, the government and industry. Further, the sanctuary is increasingly becoming a tourist attraction, with some of the tourism benefits beginning to reach local communities, notably through home-stay schemes. Flood control and soil stabi-lisation are also important benefits that the protected area has provided in the past. Such benefits are diminishing as the area has been significantly converted to oil palm plantations. To date around 33,000 trees have been planted since June 2003, to restore this environmental service provided by a healthy tree cover.
Khar-Us Nuur National Park, Mongolia
IUCN Category: II
Livestock breeding is an important part of life in Mongolia, and occurs within the park. Since grazing has greatly expanded (largely with decentralisation after the fall of communism) and become a major problem for the park, WWF has been working with communities to find alternatives, viable compensation mechanisms and replacement activities. Wells have been restored outside the park to minimise the need to enter the park for freshwater. Fishing is important for those living within the park and its the buf-fer zones. Options for long-term resource use are being reviewed with co-operation and support from the local community to ease pressure on the park’s resources whilst ensuring local people’s support. Khar-Us Nuur also has major cultural and spiritual significance to Mongolians.
26 Extracts from Dudley, N, S Mansourian, S Stolton, and S Suksuwan (2008); “Safety Net: Protected Areas and Poverty Reduction”, WWF international, Gland, Switzerland
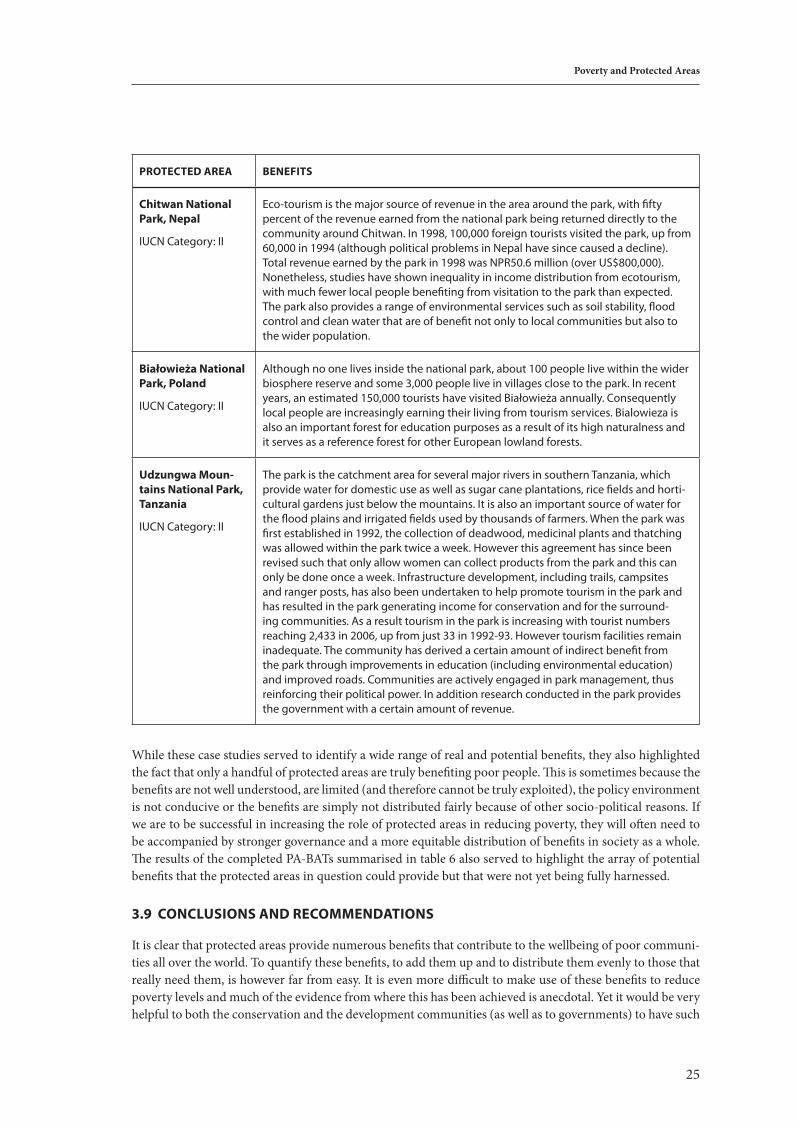
25
Poverty and Protected Areas
ProTeCTed AreA BeNeFITS
Chitwan National Park, Nepal
IUCN Category: II
Eco-tourism is the major source of revenue in the area around the park, with fifty percent of the revenue earned from the national park being returned directly to the community around Chitwan. In 1998, 100,000 foreign tourists visited the park, up from 60,000 in 1994 (although political problems in Nepal have since caused a decline). Total revenue earned by the park in 1998 was NPR50.6 million (over US$800,000). Nonetheless, studies have shown inequality in income distribution from ecotourism, with much fewer local people benefiting from visitation to the park than expected. The park also provides a range of environmental services such as soil stability, flood control and clean water that are of benefit not only to local communities but also to the wider population.
Białowieża National Park, Poland
IUCN Category: II
Although no one lives inside the national park, about 100 people live within the wider biosphere reserve and some 3,000 people live in villages close to the park. In recent years, an estimated 150,000 tourists have visited Białowieża annually. Consequently local people are increasingly earning their living from tourism services. Bialowieza is also an important forest for education purposes as a result of its high naturalness and it serves as a reference forest for other European lowland forests.
Udzungwa Moun-tains National Park, Tanzania
IUCN Category: II
The park is the catchment area for several major rivers in southern Tanzania, which provide water for domestic use as well as sugar cane plantations, rice fields and horti-cultural gardens just below the mountains. It is also an important source of water for the flood plains and irrigated fields used by thousands of farmers. When the park was first established in 1992, the collection of deadwood, medicinal plants and thatching was allowed within the park twice a week. However this agreement has since been revised such that only allow women can collect products from the park and this can only be done once a week. Infrastructure development, including trails, campsites and ranger posts, has also been undertaken to help promote tourism in the park and has resulted in the park generating income for conservation and for the surround-ing communities. As a result tourism in the park is increasing with tourist numbers reaching 2,433 in 2006, up from just 33 in 1992-93. However tourism facilities remain inadequate. The community has derived a certain amount of indirect benefit from the park through improvements in education (including environmental education) and improved roads. Communities are actively engaged in park management, thus reinforcing their political power. In addition research conducted in the park provides the government with a certain amount of revenue.
While these case studies served to identify a wide range of real and potential benefits, they also highlighted the fact that only a handful of protected areas are truly benefiting poor people. This is sometimes because the benefits are not well understood, are limited (and therefore cannot be truly exploited), the policy environment is not conducive or the benefits are simply not distributed fairly because of other socio-political reasons. If we are to be successful in increasing the role of protected areas in reducing poverty, they will often need to be accompanied by stronger governance and a more equitable distribution of benefits in society as a whole. The results of the completed PA-BATs summarised in table 6 also served to highlight the array of potential benefits that the protected areas in question could provide but that were not yet being fully harnessed.
3.9 CoNCLUSIoNS ANd reCoMMeNdATIoNS
It is clear that protected areas provide numerous benefits that contribute to the wellbeing of poor communi-ties all over the world. To quantify these benefits, to add them up and to distribute them evenly to those that really need them, is however far from easy. It is even more difficult to make use of these benefits to reduce poverty levels and much of the evidence from where this has been achieved is anecdotal. Yet it would be very helpful to both the conservation and the development communities (as well as to governments) to have such
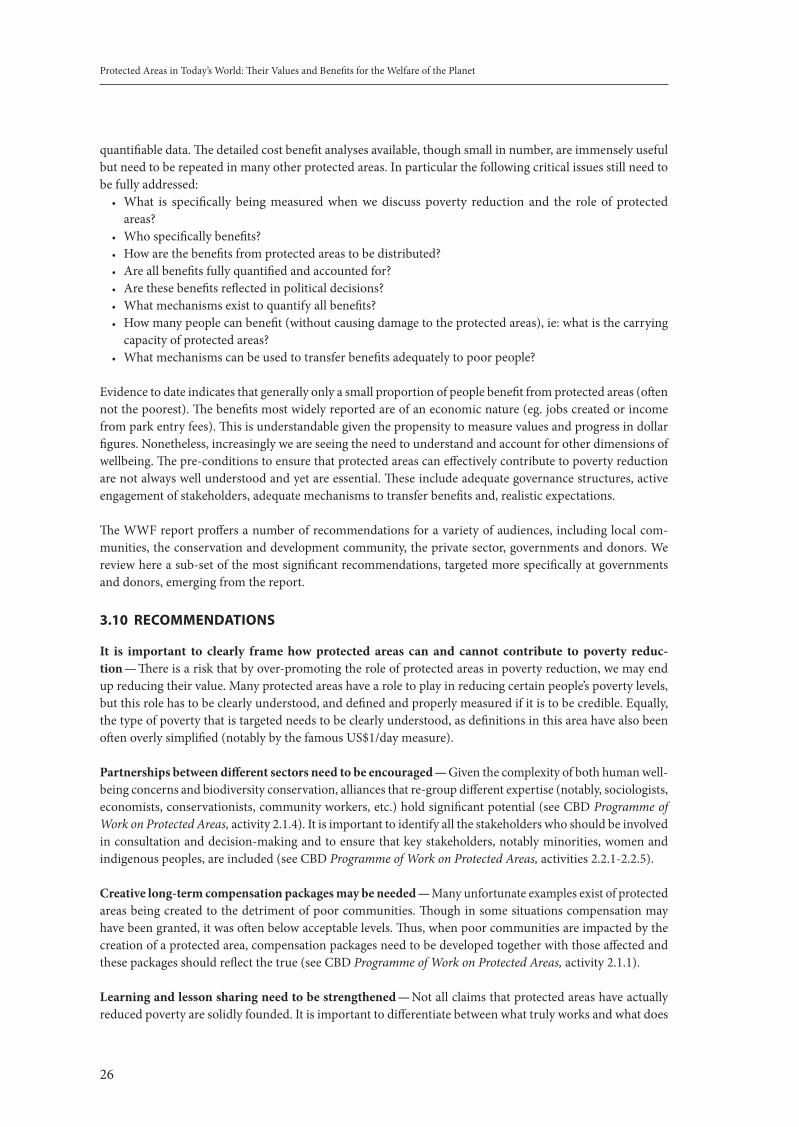
Protected Areas in Today’s World: Their Values and Benefits for the Welfare of the Planet
26
quantifiable data. The detailed cost benefit analyses available, though small in number, are immensely useful but need to be repeated in many other protected areas. In particular the following critical issues still need to be fully addressed:
What is specifically being measured when we discuss poverty reduction and the role of protected •areas?Who specifically benefits? •How are the benefits from protected areas to be distributed? •Are all benefits fully quantified and accounted for? •Are these benefits reflected in political decisions? •What mechanisms exist to quantify all benefits? •How many people can benefit (without causing damage to the protected areas), ie: what is the carrying •capacity of protected areas?What mechanisms can be used to transfer benefits adequately to poor people? •
Evidence to date indicates that generally only a small proportion of people benefit from protected areas (often not the poorest). The benefits most widely reported are of an economic nature (eg. jobs created or income from park entry fees). This is understandable given the propensity to measure values and progress in dollar figures. Nonetheless, increasingly we are seeing the need to understand and account for other dimensions of wellbeing. The pre-conditions to ensure that protected areas can effectively contribute to poverty reduction are not always well understood and yet are essential. These include adequate governance structures, active engagement of stakeholders, adequate mechanisms to transfer benefits and, realistic expectations.
The WWF report proffers a number of recommendations for a variety of audiences, including local com-munities, the conservation and development community, the private sector, governments and donors. We review here a sub-set of the most significant recommendations, targeted more specifically at governments and donors, emerging from the report.
3.10 reCoMMeNdATIoNS
It is important to clearly frame how protected areas can and cannot contribute to poverty reduc-tion — There is a risk that by over-promoting the role of protected areas in poverty reduction, we may end up reducing their value. Many protected areas have a role to play in reducing certain people’s poverty levels, but this role has to be clearly understood, and defined and properly measured if it is to be credible. Equally, the type of poverty that is targeted needs to be clearly understood, as definitions in this area have also been often overly simplified (notably by the famous US$1/day measure).
Partnerships between different sectors need to be encouraged — Given the complexity of both human well-being concerns and biodiversity conservation, alliances that re-group different expertise (notably, sociologists, economists, conservationists, community workers, etc.) hold significant potential (see CBD Programme of Work on Protected Areas, activity 2.1.4). It is important to identify all the stakeholders who should be involved in consultation and decision-making and to ensure that key stakeholders, notably minorities, women and indigenous peoples, are included (see CBD Programme of Work on Protected Areas, activities 2.2.1-2.2.5).
Creative long-term compensation packages may be needed — Many unfortunate examples exist of protected areas being created to the detriment of poor communities. Though in some situations compensation may have been granted, it was often below acceptable levels. Thus, when poor communities are impacted by the creation of a protected area, compensation packages need to be developed together with those affected and these packages should reflect the true (see CBD Programme of Work on Protected Areas, activity 2.1.1).
Learning and lesson sharing need to be strengthened — Not all claims that protected areas have actually reduced poverty are solidly founded. It is important to differentiate between what truly works and what does
27
Poverty and Protected Areas
not with the overall aim of replicating good examples and correcting bad ones. This also implies proper monitoring with real baselines (see CBD Programme of Work on Protected Areas, activities 1.4.8, 3.2.2, 3.2.3, 4.1.5, 4.4.1, 4.4.2 and 4.4.4). The role of institutions such as IUCN’s Commission on Environmental, Economic and Social Policy (CEESP) and the CBD’s Clearing House Mechanism are important in this respect.
Distribution of benefits needs to be improved — Part of the problem with the poverty reduction significance of protected areas (as with other tools) is that benefits often accrue to a minority of people. Further those that do benefit from protected areas may not necessarily be those in greatest need. Target groups thus need to be carefully identified, consulted and understood so that they can be effectively reached (see CBD Programme of Work on Protected Areas, activities 2.1.1 and 2.1.6). This presents challenges that will require the involvement of multiple sectors of society and cannot just be addressed within protected area management.
Current trends are likely to create significant future challenges for which we should be prepared — Climate change, urbanisation, desertification etc, are likely to create significant new challenges as well as opportunities for both protected areas and poor people. Thus, protected areas may help mitigate major “natural disasters” resulting from climate change. At the same time, urbanisation may provide new opportunities for certain pro-tected areas, while possibly putting additional pressure on others (see CBD Programme of Work on Protected Areas, activities 1.4.5, 1.5.4 and 1.5.5).
Protected areas should be better integrated into policy frameworks — All too often the environment is considered as a separate issue when it is in fact an integral part of so many sectors. Even within the Millennium Development Goals, the environment was categorised as a separate goal (MDG 7). Yet, many are increasingly arguing that unless the environment is addressed as an integral part of policies, most of the other MDGs will not be met. Landscape (and seascape) planning approaches allow a better integration of protected areas into a country’s priorities and plans (see CBD Programme of Work on Protected Areas, activities 1.2.1, 1.2.2 and 3.1.3).
New governance structures for protected areas need to be applied — As we have seen above, one dimen-sion of poverty is that of political engagement and land ownership and management are a significant means of empowering people (or disenfranchising them). For this reason one important aspect of protected areas management that is increasingly being developed and should be supported and strengthened is that of gov-ernance structures (e.g. co-management, private reserves, Community Conserved Areas etc). Whereas the traditional model for protected areas implied state ownership and management, in many cases this had proven not only inefficient but also counterproductive in relation to poverty reduction. On the contrary, engaging local communities (often poor people) in the management of protected areas to which they have traditionally lived, addresses not only an important dimension of poverty but also often provides an effective means of improving protected area management. Governments can help this process by ensuring that such approaches are covered in the legal framework for protected areas, removing any perverse incentives that might hinder their uptake and by actively encouraging their sustainable use (see CBD Programme of Work on Protected Areas, activities 2.1.2, 2.1.3 and 2.1.5).
It is important to suitably measure the benefits of protected areas — One reason protected areas and bio-diversity more generally have been mismanaged is that their vast array of benefits have not been properly valued in terms that allow them to be clearly included in economic decisions. Measurement tools to remedy this need to be developed and used widely so that decisions that relate to protected areas and poor people, take the true value of protected areas (including their value to poor communities living inside or near the protected area) into account (see CBD Programme of Work on Protected Areas, activity 3.1.2).
Significantly greater funding needs to be channelled to protected areas — Protected areas remain vastly under-resourced and funding in many cases is decreasing rather than increasing. Since protected areas protect a public good, governments have a responsibility to provide a significant share of the long term and steady
Protected Areas in Today’s World: Their Values and Benefits for the Welfare of the Planet
28
funding to protected areas. At the same time new sources of funding are required and should be actively sought. While many are, quite rightly, seeking alternative sources of funding, it is essential that governments maintain a minimal core funding. Not all protected areas can be self-financing and governments will need to invest in a good protected area network for the long-term stability of their own country and the wider global environment (see CBD Programme of Work on Protected Areas, activities 3.4.2-3.4.9).
Commitments need to be long term — Both biodiversity conservation and poverty reduction require that long-term perspectives be taken as achieving measurable improvements in both areas will take time. Unfortunately, all too often, donors focus on short term results and, consequently projects are either doomed to fail, or are focused on relatively limited results in order to be able to demonstrate success. Donor agencies should increasingly start to channel funds to projects/programmes that are long-term. This requires a shift in mindset and a change in the relationship between donors and recipients. Thus donors should be more actively engaged in project/programme development and be willing to adapt along with the needs of the project.
As a final note, it is worth reminding readers that protected areas were initially created as tools to protect biodiversity. Today, they are also being asked to reduce poverty and contribute to livelihoods. While this is possible with some protected areas, it will not be the case for all protected areas. However this does not render those less able to contribute to community welfare less valuable. We should not lose sight of the initial purpose of protected areas but continue to pursue more seriously other types of protected areas (IUCN categories V and VI for example) and endeavour to make them work for the mutual benefit of both people and biodiversity.
29
Local Benefits of Protected Areas: Perspectives and Experiences of Conservation International
LoCAL BeNeFITS oF ProTeCTed AreAS:4. PerSPeCTIVeS ANd eXPerIeNCeS oF CoNSerVATIoN INTerNATIoNAL
Katrina Brandon1 and Aaron Bruner2
1Center for Applied Biodiversity Science – Conservation International, 2Conservation International
Dwindling species and degraded landscapes, seascapes and watersheds — the loss of biodiversity — reduce the quality of life for all, especially the poor. Key services that are lost as biodiversity disappears include provision of clean water, food, materials, storm buffers, pollination of crops, and reduction of diseases such as malaria. Conservation International (CI) believes that maintaining these services and the ecosystems that provide them is essential for lasting social and economic development. Although conservation has been described as a luxury that poor countries cannot afford, we believe the opposite is true, especially over the long term. Protected areas (PAs) (e.g., parks), a recognized mechanism for protecting species and stopping habitat conversion, are a critical means to achieving this goal.
Protected area benefits ex tend to users at different scales, from local people who depend on particular species for their livelihood, to nations that depend on abundant freshwater, to the glob al community that depends on nature’s capacity to regulate climate. We are only beginning to understand the complex and adverse impacts on people as ecosystems lose their ability to provide these goods and services. What is clear though, is that as ecosystem health and biodiversity decline, the poor are the most likely to suffer from declines in wild food sources, medicines, and freshwater. They are also more vulnerable to emerging infectious diseases. Further, there are strong ripple effects among ecosystems, and degradation of one system can affect many others, lead-ing to an interlinked downward spiral for people and the environment. For example, upland deforestation carries soils downstream, diminishing hydropower generation and affecting local rainfall patterns, in turn often triggering drought or faster-acting and more devastating mudslides and flooding. Upland soil runoff also reduces the quality of freshwater and the availability of fish and other freshwater foods. If the river flows to the ocean, sedimentation can affect coastal reefs, further diminishing the availability of food and other resources for local communities.
Yet despite their obvious importance to humans, ecosystem services are often ignored in decisions to convert natural areas into more “economically productive” land uses, such as infrastructure, production agriculture, and pasture. There are several explanations for this. First, until recently, ecosystem services have been poorly understood and therefore not given any value. Their value is often not evident until the services are lost and alternatives must be found. Second, even at a local level, the benefits of many ecosystem services are broadly disbursed, while earnings from actions that provide a short-term payoff (but cause ecosystem degradation) are concentrated. So individuals can gain in the short-term, even though over time, or when many individuals try to benefit, the resource base is degraded. For example, farmers may clear land upslope from other farmers because their benefits from clearing (e.g. the return on cash crops) are unrelated to costs faced by farmers downstream. A particularly insidious case of this is when unscrupulous logging operations enter community forests, frequently at huge cost to entire communities, but resulting in windfalls for only a few individuals. Third, many poor people simply have practical subsistence needs that lead them to use resources unsustain-ably, even if doing so is not a good long term development choice.
The latter two of these explanations especially point to the need for governments and civil society to take an active role in protecting ecosystem services through policies and provision of alternatives to poor people facing the choice of habitat conversion. Simply relying on ecosystem services will rarely be sufficient to lift substantial numbers of poor people out of poverty. Protected areas alone can therefore not be expected to solve the fundamental conditions that lead to poverty in most countries; multiple, simultaneous investments and actions are needed. Yet conservation actions, with PAs as a starting point, can help prevent and reduce poverty by supporting livelihoods and maintaining ecosystem services.
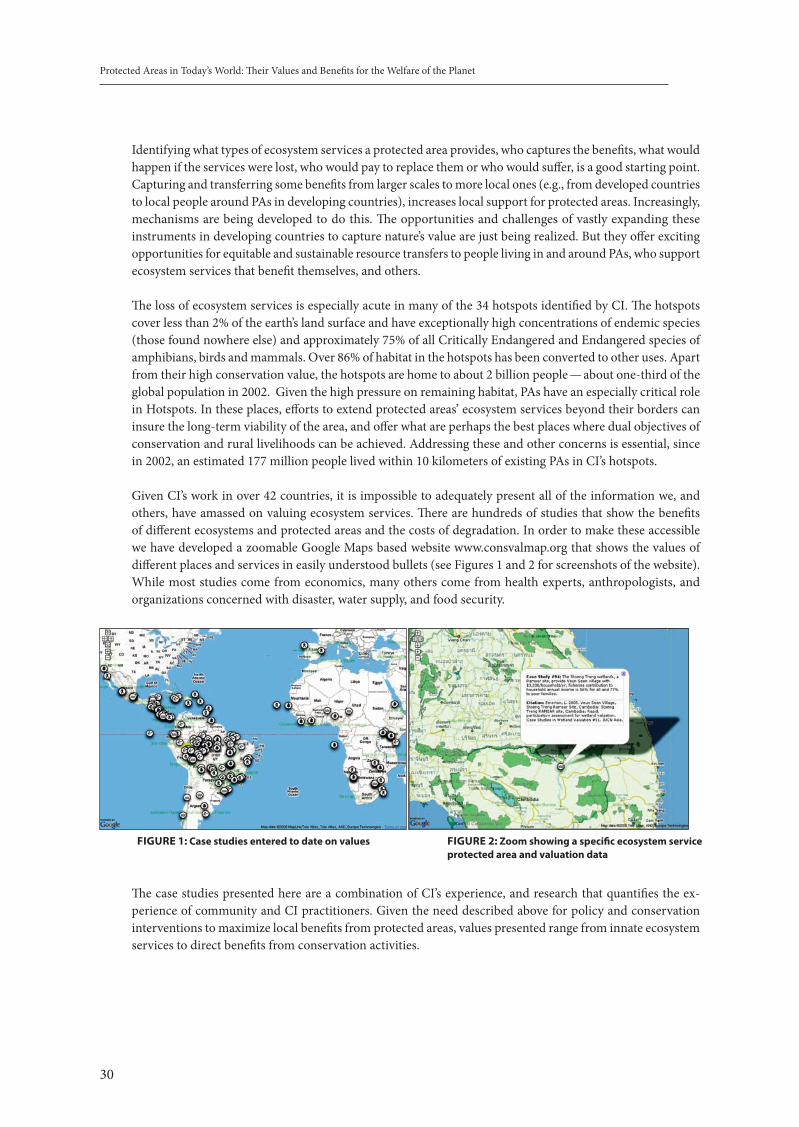
Protected Areas in Today’s World: Their Values and Benefits for the Welfare of the Planet
30
Identifying what types of ecosystem services a protected area provides, who captures the benefits, what would happen if the services were lost, who would pay to replace them or who would suffer, is a good starting point. Capturing and transferring some benefits from larger scales to more local ones (e.g., from developed countries to local people around PAs in developing countries), increases local support for protected areas. Increasingly, mechanisms are being developed to do this. The opportunities and challenges of vastly expanding these instruments in developing countries to capture nature’s value are just being realized. But they offer exciting opportunities for equitable and sustainable resource transfers to people living in and around PAs, who support ecosystem services that benefit themselves, and others.
The loss of ecosystem services is especially acute in many of the 34 hotspots identified by CI. The hotspots cover less than 2% of the earth’s land surface and have exceptionally high concentrations of endemic species (those found nowhere else) and approximately 75% of all Critically Endangered and Endangered species of amphibians, birds and mammals. Over 86% of habitat in the hotspots has been converted to other uses. Apart from their high conservation value, the hotspots are home to about 2 billion people — about one-third of the global population in 2002. Given the high pressure on remaining habitat, PAs have an especially critical role in Hotspots. In these places, efforts to extend protected areas’ ecosystem services beyond their borders can insure the long-term viability of the area, and offer what are perhaps the best places where dual objectives of conservation and rural livelihoods can be achieved. Addressing these and other concerns is essential, since in 2002, an estimated 177 million people lived within 10 kilometers of existing PAs in CI’s hotspots.
Given CI’s work in over 42 countries, it is impossible to adequately present all of the information we, and others, have amassed on valuing ecosystem services. There are hundreds of studies that show the benefits of different ecosystems and protected areas and the costs of degradation. In order to make these accessible we have developed a zoomable Google Maps based website www.consvalmap.org that shows the values of different places and services in easily understood bullets (see Figures 1 and 2 for screenshots of the website). While most studies come from economics, many others come from health experts, anthropologists, and organizations concerned with disaster, water supply, and food security.
FIGUre 1: Case studies entered to date on values FIGUre 2: Zoom showing a specific ecosystem service protected area and valuation data
The case studies presented here are a combination of CI’s experience, and research that quantifies the ex-perience of community and CI practitioners. Given the need described above for policy and conservation interventions to maximize local benefits from protected areas, values presented range from innate ecosystem services to direct benefits from conservation activities.
31
Local Benefits of Protected Areas: Perspectives and Experiences of Conservation International
4.1 GeNerATING dIreCT BeNeFITS FroM CoNSerVATIoN ACTIoNS
Conservation International (CI) and other global conservation organizations act as conduits for financial support, capacity-building, and technical assistance within countries. Over the past 5 years, CI alone has provided more than $100 million in funding to more than 1000 partners in the 42 countries where we work. A substantial amount of conservation funding goes to local-levels, employing people in protected area man-agement, supporting restoration, and developing local-scale projects that reduce threats, address livelihood needs, and develop support for conservation. In places of high poverty, at both national and local levels, small, but reliable sources of funding can have a substantial impact. Below are a few examples of direct benefits from conservation actions.
Madagascar: in the Menabe region, CI is strengthening the capacity of civil society by working closely with partner Fanamby (a local conservation organization) to establish a grant-making mechanism focused on targeting development funding towards communities participating in conservation. The “Nodes” mechanism partners CI with a national institution to design and implement a grant-making strategy focused on con-servation and development activities targeted at positive impacts to the communities, such as creating new sources of clean water and species protection. Fanamby in turn builds the capacity of very local organizations to manage funds through small grants of $500 to $5,000 for activities such as reforestation, forest regenera-tion, income-generating activities, local ecotourism development, handicrafts, environmental education and awareness building, biodiversity conservation communication activities, and small natural resource man-agement projects. These “Nodes” become attractive targets for further investments in the community. Node funding encourages environmental behavior change among local communities, strengthens natural resource management, and helps local people capture the economic value of biodiversity and use it for their benefit. Conservation activities in the Menabe region have been so successful and so well-received by local communi-ties that CI, the government, and community partners plan to establish a greater Menabe Protected Area in 2008. The new protected area will be governed by a co-management structure that includes representatives from the Ministry of Environment, Water and Forests, as well as local forest users and local community gov-ernments. To continue this important work and build on the successes, future grants will be given to support the protected area creation and management process, and to reinforce the co-management structure.
Democratic Republic of Congo: In an agreement with communities living in Eastern DRC, Conservational International and the Dian Fossey Gorilla Fund International (DFGFI) provided funds for the construction of a community-managed university as part of an incentives package supporting a community decision to create and manage nature reserves that protect, among other globally important species, the endangered Grauer’s gorilla. The eight community reserves (about 1 million hectares) are a key element in a 2.6 million hectare conservation corridor that also includes two national parks. CI and DFGFI provide ongoing support for operational costs, and the University, located just outside the limits of the flagship Tayna Gorilla Reserve, has become the focus of community driven conservation, development and livelihood initiatives. In March 2007, the first 50 students received their three-year degrees in conservation biology, aided by scholarships that covered the costs of their lodging, food, and school fees. A further 180 students from the surrounding area attend the University as a day school. As part of the incentives package, CI and DFGFI also supported the creation of a 28 bed health clinic, primary school and orphanage, as well as a community radio station that broadcasts messages on conservation and provides agricultural and health advice. A hydro-electric project sponsored by the Jane Goodall Institute (JGI) is now providing electricity for the university complex and nearby village. Ongoing funding is provided by CI’s Global Conservation Fund, CI’s Central Africa Program, United States Agency for International Development, DFGFI, and JGI.
Cambodia: CI has worked for a number of years with communities living in the Areng River Valley, in the buf-fer zone of Cambodia’s Central Cardamom Protected Forest. CI and five communities have now made formal agreements in which communities receive a range of economic benefits in exchange for their commitments to conservation. Communally protected forests now add 110,000 hectares to the national Protected Forest,
Protected Areas in Today’s World: Their Values and Benefits for the Welfare of the Planet
32
and community conservation work has resulted in increases in the populations of Critically Endangered Dragon Fish and Siamese Crocodile. Among the benefits that communities receive are; direct employment as rangers, which rotates among families, technical assistance in agricultural intensification, and salaries to ensure the presence of teachers in each community. As a result, more than 200 families have benefited from ranger training and salaries, rice production has quadrupled in one year, and communities have full-time teachers for the first time in decades. CI has been piloting this conservation agreement approach around the world, with more than a dozen projects globally. Community benefits from these conservation projects have included ranger salaries for more than 300 families on a part time basis, annual support for more than 15 teachers, training of community doctors, construction of community infrastructure, educational scholarships for more than 50 children annually, and others.
Ghana: With CI support, in 1995, the indigenous Akan people built a 33-meter high canopy walkway in Kakum National Park. Since then, it has been a major ecotourism attraction drawing over 90,000 visitors in 2005 and providing money to the Ghana Heritage Conservation Trust, a local NGO that funds conservation and sustainable development projects with local communities. About 5,000 tourism-related jobs have been created in the region around the park, helping tourism to be Ghana’s fastest-growing economic sector.
Indonesia: In Sumatra, ecotourism development has been closely accompanied by a reduction in illegal logging in the 10,000-ha Tangkahan area of the 950,000-ha Leuser National Park — one of the biggest in Indonesia. The park is a key area for the critically endangered orangutan, and ecotourism is providing income for local communities and reducing their vulnerability to natural hazards from soil loss, landslides and flood-ing. Studies are evaluating whether and how ecosystem service values can be captured to provide sustainable financing for protected-area management.
Peru: A conservation project being implemented between CI and a large international mining company in the Peruvian Andes will restore and conserve rare Polylepis forests, contributing to the development of a con-nective forest corridor through the Conchucos valley between Huascarán National Park and the Huayhuash Reserve Area. The area of project impact is estimated to be 200,000 ha, with 50,000 ha of direct intervention. The project assists communities to restore Polylepis forests throughout the region, zoning some for use and others for long-term conservation, and also generates benefits for local communities in the form of training, employment, and the provision of alternative fuel sources.
4.2 SUPPLYING FreSHwATer
About one-third of the world’s population lives in countries with moderate to high water stress. Water scarcity will affect 66% of the world’s population by 2025. Our reliance on water extends far beyond having clean and healthy drinking water; freshwater ecosystems are also a source of food and provider of livelihoods for millions. Nearly 70 percent of the freshwater humans use is for agricultural purposes, with growing demands for energy generation. Pollution and inefficient use of water, however, has left highly-diverse freshwater ecosystems with extinction rates 15 times higher than for marine ecosystems. In many of the places where CI works, upland watersheds are being deforested, compromising water quality, quantity and security for millions of downstream users. Yet watersheds offer one of the clearest types of “win-win” situations, dem-onstrating clear and direct links between human welfare, ecological services, and conservation. When PAs include watersheds, they have an evident value for human welfare (e.g., for irrigation and downstream water supply), and it is often possible to collect water user fees that can finance protection, restoration, and provide poor upland users with benefits.
Madagascar. The importance of water for agriculture has had an important impact in increasing PA expansion in Madagascar. A World Bank study of all Madagascar’s parks showed that the $94 million spent on parks paid for itself, plus provided 875,000 rural rice-farming households with water — a benefit worth $54 to $119 million. Mantadia National Park alone provides more than $125,000 annually in watershed protection and
33
Local Benefits of Protected Areas: Perspectives and Experiences of Conservation International
natural hazard reduction. As a result, the President is making a lasting commitment to protect biodiversity and rural livelihoods by creating 15 new protected areas covering 2.4 million acres of land — an area roughly the size of Connecticut. The international conservation community has helped to create a national conserva-tion trust fund to support these new protected areas. The trust now has a capitalized value of over U.S. $30 million. To support further incorporation of watershed values into conservation and development policy, CI and partners have mapped watershed services for Madagascar, identifying which watersheds are most critical for biodiversity protection, lowland rice irrigation, drinking water, and mangrove protection. Future work will look at the values of these services to people and map out impacts of water quality for Madagascar.
Indonesia. Poor, local farmers around Ruteng National Park suffer serious economic impacts when there is drought. Studies by CI research partners showed that farmers were aware of, and interested in, their envi-ronmental conditions, and the way in which these were linked to water availability. The study found that the average amount that farmers would pay for drought mitigation services was between $2-3 per household, equivalent to about 10% of annual agricultural costs, 75% of annual irrigation fees, or 3% of annual food expenditures. This study demonstrates that even poor, local farmers recognize the importance of the national park, and they would be willing to contribute to park protection. A study of another park in Indonesia, Lore Lindu National Park, found that it provides $6.1 million annually for 304,607 people who depend on water that irrigates 22,338 hectares of crops. It also provides fish worth $1.7 million to local residents. When values to industry and other users are included, the park’s water-related benefits are valued at $9 million total.
Bolivia: Communities in the Los Negros watershed around Amboró National Park have piloted a mechanism for environmental services payments. Residents in the upstream community of Santa Rosa are negotiating with private farmers in the agricultural town of Los Negros, who, even though they are 35 km. downstream, depend on water from the park. Though one hectare of unirrigated land in downstream Los Negros is worth only $500, a similar hectare with a reliable water supply is worth $7000. Los Negros farmers have therefore expressed a willingness to invest in forest protection, thus hedging against the risk of diminished water sup-plies. In early 2003 the environment committee of Los Negros agreed to “pay” one artificial beehive (value ~$30) for every 10 hectares of forest that Santa Rosa protects annually. More than 700 hectares of cloud for-est are now protected via direct market driven payments, and the local community groups are beginning to develop monitoring and enforcement protocols. Downstream from the project is Bolivia’s largest city, Santa Cruz, with 2 million water users.
4.3 INCreASING reSoUrCe ProdUCTIVITY
Protected areas are well known to act as sources for food, fuel, clothing, and medicines. Unfortunately, as these resources diminish outside PAs the pressure on them becomes more intense. For this reason, landscape approaches that protect and restore ecosystem services outside of PAs are essential. This is especially critical since by 2025, over 60 percent of the world’s “absolute” poor will live in rural areas, depending directly on the natural resources around them. There are many instances where PAs can support local use and consump-tion while discouraging outside, commercial interests from rapidly depleting resources. PAs also directly contribute to increased resources - for example- in agriculture, through services such as pollination, or in fisheries through the creation of “no take” zones that allow fish stocks to recover. We are only now beginning to recognize and value the magnitude of this type of services.
Brazil: The Mamirauá and Amanã Sustainable Development Reserves have yielded high social and environ-mental returns through co-management by local communities and NGOs. In the 1.2 million hectare Mamirauá reserve, better management and marketing of the pirarucú fishery between 1998 and 2004 led to 50% increases in the annual income of the 6,000 residents, while the population of pirarucú more than doubled. Observing these successes, the state of Amapá (in the extreme northeastern Brazilian Amazon) in 2004, created a network of conservation areas under various forms of co-management, community and indigenous control. These areas total 11 million hectares, encompassing 65% of the area of the state and 200,000 indigenous and rural
Protected Areas in Today’s World: Their Values and Benefits for the Welfare of the Planet
34
peoples, and set the state on a path of conservation-centered development, relying on sustainable agriculture, fisheries, tourism, and technology.
Brazil: The Corumbau Marine Extractive Reserve (MERC), covering 89,500 hectares, is part of the Abrolhos Bank, a coral reef hotspot located in the Southwestern Atlantic Ocean off the coast of Bahia State. The reserve was created in 2000 with the goal of improving local community livelihoods by fostering the sustainable use and management of the fisheries. Although this is a multiple-use reserve, MERC’s management plan includes several no-take zones. Since its creation, fish density has tripled inside the no-take zones and doubled in other parts of the reserve. Because the reserve is co-managed by local authorities (The Brazilian Environmental Agency – IBAMA) and the local communities, fishing regulation compliance is high and boats from outside are not allowed to fish within the reserve boundaries. As a result of this success, another community of fisherman south of this reserve has asked CI for support in creating a new reserve called Cassurubá in one of the most important and richest mangroves along the coast of Brazil. This community is concerned about the over-exploitation of natural resources they depend on, such as crab. CI has helped with the technical studies (biological and socio-economic) for the creation of a formal proposal that is now in the hands of the President and due to be signed in the near future.
South Africa: Each year, tens of thousands of beehives are hired out to pollinate commercial fruit plantations (apples and pears) and vineyards, among the region’s main economic activities contributing to jobs, exports, and the nations’ GDP. The value of these pollination services is approximately US$400 million annually. Since the bees spend most of the year in the indigenous Fynbos vegetation, protecting the natural vegetation is the only way to ensure the continuation of this key input to South Africa’s agriculture. The South African Wine Growers Association, spurred by CI’s South Africa Hotspots program, is encouraging wine growers who take certain actions to receive a “biodiversity friendly” label. Producers expect this program to provide multiple benefits from better pollination and a higher market value for their product: their logo is “complex wines require complex habitats.” This initiative has brought 34% of the total vineyard footprint in the Cape winelands into the program thus far.
Indonesia: Scientists are studying the productivity of coffee plantations in northern Sumatra to understand how the productivity of plots changes with forest cover. The forests harbor bees that pollinate the coffee flow-ers, as well as bats and birds that control coffee pests. CI is investigating the value of this pollination service and the potential incentives for landowners to preserve their forests along with the economically- valuable species within them.
4.4 SAFeGUArdING HUMAN HeALTH
There are many links between human, wildlife, and ecosystem health. Forest clearing creates “edges,” increasing the interactions among pathogens, vectors and hosts. It also concentrates wildlife populations into smaller patches of habitat, and increases the odds that these animals will be in contact with domestic animals and humans. This in turn increases the number of pathogens and parasites jumping from wildlife to people or their livestock, or vice versa. There is solid evidence that forest clearing has increased the spread of diseases such as malaria, leishmaniasis, avian flu, Ebola and SARS.
Climate change also affects human health by expanding the area affected by certain diseases, causing unex-pected surges in disease transmitting organisms, and increasing severe weather events that lead to epidemics. For example, climate change has already affected outbreaks of Hantavirus Pulmonary Syndrome and cholera, and has increased malaria transmission, since warmer temperatures allow mosquitoes to inhabit new areas. While PAs don’t stop climate change, there may be benefits that come from the resilience of healthy ecosystems, since PAs are often in better condition than the areas that surround them, and ecosystem health is better. But is there proof that this leads to better human health? The answer appears to be yes and evidence is emerging that healthy ecosystems support human health.

35
Local Benefits of Protected Areas: Perspectives and Experiences of Conservation International
Indonesia: The 32,000-ha Ruteng Park on the island of Flores protects the forests of a critical watershed for the area’s towns and farms. The park provides timber, fuelwood, clean water and a variety of forest products of regional value. Researchers working with CI’s Center for Applied Biodiversity Science found that com-munities living near the PA’s intact forests had fewer illnesses from malaria and dysentery, children missed less school because their health improved, and there was less hunger associated with crop failure, than in communities without intact forests nearby. Villages with less forest cover also had worse water quality, and higher levels of child malaria and diarrhea. This shows that the healthy forests within PAs have many more benefits that were previously known.
Brazil: Researchers created an economic model of the Brazilian economy to examine how investments in conservation, such as protected areas, would provide quantifiable economic benefits in the form of improved human health. Findings show that the expected costs of new Amazonian PAs, measured in reduced forestry and agricultural production, are offset by expected benefits in reduced disease incidence. This is the only analysis to-date that models how large-scale investments in conservation also support economic growth by improving human health.
4.5 redUCING NATUrAL HAZArdS
Throughout the tropics, coral reefs, mangroves, lowland forests, barrier islands, and wetlands buffer the inhabitants and the biodiversity of coastal areas from potentially dangerous waves, storm surges, tropical cyclones and flooding caused by storms and by geological activity. Recent scientific studies are confirming what many people suspected and what makes intuitive sense: intact, healthy ecosystems mitigate the effects of natural hazards and reduce human vulnerability. Anticipating where degradation increases vulnerability — and protecting or restoring these critical ecosystems — can mitigate their effects on people and economies. For example, villages with healthy mangroves, coral reefs and lowland forests were better protected from the 2004 Asian tsunami. Maintaining healthy ecosystems is a relatively inexpensive way to protect loss of life, property, and infrastructure, while also providing many other benefits.
Indonesia: Illegal logging on the Indonesian island of Sumatra, which lies in the Sundaland Hotspot, resulted in upland deforestation that led to a massive flash flood that killed more than 200 people. Reaction was swift: communities in the flooded region and local government representatives worked together to gain support for a local decree to establish Batang Gadis National Park. This 266,760-acre PA is a model for a “bottom-up” approach to creating a national park that will mitigate the impacts of natural hazards.
4.6 ProTeCTING TrAdITIoNAL wAYS oF LIFe
There are frequent synergies between conservation and local people’s desire to protect their way of life. Community-conserved or indigenous territories can function as key components of biodiversity corridors or landscapes, and within indigenous lands, there are an increasing number of areas zoned for conservation. There are also cases where indigenous peoples and local communities have asked to have their territories nationally recognized and integrated into national protected-area systems.
China: The Three Rivers Reserve is one of the largest protected areas in China. At 15 million hectares, it provides some of the last remaining habitat for endemic species such as the Tibetan gazelle and Wild Yak. However, due to its size and lack of funding, poaching and overgrazing pose serious threats. In November 2006, the Forest Bureau and the local community of Cuochi, which is located inside the Reserve, signed a conservation agreement granting the community the right to manage 250,000 hectares of the Reserve as a core zone. Since the agreement was signed, the community has regulated grazing patterns and organized patrols to expel illegal hunters. As a result, wild herds of gazelle, yak and antelope are all returning to the area. The community, in turn, now benefits from a regular supply of medicines for their health post, training for two
Protected Areas in Today’s World: Their Values and Benefits for the Welfare of the Planet
36
communal doctors, investment in recovering disappearing traditions, communication through a satellite telephone, and the right to regulate resource use.
Guyana: In Southern Guyana, the Wai Wai people of Konashen have chosen to manage their land for conserva-tion, resulting in the legal declaration of their 625,000 hectares as the first Community Owned Conservation Area in Guyana. This declaration is enabling them to begin to build their local economy around conservation, with most families involved in conservation related activities in some way. As a legally protected area, the community will have access to funds from a future national protected areas trust. Further the community has worked with CI’s support to complete a management plan, which, along with legal conservation status, training and funding, will bring the community what they need to monitor and preserve their lands. The Wai Wai view conservation of their resources as central to preserving their culture and creating job opportunities to ensure that young people will stay in the community.
4.7 CoNCLUSIoN
Places that are important conservation priority areas for CI and other organizations are also disproportionately important for the ecosystem services that benefit humans. These areas – about 7% of Earth’s land mass – pro-vide ecosystem services with an estimated monetary value 2.5 times higher than average land areas. There are many opportunities for conserving both species and ecosystem services together, especially in the Amazon Basin, the Congo Forest, Madagascar, Borneo, New Guinea and much of Southeast Asia. Even in places where ecosystem services have been lost, such as Brazil’s Atlantic Forest and Southeast there is opportunity to use remaining natural habitats to more broadly restore these valuable ecosystem services to both urban and rural residents alike. A comprehensive, well-managed, and equitable global protected area system can not only support biodiversity, but is also therefore critical in supporting human welfare at multiple scales.
37
Drinking water and protected areas
drINKING wATer ANd ProTeCTed AreAS5.
Nigel Dudley and Sue Stolton1
1 Equilibrium Consultants
Well managed natural forests can provide benefits to people living in cities by supplying high quality drinking water. In rare cases forests can increase net water availability and also sometimes regulate floods, but these services are highly dependent on individual circumstances. Around a third of the world’s largest cities rely on protected forests to help maintain supplies of good quality drinking water and many existing protected areas provide important and sometimes under-valued additional benefits in terms of their water services. Some experi-ence is developing in compensating communities who protect forests that provide high quality drinking water to people further downstream. These benefits have important implications for the CBD’s Programme of Work on Protected Areas.
5.1 A LooMING wATer CrISIS
By 2008, for the first time in history, it is expected that over half the world’s population will live in towns and cities1. Unfortunately, around a third of this urban population, currently about a billion people, live without clean water or adequate sanitation: 700 million people in Asia, 150 million in Africa and a further 120 million in Latin America and the Caribbean2. In 2003 it was estimated that 2.2 million deaths a year can be attributed to lack of clean water and sanitation3. As urbanization continues, these problems are likely to become more intense. In India, for example, the World Bank estimates that demand for water in the urban and industrial sectors is likely to increase by 135 per cent over the next 40 years4. Cities therefore face immediate problems of access to clean water and sanitation along with mounting problems of supply in the future. At the World Summit on Sustainable Development in 2002, over 80 per cent of the participants identified water as a key factor to be considered in addressing issues related to human wellbeing5. The demand for water, along with increasing pressures on water from pollution, urbanisation and overexploitation of aquatic resources, is also creating a biodiversity crisis in freshwater systems6. Protected areas offer one important option for addressing both people’s need for good quality drinking water and conservation issues relating to freshwater.
5.2 THe roLe oF ForeSTS IN MAINTAINING HIGH qUALITY wATer
The vast majority of cities get their drinking water by collecting or diverting existing freshwater sources. At global scale minor amounts of freshwater are extracted directly from rainwater or from the ocean. All major water supplies have a variety of challenges. Some countries are facing genuine shortages although in many others the problems relate more to access, transport and purification. For instance about 50 developing coun-tries, mainly in Africa, still use less than 1 per cent of their available freshwater resources7, but many of these
1 Marshall, A [editor] (2007); The State of the World Population 2007: Unleashing the potential of urban growth, United Nations Population Fund, New York
2 United Nations Human Settlement Programme (2003); Water and Sanitation in the World’s Cities: Local Action for Global Goals, Earthscan, London
3 ibid
4 Brandon, C and R Ramankutty (1993); Toward an Environmental Strategy for Asia, World Bank Discussion Paper No. 224, The World Bank, Washington, D.C., USA
5 According to the GlobeScan Survey (January 2002) undertaken by Environics, a Canadian public opinion firm specialised in Sustainable Development, as reported in: World Bank (2002); Water — Priority for Responsible Growth and Poverty Reduction: An Agenda for Investment and Policy Change, World Bank, Washington, USA
6 Abramovitz, J N (1996); Imperilled Waters, Impoverished Future: The decline of freshwater ecosystems, Worldwatch Paper number 128, Worldwatch Institute, Washington DC
7 Gujja, B and M Perrin (1999); A Place for Dames in the 21st Century? WWF International, Gland, Switzerland
Protected Areas in Today’s World: Their Values and Benefits for the Welfare of the Planet
38
countries have serious problems in providing a clean water supply. Some nations are finding it difficult to pay for or to organise the infrastructure needed to purify water and supply it to wells or to individual households. Pollution of all water sources creates additional problems, with pollutants coming mainly from agriculture, sewage, industry and resource activities, such as mining8.
Until recently, the main focus of efforts to improve urban water sanitation and supply have focused on the creation of better distribution systems, treatment plants and methods of sewage disposal. However, increasing interest is being shown in the opportunities for purifying urban water through the management of natural resources. In particular, well managed natural forests almost always provide higher quality water, with less sediment and fewer pollutants, than water from other catchments. This is in part because less polluting activities generally take place in forests than on other land types, but also because in some cases forests help to regulate soil erosion and hence reduce sediment load. Water from natural forests, those with no activities such as logging or mining, is likely to be particularly pristine. While there are some contaminants that forests are less able to control — the parasite Giardia for example, which is spreading gradually throughout North America as an invasive species — in most cases the presence of forests will substantially reduce the need for treatment. The benefits that forests provide have been recognised for many years by companies that depend on high quality water. For example the mineral water company Perrier-Vittel pays to restore forests in the catchment where it collects water in France9. Increasingly the water services provided by forests are being recognised by state and private water companies as well.
Forests supply other benefits in terms of water regulation, although the situation here is a little more com-plex. Some natural forests (particularly tropical montane cloud forests10 and some older forests, such as old Eucalyptus forests11) also increase total water flow, although in other cases the reverse is true and young forests and some plantations can actually decrease net water flow12. Impacts of forests on security of supply or on mitigating flooding are less certain although forests can certainly reduce floods at a local headwater scale. Claims that forests are largely irrelevant in preventing large floods13 have recently been challenged14 and this issue has yet to be satisfactorily resolved.
Recognition of these various benefits means that natural forests are increasingly being protected to maintain high quality water supplies to cities. Protection within watersheds also provides benefits in terms of biodi-versity conservation and for recreational, social and economic values.
5.3 MAINTAINING HIGH qUALITY wATer SUPPLY IS AN AddITIoNAL ArGUMeNT For ProTeCTIoN:
Increasingly the supply of drinking water is seen as an additional argument for forest protection. Many im-portant national parks and other wildlife reserves already have value in protecting watersheds that provide drinking water to towns and cities. In some cases the area was originally protected for scenic or wildlife values
8 Carley, M and P Spapens (1998); Sharing the World: Sustainable Living and Global Equity in the 21st Century, Earthscan
9 Johnson, N, A White and D Perrot-Maître (undated); Developing markets for water services from forests: Issues and les-sons for innovators, Forest Trends, USA
10 Bruijnzeel, L A and Hamilton, L S (2000); Decision Time for Cloud Forests, IHP Humid Tropics Programme Series no. 13, IHP-UNESCO, Paris
11 Langford, K J (1976); Change in yield of water following a bushfire in a forest of Eucalyptus reglans, Journal of Hydrology 89: 87-114
12 Bosch, J M and J D Hewlett (1982); A review of catchment experiments to determine the effects of vegetation changes on water yield and evapotranspiration, Journal of Hydrology 55: 3-23
13 CIFOR and DAO (2005); Forests and Floods: Drowning in fiction or thriving on facts, CIFOR and AO, Bogor Indonesia and Rome
14 Bradshaw, C J A, N S Sodhi, K S-H Peh and B W Brook (2007); Global evidence that deforestation amplifies flood risk and severity in the developing world, Global Change Biology 13 (11): 2379–2395
39
Drinking water and protected areas
and its watershed benefits only recognised later, as with the iconic Yosemite National Park in California, USA, which helps supply high quality water to San Francisco. Conversely sometimes the water values have been recognised from the beginning and watershed protection has been the major reason for protecting a forest. For example the water supply company of Melbourne, Australia has deliberately protected forests to maintain high quality water for residents: 90 per cent of Melbourne’s water comes from forested catchments and almost half of these catchments are protected and much of the rest managed for water collection. For some other cities, watershed protection has bought critical time for biodiversity by protecting remnant natural areas that would otherwise have disappeared and it is only later that the conservation values have been appreciated. This was the case in Singapore where, for example, the Bukit Timah National Park was initially protected to maintain urban water supplies but is now recognised as an important haven for wildlife and the only remaining natural forest on Singapore Island. However in a few cases, the watershed values of protected areas still remain largely unrecognised and the downstream benefits are largely accidental15.
To be effective in maintaining water supply, protected areas also need to be well-managed and illegal degrada-tion of protected areas can undermine the potential benefits. For example the United Nations Environment Programme has identified illegal logging in the Aberdares National Park and Mount Kenya National Park as problematic in terms of maintaining the water supply of Nairobi, Kenya16.
Full protection may not always be possible due to issues of land ownership or population pressure and a range of other forest management options are available including best practice management (for example through a forest management certification system) and restoration. Forests around the Swedish capital Stockholm are certified by the Forest Stewardship Council for a management system that combines some commercial timber harvesting with some protection. Land around Beijing in China is managed under various multipurpose systems to help maintain drinking water quality17.
5.4 THe wATerSHed BeNeFITS oF ForeST ProTeCTed AreAS CoULd HeLP To PAY For ProTeCTIoN:
The economic value of watersheds is almost always under-estimated or unrecognised — forests are in these cases essentially supplying “free goods” in terms of environmental services. Communities maintaining forests on their land are supplying goods in terms of drinking water to other communities, sometimes a long way away and often without any recognition or compensation for benefits foregone. However, it is possible to collect user fees from people and companies benefiting from drinking water to help pay for the catchment protection benefits provided by protected area management. Payment for water services can also be one important way of helping negotiations with people living in or using watersheds to develop land-use mosaics that are conducive to maintaining high quality drinking water supplies. Residents of the city of New York, for example, voted to support a package of incentives for protection and good management in the catchments upstream rather than invest in a new treatment plant18. About 80 per cent of Quito’s 1.5 million population have drinking water from two protected areas; Antisana (120,000 ha) and Cayambe-Coca Ecological Reserve (403,103 ha). To control threats to the reserves, the government is working with a local NGO to protect the watersheds, including stricter enforcement of protection to the upper watersheds and measures to improve or protect hydrological functions, protect waterholes, prevent erosion and stabilise banks and slopes19. Such
15 All references from Dudley, N and S Stolton (2003); Running Pure, WWF and The World Bank, Gland Switzerland and Washington DC
16 Information from: The East African, Monday, March 26, 2001, www.nationaudio.com/News/EastAfrican/02042001/Regional/Regional15.html
17 ibid
18 EPA (1999); Protecting Sources of Drinking Water Selected Case Studies in Watershed Management, United States Environmental Protection Agency, Office of Water, EPA 816-R-98-019, April 1999, http://www.epa.gov/safewater
19 Pagiola, S, J Bishop and N Landell-Mills [editors] (2002); Selling Forest Environmental Services: Market-based mechanisms for conservation and development, Earthscan, London, UK
Protected Areas in Today’s World: Their Values and Benefits for the Welfare of the Planet
40
payment for environmental services (PES) schemes are gaining an increasingly high profile20 but appear to only work under certain circumstances; particularly the presence of an identifiable source of money (such as a company) and a way of distributing benefits fairly amongst individuals.
5.5 MANY oF THe worLd’S LArGeST CITIeS reLY oN drINKING wATer FroM ProTeCTed AreAS:
A survey carried out for WWF and the World Bank in 2003 found that around a third (33 out of 105) of the world’s largest cities obtain a significant proportion of their drinking water directly from protected areas. At least five other of these cities obtain water from sources that originate in distant watersheds that also include protected areas. In addition, at least eight more obtain water from forests that are managed in a way that gives priority to their functions in providing water. Several other of the top hundred cities are currently suffering problems in water supply because of degradation or pollution in watersheds, or draw water from forests that are being considered for protection because of their values to water supply. Far from being relegated to a few isolated examples, protecting forests to protect water is a major environmental service, as outlined in the list below:
Mumbai, India: • Sanjay Ghandi National ParkJakarta, Indonesia: • Gunung Gede Pangrango and Gunung HalimunKarachi, Pakistan: • at least 6 separate protected areasTokyo, Japan: • Nikko National Park and Chichibu-Tama National ParkSingapore: • Bukit Timah and the Central Catchment AreaNew York, USA: • Catskill State ParkBogotá, Colombia: • Chingaza National ParkRio de Janeiro, Brazil: • 5 protected areas near the city and 15 further away protecting the catchment Los Angeles, USA: • Angeles National ForestCali, Colombia: • Farallones de Cali National ParkBrasília, Brazil: • Brasilia National ParkSanto Domingo, Dominican Republic: • at least 6 protected areasMedellín, Colombia: • Alto de San Miguel Recreational Park and Wildlife RefugeCaracas, Venezuela: • 3 national parksMaracaibo, Venezuela: • Perijá National ParkSão Paulo, Brazil: • at least 6 protected areasSalvador, Brazil: • Lago de Pedra do Cavalo and Joanes/Ipitinga Environmental Protection AreasBelo Horizonte, Brazil: • 8 separate protected areasMadrid, Spain: • Peñalara Natural Park and Cuenca Alta del Manzanares Regional ParkVienna, Austria: • Donau-Auen National ParkBarcelona, Spain: • Sierra del Cadí-Moixeró and Paraje Natural de PedraforcaSofija, Bulgaria: • Rila and Vitosha National Parks and a biosphere reserveIbadan, Nigeria: • Olokemeji and Gambari Forest ReservesAbidjan, Cote d’Ivoire: • Banco National ParkCape Town, South Africa: • Cape Peninsula National Park and Hottentots Holland Nature ReserveNairobi, Kenya: • Aberdares National ParkDar es Salaam, United Republic of Tanzania: • at least 4 protected areasDurban, South Africa: • Ukhlahlamba-Drakensberg ParkHarare, Zimbabwe: • at least 3 protected areasJohannesburg, South Africa: • Maluti/Drakensberg National Park and Ukhlahlamba-Drakensberg ParkSydney: Australia: • 4 protected areasMelbourne, Australia: • Kinglake, Yarra Ranges and Baw Baw National ParksPerth, Australia: • Yanchep National Park
20 Pagiola, S, N Landell-Mills, and J Bishop (2002); Making market-based mechanisms work for both forests and people, in S Pagiola, J Bishop, and N Landell-Mills [editors], Selling Forest Environmental Services: Market-based Mechanisms for Conservation Earthscan, London
41
Drinking water and protected areas
5.6 LINKS To THe CBd ProGrAMMe oF worK
Governments, protected area agencies and other owners of protected areas need to know the wider benefits of these areas, including the ecosystem services that they provide, to help make a coherent and accurate case for protection and maintenance of such sites. At a national level, studies are needed into the role that protected areas, other protected forests and potential protected areas (perhaps identified through a gap analysis) play in water supply. Such studies should be quantitative and include calculations of economic benefits wherever possible but should at the very least include an overview of places that receive clean water.
Next, protected area managers, water companies and water users in general all need information about what particular forests can and cannot supply in terms of water needs and how such forests should be protected or managed to optimise the benefits. Many people have no idea where their tap-water comes from. Yet where there have been debates and information campaigns — as in New York City — support for catchment man-agement tends to be high. Better information regarding the links between forests, protected areas and water supply could help build a constituency for good watershed management.
The CBD’s Programme of Work, with its strong emphasis on human rights and wellbeing, is also excellently po-sitioned to help address issues of community rights with respect to drinking water. Payment for Environmental Services schemes can certainly work but have had mixed success and some NGOs have started to oppose them on the grounds that the poorest members of communities tend to lose out. Best practice guidelines are needed, along with principles and case studies of successful schemes including use of certification and assess-ment methods are needed to ensure good management. Further, care is needed to make sure that politically powerful urban populations do not gain high quality water at the expense of rural communities. Approaches that include negotiation, joint decision-making and compensation, including payments for environmental services, have proved to be the most successful in ensuring equity.
Finally, despite years of debate by the experts, there is still confusion about exactly what forests offer in terms of water supply and to an even greater extent flood control. Greater understanding of these ecosystem services and the provision of clear guidance to land and water managers is urgently required.
Protected areas are not a panacea, but they are clearly an important option to help to secure high quality urban water supplies. Lack of protection has been already been identified as a problem in some cities while in others it seems that better catchment management would help to address urgent problems related to water quality and in some cases supply. Increased use of protection, including protected areas, could help many cities to maintain their drinking water. It should also be remembered that protection of forests for their watershed values has important and usually beneficial implications for biodiversity.
Protected Areas in Today’s World: Their Values and Benefits for the Welfare of the Planet
42
ProTeCTed AreAS ANd PLANT AGroBIodIVerSITY6.
Sue Stolton1, Nigel Maxted2, Shelagh Kell2, Brian Ford-Lloyd2 and Nigel Dudley1
1Equilibrium Consultants, 2University of Birmingham
Protected areas can be an effective mechanism for conserving plant agrobiodiversity: wild species that are close relatives of crop plants and traditional varieties (landraces) of domesticated plants. Many successful examples of agrobiodiversity conservation in protected areas already exist around the world, both of conventional pro-tected areas that contain crop wild relatives and specially designed on-farm areas tailored to the conservation of traditional landraces. However, currently protection levels are relatively low in many of the world’s centres of crop diversity, thus creating potential threats to food security. Filling these gaps in the global protected areas network could be an important focus for the CBD and could create the opportunity to build new partnerships. Some specific management actions may also be needed to maximise agrobiodiversity conservation inside suitable protected areas.
6.1 AGroBIodIVerSITY ANd THe CBd ProGrAMMe oF worK oN ProTeCTed AreAS
The CBD is explicit that biodiversity includes varieties of crops and livestock as well as wild species re-lated to crops. For this reason conservation action under the Convention should embrace agrobiodiversity. Moreover, the CBD defines in situ conservation as: “the conservation of ecosystems and natural habitats and the maintenance and recovery of viable populations of species in their natural surroundings and, in the case of domesticated or cultivated species, in the surroundings where they have developed their distinctive proper-ties” (Article 2, our emphasis). This suggests that protected areas can include protection of agrobiodiversity amongst their objectives and the CBD has placed considerable emphasis on the importance of agricultural biodiversity in its statements and its work.
The term agrobiodiversity itself encompasses wild species related to crops and domesticated animal and crop species. The Food and Agriculture Organization of the United Nations (FAO) defines agrobiodiversity as “the variety and variability of animals, plants and micro-organisms that are important to food and agriculture and which result from the interaction between the environment, genetic resources and the management systems and practices used by people” (FAO, 1999). Agrobiodiversity therefore includes two groups in particular: (1) the wild relatives of domesticated species generally known as crop wild relatives (CWR) from which cultivated crops originated, and/or which are related closely enough to provide useful genetic material to the crop1; and (2) individual breeds of domesticated species of livestock and crops (in the case of crops, known as landraces2). In this paper we specifically look these two groups in terms of plant agrobiodiversity.
The use of protected areas for plant agrobiodiversity conservation should aim to maximise priority genetic diversity conservation as well as conserve the more threatened species and landraces. For example this might include:
Priority and threatened crop wild relatives, •Traditional and threatened landraces, particularly those reliant on traditional cultural practices •
For each of these agrobiodiversity groups, the priority is to conserve the full range of genetic diversity con-tained within and amongst the species or landraces rather than an ad hoc sample of individuals.
1 Maxted, N., Ford-Lloyd, B.V., Jury, S.L., Kell, S.P. and Scholten, M.A., (2006); Towards a definition of a crop wild relative. Biodiversity and Conservation, 15(8): 2673-2685.
2 Camacho Villa, T.C., Maxted, N., Scholten, M.A. and Ford-Lloyd, B.V., (2005); Defining and identifying crop landraces. Plant Genetic Resource: Characterization and Utilization, 3(3): 373-384.
43
Protected Areas and Plant Agrobiodiversity
Until now, agrobiodiversity has been, with some exceptions, generally absent or underplayed from protected area strategies3. This paper looks at the potential for protected areas to help to conserve plant agrobiodiversity, why this is important and what the implications might be for the CBD’s Programme of Work on Protected Areas.
6.2 AGroBIodIVerSITY: AN IMPorTANT reSoUrCe UNder THreAT
Plant genetic resources are an invaluable resource for present and future generations. In particular their importance will likely increase as the effects climate change will create a need for more extreme adaptations in agricultural crops and thus necessitate, a broader range of genetic material. Therefore it is surprising that the conservation of CWR has not been more systematically addressed and that the rapid declines in landraces have generated relatively little international concern.
Estimates of the global value associated with the use of plant genetic resources for food and agriculture vary from hundreds of millions to tens of billions of US dollars every year. For example, it has been estimated that between 1976 and 1980 wild species contributed US$340 million per year to the US farm economy alone in terms of yield increase and disease resistance4. Whatever the exact economic value, we do know that when agricultural disasters occur from new diseases or changing environmental conditions, plant genetic resources can often provide solutions by providing rapid access to new genetic material.
These benefits affect some of the crops that are at the centre of our global food supplies. For example, wild relatives of potatoes (Solanum spp.) have been used to improve cultivated varieties since the 1900s, when genes from the Mexican S. demissum were used to breed resistance against potato blight5. During the 1970s, grassy-stunt virus severely reduced rice yields in Asia; after screening over 17,000 cultivated and wild rice samples, disease resistance was found in a population of Oryza nivara growing wild in Uttar Pradesh, India. Resistant rice hybrids containing the wild Indian gene are now grown across Asia6. Also in the 1970s, almost US$1,000 million worth of the US maize crop was destroyed by corn blight, which reduced yields by as much as 50 per cent7. The problem was solved through the use of blight resistant genes from wild varieties of Mexican maize8. Genes from wild relatives can also improve crop performance. For example, genes from a wild relative of the tomato have contributed to a 2.4 per cent increase in solid content in commercial tomatoes. This increase has been valued as being worth approximately US$250 million in California alone9.
Crop breeders and the executives of agribusiness companies recognise the importance of this genetic material. Yet in practice these safeguards of food security are under threat. For example, wild teosinte (the closest wild relative of maize) populations in Mexico and Central America have shrunk by more than 50 per cent in the last 40 years and the establishment of in situ genetic reserves is seen as the only viable option for their conservation10.
3 Maxted, N., Ford-Lloyd, B.V. and Kell, S.P., (2007); Crop wild relatives: establishing the context. In: Maxted, N., Ford-Lloyd, B.V., Kell, S.P., Iriondo, J., Dulloo, E. and Turok, J. (eds.) Crop Wild Relative Conservation and Use. Pp. 3-30. CABI Publishing, Wallingford.
4 Shand, H. (1993); Harvesting Nature’s Diversity. Food and Agriculture Organization of the United Nations, Rome
5 Hijmans, R. J., K. A. Garrett, Z. Huaman, D. P. Zhang, M. Schreuder and M. Bonierbale (2000); Assessing the geographic representativeness of genebank collections: the case of Bolivian wild potatoes, Conservation Biology, 14:6, 1755-1765
6 Shand, H. (1993); op cit
7 ibid
8 Prance, G. T. (1997); The conservation of botanical diversity, in N. Maxted, B. V. Ford-Lloyd and J. G. Hawkes (Eds) Plant Genetic Diversity, Chapman and Hall, UK
9 IPGRI (undated); Conserving crop wild relatives: Information Sheet, International Plant Genetic Resources Institute, Rome, Italy
10 Wilkes, G. (2007); Urgent notice to all maize researchers: disappearance and extinction of the last wild teosinte population is more than half completed, a modest proposal for teosinte evolution and conservation in situ: the Balsas, Guerrero, Mexico. Maydica 52: 49-58.
Protected Areas in Today’s World: Their Values and Benefits for the Welfare of the Planet
44
As more and more land is modified and natural systems destroyed, an increasing number of CWR are likely to be at risk. Landraces are also disappearing at alarming rates as agriculture becomes standardised, small farms are swallowed up in larger developments and the older generations growing the landraces die out. More insidious threats, such as climate change and contamination from genetically modified crops, may further undermine our agricultural stability.
The risks are further increased because, despite the profusion of food sold in supermarkets, the global popula-tion is actually relying on an ever-narrower group of species and varieties for the bulk of its nutrition. Around a hundred plant species contribute 90 per cent of the world’s plant food supply11 and in many cases these have undergone a dramatic narrowing of diversity within the species as well. FAO estimates that some 75 per cent of the genetic diversity of agricultural crops has been lost in the last century12. The Rural Advancement Fund International found that 97 per cent of the varieties listed in old United States Department of Agriculture catalogues are now extinct13. In Germany, about 90 per cent of historical diversity of crops has been lost, and in South Italy about 75 per cent of the crop varieties have disappeared14. Introduction of high-yielding, high input crop varieties into the tropics has also led to a massive decline in variation.
Conservation of a maximum range of genetic material is thus increasingly recognised as being an essential element in providing the raw materials for breeding programmes and is the vital element to ensure future global food security. In the past, this has been attempted mainly through ex situ conservation in seed banks and botanical gardens but, whilst these remain of key importance their limitations are also now recognised and in situ conservation has an increasingly high profile.
6.3 THe roLe oF ProTeCTed AreAS IN MAINTAINING Cwr ANd LANdrACeS
Protected areas can play an important role in in situ conservation strategies of agricultural plant genetic diversity. Crop wild relatives exist in many different types of protected areas, ranging from strictly protected “no-go” areas to protected landscapes with high human populations. However some management approaches are likely to be particular suitable to conserving agrobiodiversity including:
Strictly protected reserves (often small) set aside and left untouched to protect particular species under •threat (IUCN management Category Ia) Large ecosystem-scale protected areas maintained to allow CWR to continue to flourish and evolve under •natural conditions (IUCN Category II)Small reserves managed to maintain particular species, for example through controlled grazing or cutting •to retain important grassland habitat, or sometimes intervening to restore habitat of threatened CWR species (IUCN Category IV)
It has been argued that CWR are rarely associated with climax communities and so are less often associated with protected areas15. However, this implies use of a narrow definition of both CWR and protected areas. While the close CWR and progenitors of major crops are often associated with disturbed habitats, this is not exclusively so and a broader definition of CWR includes species associated with a full range of successional
11 Prescott-Allen, R. and C. Prescott-Allen (1990); How Many Plants Feed the World?, Conservation Biology, Vol. 4:4, p365-374
12 FAO (1998); Crop Genetic Resource, in Special: Biodiversity for Food and Agriculture, FAO, Rome, at: http://www.fao.org/sd/EPdirect/EPre0039.htm (accessed 29/6/05)
13 Fowler, C. and P. Mooney (1990); The Threatened Gene - Food, Politics, and the Loss of Genetic Diversity, The Lutworth Press, Cambridge, UK
14 K. Hammer, Th Gladis and A. Diederichsen (2002); In situ and on-farm management of plant genetic resources, Europ. J. Agronomy 19, 509-517, www.elsevier.com/locate/eja
15 Jain, S. K. (1975) Genetic reserves, in Crop genetic resources for today and tomorrow (O.H. Frankel and J.G. Hawkes), Cambridge University Press. Cambridge, pp. 379-396.
45
Protected Areas and Plant Agrobiodiversity
stages. It is also a mistake to assume that protected areas are only established for climax communities as many are large enough to encompass occasional major disturbances as part of their ecosystem functioning and others are managed to maintain earlier successional stages. Recognition that important CWR were present in a protected area could be a reason for introducing management strategies aimed at maintaining succession at a stage suitable for the species.
A more deliberate approach may be needed to maintain landraces and the CWR which are wild and weedy species associated with agriculture, inside protected areas. This usually involves the use of traditional agricul-tural practices. A few reserves have been set up specifically to maintain such practices. For instance:
Protecting traditional agricultural lands and management approaches as part of a wider landscape-scale ap-proach to protection (IUCN Category V)16
Maintaining the sustainable use of traditional CWR to ensure that these species remain valued by local com-munities and are thus protected (IUCN Category VI)
Sometimes a combination of approaches will be suitable, such as when a core area is strictly protected to preserve wild species and a buffer zone surrounding this is under a level of sustainable management involv-ing the exploitation of the species, primarily by local people. The UNESCO Man and the Biosphere series of reserves is an example of mixing such sustainable use and strict protection strategies, but zoning can also be used in a wide variety of other protected area types to distinguish between different management approaches. In cases where conservation of landraces is an important focus of management, zoning might be used to allow greater intervention in some parts of the protected area, where traditional agriculture was being encouraged to maintain old varieties.
6.4 eXAMPLeS oF ProTeCTed AreAS THAT ALSo ProTeCT AGroBIodIVerSITY
A recent report included a survey of the role of protected areas in protecting agrobiodiversity and described examples from around the world, including17:
Armenia • : Erebuni State Reserve, Category Ia, 89 ha. This area is known for its diversity of wild wheat, including Triticum urartu, T. boeoticum, T. araraticum and Aegilops spp. The area was recommended for protection as early as 195118 and formal protection was achieved in 198119. Experts have recommended that the reserve be enlarged to about 400 ha, to include rare populations of other species growing on the periphery of the area.Australia • : Border Ranges National Park, IUCN Category II, 31,683 ha. Several species of economic importance occur in this area, including macadamia nuts (Macadamia integrifolia and M. tetraphylla) and finger lime (Microcitrus australasica), which has been used as a source of genetic material to improve disease resistance in commercial citrus fruit20.
16 Amend T., J. Brown, A Kothari, A Phillips and S Stolton (eds.) (2008); Protected Landscapes and Agrobiodiversity Values. — Volume 1: Values of Protected Landscapes and Seascapes, IUCN and GTZ. Kasparek Verlag, Heidelberg.
17 Stolton, S., N. Maxted, B. Ford-Lloyd, S. Kell and N. Dudley (2006); Food Stores: Using protected areas to secure crop genetic diversity, WWF and The University of Birmingham, Gland Switzerland and Birmingham UK
18 Vavilov, N. I. (1951); Phytogeographic basis of plant breeding, in The origin, variation, immunity and breeding of culti-vated plants. (K.S. Chester, trans.) Chronica Botanica 13: 14-54
19 http://enrin.grida.no/biodiv/index_en.htm (accessed 12/12/07)
20 Davis, S. D., V. H. Heywood and A. C. Hamilton (1994); Centres of plant diversity. A guide and strategy for their conserva-tion, 3 volumes, IUCN, Cambridge, UK and WWF, Gland, Switzerland; Vol 2: 465
Protected Areas in Today’s World: Their Values and Benefits for the Welfare of the Planet
46
Costa Rica • : Corcovado National Park, IUCN Category II, 47,563 ha. This park in the south of the country is a genetic reserve for avocado (Persea americana), “nance” (Byrsonima crassifolia) and “sonzapote” (Licania platypus)21.Germany • : Flusslandschaft Elbe Biosphere Reserve (includes the Steckby-Lödderitzer Forest Nature Reserve, IUCN Category IV, 3,850 ha, 374,432 ha). Germany is using nature reserves as a basis for the in situ conservation of wild relatives of apples and pears22. In particular, the Flusslandschaft Elbe Reserve, one of the biggest floodplain forests in Central Europe23, includes wild fruit tree species such as pear (P. achras and P. pyraster) and apple (M. sylvestris)24. The Steckby-Lödderitzer Forest, which is included in the reserve, is particularly important for the in situ conservation of wild fruit crop genetic resources. Other important CWR include perennial ryegrass (Lolium perenne), a pasture grass.Iran • : Touran Protected Area, IUCN Category V, 1,102,080 ha. This area, which includes a national park (Category II, 118,000 ha) and biosphere reserve (1,470,640 ha), contains a CWR of barley (Hordeum sp.)25.Kyrgyzstan • : Besh-Aral State Nature Reserve IUCN Category Ia, 63,200 ha. The walnut-fruit forests of this reserve contain a range of species including nuts such as walnut (Juglans regia), pear and a wild plum (P. sogdiana)26.Peru • : Quechua communities in the Pisac Cusco area of Peru (an area characterised by rain-fed high altitude agriculture systems) are establishing a ‘Parque de la Papa’ (Potato Park); a community-based, agrobiodiversity focused conservation area. The initiative has bought together 8,000 villagers from six communities, who have agreed to manage jointly their 8,661 ha of communal land for their collective benefit. Their aim is to conserve their landscape, livelihoods and way of life, and to revitalise their cus-tomary laws and institutions27.Turkey • : Beydaglari Coast National Park, IUCN Category II, 34,425 ha. Situated in Western Anatolia on the southern Mediterranean coast of Turkey, this park (also known as Olimpos-Beydaglari) contains the rare endemic relative of the faba bean (Vicia eristalioides)28
United States • : Organ Pipe Cactus National Monument, IUCN Category II, 133,925 ha. Located in South-western Arizona, with a southern boundary shared with Mexico, this protected area contains small populations of wild chilli peppers (Capsicum annuum)29.
The above examples illustrate two trends: 1) much of the interesting work is taking place in parts of the world where protected areas have not previously been a priority, particularly in Central Asia; 2) conser-vation is taking place in a range of different protected area types and sometimes, as in the case of the Peru potato park, in community conserved areas that are quite different from what many people would regard as protected areas.
21 Davis, S. D., V. H. Heywood and A. C. Hamilton (1994); op cit; Vol 3: 217
22 Schlosser, S. (1985); The Use of Nature Reserves for in situ Conservation. IBPGR Plant Genetic Resources Newsletter, p23-24
23 http://www.unesco.org/mabdb/br/brdir/directory/biores.asp?code=GER+01&mode=all accessed 12/12/07)
24 Seidel, E. (1983); Biosphere Reserve Steckby-Loedderitzer Forest, German Democratic Republic, GDR National Committee of the UNESCO Programme on Man and the Biosphere
25 Groombridge, B. (1992); Global Biodiversity: Status of the Earth’s Living Resources, WCMC with Chapman and Hall, London
26 Musuraliev, T. M. (1998); Forest management and policy for the walnut-fruit forests of the Kyrgyz Republic, in Blaser, J., J. Carter and D. Gilmour (Eds); Biodiversity and sustainable use of Kyrgyzstan’s walnut-fruit forests, IUCN Gland, Switzerland and Cambridge, UK and INTERCOOPERATION, Bern, Switzerland
27 Stolton S. et al (2006); op cit
28 Maxted, N., B. V. Ford-Lloyd and J. G. Hawkes (1997); Complementary Conservation Strategies, in N. Maxted, B. V. Ford-Lloyd and J. G. Hawkes , Plant genetic conservation: the in situ approach (eds.), Chapman & Hall, London, UK
29 Tewksbury J., G. Nabhan, D. Norman, H. Suzan, J. Tuxill and J. Donovan (1999); In situ conservation of wild Chiles and their biotic associates. Conservation Biology 13: 1 98–107
47
Protected Areas and Plant Agrobiodiversity
6.5 Are ProTeCTed AreAS CATerING eFFeCTIVeLY For AGroBIodIVerSITY?
From the perspective of the CBD Programme of Work on Protected Areas, one important question is whether there are significant gaps in coverage of protected areas for agrobiodiversity. Preliminary research suggests that this is in fact the case.
Wild relatives and ancient forms of crops are not spread evenly across the world, but are concentrated in relatively small, isolated and frequently mountainous regions known as “centres of origin or diversity”. A generally-accepted list includes:
East Asiatic Centre • (central and West China, Korea, Japan, and Taiwan): 138 distinct species have been recognised in this centre, of which probably the earliest and most important were cereals, buckwheats and legumesTropical Centre • (South China, India and South East Asia): 55 species recognised, including Asian rice, millets, legumes, root crops (Dioscorea spp., Tacca, etc.), fruit crops sugarcane, and spices.Central Asia and North West India • (Uzbekistan, Kazakhstan, Kyrgyzstan and India): 42 species identi-fied, in particular wheat species, rye and many herbaceous legumes, as well as seed-sown root crops and fruits.South West Asiatic Centre ( • Turkey, Iran and Afghanistan): around 80 species, including wheat species, rye, oats, seed and forage legumes and fruits.The Mediterranean Centre • (countries bordering the Mediterranean Sea): includes over 80 species of wheat, barley, forage plants, vegetables and fruits, as well as spices and oil plants.The Abyssinian Centre • (Ethiopian): important as a refuge for crops from other regions, especially wheat and barley, as well as local grains and spices.Central American Centre • (South Mexico and Central America): this centre is important for maize, Phaseolus and Cucurbitaceous species, with spices, fruits and fibre plants.Andean Centre • (Peru, Ecuador, Bolivia, and Chile): important for potatoes, other root crops, grain crops of the Andes, vegetables, spices and fruits.
The list is not fully comprehensive — for example, Cuba is a high centre of crop diversity — but it is nonetheless a useful basis for a gap analysis. Recent research30 compared levels of protection in the centres of crop diversity with global average coverage of protected areas and rates of land degradation. The analysis was based on a global assessment carried out by The Nature Conservancy (TNC) and WWF on the status of the 825 terrestrial ecoregions31 identified by WWF’s Conservation Science Program32. In total, 29 (82 per cent) of the 34 ecoregions that include major centres of crop diversity have protection levels of less than 10 per cent, and six areas (18 per cent) have protection levels of one per cent or less, meaning that protected area coverage is considerably lower than the global average and than that recommended by IUCN (the World Conservation Union). Habitat loss has also been quite rapid in most of these ecoregions. Without further detailed study the impacts of this are hard to judge (as mentioned above, some CWR are found on disturbed land), but experience suggests that as development progresses and agriculture becomes more intensive, many CWR and landraces become threatened and as a result an increasing number appear in Red Lists and are in need of in situ conservation. Therefore, as development reduces opportunities for CWR and landraces in the broader landscape, protected areas gain an increasingly important role in maintaining agricultural biodiversity. However, currently, it seems that protection levels may not be adequate in some of the world’s most important sources of agricultural genetic material.
30 Stolton S. et al (2006); op cit
31 WWF defines an ecoregion as a large area of land or water that contains a geographically distinct assemblage of natural communities that: share a large majority of their species and ecological dynamics; similar environmental conditions, and interact ecologically in ways that are critical for their long-term persistence.
32 Hoekstra, J M, T M Boucher, T H Ricketts and C Roberts (2005); Confronting a biome crisis: global disparities of habitat loss and protection, Ecology Letters, 8: 23–29
Protected Areas in Today’s World: Their Values and Benefits for the Welfare of the Planet
48
6.6 SoMe oVerALL CoNCLUSIoNS
Protected areas can provide effective protection for agrobiodiversity; however, many centres of diversity are poorly protected. The role of protected areas in conserving crop genetic diversity could be increased by a better understanding of this issue within protected area organisations. Promotion of the conservation of crop genetic diversity within existing protected areas may also further enhance the public perception of protected areas and help to ensure longer term site security. There are already a few protected areas managed specifically to retain landraces and CWR and many are known to contain populations essential to the conservation of plant genetic resources.
6.7 reSPoNSeS FroM SIGNATorIeS oF THe CBd
There is an urgent need to increase the level of protection in centres of crop genetic diversity with inadequate levels of protection and/or rapid habitat destruction to uses incompatible with biodiversity conservation. There is an opportunity for the CBD, with its dual interests in agricultural diversity and protected areas, to play a catalysing role in increasing protected area coverage in these regions. Initial research has identified the following examples of ecoregions where additional protected areas should be established in areas for particularly important agrobiodiversity:
Southern Korean evergreen forests (South Korea) •Sumatran lowland rain forests (Indonesia) •Eastern Anatolian deciduous forests (Iran, Turkey and Armenia) •Kopet Dag woodlands and forest steppe (Southern Turkmenistan and northern Iran) •Eastern Anatolian montane steppe (Iran, Turkey and Armenia) •Alai-Western Tian Shan steppe (Kazakhstan, Uzbekistan, and into Tajikistan) •Gissaro-Alai open woodlands (Kyrgyzstan, Tajikistan, and Uzbekistan) •Tian Shan foothill arid steppe (China, Kazakhstan, and Kyrgyzstan) •Beni savanna (Northern Bolivia) •Central Andean wet puna (Peru and Bolivia) •
As a global priority, each country in these regions needs to assess whether the existing network of protected areas adequately represents the full range of national CWR and landrace diversity, and suggest additional reserve locations where required. To achieve this, each country first needs to compile an inventory of its native CWR and landrace resources and with this information develop a systematic national conservation strategy33. A new desk study, to be published by the FAO, matching CWRs of species identified as priorities for global food security by the FAO with existing protected areas will also provide managers with an excellent starting point to identifying important CWRs in their protected areas.34
The CBD could also consider developing additional guidance to its Programme of Work on Protected Areas in collaboration with FAO, Biodiversity International and IUCN — The World Conservation Union, encouraging Parties to include CWR and landraces within their ecologically-representative protected area networks.
The conservation of plant agrobiodiversity in protected areas is a relatively novel concept however clear meth-odological guidelines now exist that can be made widely available to, and used by, protected area managers35. Specifically, these guidelines can be applied to the management of protected areas for CWR and landraces, enabling the integration of agrobiodiversity conservation with broader biodiversity conservation. How best to
33 Maxted, N., Scholten, M.A., Codd, R. and Ford-Lloyd, B.V., (2007). Creation and Use of a National Inventory of Crop Wild Relatives. Biological Conservation, 140: 142-159.
34 Maxted, N. and Kell, S. (2008). Establishment of a network for the in situ conservation of crop wild relatives: status and needs. Commission on Genetic Resources for Food and Agriculture. Food and Agriculture Organization of the United Nations.
35 Iriondo, J.M., Maxted, N. and Dulloo, E. (Eds.) (2008). Conserving Plant Genetic Diversity in Protected Areas: Population Management of Crop Wild Relatives. CABI Publishing, Wallingford.
49
Protected Areas and Plant Agrobiodiversity
enhance the benefits for local community from conserved areas that could provide useful resources, includ-ing sacred sites and other areas set aside from development, needs careful consideration. Certain regions of the world with experience in these applications should be encouraged to share their expertise by means of technology transfer between countries and regions.
The CBD encourages individual countries to establish national biodiversity conservation, but there is a more specific need to develop and strengthen national and international wildlife protection legislation to promote the conservation of agrobiodiversity in protected areas. There is a need to review which CWR species are included in existing national, regional and global policy and legislative instruments, and where necessary initiate legislative protection for priority CWR taxa and landraces not already covered.
More generally, public awareness of the vital role of agrobiodiversity in food security and wealth creation could be enhanced by the incorporation of general environmental issues generally and agrobiodiversity and protected area conservation specifically in education curriculums at various levels.
Overall, the annual international seed trade is worth over US$5 billion36. If just a fraction of this sum was used to protect the resources breeders rely on to improve commercial seeds and a small proportion of this went to the protected areas which conserve important crop genetic resources, many of the world’s most under-resourced protected areas could receive a considerable boost to their budgets and thus their capacity for effective management.
36 http://www.worldseed.org/statistics.htm#TABLE%201 (accessed 12/12/2007)
Protected Areas in Today’s World: Their Values and Benefits for the Welfare of the Planet
50
THe SPIrITUAL dIMeNSIoN oF ProTeCTed AreAS: 7. oVerLooKed ANd UNderVALUed
Liza Higgins-ZogibWWF International
7.1 INTrodUCTIoN
The spiritual dimension of protected areas comes in many shapes, forms, and sizes. In hundreds, probably even thousands, of the world’s ‘official’ protected areas, sacred sites exist. From the water sources inhabited by ancestor spirits of Madagascar’s parks and reserves; to the myriad of Christian monasteries in Romania’s protected areas; to the pilgrimage routes walked by millions of Hindus and Buddhists in India and Nepal; to the mounts, holy for Jews, Christians, and Muslims alike. In so many ways and in so many places, sacred sites, faith groups, and protected areas meet. What this means is that millions of people have a special regard for and relationship with hundreds, or thousands, of protected areas not because of their importance to biodiversity but because of their spiritual values. The unfortunate fact is that many of these millions do not know much about protected areas and many protected area authorities do not know much about the sacred dimension of their parks. This is what we might call a missed opportunity.
This paper considers the spiritual argument that is rarely raised in discussions about protected areas and calls on protected area managers, administrators, and policy-makers to acknowledge these important values and their potential to contribute to the targets of the Convention on Biological Diversity (CBD).
7.2 Spiritual valueS in protected areaS
In the WWF/ARC report Beyond Belief: Linking faiths and protected areas to support biodiversity conservation (Dudley et al 2005), the authors explored many different ways in which faiths and biodiversity conservation, in particular protected areas, interact. The two principal ways identified were 1) through the direct protection of species and areas in sacred natural sites and semi-natural areas surrounding religious buildings and 2) by the influence of faiths on followers’ beliefs and attitudes towards the protection of nature.
The report concentrated mainly on the first point and included a survey of one hundred protected areas around the world which contain important values to one or more faiths. This, we believe, is a very small but indicative sample of protected areas with a variety of spiritual dimensions. WWF now has a database of around three hundred such areas. The following table1 provides a few examples of the interaction of spirit and protected areas:
1 Some of the table entries are taken directly from the one hundred sites listed in Beyond Belief: linking faiths and protected areas to support biodiversity conservation. The others are sourced from elsewhere. All are housed in the WWF database.
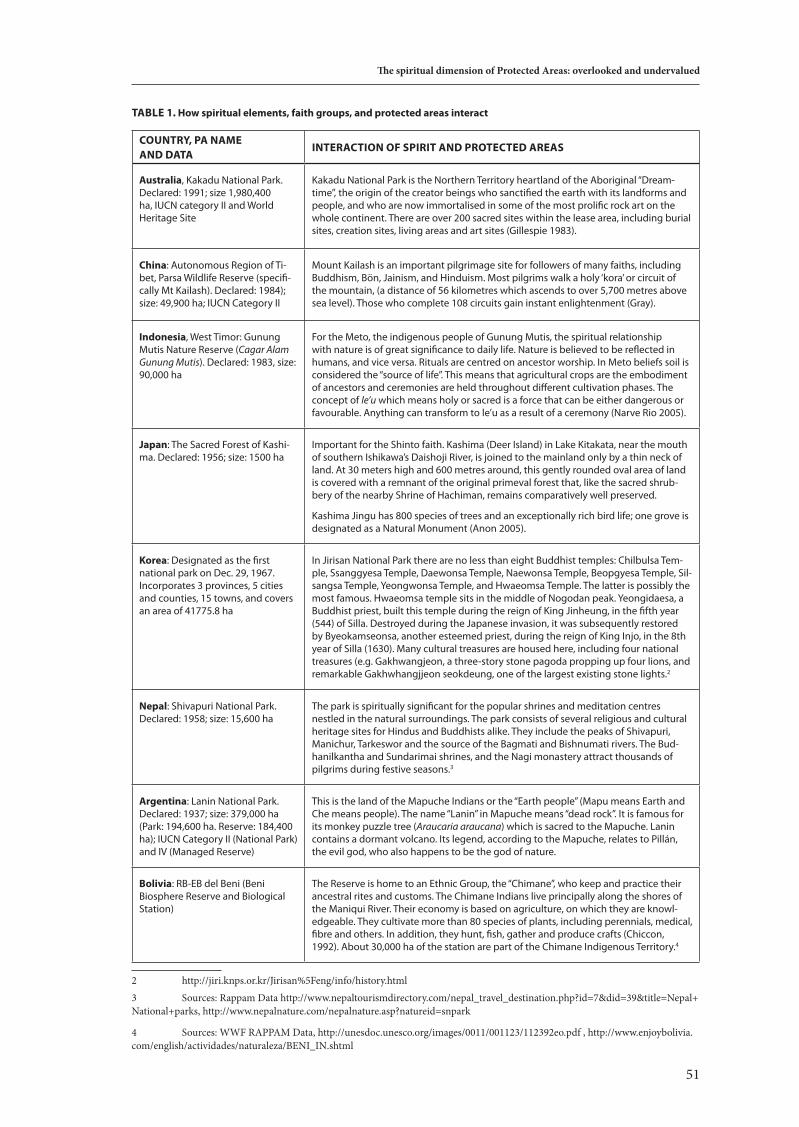
51
The spiritual dimension of Protected Areas: overlooked and undervalued
TABLe 1. How spiritual elements, faith groups, and protected areas interact
CoUNTrY, PA NAMe ANd dATA
INTerACTIoN oF SPIrIT ANd ProTeCTed AreAS
Australia, Kakadu National Park. Declared: 1991; size 1,980,400 ha, IUCN category II and World Heritage Site
Kakadu National Park is the Northern Territory heartland of the Aboriginal “Dream-time”, the origin of the creator beings who sanctified the earth with its landforms and people, and who are now immortalised in some of the most prolific rock art on the whole continent. There are over 200 sacred sites within the lease area, including burial sites, creation sites, living areas and art sites (Gillespie 1983).
China: Autonomous Region of Ti-bet, Parsa Wildlife Reserve (specifi-cally Mt Kailash). Declared: 1984); size: 49,900 ha; IUCN Category II
Mount Kailash is an important pilgrimage site for followers of many faiths, including Buddhism, Bön, Jainism, and Hinduism. Most pilgrims walk a holy ‘kora’ or circuit of the mountain, (a distance of 56 kilometres which ascends to over 5,700 metres above sea level). Those who complete 108 circuits gain instant enlightenment (Gray).
Indonesia, West Timor: Gunung Mutis Nature Reserve (Cagar Alam Gunung Mutis). Declared: 1983, size: 90,000 ha
For the Meto, the indigenous people of Gunung Mutis, the spiritual relationship with nature is of great significance to daily life. Nature is believed to be reflected in humans, and vice versa. Rituals are centred on ancestor worship. In Meto beliefs soil is considered the “source of life”. This means that agricultural crops are the embodiment of ancestors and ceremonies are held throughout different cultivation phases. The concept of le’u which means holy or sacred is a force that can be either dangerous or favourable. Anything can transform to le’u as a result of a ceremony (Narve Rio 2005).
Japan: The Sacred Forest of Kashi-ma. Declared: 1956; size: 1500 ha
Important for the Shinto faith. Kashima (Deer Island) in Lake Kitakata, near the mouth of southern Ishikawa’s Daishoji River, is joined to the mainland only by a thin neck of land. At 30 meters high and 600 metres around, this gently rounded oval area of land is covered with a remnant of the original primeval forest that, like the sacred shrub-bery of the nearby Shrine of Hachiman, remains comparatively well preserved.
Kashima Jingu has 800 species of trees and an exceptionally rich bird life; one grove is designated as a Natural Monument (Anon 2005).
Korea: Designated as the first national park on Dec. 29, 1967. Incorporates 3 provinces, 5 cities and counties, 15 towns, and covers an area of 41775.8 ha
In Jirisan National Park there are no less than eight Buddhist temples: Chilbulsa Tem-ple, Ssanggyesa Temple, Daewonsa Temple, Naewonsa Temple, Beopgyesa Temple, Sil-sangsa Temple, Yeongwonsa Temple, and Hwaeomsa Temple. The latter is possibly the most famous. Hwaeomsa temple sits in the middle of Nogodan peak. Yeongidaesa, a Buddhist priest, built this temple during the reign of King Jinheung, in the fifth year (544) of Silla. Destroyed during the Japanese invasion, it was subsequently restored by Byeokamseonsa, another esteemed priest, during the reign of King Injo, in the 8th year of Silla (1630). Many cultural treasures are housed here, including four national treasures (e.g. Gakhwangjeon, a three-story stone pagoda propping up four lions, and remarkable Gakhwhangjjeon seokdeung, one of the largest existing stone lights.2
Nepal: Shivapuri National Park. Declared: 1958; size: 15,600 ha
The park is spiritually significant for the popular shrines and meditation centres nestled in the natural surroundings. The park consists of several religious and cultural heritage sites for Hindus and Buddhists alike. They include the peaks of Shivapuri, Manichur, Tarkeswor and the source of the Bagmati and Bishnumati rivers. The Bud-hanilkantha and Sundarimai shrines, and the Nagi monastery attract thousands of pilgrims during festive seasons.3
Argentina: Lanin National Park. Declared: 1937; size: 379,000 ha (Park: 194,600 ha. Reserve: 184,400 ha); IUCN Category II (National Park) and IV (Managed Reserve)
This is the land of the Mapuche Indians or the “Earth people” (Mapu means Earth and Che means people). The name “Lanin” in Mapuche means “dead rock”. It is famous for its monkey puzzle tree (Araucaria araucana) which is sacred to the Mapuche. Lanin contains a dormant volcano. Its legend, according to the Mapuche, relates to Pillán, the evil god, who also happens to be the god of nature.
Bolivia: RB-EB del Beni (Beni Biosphere Reserve and Biological Station)
The Reserve is home to an Ethnic Group, the “Chimane”, who keep and practice their ancestral rites and customs. The Chimane Indians live principally along the shores of the Maniqui River. Their economy is based on agriculture, on which they are knowl-edgeable. They cultivate more than 80 species of plants, including perennials, medical, fibre and others. In addition, they hunt, fish, gather and produce crafts (Chiccon, 1992). About 30,000 ha of the station are part of the Chimane Indigenous Territory.4
2 http://jiri.knps.or.kr/Jirisan%5Feng/info/history.html 3 Sources: Rappam Data http://www.nepaltourismdirectory.com/nepal_travel_destination.php?id=7&did=39&title=Nepal+National+parks, http://www.nepalnature.com/nepalnature.asp?natureid=snpark
4 Sources: WWF RAPPAM Data, http://unesdoc.unesco.org/images/0011/001123/112392eo.pdf , http://www.enjoybolivia.com/english/actividades/naturaleza/BENI_IN.shtml
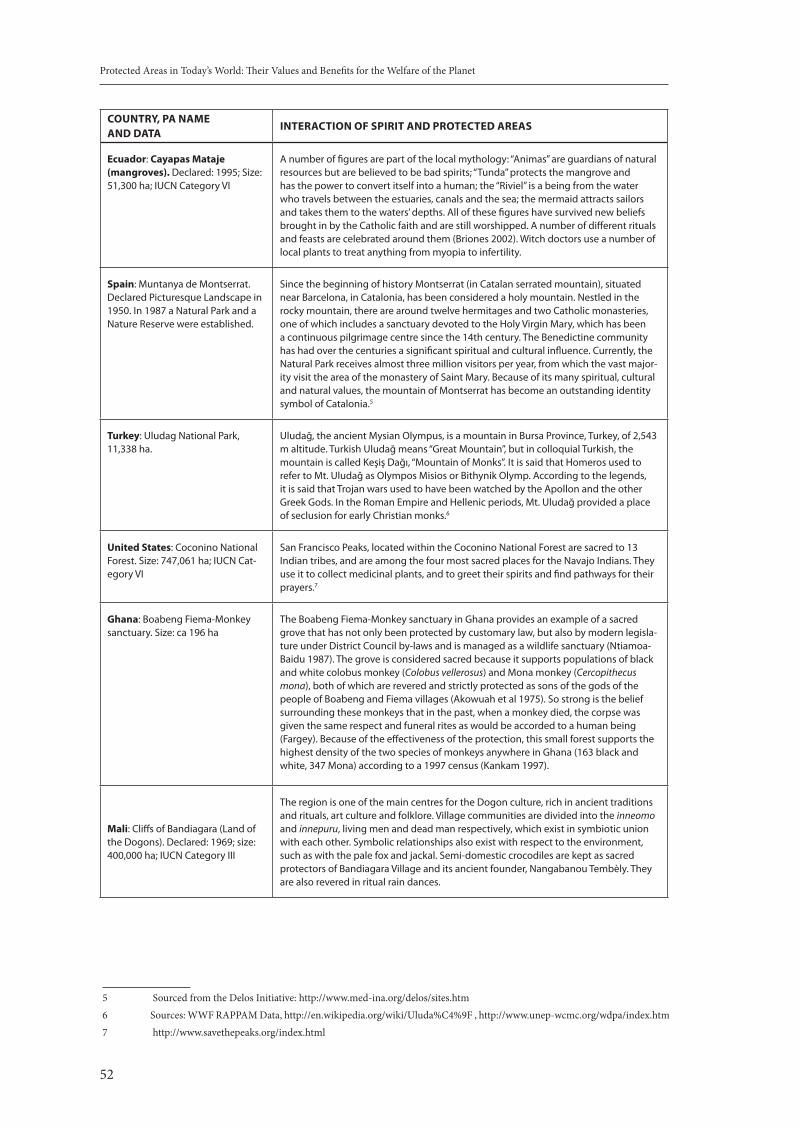
Protected Areas in Today’s World: Their Values and Benefits for the Welfare of the Planet
52
CoUNTrY, PA NAMe ANd dATA
INTerACTIoN oF SPIrIT ANd ProTeCTed AreAS
ecuador: Cayapas Mataje (mangroves). Declared: 1995; Size: 51,300 ha; IUCN Category VI
A number of figures are part of the local mythology: “Animas” are guardians of natural resources but are believed to be bad spirits; “Tunda” protects the mangrove and has the power to convert itself into a human; the “Riviel” is a being from the water who travels between the estuaries, canals and the sea; the mermaid attracts sailors and takes them to the waters’ depths. All of these figures have survived new beliefs brought in by the Catholic faith and are still worshipped. A number of different rituals and feasts are celebrated around them (Briones 2002). Witch doctors use a number of local plants to treat anything from myopia to infertility.
Spain: Muntanya de Montserrat. Declared Picturesque Landscape in 1950. In 1987 a Natural Park and a Nature Reserve were established.
Since the beginning of history Montserrat (in Catalan serrated mountain), situated near Barcelona, in Catalonia, has been considered a holy mountain. Nestled in the rocky mountain, there are around twelve hermitages and two Catholic monasteries, one of which includes a sanctuary devoted to the Holy Virgin Mary, which has been a continuous pilgrimage centre since the 14th century. The Benedictine community has had over the centuries a significant spiritual and cultural influence. Currently, the Natural Park receives almost three million visitors per year, from which the vast major-ity visit the area of the monastery of Saint Mary. Because of its many spiritual, cultural and natural values, the mountain of Montserrat has become an outstanding identity symbol of Catalonia.5
Turkey: Uludag National Park, 11,338 ha.
Uludağ, the ancient Mysian Olympus, is a mountain in Bursa Province, Turkey, of 2,543 m altitude. Turkish Uludağ means “Great Mountain”, but in colloquial Turkish, the mountain is called Keşiş Dağı, “Mountain of Monks”. It is said that Homeros used to refer to Mt. Uludağ as Olympos Misios or Bithynik Olymp. According to the legends, it is said that Trojan wars used to have been watched by the Apollon and the other Greek Gods. In the Roman Empire and Hellenic periods, Mt. Uludağ provided a place of seclusion for early Christian monks.6
United States: Coconino National Forest. Size: 747,061 ha; IUCN Cat-egory VI
San Francisco Peaks, located within the Coconino National Forest are sacred to 13 Indian tribes, and are among the four most sacred places for the Navajo Indians. They use it to collect medicinal plants, and to greet their spirits and find pathways for their prayers.7
Ghana: Boabeng Fiema-Monkey sanctuary. Size: ca 196 ha
The Boabeng Fiema-Monkey sanctuary in Ghana provides an example of a sacred grove that has not only been protected by customary law, but also by modern legisla-ture under District Council by-laws and is managed as a wildlife sanctuary (Ntiamoa-Baidu 1987). The grove is considered sacred because it supports populations of black and white colobus monkey (Colobus vellerosus) and Mona monkey (Cercopithecus mona), both of which are revered and strictly protected as sons of the gods of the people of Boabeng and Fiema villages (Akowuah et al 1975). So strong is the belief surrounding these monkeys that in the past, when a monkey died, the corpse was given the same respect and funeral rites as would be accorded to a human being (Fargey). Because of the effectiveness of the protection, this small forest supports the highest density of the two species of monkeys anywhere in Ghana (163 black and white, 347 Mona) according to a 1997 census (Kankam 1997).
Mali: Cliffs of Bandiagara (Land of the Dogons). Declared: 1969; size: 400,000 ha; IUCN Category III
The region is one of the main centres for the Dogon culture, rich in ancient traditions and rituals, art culture and folklore. Village communities are divided into the inneomo and innepuru, living men and dead man respectively, which exist in symbiotic union with each other. Symbolic relationships also exist with respect to the environment, such as with the pale fox and jackal. Semi-domestic crocodiles are kept as sacred protectors of Bandiagara Village and its ancient founder, Nangabanou Tembèly. They are also revered in ritual rain dances.
5 Sourced from the Delos Initiative: http://www.med-ina.org/delos/sites.htm 6 Sources: WWF RAPPAM Data, http://en.wikipedia.org/wiki/Uluda%C4%9F , http://www.unep-wcmc.org/wdpa/index.htm7 http://www.savethepeaks.org/index.html
53
The spiritual dimension of Protected Areas: overlooked and undervalued
The scattering of examples above show some of the ways in which faith groups, sacred sites, and protected areas meet and interact, many of which at least have the potential to positively impact the protection of biodiversity and increase the support that local communities and others can bring to bear for protected area management.
7.3 A dIFFereNT VIew oF ProTeCTed AreAS
Attempts to work with local communities, indigenous and traditional peoples in the context of protected areas will always be flawed unless conservationists start to view the land or seascape as the local populations do. This will practically always include a spiritual dimension. What this means is that protected areas must be viewed as more than simply safe places for biodiversity. They also have a role to play in upholding cultural and spiritual values that, like biodiversity, are at risk from external pressures and threats. Many times these are places where people live and worship and where this is the case it is critical that sacred elements be treated with utmost care and respect. Failing to do so can often be cause for conflict. Below are some ways in which conflict can arise (Higgins-Zogib 2007):
There is no common understanding of sacred places. This may be because these special areas are kept •so strictly secret that even protected area staff do not know where they are, e.g. Lobeke National Park, CameroonThere is no common understanding of protected area objectives. This may be due to a lack of suitable •communications and outreach on the part of protected area administration, e.g. the illegal building of a monastery within the special conservation area of Ceahlau National Park in Eastern RomaniaThere is no respect for the sacred elements of a site. This may be because of a general lack of understand- •ing or willingness to understand, or due to differences in religious beliefs and tendencies, e.g. Kata Tjuta National Park, AustraliaThe effects of one place-view • 8 are damaging to the objectives of the other. This can work both ways. The effects of pilgrimage for example can sometimes prove detrimental to the biodiversity values of a protected area, e.g. Periyar Tiger Reserve, India. Or the effects of tourism to sacred places can be detrimental or offensive to the spiritual values of the place, e.g. Devil’s Tower National Monument, USA
7.4 wHAT CAN ProTeCTed AreAS do For THe SACred?
Sacred natural sites are simply the oldest form of habitat protection in the world. In addition to providing a spiritual service for believers sacred natural sites have also played an important conservation role for thousands of years. In spite of this, the right types of protected areas can indeed provide added value to these traditional conservation methods, themselves increasingly threatened.
External pressures exerted on the environment and its resources also threaten the sacredness of an area. Therefore becoming part of the official protected area system means that a site will have the additional protection of legislation and policy. Along with additional management come new management techniques, new partners and more support. If these additions are introduced correctly the traditional management of the custodians may be strengthened, not undermined. Moreover, being part of an official protected area system potentially increases the likelihood of attracting outside funding and support that can help ensure long-term protection. Additional status for the site and the people who hold it in reverence may follow from an increased recognition. None of these additions will come automatically and careful thought is required for each case in question.
The potential disadvantages are also quite clear. By attracting more attention to the site, increased visitation may be experienced, resulting in a loss of spiritual value. Further in some cases there may also be a loss of custodian control – even a loss of access. These ‘costs’ can outweigh the benefits in some cases. Therefore prior
8 A place-view is defined as a consistent (to a varying degree) and integral sense of existence in a place, which provides a framework for generating, sustaining and applying knowledge
Protected Areas in Today’s World: Their Values and Benefits for the Welfare of the Planet
54
to gazetting an area, the potential consequences of such official recognition must be thoroughly assessed. If the decision is taken to proceed then the sacred elements of the site must be managed appropriately in collabora-tion with those to whom they are sacred. Guidelines for managing sacred elements in and outside protected areas are currently being finalised and will provide decision-makers with a good overview of issues to take into consideration.9 If sites are established and managed appropriately, then benefits for both biodiversity and the spiritual dimension can be accrued.
Clearly the right kinds of well-managed protected areas have a role to play in protecting the spiritual heritage of a country or region. The advantages and disadvantages of having official protected area status depend on individual circumstances and protected area strategies. For example, according to the IUCN category system, a range of management objectives and governance types are recognised. These need to be further explored in the context of managing sacred sites. Categories I and II (strict protected areas and national parks) can be problematic for sacred sites as people may lose the control and autonomy over their areas of worship. In addition, most protected area managers skilled in traditional conservation science are not trained to deal with the needs of the local people and their sacred places. Other IUCN categories of protected areas, including III, V and VI may be more relevant and successful in managing for both spirit and biodiversity. Community conserved areas for example (Category VI) can provide a sound basis for people to live and worship in their traditional lands, while simultaneously protecting these areas from external threats.
7.5 wHAT CAN THe SACred do For ProTeCTed AreAS?
This is a question that is rarely explored by protected area agencies and authorities but it is one that presents us with a rare opportunity to strengthen both biodiversity conservation and cultural heritage.
First there have been many examples cited in the literature of sacred sites that, due to their reverential value, have been successful in conserving the biodiversity of specific species, sites, or even whole landscapes. More research is required to be able to assert just how effective they have been on a global scale.
In the face of growing threats both to environmental and cultural/spiritual wealth, protected areas and other international designations can be a welcome addition for faith groups to ensure the longevity of their sacred places. From this emerges a wave of support for protected areas, particularly from local communities, that may otherwise have been lacking.
In Madagascar’s Ankarana Special Reserve the growing threats of illegal sapphire mining and encroachment are undermining both the biodiversity and the cultural and spiritual elements of the protected area. The com-munities for whom the area is sacred (for ancestor spirits and burial caves) are calling for stricter protection and surveillance of the protected area.10
For many local communities, sacred sites are simply the most compelling argument for protection. Whether this is protection through official channels or through local customary rites and practices, places of reverence are the areas that won’t be compromised by local inhabitants.
In Cambodia’s Mondulkiri Protected Forest the indigenous people who live there worship the burial and spirit forests, where foreigners are rarely allowed to venture. These are places where ancestors dwell and when offence is made to the ancestors by the wrong use or disrespect of the forests, the result is bad luck for the entire village (bad crops, disease, etc.). These places are still very much part of the villagers’ lives and beliefs still remain strong. Worship and offerings are performed regularly.11 When asked, the villagers may be willing
9 IUCN/UNESCO (in progress 2007) Sacred Natural Sites: IUCN/UNESCO Guidelines for Protected Area Management. Consultation version, October 2007
10 Higgins-Zogib L (2006) Personal observations and interview with Prince Tsimiharo II11 Higgins-Zogib L (2006). Interviews with villagers in Mondulkiri Protected Forest, and personal observations
55
The spiritual dimension of Protected Areas: overlooked and undervalued
to sacrifice parts of their forests for material gain – but certainly not the areas of spiritual significance. These no-compromise areas can offer additional protection and support for protection.
7.6 SACred SITeS: A CoNTrIBUTIoN To CBd ProTeCTIoN TArGeTS?
It is worthwhile to consider at this point the many thousands of areas also important for biodiversity con-servation that lie outside of the global protected areas system and that are protected, often with great efficacy by the local people who hold them in reverence. These include the thousands of sacred groves in India, the sacred fishing pools in the Mekong and Ze Kong rivers, and the sacred trees and groves all over central Africa. All of these and more contribute to an unofficial network of protected sites and species. Some of them enjoy particularly effective protection. Others, like a great many official protected areas, face a number of external threats. Whether these unofficial sites should be included in national protected area systems or given other forms of legal recognition must be decided on a case-by-case basis and in full collaboration with the faith group or groups in question.
As nations currently struggle to meet their biodiversity protection targets under the CBD, these customary sites may become more attractive to include into official protected area systems. If such a shift does occur the integration must be undertaken in a respectful, sensitive, empowering fashion and only in response to the wishes of the custodians in question. It should also be noted that in many cases official protection would not be desirable at all.
7.7 CoNCLUSIoNS
Although we are slowly coming to terms with the fact that the ‘human’ aspect of the environment must be taken into consideration in our conservation work, the ‘spirit’ aspect is still largely ignored. Relatively few conservation projects deal adequately with issues of spirit and religion, even in places where these issues take the forefront of peoples’ lives and relations with their natural environment.
We could view this oversight as a problem – but we could also regard it as a great opportunity to build further support for the conservation movement in general and for enhancing the global protected areas system in particular.
Protected areas that do not have the support of the local communities that live in and around them are protected areas in danger. Therefore ignoring spiritual values at best usurps the opportunity to work in col-laboration with communities to ensure good protection and management and at worst can lead to hostility and violence.
It is hardly possible to assign a monetary value to the sacred elements of protected areas. It is clear however that the spiritual dimension of indigenous and local communities is a non-negotiable element of overall wellbeing and the notion of ‘wealth’ for many.
The following conclusions serve as a reminder to protected area authorities, governments, policy makers, and others of the importance of managing for spiritual needs and sacred sites in protected areas:
The spiritual dimension is an important argument for protected areas that is rarely made. •Faith groups, sacred sites, and protected areas meet and interact in a number of ways – many of which •at least have the potential to positively impact the protection of biodiversity.Millions of believers have a special regard for sacred and cultural elements in thousands of protected •areas around the world. These believers are for the most part untapped supporters of the global protected area network.For many local communities, sacred sites are the most compelling argument for protection. •
Protected Areas in Today’s World: Their Values and Benefits for the Welfare of the Planet
56
Attempts to work with local communities and indigenous and traditional peoples will always be flawed •unless conservationists start to view the land or seascape as the local populations do. This will practically always include a spiritual dimension.The right kinds of well-managed protected areas have a role to play in protecting spiritual heritage. •When sacred sites do exist within a protected area they must be managed for accordingly. Sacred natural •sites occur in all of the six IUCN protected area categories. Management of these areas will therefore vary widely in terms of access, use, pressures, and threats.Many more sacred natural sites occur outside official protected area systems and there are other means •to support and recognise them depending largely on the desires of custodians.
References
Akowuah, D K, K Rice, A Merz and V A Sackey (1975); The children of the gods, Journal of the Ghana Wildlife Society 1 (2): 19-22
Anon (2005); The ten most exquisite sacred forests in Japan, Kateigaho International Edition, Spring 2005, Tokyo
Briones, E E (2002); Valores sociales y culturales, article prepared for the Ramsar Bureau for World Wetlands Day: http://www.ramsar.org/features/features_ecuador_esmeraldas.htm
Dudley, N., L. Higgins-Zogib and S. Mansourian (2006). Beyond Belief, WWF International and Alliance for Religion and Conservation, Gland Switzerland and Bath UK
Fargey, P J (undated); Assessment of the Conservation Status of the Boabeng-Fiema Monkey Sanctuary, Final Report to the Flora and Fauna Preservation Society: University of Science and Technology, Kumasi, Ghana
Gillespie, D (ed.) (1983); The rock art sites of Kakadu National Park, Canberra (ACT): Australia National Parks and Wildlife Service. Special Publication 10
Gray, M. www.sacredsites.comHiggins-Zogib, L (2007); ‘Sacred Sites and Protected Areas: An Interplay of Place-Views’, in Haverkort, B
and Rist, S (eds) Endogenous Development and Bio-cultural Diversity, pp. 287-298, Compas series on Worldviews and sciences 6, Leusden
IUCN, CNPPA and WCMC (1994). Guidelines for Protected Area Management Categories, Gland, Switzerland
Kankam, B O (1997); The population of black-and-white colobus (Colobus polykomos) and the mona monkeys (Cercopithecus mona) at the Boabeng-Fiema Monkey Sanctuary and surrounding villages. B.Sc. Thesis, University of Science and Technology, Kumasi, Ghana
Narve Rio (2005); The Metu People of West Timor http://www.indonesiaphoto.com/article256.htmlNtiamoa-Baidu, Y (1987); West African Wildlife; a resource in jeopardy, Unasylva 39 (2): 27-35http://www.savethepeaks.org/index.html
57
Diversifying Protected Area Governance: Ecological, Social, and Economic Benefits
dIVerSIFYING ProTeCTed AreA GoVerNANCe: eCoLoGICAL, 8. SoCIAL, ANd eCoNoMIC BeNeFITS
Ashish KothariIndian environmental group Kalpavriksh, and IUCN WCPA-CEESP Strategic Direction on Governance, Equity, Livelihoods, and Communities (TILCEPA)
Increasing evidence from around the world suggests that protected areas are not only established as a key strategy for conservation of nature and wildlife, but are also becoming important for addressing poverty and livelihood security. One of the common features of many recent innovations is the notion of participatory or community based governance. Simply put, the focus is on greater involvement of local communities, with net benefits for both conservation and people. This article explores the potential of new kinds of protected area governance, moving away from the conventional government managed model, and towards more collaborative and community based models.
8.1 ProTeCTed AreA GoVerNANCe: THe New PArAdIGMS
For over a century, protected areas in the form of government notified sites for wildlife conservation, have been managed through centralized bureaucracies in ways that totally or largely excluded local communities. Given that most Protected Areas (PAs) have traditionally had people living inside or adjacent to them, dependent on their resources and often with associated age-old beliefs and practices, such management has alienated communities. There is also increasing evidence that PAs have often caused further impoverishment of already economically marginal communities, through loss of access to livelihood resources, physical displacement, and other impacts (see, for instance, West et al 2006; Colchester 2004; Lockwood et al 2006; Chatty and Colchester 2002; Policy Matters 15).
Increasingly, though, it has been realized that this is not only violative of the basic human rights of people, it also often backfires on conservation itself. Retaliatory action by disempowered communities, conflicts with Protected Area (PA)managers, inability to use the knowledge and practices of local people, and many other factors have contributed to this. Reversing these trends requires a significant shift in PA management paradigms.
Though a number of countries had already begun to experiment with such new paradigms, the biggest inter-national push towards them was given by the IUCN World Parks Congress, Durban, in 2003. Here, the idea of participatory and community based governance of PAs was given not only due hearing but also explicit support, in various outputs including the Durban Accord, the Durban Plan of Action, the Message to the CBD (http://www.iucn.org/themes/wcpa/wpc2003), and recommendations on Good Governance of PAs, Diversity of Governance Types of PAs, Indigenous Peoples and PAs, Co-management of PAs, Community Conserved Areas, Mobile Indigenous Peoples and Conservation, and Poverty and PAs (http://www.iucn.org/themes/wcpa/wpc2003/pdfs/english/Proceedings/recommendation.pdf). Following closely on the heels of the WPC, and clearly influenced by it, the Conference of Parties to the Convention on Biological Diversity at its seventh meeting in 2004 adopted a comprehensive Programme of Work on Protected Areas, which included clear goals and actions for moving towards new governance models for PAs.
In particular, this included actions to: Recognise PAs under various governance types, including Community Conserved Areas (CCAs) and •Private Protected Areas (PPAs) (2.1.2)Use conservation benefits to alleviate poverty (2.1.4) •Ensure mechanisms of participation by communities in all PAs.(2.1.5) •
Protected Areas in Today’s World: Their Values and Benefits for the Welfare of the Planet
58
Establish and strengthen policies to deal with access and benefit sharing of genetic resources within PAs •(2.1.6)Establish and follow “good governance” principles, including equity and participation (2.2.1) •Implement plans to involve communities at all levels of PA planning, establishment, governance and •management removing barriers preventing adequate participation (2.2.2)Ensure legislative and policy support for the involvement of communities and build their capacity in the •establishment and management of PAs including CCAs and PPAs (2.2.4)Stop relocation or sedentarisation of communities without their prior informed consent(2.2.5) •
In an increasing number of countries, two changes are revolutionizing PA policy and management. First, there is much greater participation of local communities and other citizens in what were once solely government managed PAs, transforming them into collaboratively managed PAs (CMPAs). Second, there is increasing recognition of community conserved areas (CCAs), which exist in diverse forms across the world, but have so far remained outside the scope of formal conservation policies and programmes.
There is no comprehensive assessment yet of how many countries have moved into these directions. However, a survey of protected area agencies just prior to the World Parks Congress, gave a good indication of the trend. In the period 1992-2002, of the 48 PA agencies that responded to the survey, over one-third reported that they had moved towards some form of decentralization in their structure, and engaged a larger range of stakehold-ers than before. Over half reported that they now required, by law, participatory management of PAs. In 1992, 42% of the agencies had said they were the only decision-making authority; by 2002, only 12% said the same. Overall, the survey showed that “PA managers recognize that community support is a requirement of ‘good governance’, and more effort is being directed at involving various stakeholder groups. The general perception is that increased participation has resulted in more effective decision-making”. (Chape et al 2008).
8.2 CoLLABorATIVeLY MANAGed ProTeCTed AreAS (CMPAS)
There are many documented examples of collaborative management and its benefits. To cite a few: The Kaa-Iya del Gran Chaco National Park with an area of 3,440,000 ha, is Bolivia’s largest protected area,. •Set up in 1995, the Park is managed as a collaboration between the Capitania de Alto y Bajo Isoso (CABI) indigenous people’s organization and SERNAP, the Bolivian national park service. These two agencies jointly work out management plans and budgets, and select the Director. Interestingly, CABI has provided the management with much needed stability and institutional memory, since its leaders live in the area, whereas the government agency has changed heads several times over. (Castillo and Noss 2006)Two marine PAs in Indonesia (Bunaken), and in the Philippines (Apo Islands), are managed through •collaborative arrangements with local communities. In both, people have benefited substantially in terms of poverty reduction, through improved fish catches, more jobs, greater empowerment, and benefits to health. Women too have visibly benefited. Amongst the key ingredients resulting in their success are co-management institutions involving local community representatives, participation of entire communities in management, legal backing to participation, and understanding and respecting customary use and access rights (Leisher et al 2007).The French have experimented with collaborative management of their “regional nature parks” for over •three decades. 44 such parks have been created, ranging in size from 25,000 ha to 300,000 ha. Each park is managed by an organization of elected people of the local communities, who then bring on board other stakeholders, and oversee a multi-disciplinary technical team that runs the park. The broad aims are to protect natural and cultural heritage including biodiversity, and to promote environmentally sound economic and social development. (Federation des Parcs Naturels Regionaux 2006).Thirteen national parks (over 18,000 sq km area) in Canada are managed by cooperative management •boards, a collaborative arrangement between Parks Canada and the native groups on whose territories these are located.. While these areas are ‘set aside” for the benefit of all Canadians, local native populations are the ones who have prior rights to continue traditional activities or start new ones that are in conso-
59
Diversifying Protected Area Governance: Ecological, Social, and Economic Benefits
nance with stated conservation objectives. Additional economic benefits are generated from ecotourism and other activities (Johnston 2006).One of the world’s first recent ‘restitution’ of lands within a protected area, back to the indigenous or local •community that was forcibly evicted from such an area, took place in Makuleke, South Africa. Under the Restitution of Land Rights Act 1994, a stretch of 20,000 ha. of the world-famous Kruger National Park was transferred back to the Makuleke people in 1999. Considerable controversy had erupted then, with many conservationists predicting that this was the end of Kruger. However, an agreement was forged between the tribe and the South African National Parks (SANParks), to collaboratively manage the area as a wildlife reserve, for 25 years. Since then, many Makuleke youth have been trained as rangers, and the communities are benefited from tourism generated revenue (Fabricius 2006).The Lanin National Park was created in Argentina in 1937, with the same conventional exclusion of •local communities seen in PAs across the world. After considerable agitation by the Neugueri Mapuche Confederation (association of the Mapuche indigenous people), in 2000 attempts were made to arrive at a settlement. A co-management committee was formed, with the clear understanding that community rights to traditional lands would be recognized, formal and informal structures of community involve-ment would be worked out, all benefits of the park would be shared, and both biological and cultural diversity would be protected. The arrangement has resolved the persistent tension between government and local people, and made the park’s management more effective. (Carpinetti and Oviedo 2006).
Examples from several other countries can be given. Cases of national parks managed by government agencies in collaboration with local private landowners in the United Kingdom, and of PAs with indigenous peoples’ involvement in Australia, are well known. The trend is slowly but surely increasing as countries begin to get serious about implementing the CBD Programme of Work on Protected Areas.
8.3 CoMMUNITY CoNSerVed AreAS (CCAs)
Even more exciting and revolutionary than co-management, is the recognition finally given to the world’s old-est PAs - community conserved areas (CCAs). These have been defined as “natural and modified ecosystems, containing significant biodiversity values, ecological services, and cultural values, voluntarily conserved by indigenous and local communities, through customary laws or other effective means” (Pathak et al 2004). They include an extremely diverse set of sites and initiatives including sacred sites, mobile and indigenous peoples’ landscapes, marine fish reserves, waterfowl and sea turtle nesting sites, resource reserves, urban and semi-urban forests, and others (Kothari 2006b; PARKS 16(1). Put together, they may well equal the area of current government designated PAs of the world (Kothari 2006c). To give a few examples:
Community forests in many European countries and in the parts of the USA, owned or managed by •towns, perform a mix of critical functions: ecosystem benefits and services, recreation and wildlife refuge, timber and fuel supply, and others. In New Hampshire, USA, a number of towns have been managing old or recently acquired tracts of forests: Conway (650 ha), Gorham (2000 ha), Randolph (4100), and Errol (2100). Some of these forests provide critical connectivity between national forest or wildlife reserves. (Lyman 2006). In Italy, the Regole d’Ampezzo of the Ampezzo Valley, has a recorded history of community management for approximately 1,000 years, and contains the officially designated Parco Naturale delle Dolomiti d’Ampezzo. Another example is the Magnifica Comunità di Fiemme, collectively owned and managed by people of 11 townships in the Trentino-Alto Adige Region. (Merlo et al. 1989, Jeanrenaud 2001, and Lorenzi, pers. comm. 2004). Community forests in many ‘developing’ countries also provide important conservation and livelihood •functions. In Nigeria, the Ekuri people are protecting 33,600 ha of dense tropical forest on their communal land, probably the largest communally controlled forest in the country. Over the last decade they have resisted the overtures of logging companies despite being offered a road which they desperately need. Instead, they have prepared (with help from outside agencies) a 5-year management plan to enable them to generate sustainable benefits from the forest, while maintaining its wildlife and biodiversity values (Ogar 2006).
Protected Areas in Today’s World: Their Values and Benefits for the Welfare of the Planet
60
In India, the states of Orissa, Uttarakhand, Maharashtra, Nagaland, and others, have over 10,000 com- •munity managed forests, ranging from a few hectares to several hundred thousand hectares in size. Some are managed by all-women forest protection committees, others by youth clubs, yet others by the entire village. Many serve as important corridors or buffers to government designated PAs. (Pathak et al 2006). Indigenous reserves account for a fifth of the Amazon forests, and have proven to be effective against •illegal logging, mining, and other threats that are eating up forests outside these reserves. These include reserves that have been integrated into national PA systems, such as the Alto Fragua - Indiwasi National Park of Colombia. This 68,000 ha Park was established in February 2002 by agreement between the Colombian government and the Association of Indigenous Ingano Councils Tandachiridu Inganokuna. While final decisions on the use of the Park’s resources rest with the Ingano indigenous people, and the management plan is based on their document “Our Thinking - Alpa Ñucanchipataita Karadu” some elements of co-management have been brought in at their request, e.g. technical inputs, and facilitation to be in harmony with national legislation on parks (Oviedo 2006). Many indigenous reserves are also outside the system but performing equally important conservation functions. Many are not necessarily set up with conservation in mind, but are protecting key biodiversity tracts. For instance, within the Peruvian Amazon, over 11 indigenous groups are living a hunting and gathering nomadic existence. In an attempt to protect these groups, the national level Peruvian indigenous organization (AIDESEP) has secured the establishment of over two million hectares of tropical humid forests in territorial reserves specifically aimed at respecting the decision of these groups to live in voluntary isolation, and securing their future land titling rights. These areas also harbour significant biodiversity that is part of globally recognised hotspots. There is now an attempt to provide legal backing to the reserves, especially to ward off significant threats from logging, and prospecting for gas and petrol. (Norgrove, pers. comm., 2005). Community managed marine reserves are being ‘discovered’, or created anew, in many regions of the •world. Possibly the largest network of these consists of Locally Managed Marine Areas (LMMAs) in the South Pacific (Govan et al 2006). A recent publication from the Philippines lists community managed fishery reserves (Lavides et al 2006). The Coron Island in the Philippines has been the scene of intense struggle by local indigenous people to protect their territory against destructive commercial fishery interests by demand and obtaining a “ancestral domain” status. Through this they have secured their own sustainable fishery livelihoods, while protecting critically important coastal and marine ecosystems. (Ferrari and de Vera 2004). The Navakavu marine PA in Fiji, and the Arnavon Island marine PA in Solomon Islands, both community managed, have been found to have generated substantial economic livelihoods and benefits for local people, while maintaining conservation status. (Leisher et al 2007). Territories of mobile peoples often contain significant biodiversity values, conserved due to traditional •practices of nomadism and deliberate restraint. In the case of the Borana ethnic territory in Ethiopia, customary law (seera marraa bisanii, or ‘the law of grass and water’) ensured sustainable use of scarce resources, and helped protect ecosystems harbouring the unique wildlife of the region (including 43 species of mammals), for centuries. Over the last couple of decades, however, government policy and globalisation has threatened these practices, with large parts of the territory being opened up for agricul-ture, resettlement of people from outside, and other pressures. (Bassi 2006). In the territory of the Gabbra mobile people in Kenya, there are over 100 sacred sites that harbour significant biodiversity. (Ganya 2006). In the vast high altitude arid ecosystem of Changthang in Ladakh, part of the trans-Himalayan belt in India, nomadic Changpas have sustained their pastoralist lifestyles for centuries, co-existing with a large number of wild species adapted to these harsh conditions including the Snow leopard. Recent disruptions caused by occupation by armed forces (partly due to Indo-Chinese border tensions) and Tibetan refugees who don’t follow the traditional practices of rotational grazing, have threatened this co-existence between people and wildlife. Breeding and nesting sites of many species are under community protection in many countries. In India, •for instance, there are dozens of CCAs harbouring resident and wintering waterfowl, antelope and deer species, nesting Olive ridley sea turtles, freshwater fish populations, threatened pheasant species, and more. Most are without specific protection or support from conservation laws or agencies. (Pathak et
61
Diversifying Protected Area Governance: Ecological, Social, and Economic Benefits
al 2006). The Comarca Ngöbe – Buglé indigenous territory in Panama contains one of the world’s most important nesting sites for threatened Hawksbill and Leatherback sea turtles; civil society groups have been urging that this be recognised as part of the PA network and therefore given special protection against external threats. (Solis 2006). Australia has a network of Indigenous Protected Areas, integrated into the national PA system. The first •was formally proclaimed in August 1998, over an Aboriginal-owned property called Nantawarrina in the northern Flinders Ranges of South Australia. There are now about 20 declared IPAs, comprising about 20% of the total terrestrial protected area estate in Australia. Indigenous people use a variety of legal mechanisms to control activities, including local government by-laws, privacy laws and traditional Indigenous laws. IPAs are attractive to some Indigenous groups because they bring management resources without the loss of autonomy usually associated with collaboratively managed PAs; they also provide public recognition of the natural and cultural values of indigenous territories, and of the capacity of in-digenous peoples to protect and nurture those values. For the government, they make sense because they effectively add to the nation’s conservation estate without the need to acquire the land, and without the cost of establishing all the infrastructure, staffing, housing and so on of a national park. (Smyth 2006).
Growing literature points to the existence of tens of thousands of other such CCAs, most of them hidden from the public eye till recently because of our pre-occupation with government designated PAs.
8.4 Good GoVerNANCe
Many of the above examples display, in varying degrees, several principles of ‘good governance’, albeit in varying degrees (adapted from Borrini-Feyerabend et al 2006):
Participation • : people with a direct ‘stake’ in conservation are able to take part in decision-making relating to it.Subsidiarity • : decisions are taken by, or with, those closest to the resources sought to be conserved.Equity • : there is fairness in the distribution of decision-making powers, benefits, and other aspects of the process. Strategic direction • : there is an overall long-term vision encompassing ecological and social dimensions, driving the process. Embracing complexity • : the process integrates a nuanced understanding of the social, cultural, economic, and historical complexities of the situation, rather than try to gloss over them. Responsiveness • : there is an attempt to make the process serve and respond to all relevant stakeholders (and rightsholders). Effectiveness and efficiency • : the objectives are adequately met with an optimal use of resources. Accountability • : decision-makers and implementers are accountable to all those with a stake in the process, which also includes mechanisms of redressal.Transparency • : all relevant information, including decision-making processes, are available to the public with reasonable ease.
Governments who are embarking on diversifying their PA governance systems, or strengthening existing initiatives, would do well to assess performance according to some or all of the above parameters.
8.5 SYSTeM BeNeFITS oF dIVerSIFICATIoN
Apart from the benefits derived at each individual CMPA or CCA site, the diversification of PA governance results in significant benefits for the PA system as a whole. These include:
Greater coverage of areas important for wildlife and biodiversity: CMPAs and CCAs are often politi-1. cally more acceptable than conventional PAs, especially in ‘developing’ countries where the legitimacy of “setting aside” areas for nature conservation is always being challenged as unacceptable in the face of human needs. This means that countries can expand their PA coverage substantially through the use of
Protected Areas in Today’s World: Their Values and Benefits for the Welfare of the Planet
62
these governance types (as for instance Madagascar is doing, see below). Indeed if CCAs were to be given the recognitionas PAs and support they deserve, the PA coverage of the world could be doubled! Greater ability to build actual 2. networks of PAs: Combining different governance types would help to physically connect sites, allowing much greater gene flow and other benefits of connectedness. Many CCAs, for instance, are already corridors between two or more government PAs (e.g. the community forests in New Hampshire, USA; or Van Panchayat forests in Uttarakhand, India); many others could become so with some level of inputs and intervention. Seen another way, especially from the point of view of communities, many PAs could be corridors between two or more CCAs, providing crucial buffer functions and benefits to people. A whole range of ecosystems, from completely ‘untouched’ to substantially human-modified but still harbouring important wildlife and biodiversity values, could be brought into the PA system. Greater generation of resources: If CMPAs and CCAs can increasingly be projected as not only conserva-3. tion tools but also mechanisms to address poverty and lack of livelihood opportunities, this could help countries generate more resources for conservation. Most countries and donors have much more funding for ‘development’ and ‘welfare’ sectors than for conservation per se; therefore an approach that combines the ecological and human dimensions of a landscape, stands a better chance of generating resources, not only for itself but for the conservation system as a whole.
It is for these and other reasons that some countries have significantly expanded their PA governance types, along with diversifying the management objective categories (as per the IUCN PA classification system). For instance, Colombia, which started in the late 1960s with the typical government-managed PAs, has in the 1990s and 2000s added several other governance types (adapted from Alcorn et al 2005, in Borrini-Feyerabend 2006). In 1998, the National Parks System (SPNN) implemented a Policy for Social Participation in Conservation, and moved towards much greater participation of indigenous peoples, peasant communities, and others. It also encouraged the creation and incorporation of a complex set of regional and local reserves, collaboratively managed PAs, indigenous territories, private protected areas, and community conserved areas. More recently, after the World Parks Congress, the Madagascar government too has moved into diversify-ing PA governance types, as part of its commitment to triple the area under PAs (www.iucn.org/en/news/archive/2005/06/governancethur16.pdf). India in 2002 extended its PA types to include those that could be managed in a collaborative manner with various government departments and local communities, and those to be managed by local communities themselves, though the conceptualization of these categories severely limits their use (Pathak and Bhushan 2004).
8.6 IMPLeMeNTATIoN oF THe CBd Pow oN PAS
Despite clear evidence of the benefits of diversifying PA governance models, implementation of Element 2 of the CBD Programme of Work on PAs remains uneven. Most countries from where information is available (in their national reports, their responses to the Secretariat’s questions on implementation of the POW on PAs, and citizens’ reports), are way behind in meeting their targets.
There appears to be no comprehensive assessment of how many countries provide for CMPAs or CCAs in their conservation legislations.
A survey of 16 countries by the IUCN WCPA-CEESP Strategic Direction on Governance, Equity, Livelihoods and Communities (TILCEPA), has brought out the mixed status of implementation of the Programme of Work in relation to CCAs. Of these 16, six (Australia, Brazil, Guyana, India, South Africa, and Vanuatu) had brought in legislation recognizing CCAs as part of the PA network (with great variation in what kind of sites could be considered eligible). Another six (Canada, Costa Rica, Indonesia, Mauritania, Tanzania, and Taiwan) did give legal backing to CCAs, but as part of more general laws providing recognition of indigenous or com-munity territories and rights, rather than as PAs or specific conservation mechanisms. Four countries (China, Morocco, Nepal, and Nigeria) had no legal backing for CCAs whatsoever, though a few of them reported
63
Diversifying Protected Area Governance: Ecological, Social, and Economic Benefits
some level of administrative or financial support to CCAs, and one (Nepal) had moved towards almost full community management of at least one PA. (For full details of these 16 country surveys, pl. see http://www.iucn.org/themes/ceesp/CCAlegislations.htm).
A more detailed assessment of South Asia revealed the following picture: Bangladesh has just begun experimenting with some form of collaborative management in forested PAs, •and recognition of a few community managed wetlands, but both have a tenuous position in the law. Bhutan has no legal mechanisms for CMPAs or CCAs, though some integrated conservation and develop- •ment projects are being carried out.India has scope for both CMPAs and CCAs in its wildlife legislation, but the former are not applicable •to existing national parks and sanctuaries (which comprise most of India’s PAs at the moment), and the latter will be highly restrictive as it is supposed to be only on ‘private’ and ‘community’ lands whereas most CCAs are on government lands. Other more recent legislation (on biodiversity, and on forest dwellers’ rights) may lead to more community participation in PAs, and provide backing to CCAs, though not as part of the PA network. Nepal is probably the most advanced in South Asia in relation to CMPAs, with particular focus on •conservation areas in the mountains. This includes one of the largest PAs being run by a NGO and local communities. In 2006 a government managed PA has been handed over to communities to manage, but there is otherwise no legislation to provide PA status to CCAs. Pakistan has tried some innovative collaborative management arrangements in some of its mountain •PAs. There are also hunting reserves in which local communities get the benefits of hunting fees charged to outsiders. There is no legislation to back CCAs as part of the PA system. Sri Lanka has no legally backed CMPAs, though some benefit-sharing arrangements have been initiated. •A few coastal areas under community management have been provided legal backing, but these are not in the PA network.
The picture emerging in South Asia is probably representative of many or most regions of the world. If this is true, most countries are clearly some distance from achieving the targets they have agreed to under the CBD Programme of Work.
In its latest “Review of Implementation of the Programme of Work on Protected Areas for the Period 2004 - 2007” (UNEP/CBD/WG-PA/2/2, 26 November 2007), it is concluded that:
“Though legislative and policy frameworks exist for equitable sharing of costs and benefits and participation of indigenous and local communities, more efforts are needed to implement them to ensure meaningful participation of local communities in the establishment and management of protected areas, and in the integration of various governance types into national systems of protected areas.”
One of the suggested recommendations therefore is:
“Improve and diversify protected area governance by recognizing, where appropriate, community-based or-ganizations as co-managers, incorporating community-conserved areas into the national system of protected areas; and recognizing and integrating local community knowledge into protected area decision- making;”
8.7 NeXT STePS
In many countries, protected areas are still viewed with suspicion and hostility by local communities who continue to be at the losing end of the conservation stick. In a large number of sites, possibly still the majority in ‘developing’ countries, PAs have not yet translated into tangible and clear benefits to such communities, at least not sufficiently adequate to compensate for the losses they incur. This makes it all the more important that all countries urgently start diversifying into participatory, collaborative, and community based gover-
Protected Areas in Today’s World: Their Values and Benefits for the Welfare of the Planet
64
nance of PAs. The above examples provide ample proof of the ecological, economic, and social benefits of such diversification.
For countries to initiate participatory governance where they have not, for the ongoing initiatives to be further consolidated, and through all this for countries to be able to implement the CBD Programme of Work, a number of steps are required. These include:
Documentation of best and worst practices • : studies and documentation of the successes and failures of diverse governance regimes for PAs are increasing, but are still very inadequate. More in-depth assess-ments are needed on the various ecological, social, economic, and political benefits (and costs) of such regimes, to get a picture of how they relate to different conditions and what are the key factors in making them work or fail. Particularly inadequate is process documentation, detailing how a particular initiative worked, what hurdles it faced, what opportunities it made use of, and so on. And documentation on CCAs remains very poor for most countries, since the formal conservation community has only recently recognized their presence and value. Learning across countries and regions • : some countries and regions are much further advanced than others in diversifying their governance regimes, and it would be of immense use to others if their experience could be shared. This could be passive through the availability of documentation (especially, as mentioned above, process documentation), but also more actively in the form of exchange visits, joint learning workshops, and others. This cross-country learning needs to be promoted by countries and donors with resources. Using and building on existing guidance • : Some generalized guidelines that can help countries who are starting off on collaborative management or community based conservation, are available. For instance, the series of Best Practice Guidelines of the IUCN World Commission on Protected Areas includes one on Indigenous and Local Communities and Protected Areas, with detailed guidance on CMPAs and CCAs (Borrini-Feyerabend et al 2004). This and others can be built on to make them more region- and country-specific, using local languages. Advocacy for policy and legal changes • : As described above, the greatest challenge to the diversification of PA governance regimes, is the absence of policy and legal mechanisms. Most countries are still very far from achieving the kinds of changes that the CBD Programme of Work requires of them. Such changes will require a mix of advocacy by indigenous peoples and local community organizations and other civil society groups, peer pressure at forums like the CBD Ad Hoc Working Group on PAs and its Conference of the Parties, and easily accessible assistance for building capacity. At the recent 2nd ASEAN Heritage Parks Conference and 4th Regional Conference on Protected Areas in S-E Asia (22-26 April 2007), for instance, deliberations amongst various stakeholders and rightsholders, resulted in a rough workplan for countries to move towards meeting their obligations regarding participatory governance under the CBD Programme of Work. Challenging ‘development’ that threatens nature and people: • Many sites of wildlife significance around the world, are threatened by inappropriate ‘development’ projects (including mining and other extractive industries, logging, chemical industries, tourism resorts, highways, and the like). This applies to many existing government notified protected areas, where industrial and commercial interests are often able to run roughshod over conservation laws or where countries themselves are willing to sacrifice nature. And it applies even more so to community conserved areas, since most of these have no public recognition, and destructive forces are able to enter with no-one other than the local community noticing, no media coverage, no attempt by government agencies to stop them. In many places where collaborative manage-ment has been attempted, or where CCAs have been recognized, such threats have been possible to tackle. National and international conservation agencies, government agencies in charge of conservation, and networks of indigenous peoples and local communities need to enhance such collaboration to ward off the increasing threats from industrial and commercial forces.
Diversifying the governance of protected areas, into collaborative and community based regimes, will be a significant step towards achieving the 2010 biodiversity target goal of halting biodiversity loss But such diver-
65
Diversifying Protected Area Governance: Ecological, Social, and Economic Benefits
sification itself requires much more effort on part of governments, international agencies, indigenous peoples and local communities, other civil society organizations, donors, scientific groups, and others. Hopefully the initiatives and examples, given above, will show the path.
References
Alcorn, J.B. 2005. Dances around the fire: conservation organizations and community-based resource man-agement, in Representing communities: histories and politics of community-based resource management, Brosius, J.P., Zerner, C., Tsing A., (eds). Altamira Press, Walnut Creek.
Bassi, M. 2006. Community-conserved landscape of the Oroma-Borana, Ethiopia. Case study 21.11 in Kothari 2006b.
Borrini-Feyerabend, G., Johnston, J., and Pansky, D. 2006. Governance of protected areas. In Lockwood et al 2006.
Borrini-Feyerabend, G., Kothari, A., Oviedo, G. 2004. Indigenous and local communities and protected areas. Towards equity and enhanced conservation.
Best Practice Protected Area Guidelines Series No 11. IUCN WCPA, Gland & Cambridge.Carpinetti, B. and Oviedo, G. 2006. Mapuche indigenous people in the Lanin National Park, Argentina. Case
study 20.10 in Kothari 2006a. Castillo, O. and Noss, A. 2006. Kaa-Iya del Gran Chaco National Park, Bolivia. Case study 20.7 in
Kothari 2006a. Chape, S., Spalding, M.D, and Jenkins, M.D. (eds.). 2008. The World’s Protected Areas: Status, Values, and Prospects in the Twenty-first Century. University of California Press, Berkeley.
Chatty, D. and Colchester, M. (eds). 2002. Conservation and Mobile Indigenous Peoples: Displacement, Forced Settlement, and Sustainable Development. Berghahn Books, New York.
Colchester, M. 2004. Conservation policy and indigenous peoples. Environment Science and Policy, 7: 145-153.
Fabricius, C. 2006. The Makuleke story, South Africa. Case study 20.8 in Kothari 2006a. Federation des Parcs Naturels Regionaux. 2006. French regional nature parks. Case study 20.1 in Kothari
2006a. Ferrari, M.F. and de Vera, D. 2004. A Choice for Indigenous Communities in the Philippines. Human Rights Dialogue 2.11 (Spring 2004): Environmental Rights.
Ganya, C. 2006. Forole Sacred Mountain and the Gabbra mobile pastoralists, Kenya. Case study 21.2 in Kothari 2006b.
Govan, H., Tawake, A. and Tabunakawai, K. 2006. Community-based marine resource management in the South Pacific. PARKS 16(1) Community Conserved Areas: 63-67. IUCN, Gland.
Jeanreanaud, S. 2001. Communities and forest management in Western Europe. A regional profile of the working group on community involvement in forest management. IUCN, Gland & Cambridge.
Johnston, J. 2006. Cooperative management with Aboriginal people in Canada’s national parks. Case study 20.4 in Kothari 2006a.
Kothari, A. 2006a. Collaboratively managed protected areas. In Lockwood et al 2006. Kothari, A. 2006b. Community conserved areas. In Lockwood et al 2006. Kothari, A. 2006c. Community conserved areas: towards ecological and livelihood security. PARKS 16(1)
Community Conserved Areas: 3-13. IUCN, Gland. www.iucn.org/themes/wcpa/pubs/pdfs/PARKS/parks_16_1_forweb.pdf
Lavides, M.N., Pajaro, M.G., and Nozawa, C.M.C. 2006. Atlas of Community-Based Marine Protected Areas in the Philippines. Haribon Foundation for the Conservation of Natural Resources, Inc. and Panama Ka Sa Pilipinas, The Philippines.
Leisher, C., van Beukering, P. and Scherl, L.M. 2007. Nature’s Investment Bank: How Marine Protected Areas Contribute to Poverty Reduction. The Nature Conservancy, Arlington, USA.
Lockwood, I., Worboys, G. and Kothari, A. (eds.). 2006. Managing Protected Areas: A Global Guide. IUCN, Gland and Earthscan, London.
Lorenzi, S. 2004. Personal communication with S. Lorenzi, Secretary of the Regole of Cortina d’Ampezzo.
Protected Areas in Today’s World: Their Values and Benefits for the Welfare of the Planet
66
Lyman, M.W. 2006. Community forests in the US: good neighbours of protected areas. Case study 21.2 in Kothari 2006b.
Merlo, M., Morandini, R., Gabbrielli, A., Novaco, I. 1989. Collective forest land tenure and rural development in Italy: selected case studies. FO:MISC/10, FAO, Rome.
Ogar, E. 2006. Ekuri community requests for a community conserved area, Nigeria. Case study 21.3 in Kothari 2006b.
Oviedo, G. 2006. Alto Fragua-Indiwasi National Park, Colombia. Case study 21.8 in Kothari 2006b. Norgrove, L. 2005. Personal communication with Linda Norgrove, WWF Peru. Pathak, N., Balasinorwala, T., Kothari, A. and Bushley, B. 2006. People in Conservation: Community Conserved
Areas in India. Kalpavriksh, Delhi/Pune. www.iucn.org/themes/ceesp/Wkg_grp/TILCEPA/CCA%20India%20brochure%20(2).pdf
Pathak, N., Bhatt, S., Balasinorwala, T., Kothari, A., Borrini-Feyerabend, G. 2004. Community conserved areas: a bold frontier for conservation. TILCEPA/IUCN, CENESTA, CMWG & WAMIP, Tehran. www.iucn.org/themes/ceesp/Wkg_grp/TILCEPA/CCA%20Briefing%20Note.pdf
Pathak, N. and Bhushan, S. 2004. Community reserves and conservation reserves: more reserve and less community! Hindu Survey of Environment 2004. Chennai, India.
Policy Matters 15: Conservation and Human Rights. Magazine of the IUCN Commission on Environmental, Economic, and Social Policy. July 2007. http://www.iucn.org/themes/ceesp/Publications/Publications.htm
Smyth, D. 2006. Indigenous protected areas, Australia. Case study 21.7 in Kothari 2006b. Solis Rivera, V. 2006. Comarca Ngobe-Bugle, Panama. Case study 21.10 in Kothari 2006b.
West, P., Igoe, J., and Brockington, D. 2006. Parks and peoples: the social impact of protected areas. Annu. Rev. Anthropol. 35:251-77.
67
Protected Areas and Human Well-being: Experiences from Indonesia, Mexico, Peru and Venezuela
ProteCted AreAs And HumAn Well-being: exPerienCes 9. from indonesiA, mexiCo, Peru And VenezuelA
Luis Pabon-Zamora1, Akhmad Fauzi1, Abdul Halim1, Juan Bezaury-Creel1, Eduardo Vega-Lopez1, Fernando Leon2, Lila Gil1, Vanessa Cartaya1
1The Nature Conservancy, 2El Instituto Nacional de Recursos Naturales (INRENA)
9.1 introduction
Time is growing short. The 2005 Millennium Ecosystem Assessment (MA) reveals that all of Earth’s ecosys-tems have now been dramat ically transformed through human actions. Ecosystem changes have provided substantial short-term benefits for humans, but these gains have resulted in the wide-scale loss, degradation and unsustainable use of natural ecosystems. The MA concluded that approximately 60% of the ecosystem services worldwide are being degraded or used unsustainably. The most rapid changes in ecosystems are now taking place in developing countries, where most of the world’s biodiversity exists. With the loss and degradation of ecosystem worldwide has come a biodiversity crisis — caused primarily by such factors as land use change, climate change, invasive species, overexploitation, and pollution. Over the past several hundred years, humans have increased the natural species extinction rate by as much as three orders of magnitude. Extinction rates are about 100 times greater today than they were 100 years ago.
Such disturbing trends compel the conservation community to start employing new approaches and strategies that can raise the biodiversity issue up the political agenda and lead to transformative action by decision-makers. By advocating the contributions of protected areas to human well-being, we might tangibly influence political will and financial investments in conservation.
Why should this approach focus on protected areas? For one, there is a strong biodiversity justification. Protected areas are widely recognized as the cornerstone of biodiversity conservation. A study on the effectiveness of parks in protecting tropical biodiversity (Brunner, 2001) demonstrates that 97% of parks assessed are in far better condition than neighboring land with respect to clearing. Around 85% of the parks studied had suffered no net clearing since their creation. More than 80% of the parks are also far better off than their surroundings in terms of illegal logging and burning. Some 60% of the parks suffered less from hunting and grazing than land outside park boundaries.
A second reason to focus on protected areas is based on recent political commitments made at the international level. Under the Convention on Biological Diversity’s (CBD) Program of Work on Protected Areas1 (PoW), 190 governments have committed to achieving effective protected area systems in their countries by 2012. More specifically, governments have agreed to assess, on an urgent basis, the economic and socio-cultural costs, benefits and impacts arising from the establishment and maintenance of protected areas (particularly for indigenous and local communities), and to adjust policies as needed. In the PoW, governments also agreed that social and economic benefits generated by protected areas should be oriented for poverty reduction, consistent with protected-area management objectives.
This need for demonstrating the benefits provided by protected areas is manifested in many ways, but particu-larly through the under-investment by governments that clearly show the low importance that conservation has in development agendas. Over 100,000 protected areas have been established worldwide, covering about 11% of the earth’s land surface and 0.5% of marine areas. Of these, only around 25% - 30% are under active management. Despite the rapid increase in numbers of protected areas, current annual funding is estimated to be between USD 350 million and USD 420 million, down from USD 700–770 million in the early 1990s (Chape, 2005). Just to cover core operations (e.g., staff salaries, vehicles) of existing protected areas in develop-
1 CBD - COP 7 PoW Activities 2.1.1 and 3.1.1
Protected Areas in Today’s World: Their Values and Benefits for the Welfare of the Planet
68
ing countries, between USD 1.1 and USD 2.5 billion of additional investment annually is needed.2 A modest projection shows that effective management of an expanded protected areas system in developing countries may require USD 12-13 billion per year over the next decade3.
Overseas Development Aid (ODA) for biodiversity between 1998 and 2000 from countries in the Organization for Economic Co-operation and Development (OECD4) reached an annual average of USD 1 billion5. In Latin America and the Caribbean6 (LAC), between 1990 and 1997, around USD 3.26 billion dollars from 65 sources funded 3,489 conservation projects. To put this figure into perspective, the LAC Gross Domestic Product (GDP) for those same years summed USD 12.3 trillion7; therefore, conservation projects only represented 0.026% of the total regional GDP.
Even the highest income countries in LAC have dedicated miniscule investments to conservation. For example, environmental spending8 in Brazil in 2000 represented 0.34% of the GDP and 1.5% of the total expenditure. In Colombia in 2000, public spending on the environment was in the range of 0.13% of the GDP. Mexico dedicated around 1.51% of national expenditures to the environment, comprising 0.26% of the GDP for the year 2000. In 2000, Costa Rica allocated 4.5% of the government spending to environment, representing 0.64% of the GDP.
In recent years, a number of institutions have undertaken studies and projects around the valuation of eco-system services, with some work specifically targeting values and benefits of protected areas. We think that in order to support countries and advance on the recommendations of the last two meetings of CBD (COP 7 and COP 8), it would be crucial to share those experiences and discuss the results of such assessments.
Since 2004, The Nature Conservancy (TNC) has put in place an organization-wide Global Protected Areas Strategy (GPAS), focused around helping national governments and partners achieve the ambitious commit-ments in the PoW. TNC’s three regions outside the U.S. (Meso America, South America and Asia Pacific) have all identified mobilizing political will and public funding as central to their protected areas strategy. Consequently, TNC, under the campaign of “making the case for protected areas ,” is supporting the activi-ties suggested by the CBD PoW related to implementing assessments of protected areas benefits to human well being. The intent is to provide data and information essential to mobilizing the political will and broad stakeholder support needed to achieve effective protected area systems in every country and region, and at the same time to ensure that protected area systems benefit people in different ways. Below, we present pre-liminary results of studies that are currently underway in some of the LAC countries, specifically Indonesia, Mexico, Peru and Venezuela.
This paper was written with the help of TNC staff and consultants working on the country assessments. We present examples of tourism and fisheries benefits and costs for human well-being derived from marine protected areas in Indonesia (Fauzi and Halim); carbon storage functions and tourism in Mexico (Bezaury and Vega); examples of benefits of protected areas to the national economy of Peru (Leon); and finally, we present facts about water, tourism and culture from Venezuela (Gil and Cartaya).
2 Bruner, 2001 — How much will effective protected areas cost?
3 L. Emerton, J. Bishop and L. Thomas. IUCN, 2003
4 Around 30 developed countries are part of the OECD
5 OECD, 2002.
6 Castro and Locker, 2000.
7 Earth Trends database. WRI, 2006.
8 Data based on different studies from the Economic Commission for Latin America and the Caribbean (ECLAC)
69
Protected Areas and Human Well-being: Experiences from Indonesia, Mexico, Peru and Venezuela
9.2 INdoNeSIA
Socio-Economic benefits and costs of Marine Protected Areas to Human Well-Being
Currently, almost 20 million hectares of marine protected areas have been established or proposed in Indonesia that mainly comprise marine national parks, strict nature reserves, eco-tourism areas, and marine tourism areas. Like many other countries, marine protected areas in Indonesia are established by various institutions, such as the department of forestry or fisheries, as well as regional and local governments at Kabupaten (dis-trict) or Kota (city) level.
The effectiveness of the establishment of the protected areas in Indonesia, however, is not yet known, and few assessments have been done to value their socio-economic contribution to human well-being. Nevertheless, some studies on the socio economic impacts of protected areas in Indonesia are available. These studies mostly assess the benefits of protected areas for society in surrounding areas, and range from coral conservation programs to marine national parks, covering areas from west Indonesia to East Nusa Tenggara. Most studies looked at the impact of protected areas on fisheries and tourism. The economic benefits were calculated mainly from income earned by fishermen and tourist operators, as well as from community groups.
In general, there are mixed perceptions of results of studies on the socio-economic benefits derived from protected areas. Using income and fishing productivity as indicators, the studies found that most small-scale protected areas are beneficial for the fishermen, including income generated from tourism activities. However, for larger areas such as Karimun Jawa National Park, studies show that socio-economic benefits are not materialized by the fishermen. These benefits are mostly received by large scale operators, such as travel agents and transport industries.
A study conducted in Lampung province (Putra, 2006) found a positive correlation between coral coverage protection and fishing productivity with a one meter increase in coral coverage increasing fishing productivity by 2.08 kg. With an average fish price of Rp 10 000 per kg (around USD 10.7 dollars)9, this would provide an additional income of Rp 20 000 per square meter per capita per month. In contrast, a study in Karimun Jawa in Central Java marine national park (Maksum, 2006) found no significant impacts of protected area on fishing activities. An interesting case in Komodo National Park (Suprihatin, 2002) shows that in the short term, the protected area generated negative impacts on fishing. The reduction in fish catch occurred due to establishment of zones that limited fishermen from catching fish near the coast.
Using a perception analysis (Hariyadi, 2005), a study for Seribu Islands show that 50 % of fishermen affirmed that that there was no impact on their fish production due to the establishment of the protected area. In terms of income, more than 60% of the respondents claimed that there was no significant increase in their income from the protected area. However, tourism revenue increased significantly. Revenue reportedly received from entry fees amounts to an average of $10 million dollars per year during a 15 year period.
With respect to tourism benefits, an assessment10 of the economic impact of the proposed marine protected area in Lembeh Strait, North Sulawesi, indicates that there is a significant benefit from tourism derived from several economic activities, such as charter boats, sea taxis, diving fees, and accommodations such as resorts. The study mentions that diving activities alone in Lembeh strait could generate an income ranging from USD 1.5 million per year to USD 2.3 million per year. The area also generates secondary employment from charter boats. The estimate of the benefits ranges from USD 35 thousand to USD 70 thousand per year.
At Weh Island, Sabang, Aceh, a study11 found that the park contributed more than 60 % of the regional gross domestic product. The revenue generated from entrance fees was around Rp 21.6 million (around $230 thou-
9 1 USD = 9,265.38 IDR
10 Fauzi and Anna (2005), Iqbal (2006) and Sulaksmi (2007)
11 Iqbal (2006)
Protected Areas in Today’s World: Their Values and Benefits for the Welfare of the Planet
70
sand dollars) per year. A survey found that the society is willing to pay an amount of Rp 12612 thousand per household per year to preserve this marine park. Data suggests that people who are actively involved in the tourism industry around the protected area earn a higher income than those who are not involved in it. The average annual household income of those who participated in the tourism industry is around Rp 2 million (USD 215.8) per capita per year, while those who are not involved in this sector earn around Rp 1.4 million (USD 150) per capita per year.
In Indonesia, several studies calculated the total economic value of protected areas at a micro scale in specific sites. These mainly concentrated on i) calculating the total economic value of a conservation area, ii) identify-ing the society’s willingness to pay for conservation and iii) how socio-economic benefits were perceived by the fishermen or tourist operators. However, studies that address the comprehensive socio-economic impacts of protected areas are still lacking. Questions remain such as i) the overall impact of protected areas at regional levels; ii) indirect income and employment; and iii) the application of consistent methodological assessments on how benefits and human well-being aremeasured.
9.3 MéXICo
Carbon storage and tourism benefits from protected areas
México’s efforts to conserve biodiversity encompass an overwhelming necessity to provide goods and services to its growing population. Protected areas13 constitute an important part of the Mexican strategy to protect its unique biodiversity. Currently, a greater portion of Mexican federal protected areas surface is conceptualized as multiple use zones (83%, IUCN Category VI), where activities are limited by the thresholds imposed by sustainable use of natural resources. Protected areas are therefore not isolated from the national economy. Rather, they play an important role in enhancing and consolidating the well-being of México’s rural popula-tion, while remaining within the limits necessary to conserve their “natural” condition. A crucial characteristic of Mexican protected areas which demonstrates their role in society is that land tenure within their boundaries is not altered by their establishment. Instead, land use is restricted through presidential decrees, in order to safeguard environmental conditions toward a greater public good.
Mexicans are increasingly recognizing the strategic importance of protected areas, together with the need to develop social programs within them to achieve sustainable development. Thus, the budget assigned to federal protected areas by the government has increased significantly over the last 15 years (Graph 1).
Documenting the value of goods and services that protected areas provide to society is a first step towards creating the social and political will needed to develop a strong state policy stance towards their long term consolidation as key pieces of a nation’s sustainability. Recently, The Nature Conservancy initiated a pro-cess for documenting goods and services provided by Mexico’s protected areas that include mainly: carbon sequestration, water provision services, watershed protection, disaster mitigation, tourism, and fisheries. Advances on the role that protected areas can play as carbon sinks and in supporting income from tourism are presented in this paper.
In order to estimate the role that Mexican protected areas play in mitigating global climate change, the ongo-ing TNC study used a Geographic Information System (GIS) which superimposed land use14 and protected areas (CONANP s/f, Bezaury et a,, 2007) to calculate the extent of primary and secondary natural vegetation within them. Data of CO2 absorption capacity of various vegetation types were then incorporated (Masera, 2001 and Ordóñez, 2004), including aerial vegetation, roots, and soil CO2, in order to arrive at a basic estimate of carbon stored within each forest ecosystem. As currently sequestered carbon has no real price under the
12 equivalent to $13.6 dollars
13 Total PA area adds to 23 million hectares, where 19 million are Federal PAs, 3 million are State PAs, 120 thousand are Municipal and 420 are private and social PAs. Terrestrial PAs account for 9.4% of the total territory (Bezaury-Creel et al, 2007).
14 From the Instituto Nacional de Estadística, Geografía e Informática Serie III (INEGI, 2005)
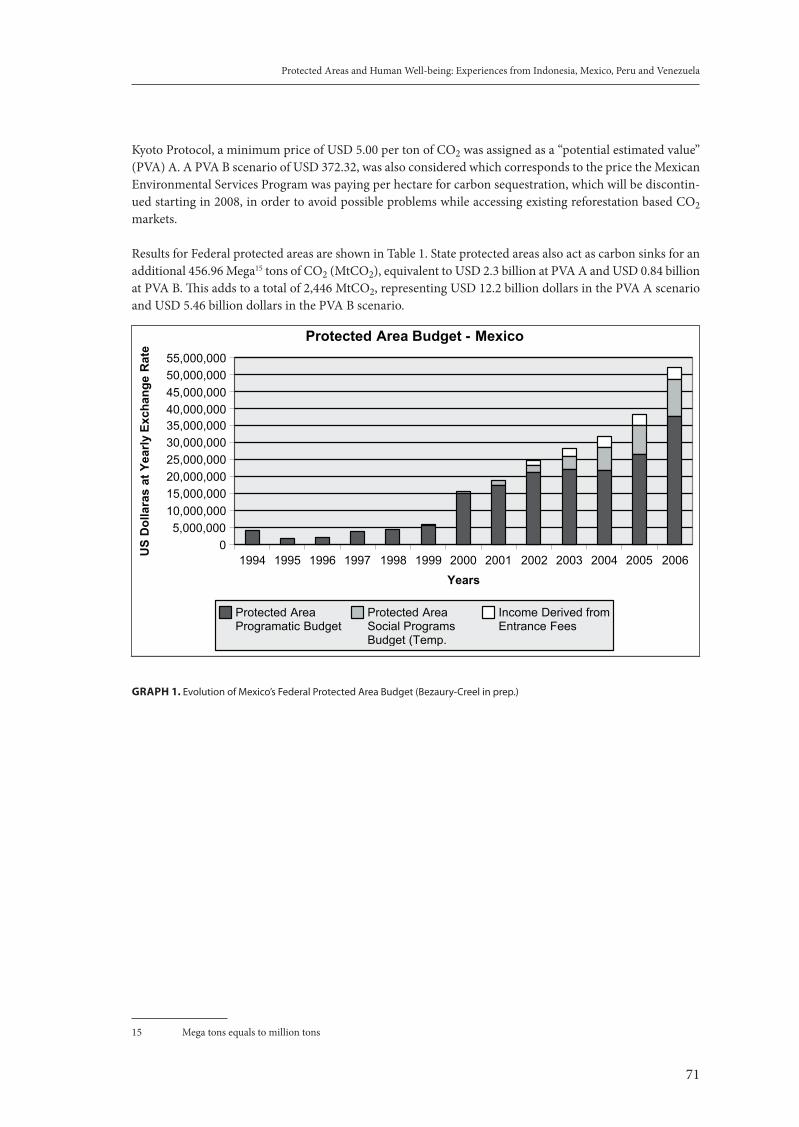
71
Protected Areas and Human Well-being: Experiences from Indonesia, Mexico, Peru and Venezuela
Kyoto Protocol, a minimum price of USD 5.00 per ton of CO2 was assigned as a “potential estimated value” (PVA) A. A PVA B scenario of USD 372.32, was also considered which corresponds to the price the Mexican Environmental Services Program was paying per hectare for carbon sequestration, which will be discontin-ued starting in 2008, in order to avoid possible problems while accessing existing reforestation based CO2 markets.
Results for Federal protected areas are shown in Table 1. State protected areas also act as carbon sinks for an additional 456.96 Mega15 tons of CO2 (MtCO2), equivalent to USD 2.3 billion at PVA A and USD 0.84 billion at PVA B. This adds to a total of 2,446 MtCO2, representing USD 12.2 billion dollars in the PVA A scenario and USD 5.46 billion dollars in the PVA B scenario.
GrAPH 1. Evolution of Mexico’s Federal Protected Area Budget (Bezaury-Creel in prep.)
15 Mega tons equals to million tons
1994 1995 1996 1997 1998 1999 2000 2001 2002 2003 2004 2005 20060
5,000,00010,000,00015,000,00020,000,00025,000,00030,000,00035,000,00040,000,00045,000,00050,000,00055,000,000
Protected Area Budget - Mexico
Protected Area Programatic Budget
Protected Area Social Programs Budget (Temp.
Income Derived from Entrance Fees
Years
US
Dol
lara
s at
Yea
rly E
xcha
nge
Rat
e
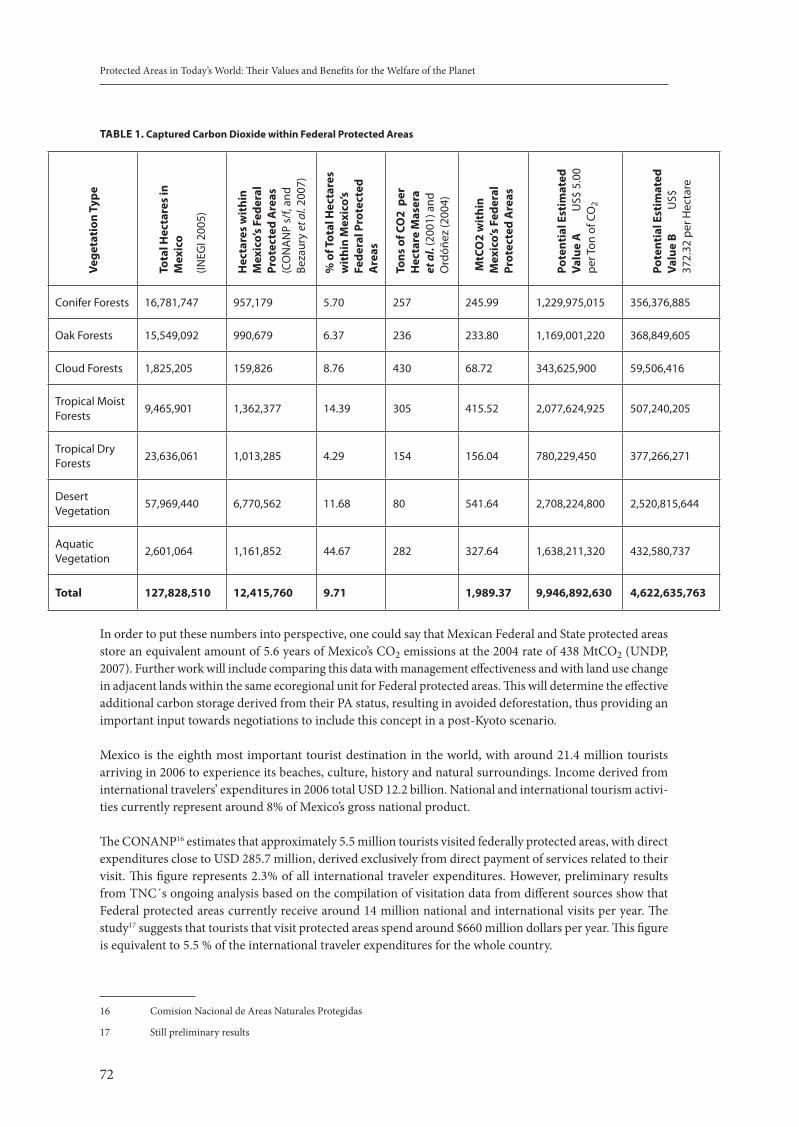
Protected Areas in Today’s World: Their Values and Benefits for the Welfare of the Planet
72
TABLe 1. Captured Carbon dioxide within Federal Protected Areas
Vege
tati
on T
ype
Tota
l Hec
tare
s in
M
exic
o
(INEG
I 200
5)
Hec
tare
s w
ithi
n M
exic
o’s
Fede
ral
Prot
ecte
d A
reas
(C
ON
AN
P s/
f, an
d Be
zaur
y et
al.
2007
)
% o
f Tot
al H
ecta
res
wit
hin
Mex
ico’
s Fe
dera
l Pro
tect
ed
Are
as
Tons
of C
o2
per
H
ecta
re M
aser
a et
al.
(200
1) a
nd
Ord
óñez
(200
4)
MtC
o2
wit
hin
Mex
ico’
s Fe
dera
l Pr
otec
ted
Are
as
Pote
ntia
l est
imat
ed
Valu
e A
US$
5.0
0 pe
r Ton
of C
O2
Pote
ntia
l est
imat
ed
Valu
e B
US$
37
2.32
per
Hec
tare
Conifer Forests 16,781,747 957,179 5.70 257 245.99 1,229,975,015 356,376,885
Oak Forests 15,549,092 990,679 6.37 236 233.80 1,169,001,220 368,849,605
Cloud Forests 1,825,205 159,826 8.76 430 68.72 343,625,900 59,506,416
Tropical Moist Forests
9,465,901 1,362,377 14.39 305 415.52 2,077,624,925 507,240,205
Tropical Dry Forests
23,636,061 1,013,285 4.29 154 156.04 780,229,450 377,266,271
Desert Vegetation
57,969,440 6,770,562 11.68 80 541.64 2,708,224,800 2,520,815,644
Aquatic Vegetation
2,601,064 1,161,852 44.67 282 327.64 1,638,211,320 432,580,737
Total 127,828,510 12,415,760 9.71 1,989.37 9,946,892,630 4,622,635,763
In order to put these numbers into perspective, one could say that Mexican Federal and State protected areas store an equivalent amount of 5.6 years of Mexico’s CO2 emissions at the 2004 rate of 438 MtCO2 (UNDP, 2007). Further work will include comparing this data with management effectiveness and with land use change in adjacent lands within the same ecoregional unit for Federal protected areas. This will determine the effective additional carbon storage derived from their PA status, resulting in avoided deforestation, thus providing an important input towards negotiations to include this concept in a post-Kyoto scenario.
Mexico is the eighth most important tourist destination in the world, with around 21.4 million tourists arriving in 2006 to experience its beaches, culture, history and natural surroundings. Income derived from international travelers’ expenditures in 2006 total USD 12.2 billion. National and international tourism activi-ties currently represent around 8% of Mexico’s gross national product.
The CONANP16 estimates that approximately 5.5 million tourists visited federally protected areas, with direct expenditures close to USD 285.7 million, derived exclusively from direct payment of services related to their visit. This figure represents 2.3% of all international traveler expenditures. However, preliminary results from TNC´s ongoing analysis based on the compilation of visitation data from different sources show that Federal protected areas currently receive around 14 million national and international visits per year. The study17 suggests that tourists that visit protected areas spend around $660 million dollars per year. This figure is equivalent to 5.5 % of the international traveler expenditures for the whole country.
16 Comision Nacional de Areas Naturales Protegidas
17 Still preliminary results
73
Protected Areas and Human Well-being: Experiences from Indonesia, Mexico, Peru and Venezuela
9.4 PerU
The contribution of protected areas to the National Economy
Peru ranks amongst the top ten countries with the richest biodiversity in the world. These high biodiversity values are represented in Peru’s national protected areas system (SINANPE) which covers around 14% of the national territory. Currently, 44 of its 62 protected areas are under management. During the past 20 years, the area under protection increased from 20 protected areas comprising 4.4 million hectares to 62 protected areas covering over 18 million hectares in 2007. However, this high increase in area and in biological representation did not go hand in hand with the increase in human, technological, and financial resources.
One of the main problems faced by the protected areas authority is the reduced amount of funding allocated to their administration. For instance, in 2005, the budget was USD 18 million, while the optimum requirements for proper management was around USD 38 million. It was estimated that the average annual financial gap for the period 2005–2014 was around USD 31.8 million. In order to overcome these funding gaps, the SINANPE has developed a financial plan recommending dissemination of the values of goods and services provided by protected areas This would position the protected area system within Peru’s national agenda, create public awareness, and generate political will and funding. Based on this recommendation, the Protected Areas Agency (at INRENA18) carried out a study at the national level to showcase the different benefits provided by protected areas to the national economy. The study demonstrates that the current and potential benefits of Peru’s protected areas contribute over USD1 billion per year to the national economy. In contrast, the national funds allocated to SINANPE average $ 1.7 million per year. Economic sectors linked to natural resources and to biodiversity account for around 60% of the total employment in Peru (Leon, 2007).
The study found that for every dollar invested in tourism in protected areas, the return was USD146. In 2005, protected areas registered over 350 thousand visits. This activity generated a multiplier effect yielding USD146 million for the national economy and USD 1.7 million for the protected area agency in entrance fees. A projected growth in visits to protected areas, accompanied by an adequate investment in this sector, would provide an additional USD 800 thousand per year.
Around 2.7 million people in Peru use water originating from 16 protected areas (an approximate value of USD 81 million), and 60% of the hydroelectricity produced comes from rivers in protected areas, (an approximate value of USD 320 million). It is estimated that Peru spends around USD 14 million in order to clean sediments from dams. In the last 10 years, Peru has spent close to USD 5 million to avoid the accumulation of sediments in its protected areas. The 16 million hectares of tropical forests in Peruvian protected areas store around 3.9 billion tons of carbon19. An average of 150 thousand hectares is deforested in Peru annually. Nevertheless, around 36 million tons of carbon are not released to the atmosphere every year from avoiding deforestation in protected areas. The value of this service was calculated to be equivalent to be USD 127 million per year at a price of USD 3.5 dollars per ton.
9.5 VeNeZUeLA
Conservation and Human Well-being in Venezuela
Venezuela’s 43 national parks, 36 natural monuments and 7 fauna reserves cover 17.6 million hectares, or around 19% of the territory. Most protected areas in Venezuela, similar to other countries in Latin America, are inhabited by rural communities and indigenous groups. Scholars mention that living standards of people inhabiting protected areas is lower in comparison to the ones living outside,20 mainly because of the limited access to basic services. Alternatively, protected areas provide diverse benefits to human well-being, of which we will analyze water, income from tourism, and intrinsic cultural values.
18 Instituto Nacional de Recursos Naturales
19 Based on UNEP estimations — 243 tons of carbon per hectare in tropical forests
20 Medina, Croes et.al. 2004
Protected Areas in Today’s World: Their Values and Benefits for the Welfare of the Planet
74
One of the most noticeable benefits derived from protected areas is watershed protection. Venezuela has a potential for generating hydroelectricity equivalent to the production of 2.5 million barrels of oil per day21. Venezuela currently produces 3.2 million barrels of oil per day. The Caroni River watershed encloses the highest electricity generation potential, estimated to be 24.9 thousand MWatts. Around 86% of the watershed is comprised by 9 protected areas. Around 1/3 of the water captured by The Guri Dam comes from Parque Nacional Canaima, which increases the lifespan of the dam from 50 to 60 years due to the reduction in sedi-mentation22. Three hydroelectric plants located at the Uriante-Caparo account for 17% of the total potential for generating electricity.
The water generated in 18 national parks serves around 19 million people or 83% of the country’s popula-tion that inhabit large cities. These parks provide around 60% of the potable water. However, this amount could be reduced to 10-30% in the next 20 years due to the current rates of deforestation and erosion. Water from protected areas benefits big cities as well as smaller settlements, such as those receiving water from Parque Nacional Sierra Nevada, located along the Maracaibo Lake. This park is home to some 80 thousand inhabitants.
Similarly, around 20% of the lands under irrigation receive water originating from protected areas. They also contribute to increasing the lifespan of irrigation schemes by 10% to 30% and saving a total of $30 million dollars.
Tourism in Venezuela’s national parks is also an important activity, mostly for local people that live within protected areas. One of the most popular parks visited over the last few years was Parque Nacional Morrocoy, with an annual average of 1.5 million visitors (Cartaya, 2007). Similarly, Sierra Nevada National Park received an average of 300 thousand visitors, Canaima 50 thousand, and Los Roques 60 thousand. Statistics show that the average expenditure for Morrocoy Park in 2001 was around USD135 per visitor. Considering the 1.15 million visitors, the expenditure for that year reached around USD 22.4 million. Protected areas with the most visitors generated between 30% to 50% of the local employment. For example, Morrocoy National Park generated five thousand permanent jobs in areas adjacent to the park (approximately half of the local employment).
Protected areas in Venezuela are also intrinsically related to the cultural heritage and diversity of indigenous groups. For the Ye’kwana and Yanomani, as well as for the Pemon and the Hosti groups, territories within protected areas constitute their livelihood spaces, including: hunting and gathering sites, sacred sites, settle-ments, oral traditions, customary laws and other social manifestations.
9.6 CoNCLUSIoN
Various organizations have undertaken projects to evaluate ecosystem services, including protected area benefits and services. Most of these studies concentrate on the benefits of protected areas at small scale or at specific sites, and only few studies investigating the broader socioeconomic impact of protected areas at national or regional levels.
It is interesting to note from the case studies reviewed that while measuring protected area benefits for small local populations can be achieved with existing methods, it has been difficult to demonstrate the same for larger populations. One of the reasons could be that benefits usually reach specific sectors (e.g. tourism), and not the broader population.
Although tourism can generate tangible benefits, only a small portion of protected areas easily tend them-selves to becoming tourist destinations. This is because of structural factors such as limited infrastructure
21 This is equivalent to $55.7 billion dollars. Which is Venezuela’s one year national budget.
22 World Bank, 2006
75
Protected Areas and Human Well-being: Experiences from Indonesia, Mexico, Peru and Venezuela
availability (hotels, roads), market development, accessibility, security, services, etc. Nevertheless, studies in Indonesia show that even a minor increase in the income of households derived from tourism activities can be very meaningful for poor people.
Studies also show that benefits from protected areas depend very much on their management regimes and zoning. Protected areas with multiple use zones tend to benefit more than others with fewer zones or with highly restricted management regimes. Distribution of benefits improves with wider people’s participation in protected area management.
Although potential sources of income derived from carbon sequestration are encouraging, its future effective-ness will depend on climate change negotiations that include protected areas in REDD23 mechanisms, and on the development of carbon markets which currently are inexistent but with very good prospects for the future.
All the studies show that water presents clear benefits for human livelihoods in different forms: for electricity generation, for consumption and for irrigation. The services provided by protected areas in the conservation of watersheds is very significant and its equivalence in monetary terms is also very high. However, policy makers and protected areas agencies have to date rarely been able to put in place the mechanisms needed to capture even a portion of the value protected areas provide to water utilities and consumers. There are some good examples, however, and we view this as a promising avenue for further development.
Valuing benefits and services of protected areas requires multidisciplinary approaches and involvement of experts in different disciplines, such as hydrologists for estimating the accumulation and costs of removing sedimentation from dams; as well as estimating the capacity of different types of vegetation in retaining sedi-ments along watersheds. Experts in geographic information systems and remote sensing data are also very important for calculating the values of different benefits.
Although the results of these studies are preliminary, they do suggest many potentially fruitful directions by which the benefits that protected areas provide to local and national economies may be better understood and harnessed. For example:
Local economic benefits — the role of management, zoning and governance: encourage analysis for 1. assessing and improving management regimes and zoning that benefit both human wellbeing and conservation; Broader economic benefits — the links to specific economic sectors: invest in improved tools and meth-2. ods for research on the economic and social impacts of protected areas at national and regional levels, especially the identification and valuation of benefits to specific economic sectors which benefit from the ecosystem services provided by protected areas. This requires that we engage other disciplines in socioeconomic valuation. Two especially promising sectors appear to be tourism and industries reliant on abundant high-quality water supplies, such as agriculture and beverage manufacturers. We therefore suggest the promotion of studies and information dissemination on the role of protected areas and their related ecosystem services to these economic sectors;Climate change: develop studies on climate change adaptation & mitigation measures, and on carbon 3. storage functions of forest protected areas. Promote the inclusion of protected areas in anticipated future funding mechanisms for reducing emissions from deforestation;Poverty and protected areas: improve methods for analyzing the links between protected areas and pov-4. erty; mainly on how to assess the impact of protected areas, benefits and costs, not only at local, but also at national and regional levels.
We very much hope that by assessing and mainly by communicating the contributions of protected areas to human wellbeing, we might tangibly influence political will and financial investments in conservation.
23 Reduced Emissions from Deforestation and Degradation
Protected Areas in Today’s World: Their Values and Benefits for the Welfare of the Planet
76
References
Bezaury-Creel, J.E. In prep. Mexican Protected Area Systems Income. In Financial Gap Analysis for Mexico’s Program of Work on Protected Areas.
Bezaury-Creel, J.E., L.M. Ochoa Ochoa y J.F. Torres. 2007. Áreas Naturales Protegidas de México: Estatales, del Distrito Federal y Municipales. Comisión Nacional para el Conocimiento y Uso de la Biodiversidad / Comisión Nacional de Áreas Naturales Protegidas / The Nature Conservancy / Pronatura, A.C. México, D.F.
Cartaya, V. 2007. “Conservación y Bienestar Humano en Venezuela: El Aporte de las Áreas Protegidas”. Síntesis del Informe Final para la Fundación The Nature Conservancy of Venezuela (Contrato de Servicios Profesionales NTA 075).
Comisión Mundial de Áreas Protegidas — Venezuela. 2007. Avances en la Gestión de las Áreas Protegidas en Venezuela”. Informe sin publicar.
CONANP — Comisión Nacional de Áreas Naturales Protegidas. 2007. Programa de Turismo en Áreas Protegidas 2007-2012. Mexico.
CONANP — Comisión Nacional de Áreas Naturales Protegidas. s/f. Base de Datos Geográfica de Áreas Naturales Protegidas Federales. Versión modificada y ampliada por J.E. Bezaury-Creel, J. Fco. Torres y L. Ochoa-Ochoa. 1 Capa ArcGIS 8.0. Mexico
CONANP Web Page http://www.conanp.gob.mx/Fauzi, A., and S. Anna. 2005. Economic Valuation of Lembeh Strait Marine Protected Area (in Indonesian).
Report to USAID and Government of North Sulawesi.Fiona, R.G., and Callum, M.R. 2002. The Fishery Effects of Marine Reserves and Fishery Closures. WWF-US,
1250 24th Street, NW, Washington, DC 200037, USA.Haryadi, A. 2004. Socio-Economic Analysis of Marine Protected Area’s Benefits in Kepulauan Seribu, Jakarta
(In Indonesia). Ph.D Dissertation. Bogor Agrciultural UniversityINEGI — Instituto Nacional de Geografía y Estadística. 2005. Conjunto de Datos Vectoriales de la Carta de
Uso del Suelo y Vegetación, Escala 1:250,000, Serie III (CONJUNTO NACIONAL). Mexico.Instituto Nacional de Recursos Naturales, 2006. Las Áreas Naturales Protegidas del Perú: Informe Nacional
2005. INRENA, Perú.Instituto Nacional de Recursos Naturales, 2007. Informe Nacional del Sistema Nacional de Áreas Naturales
Protegidas por el Estado Peruano 2007. INRENA, Perú.Iqbal, M. 2006. Economic Valuation of Protected Area of Marine National Park in Weh Island (in Indonesian).
Master Thesis. Graduate Program of Marine Resource Economics. Bogor Agricultural University.León, Fernando. 2007. El Aporte de las Áreas Naturales Protegidas a la Economía Nacional. INRENA,
Perú.Maksum, M.A. 2006. Analyses of Economic Benefits of Marine Protected Area to fisheries in Karimunjawa (in
Indonesian). Master Thesis. Graduate Program of Rural Planning and Development. Bogor Agricultural University.
Ministerio del Poder Popular para el Medio Ambiente e Instituto Nacional de Parques. “Parques Nacionales y otras Áreas Protegidas: Informe Nacional 2007. Venezuela”. Octubre 2007. II Congreso Latinoamericano de Parques Nacionales y otras Áreas Protegidas. Bariloche, Argentina.
Pabon-Zamora, L. and Cohen S, 2007. Making the Case for Protected Areas. Assessment, communications and advocacy work around social and economic benefits of protected areas. The Nature Conservancy. Unpublished paper.
Presidencia de la República. 2007. Primer Informe de Gobierno, México, 1º de septiembre de 2007. MéxicoProyecto GPAN, 2006. Análisis de Necesidades de Financiamiento del SINANPE 2005 — 2014. Perú.Putra, D.P. 2001. Ecological-Economic Analysis of Coral Reef protected area in South Lampung (in Indonesian).
Master Thesis. Graduate Program of Coastal and Maine Resources. Bogor Agricultural University.Suprihatin, J. 2002. Fisheries Pattern in National Marine Park Komodo: A Spatial and Temporal Analysis (in
Indoensian). Graduate Program of Coastal and Maine Resources. Bogor Agricultural University.UNDP - United Nations Development Programme. 2007. Summary, Human Development Report 2007/2008,
Fighting Climate Change: Human Solidarity in a Divided World.
77
Improving protected area finance through tourism
IMProVING ProTeCTed AreA FINANCe THroUGH ToUrISM10.
Paul Eagles1 and Oliver Hillel2
1 Task Force on Tourism and Protected Areas, World Commission on Protected Areas, 2Secretariat of the Convention on Biological Diversity
Parks are a major tourism asset, particularly for developing countries. Tourism can contribute significantly more than it does today to provide the funding needed to implement the Convention on Biological Diversity’s Programme of Work on Protected Areas. Although most parks charge little or no entrance or user fees, tourism revenues are becoming an essential component of both developing and developed country parks’ agency budgets. Globally, the trend is for governments to demand that parks earn an increasing proportion of their budget from tourism sources.Economic measurement tools for calculating the contribution of protected areas to tourism are often inexistent or incomplete, and those that do exist may strongly underestimate indirect contributions and costs. Public and private executives allocating funds to protected areas often seriously underestimate the economic significance of the tourism assets they should protect. This can lead to low levels of investment in park maintenance and in visitor infrastructure thus jeopardizing the very asset upon which many destinations rely to attract investment, and generate business opportunities and employment. Decision makers need to be provided with more accurate data — using methodologies that are already available. By building the institutional capacity of park management agencies, CBD Parties can significantly enhance the ability of these agencies to capture higher volumes of tourism revenues for parks. The experiences, technologies and mechanisms for improving park financing are known and available. Innovative forms of management, such as parastatals, non-profit corporations and partnerships with for-profit corporations, allow park agencies to capture tourism revenues with greater efficiency. The recovery of park operating costs from tourism is linked more to the efficiency of the park agency’s management in capturing tourism revenues than to the actual volume of tourism. Benefits from tourism to protected areas, and vice-versa, can also be increased by incorporating parks in the planning and design of regional tourism destinations, and by considering market-based payback and incentive mechanisms planned with the private sector.
10.1 GrowTH oF ProTeCTed AreAS, FINANCIAL NeedS ANd THe PoTeNTIAL CoN-TrIBUTIoN oF ToUrISM
Tourism can be an effective tool in the conservation and management of protected areas (PA). It can pro-vide financial and political support to conservation, and lead to a greater understanding of the value of parks — which in turn can lead to more areas being protected. The increasing interest of travelers in natural areas, and the steady growth forecast in this industry also indicate that these contributions are likely to increase. The feasibility of tourism as a conservation tool depends on an understanding of the expectations of tourists, the appropriateness of tourism in a specific area, and the capacity of park managers to provide a high quality experience while minimizing the potential negative impacts of visitation1.
Today, according to the IUCN’s World Commission on Protected Areas and the Database on Protected Areas (WDPA)2, there are over 110,000 protected areas, covering approximately 11.6% of the global land surface and 1 % of the sea surface. The total area covered by parks has grown significantly over the last decades, from 2 million km2 in 1960, to 8 million km2 in 1980, and to over 15.5 million km2 (of which 13.6 million km2 are terrestrial ecosystems and 1.9 million km2 are marine areas) in 2006.
Funding for the establishment and management of these protected areas is usually insufficient. Data col-lected for the CBD indicates that between 1.1 and 2.5 billion USD/year is required for the maintenance of a network of protected areas. However the amount of funding that is made available is estimated to be between
1 Priskin, J., McCool, S., in IUCN PARKS Vol 16, n. 2, The Visitor Experience Challenge, 2006
2 http://www.unep-wcmc.org/wdpa/index.htm
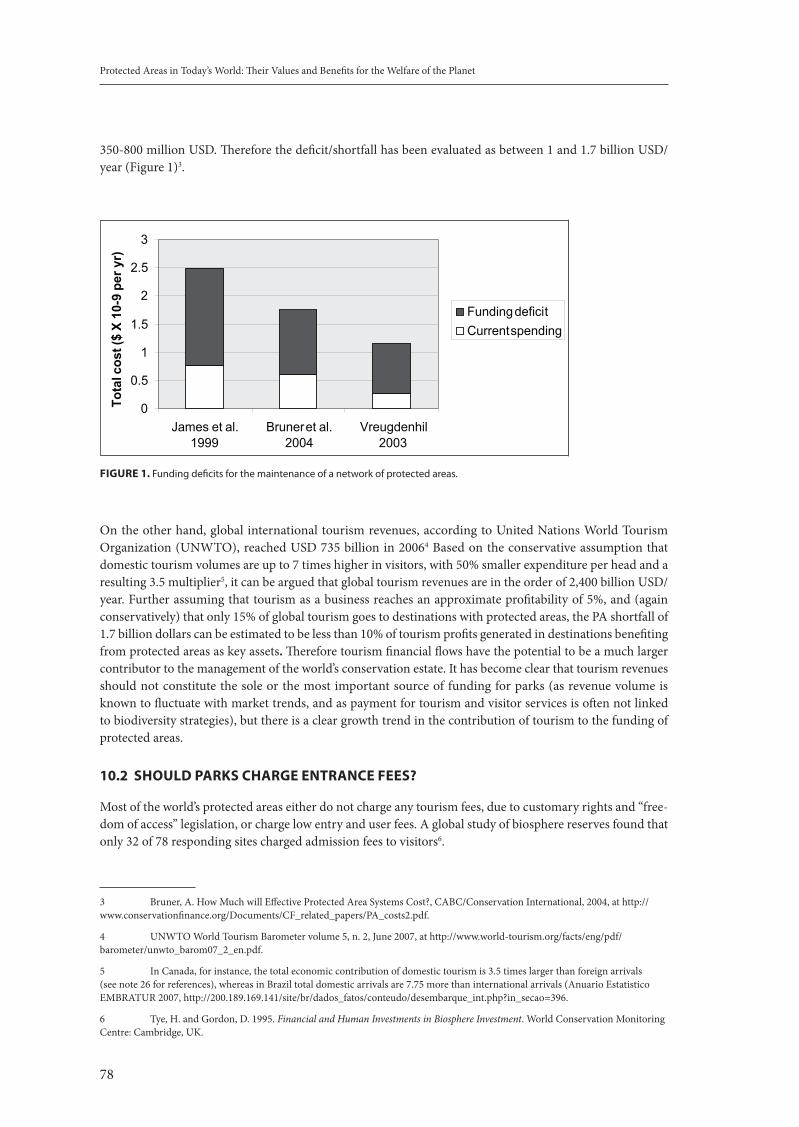
Protected Areas in Today’s World: Their Values and Benefits for the Welfare of the Planet
78
350-800 million USD. Therefore the deficit/shortfall has been evaluated as between 1 and 1.7 billion USD/year (Figure 1)3.
FIGUre 1. Funding deficits for the maintenance of a network of protected areas.
On the other hand, global international tourism revenues, according to United Nations World Tourism Organization (UNWTO), reached USD 735 billion in 20064 Based on the conservative assumption that domestic tourism volumes are up to 7 times higher in visitors, with 50% smaller expenditure per head and a resulting 3.5 multiplier5, it can be argued that global tourism revenues are in the order of 2,400 billion USD/year. Further assuming that tourism as a business reaches an approximate profitability of 5%, and (again conservatively) that only 15% of global tourism goes to destinations with protected areas, the PA shortfall of 1.7 billion dollars can be estimated to be less than 10% of tourism profits generated in destinations benefiting from protected areas as key assets. Therefore tourism financial flows have the potential to be a much larger contributor to the management of the world’s conservation estate. It has become clear that tourism revenues should not constitute the sole or the most important source of funding for parks (as revenue volume is known to fluctuate with market trends, and as payment for tourism and visitor services is often not linked to biodiversity strategies), but there is a clear growth trend in the contribution of tourism to the funding of protected areas.
10.2 SHoULd PArKS CHArGe eNTrANCe FeeS?
Most of the world’s protected areas either do not charge any tourism fees, due to customary rights and “free-dom of access” legislation, or charge low entry and user fees. A global study of biosphere reserves found that only 32 of 78 responding sites charged admission fees to visitors6.
3 Bruner, A. How Much will Effective Protected Area Systems Cost?, CABC/Conservation International, 2004, at http://www.conservationfinance.org/Documents/CF_related_papers/PA_costs2.pdf.
4 UNWTO World Tourism Barometer volume 5, n. 2, June 2007, at http://www.world-tourism.org/facts/eng/pdf/barometer/unwto_barom07_2_en.pdf.
5 In Canada, for instance, the total economic contribution of domestic tourism is 3.5 times larger than foreign arrivals (see note 26 for references), whereas in Brazil total domestic arrivals are 7.75 more than international arrivals (Anuario Estatistico EMBRATUR 2007, http://200.189.169.141/site/br/dados_fatos/conteudo/desembarque_int.php?in_secao=396.
6 Tye, H. and Gordon, D. 1995. Financial and Human Investments in Biosphere Investment. World Conservation Monitoring Centre: Cambridge, UK.
0
0.5
1
1.5
2
2.5
3
James et al.1999
Bruner et al.2004
Vreugdenhil2003
Tota
l cos
t ($
X 10
-9 p
er y
r)
Funding deficitCurrent spending
79
Improving protected area finance through tourism
Protected areas, in principle, are a public good and should serve all citizens. Taxes paid by citizens can cover the cost of maintaining the protected areas for the common good. However three arguments can be used to counter this view. First, actual visitors to parks (as against the general, non-visiting public) benefit in an exclusive way (through their leisure experience, and their enjoyment of the environment). This is particularly true if their experience is enhanced by infrastructure and interpretation investments. In park recreation and leisure, only the direct users — a segment of the population — benefit, and they can pay for this additional service. Second, nature is free, but management is costly. Tourists cause environmental impacts that require additional investments in technology and processes to minimize damage. Lastly, international and non-local visitors do not contribute to the tax-based public budgets maintaining the park. In these cases, it can be argued that charging fees would be justified.
In some countries the financial situation of government is such that there are few funds available for park management other than those derived directly from tourism fees and charges.
With increased tourism revenues, better financed parks are also likely to be better managed (particularly in developing countries), thereby attracting more tourists thus creating a risk of increased human impacts. Parks with more tourists also often get higher political visibility. With this political strength the site managers can argue for greater budget allocations from governments. Finally, charging entrance fees often leads to improved tracking of visitor numbers, profiles and ultimately to enhanced economic measurement tools.
10.3 ProTeCTed AreAS CoNTrIBUTe To ToUrISM More THAN we KNow ANd LeSS THAN THeY CAN.
Current trends indicate a continued reduction in the proportion of state/public budgets allocated to protected areas, while revenues from tourism are increasing. A reduction in park funding in the 1990s was documented for Canada and the USA7, as was the development of new forms of park administration and new pricing policies. In the United States, the state of Texas reduced its per capita expenditure on parks from 5.16 dollars in 1990 to 3.44 dollars in 2004. During this same period park revenues in the state increased from 14 mil-lion to 31 million8. In developing countries, which harbour the most significant part of global biodiversity, the low level of state investment in PAs is not often linked to a corresponding volume of tourism or other revenues. Concurrently, most of the direct revenue from tourism to protected areas, may not flow back to the actual protected area, but accrue to a centrally managed government account which in turn is eventually allocated to the budgets to the parks agency, and ultimately to the park. For example in their studies of parks in India, Indonesia, and Zimbabwe, Goodwin et al.9 found no direct relationship between park budgets and park tourism revenues. In these three countries all the money collected locally was submitted to the central government. This creates a major problem in that tourism is then seen as a major cause of environmental degradation as there is a lack of resources with which to apply visitor management technologies to minimize the negative impacts of increased visitation.
A further difficulty is that direct park revenue from visitation is not often linked to the actual expenditures from tourists to local communities, i.e. parks make more money from visitors who contribute less to the local economies, thereby sending the wrong message to decision makers at the destination level. For example in Algonquin Provincial Park in Canada10 tourism expenditures per person per day in 2000 varied dramatically.
7 Eagles, P. International Trends in Park Tourism: The Emerging Role of Finance. The George Wright Forum, vol. 20, number 1, 2003.
8 Crompton, J.L., Culpepper, J. Trends in Texas’ Expenditures for State Park and Recreation Services, Department of Recreation, Park and Tourism Sciences, Texas A&M University, November 2006.
9 Goodwin, H., Kent, I.J., Parker, K.T., & Walpole, M.J., Tourism, Conservation and Sustainable Development, final report for DFID, 1997, http://www.haroldgoodwin.info/.
10 Bowman, M.E., Eagles, P. F. G., Tourism Spending in Algonquin Provincial Park, 5th International SAMPAA Conference, 2003, www.sampaa.org.
Protected Areas in Today’s World: Their Values and Benefits for the Welfare of the Planet
80
Lodge visitors contributed up to CDN$230.00 to the local economy, day visitors spent CDN$150 while car campers spent, CDN$37. However, park management earned the most income from the group that contrib-uted the least per day to the local economy (the campers). Conversely, park management earned the least from the people who spent the most in the local economy, (day visitors and lodge visitors). This example shows a typical situation, where tourism expenditure flows are not well understood and are therefore not properly incorporated into park income financial planning.
Visitation and tourism are at the core of one of the most widely used economic valuation tools for biodiversity, the “travel cost method”, and can be a component of estimation methods such as contingent valuation11. Some of the limitations of these valuation methods have recently been addressed, and new economic measurement tools have shown surprising results. Consider, for example, the case of Australia where tourism is the largest foreign exchange earner. A study of Western Australia12 shows that tourism provided a total of AU $207 million to the Southern Forest and Gascoyne Coast Region. Of the total going to the Southern Forest Region, 88% (or 62 million) was associated with national parks. Of the total amount going to the Gascoyne Coast Region, 92% (or 127 million) was associated with national parks. Consumer spending associated with a protected area (i.e. which is spent in or around a park, by people visiting a park) is quite different from expenditure which is dependent on a protected area (for example, if a person primarily stays in an all-inclusive resort in Cancun for a traditional beach vacation, but then spends an additional 3 days visiting parks in the Riviera and Costa Maya, the aggregated economic impact to those areas should be credited exclusively to the parks). To estimate the exclusive “dependent” contribution of park tourism, an economic valuation tool called substitution factor was used, and results indicated that AUD 5.7 million for the Southern Region and AUD 23.5 million for the Gascoyne region would be lost if there were no parks.
A further example of the contribution of protected areas to tourism is New Zealand, where tourism is the larg-est foreign exchange generator, and contributes NZ$17.2 billion (or almost 10% of its GDP) to the countries economy. Conservation is big business in New Zealand, with one-third of the country set aside as national parks and other conservation areas. At least 65% of tourists in NZ visit at least one park, 10% said that their stay would be shorter if no park was visited, and another 12% said they came exclusively to visit parks. The total budget for New Zealand’s Department of Conservation (DOC) in the 2006/2007financial year was 277.2 million NZ dollars. Approximately 42% of this amount was spent on managing recreation, and 47% on managing natural heritage13. Careful economic impact analysis of DOC investments and returns in four s regions and parks (West Coast, where up to 84% of the area is protected, Abel Tasman National Park, Queen Charlotte Track, and Fiordland National Park), where DOC invested approximately 22.4 million dollars per year from 2003 to 2005 shows that the money generated:
Almost 4 thousand jobs or up to 15% of the total jobs on the West Coast. This represents a ratio of 5,600 •dollars per job generated, a figure well below other commercial and industrial activities. 130 million dollars in household income (a multiplying factor of 6), 260 million dollars in value-added •(house income plus profits and interest, a multiplying factor of 12) and a total output of 560 million dollars (value-added plus commercial transactions, i.e. total economic movement, a factor of 26)14.
The disproportion between the revenues generated by park tourism, park budgets and tourism/visitor fees is clearly shown in an Australian example from five World Heritage Areas (Great Barrier Reef, Wet Tropics,
11 CBD Technical Series 28, “An Exploration of Tools and Methodologies for Valuation of Biodiversity and Biodiversity Resources and Functions”, 2007
12 Carlsen, J., Wood, D. Assessment of economic value of Recreation and Tourism in Western Australia’s National Parks, Marine Parks and Forests, 2006, CRC Sustainable Tourism, www.crctourism.com.au
13 The value of conservation: what does conservation contribute to the economy?, NZ Department of Conservation, October 2006.
14 Consolidation of the data presented in the study for different regions cannot be justified from an economic science basis (as it compares results from different years and geographic scales), but it points to an average situation well reflected in individual results.
81
Improving protected area finance through tourism
Uluru National Park, Kakadu National Park, and Tasmanian Wilderness)15. The five areas studied generated tourism expenditures of AUS$1,372,000,000 (the authors indicate that this is probably an underestimated) in 1991–1992. By comparison the total public management budgets for the five sites was AUS$48,700,000 while the user-fee income to the management agencies was AUS$4,160,000. Therefore, the management budgets were only 3.5% of the tourist expenditure created by the World Heritage Areas. On the other hand, public revenues raised through user fees represented only 8.5% of the government’s expenditures, and park agencies only collected 3% of the total tourism revenue accrued to the destination. This example reveals a vast under-investment in park management. It may also suggest that the low level of public expenditure for management may not be sufficient to stop long-term degradation of the resource on which the tourism depends.
P. Tremblay16, based solely on the parks’ worth as a tourism asset, evaluated the economic value of Kakadu National Park, in Australia’ s Northern Territory . He concluded that of the AUD$58.1 million in tourism revenue collected in 2004 (for the regions of Top End and Northern Territory), $ 51.1 million (or 88%) was directly attributable to the Park, and that up to AUD$15 million was directly dependent on the existence of the Park. Authorities would be justified, therefore, in investing similar amounts to maintain the Park as a tourism asset. However, in 2006, Parks Australia only invested AUD 4 million in the park. According to Parks Australia, the total operating cost of Kakadu National Park in 2005 was 17 million — for all salaries, maintenance, and management costs, while capital investment was 1.5 million, one-tenth of the exclusive revenue produced by the park itself17. More simply, parks that constitute tourist attractions often produce benefits well beyond the actual investment in their sustainable management. This lack of of investment is a major cause of the negative impacts of tourism in park areas. It is not tourism that is the problem, but rather the financial and management system which do not price and apportion income appropriately.
10.4 How To oPTIMIZe THe CoNTrIBUTIoN oF ToUrISM
10.4.1 Building Institutional Capacity
Some park agencies have developed more autonomous models that allow them to make better use of tour-ism revenue by partnerings with local stakeholders and tourism enterprises. Responsible commercialization through public-private partnerships provides a viable alternative management arrangement18. Possible fees to be charged include recreation and hunting fees, green safaris, endowment funds, for-profit investments, tradable development rights, natural resource extraction rights, commercial operations in protected areas, airport and hotel fees, wetland and carbon banking, revenues from the sale and trade of wildlife, and voluntary contributions.
An excellent example of building capacity for capturing tourism revenues to parks is Parks Canada19. In the 1990’s, this agency was given permission to (a) to retain and reinvest all revenues; (b) plan and operate on a multi-year, non-lapsing basis; (c) increase non-tax revenues from products and services; (d) borrow against future revenue; (e) link revenues to costs; and (f) depreciate assets. The new approach has moved this govern-ment agency into the management style of a government-owned corporation, or a parastatal. New national parks legislation was passed by the Canadian Parliament in 1998. By fiscal year 2000–2001 Parks Canada had a gross revenues of CDN$84.7 million, an 111% increase since 1994–1995. Three sources of income were prominent revenue generators: entry fees ($30.1 million in revenues) rentals and concessions ($14.3 million) and camping fees ($10.9 million).
15 Driml, Sally and Mick Common. 1995. Economic and Financial Benefits of Tourism in Major Protected Areas. Australian Journal of Environmental Management 2, no. 2: 19-39.
16 Tremblay, P. Economic Contribution of Kakadu National Park to Tourism in the Northern Territory, 2007, Sustainable Tourism Cooperative Research Centre, at www.crctourism.com.au.
17 http://www.environment.gov.au/parks/publications/annual/
18 Saporiti, N. Managing National Parks — How Public-Private Partnerships can aid Conservation, World Bank, 2006.
19 Eagles, P. International Trends in Park Tourism: The Emerging Role of Finance. The George Wright Forum, vol. 20, number 1, 2003
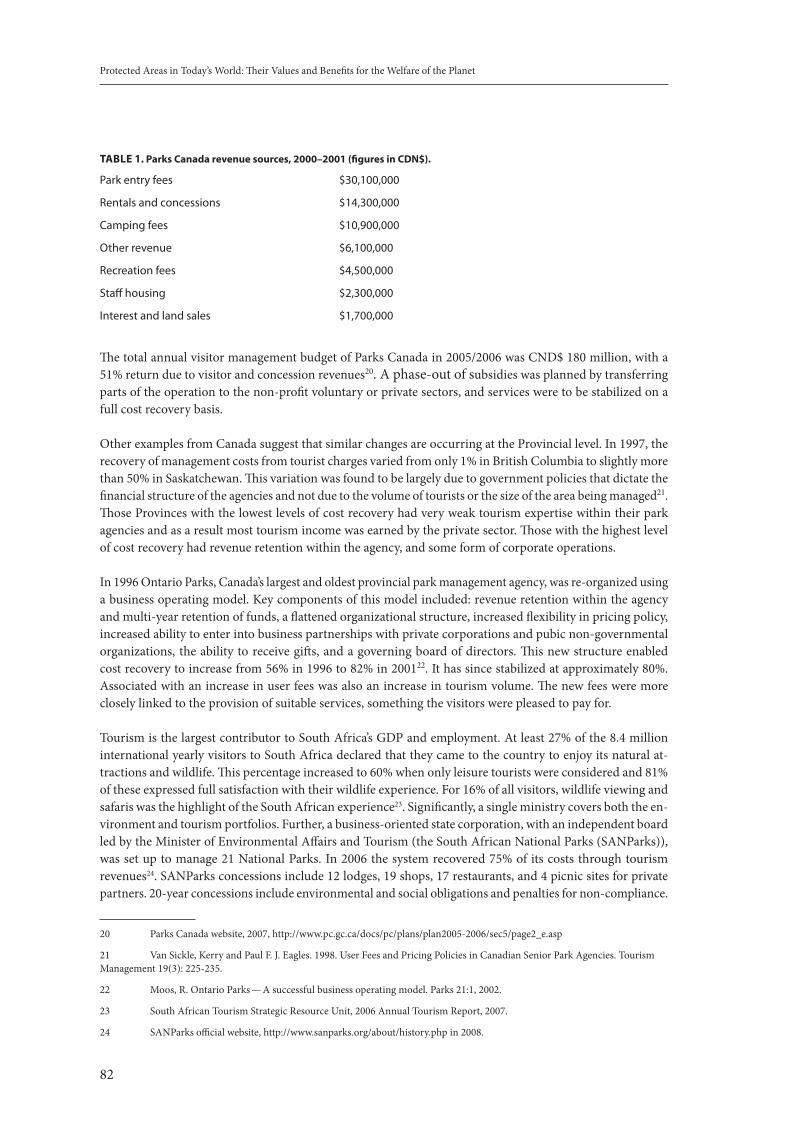
Protected Areas in Today’s World: Their Values and Benefits for the Welfare of the Planet
82
TABLe 1. Parks Canada revenue sources, 2000–2001 (figures in CdN$).
Park entry fees $30,100,000
Rentals and concessions $14,300,000
Camping fees $10,900,000
Other revenue $6,100,000
Recreation fees $4,500,000
Staff housing $2,300,000
Interest and land sales $1,700,000
The total annual visitor management budget of Parks Canada in 2005/2006 was CND$ 180 million, with a 51% return due to visitor and concession revenues20. A phase-out of subsidies was planned by transferring parts of the operation to the non-profit voluntary or private sectors, and services were to be stabilized on a full cost recovery basis.
Other examples from Canada suggest that similar changes are occurring at the Provincial level. In 1997, the recovery of management costs from tourist charges varied from only 1% in British Columbia to slightly more than 50% in Saskatchewan. This variation was found to be largely due to government policies that dictate the financial structure of the agencies and not due to the volume of tourists or the size of the area being managed21. Those Provinces with the lowest levels of cost recovery had very weak tourism expertise within their park agencies and as a result most tourism income was earned by the private sector. Those with the highest level of cost recovery had revenue retention within the agency, and some form of corporate operations.
In 1996 Ontario Parks, Canada’s largest and oldest provincial park management agency, was re-organized using a business operating model. Key components of this model included: revenue retention within the agency and multi-year retention of funds, a flattened organizational structure, increased flexibility in pricing policy, increased ability to enter into business partnerships with private corporations and pubic non-governmental organizations, the ability to receive gifts, and a governing board of directors. This new structure enabled cost recovery to increase from 56% in 1996 to 82% in 200122. It has since stabilized at approximately 80%. Associated with an increase in user fees was also an increase in tourism volume. The new fees were more closely linked to the provision of suitable services, something the visitors were pleased to pay for.
Tourism is the largest contributor to South Africa’s GDP and employment. At least 27% of the 8.4 million international yearly visitors to South Africa declared that they came to the country to enjoy its natural at-tractions and wildlife. This percentage increased to 60% when only leisure tourists were considered and 81% of these expressed full satisfaction with their wildlife experience. For 16% of all visitors, wildlife viewing and safaris was the highlight of the South African experience23. Significantly, a single ministry covers both the en-vironment and tourism portfolios. Further, a business-oriented state corporation, with an independent board led by the Minister of Environmental Affairs and Tourism (the South African National Parks (SANParks)), was set up to manage 21 National Parks. In 2006 the system recovered 75% of its costs through tourism revenues24. SANParks concessions include 12 lodges, 19 shops, 17 restaurants, and 4 picnic sites for private partners. 20-year concessions include environmental and social obligations and penalties for non-compliance.
20 Parks Canada website, 2007, http://www.pc.gc.ca/docs/pc/plans/plan2005-2006/sec5/page2_e.asp
21 Van Sickle, Kerry and Paul F. J. Eagles. 1998. User Fees and Pricing Policies in Canadian Senior Park Agencies. Tourism Management 19(3): 225-235.
22 Moos, R. Ontario Parks — A successful business operating model. Parks 21:1, 2002.
23 South African Tourism Strategic Resource Unit, 2006 Annual Tourism Report, 2007.
24 SANParks official website, http://www.sanparks.org/about/history.php in 2008.
83
Improving protected area finance through tourism
Concession fees are calculated as a percentage of business turnover, and amounted to USD 42.5 million in 2004, a spectacular achievement even for developed countries. Thanks to the opportunities generated and owing to recognition by stakeholders, SANParks has increased its managed protected areas by 10% (360,000 ha) over the past 10 years. An indirect spin-off of SANParks, African Parks, is a foundation which developed concession partnerships in the Democratic Republic of Congo, Ethiopia, Malawi, Sudan and Zambia,. Revenue from its park in Zambia increased from USD 100 to 42,000 in the three years since 2002, generating an ad-ditional US$ 9,000 for local communities. Further it has mobilized over US$ 23 million in private and public funds for the parks it manages25.
10.4.2 Improving and disseminating economic measurements
Eagles and others26 note that in 1996, parks and protected areas in Canada and the US generated 2.6 billion visitor/days of recreation activity and between 236 and 370 billion US dollars in economic impact including both foreign and domestic tourism . They also noted that due to methodological limits these values were certainly underestimated. These amounts can be roughly compared with the 518 billion USD total contribution of international tourism to the USA economy in 199927 and Canada’s 44 billion CND in 199728. Although these park tourism figures reflect all kinds of economic contributions made by domestic park visitors and tourists (including non-tourism related ones), and the national tourism statistics only consider strictly tourism-related expenditures (mostly transportation, accommodation and foodservice), the comparison shows the order of magnitude and significance of park tourism. Direct measurements of the contribution of tourism to the economies of destinations (aggregated revenues from tourism businesses, direct taxes collected from tourism businesses, direct jobs, etc) fail to recognize what is called the “capillarity” of tourism (tourists also spend in non-tourism businesses), or its multiplying effect (money spent in tourism circulates repeatedly to all other sectors of the local economy, and tourism creates jobs serving the industry indirectly) — statistics and more detailed economic measurements indicate that for every dollar spent in a hotel, at least another one is spent indirectly, and that for every ten tourism jobs, at least three others are created indirectly. When evaluating the economic contributions of park tourism to destinations as a tool for decision-making in budget allocations to protect these key tourism attractors, these additional capillary flows should be considered.
Even considering economic leakages (money transferred out from a destination to pay for goods and services not available locally, or profits redirected elsewhere), the net contribution of tourism is often several times more significant to the local economy than direct tourism revenues would indicate. For example, out of the 280 million national park recreation visits in the United States in 2001 park visitors spent US$10.6 billion in the local regions around national parks while only a mere 10% was spent on admissions and fees. The other 90% of their spending is distributed between lodging (28%), restaurants (25%), gas and oil (12% and 10%), groceries (9%) and other retail purchases (16%)29. These figures show how small user fees are when compared to the overall trip expenditures that occur when visiting a park.
In order to correct some of the distortions between direct and indirect tourism revenues at the level of national accounts, and to apply the existing data at the global scale, the UN World Tourism Organization and the World Travel & Tourism Council developed an economic measurement methodology called Tourism Satellite Accounting (TSA). This methodology, which can be applied for national accounts, is now widely used for the collection of economic data. Researchers could consider applying the same methodological principles at the scale of protected areas and park tourism. A Park Satellite Accounting procedure would be a useful tool for assessing the full impact of park tourism revenue.
25 Saporiti, N. Managing National Parks — How Public-Private Partnerships can aid Conservation, World Bank, 2006.
26 Eagles, P, McLean, D., Stabler, M. Estimating the Tourism Volume and Value in Protected Areas in Canada and the USA, 2000, George Wright Forum
27 US Office of the Travel and Tourism Industries, at http://tinet.ita.doc.gov/analysis/keyfacts2000.html
28 Delisle, J., Venne, S., Tourism in Canada and its various economic facets, Statistics Canada’s Digest, 87-403, 2002
29 Stynes, Daniel J. “Economic Significance of Recreational Uses of National Parks and Other Public Lands”, Vol.5.no.1 Winter 2005, Michigan State University, p.19.
Protected Areas in Today’s World: Their Values and Benefits for the Welfare of the Planet
84
Research has shown30 that direct revenues from tourism in parks (through entrance and user fees, for instance) and public investments in park maintenance and management are often significantly lower than the economic benefits to the local communities derived from park visitation and tourism. Public and private decision mak-ers often allocate funds for park management that are several orders of magnitude lower than their actual capacity to invest, leading to a situation of neglect and underinvestment which is often unsustainable. The direct economic impact from park tourism should be extended to include generation of employment and direct investment in tourism — all of which benefit the tourism destination indirectly, and depend, at least partially, on the parks.
10.4.3 Incorporating parks into mainstream tourism development
In many tourist destinations (existing and potential) with significant biodiversity resources, a number of part-nerships have been established over the past years between tourism developers, park authorities, NGOs, local communities and other stakeholders. This has resulted in the establishment of new and additional protected areas. These areas, public or private, can exist by themselves or can act as corridors or buffer zones.
By establishing or supporting protected areas, tourism developers, entrepreneurs and investors win because parks are major attractions for their tourists, and will ultimately secure the economic value of their real estate investment (always a major element the decisions involving resort facilities) by securing key landscape assets, by avoiding urban sprawl and by avoiding competing developments in the immediate surroundings of the park. Often, stricter land-use regulations require developers to set aside minimum areas for conservation. Turning this potential economic liability into an asset then becomes a significant motivation and govern-ments can help developers and landowners through the hurdles of establishing private reserves, and provide additional support through tax shelters and other incentives. Moreover, tourism enterprises, while seeking long term profitability, are increasingly concerned about their corporate image, their relationship with their staff, and their impact on the global environment and that immediately around them31.
Citizens from local communities benefit from the ecosystem services rendered by parks (soil fertility, pollution control, freshwater, replenishment of biodiversity needed for livelihood in buffer zones, etc). In addition, local communities are able to enjoy recreation in natural areas, and can benefit from business opportunities and jobs in formal and informal economic activities around increased visitor interest in the parks. As such, and particularly in developing countries, the economic impacts of park tourism can contribute to poverty allevia-tion (and in attaining the Millennium Development Goals), employment creation, stimulate investment and support local services, even in quite remote communities. Moreover, sustainable tourism can bring tangible economic value to natural and cultural resources and even, in zones of conflict, act as a force for inter-cultural understanding and peace. This can result in direct income from visitor spending for their conservation, and an increase in support for conservation from local communities.
Market responses to sustainability principles and the role of the business community in protecting the envi-ronment are clear. For example 61% of US tourists are looking for travel experiences involving well preserved natural, historical or cultural sites. 83% of British package holidaymakers say that a dirty beach or a polluted sea matter a great deal to them when choosing a destination. Three-quarters of US travellers feel that it is important that their visits not damage the environment. 65% of British tourists feel that the reputation of the holiday company on environmental issues is important. About 69% of Danish tourists staying in eco-labelled hotels are willing to pay more for such hotels owing to their environmental designation32.
30 Eagles, P. — “Economic Significance of Park Tourism: the emerging role of finance”, George Wright papers, volume 20, number 1, 2003.
31 Making Tourism More Sustainable: a Guide for Policy Makers, UNEP and
WTO: http://www.uneptie.org/pc/tourism/documents/Making%20Tourism%20More%20Sustainable-A%20Guide%20for%20Policy%20Makers/making%20tourism%20more%20sustainable%20part1.pdf
32 Ibidem
85
Improving protected area finance through tourism
It is much easier to set up effective and lasting financial and stewardship links between tourism businesses, communities and protected areas during the conception and planning phase of resorts rather than once they have already been established than later on, when resorts are established. Examples of this include:
On the Brazilian North-eastern coast (State of Bahia), a set of tourism investment projects (PRODETUR •I and II) financed by the Inter-American development Bank between 1994 and 2006 (and pressured by local and international NGOs), ultimately led to the design and establishment of the Conduru State Park. This park was as an add-on to the critical Una Biological Reserve, and part of a system of other of protected areas linked through a corridor. In the Egyptian resort town on Sharm el-Sheikh, the Egyptian government identified the tourism value •of parks soon after the Sinai Peninsula was transferred from Israel in 1982. In 1983, Ras Muhammad National Park was established to protect the coral reefs and unique species of marine life that constitute the towns’ major diving and snorkeling attractions. In addition several comprehensive park development programs financed by the United Kingdom, USAID and the European Union have made the park and its associated protected areas an essential feature of the economic development in South Sinai. In the Mexican Caribbean, the explosion of tourism in Cancun has transformed this once sleepy fish- •ing village into the largest resort destination in Mexico. Development has spread southward along the Quintana Roo coast, and now affects the Sian Ka’an UNESCO Biosphere Reserve which was created in 1987 (many years after the resort was planned). Negotiations (not always peaceful) between the govern-ment, NGOs and the tourism industry, the legal protection of over 2 million acres on the Caribbean coast was achieved, including the Arrecifes de Sian Ka’an, a coral reef system with an area of over 86,000 acres. In spite of the serious negative impacts of tourism development on the park, visibility achieved through its status as a main tourism attraction allowed for the consolidation of the park’s staff and infrastructure, and attracted research, monitoring and environmental education programs. The Mesoamerican Reef Tourism Initiative led by Conservation International and Amigos de Sian Ka’an, a local NGO, focuses on additional partnerships with hotel developers, the cruise ship industry and marine recreation service providers in order to develop additional protected areas, reduced footprints and formulate payback mechanisms. The 17-million USD Sustainable Environmental Management Plan for Northern Palawan, Philippines, •funded through a loan from the Japan Bank for International Cooperation (which included a tourism master plan for 5 municipalities) used the Environmentally Critical Areas Network (ECAN) methodology. Ultimately, however, the design and establishment of 2 Municipal Marine Parks in Coron and Busuanga was largely led by local stakeholders and wasn’t integrated into the project design. In the case of the “Escalera Nautica” (Nautical Steps) megaproject in Western Mexico, the Mexican •state fund for tourism development (FONATUR) proposed to invest 1.7 billion US dollars into the con-struction of 27 marinas, over 10,000 hotel rooms and 80,000 new jobs in order to handle the estimated one million tourists who would come each year. 40% of the area is nature reserves or parks, with 900 untouched islands, and a coastline longer than that of the Italian peninsula. FONATUR has already set up agreements with five state governments (Baja California Norte, Baja California Sur, Sonora, Sinaloa and Nayarit), 18 municipalities, as well as with the Ministries of Tourism, Agriculture, Communications and Transportation, Economy, and the environmental agency Secretaría de Medio Ambiente y Recursos Naturales (SEMARNAT). If fully developed, the project would affect three national parks and 15 protected areas. Initial versions of the project did not engage the broader conservation community, focusing solely on economic issues and attracting possible investors. After local, national and international players be-came aware of the serious negative impacts of the initial development plan (also based on the enormous footprint of FONATUR’s previous Cancun and Riviera Maya developments), strong resistance from NGOs and local communities has largely stopped the plan. In 2002, a coalition of environmental NGOs and academia proposed a more sustainable version of the project, with more realistic market forecasts and increased opportunities for conservation. Recent statements from the current Mexican government indicate that the project (part of which has now been renamed “Sea of Cortez” given the negative con-notations of the old name) is still considered a priority by some key players.
Protected Areas in Today’s World: Their Values and Benefits for the Welfare of the Planet
86
10.4.4 Partnering with private sector
In several cases, individual resort and ecolodge investments have set aside protected areas. The private nature reserve and ecolodge systems are both adding to the protected area estate and are becoming major competitors to parks in the ecotourism market. Well known “best practice” cases include the Dominican Republic’s Punta Cana (where a 350 room resort complex was created and supports a 1,500 acre reserve and two environmental and social Foundations), the Cayman Ecological Refuge adjacent to Brazil’s Pantanal region (linked to a private reserve constituting the main attraction of the hotel), and the El Nido Resorts in Palawan, the Philippines (whose establishment led to the creation of the 90,000 ha El Nido-Taytay Managed Resource Protected Area, and that also maintains the El Nido Foundation implementing environmental and social projects in the area). In Costa Rica, a network of over 110 Private Reserves totalling more than 60,000 ha is largely financed through tourism. In the Brazilian Southwestern Amazon, the success of the award-winning Cristalino Jungle Lodge and its scientific program ultimately led to the establishment of the 186,000 hectare Cristalino State Park.
10.5 THe roAd AHeAd
To optimize the contributions from tourism to the CBD Programme of Work on Protected Areas, a number of activities can be outlined. A program to carefully measure economic impact from tourism in and around a diverse set of protected areas, particularly in developing countries, would be desirable in order to better allocate investments, income and funding, and to increase the links between tourism expenditures and park tourism income.
However, experience shows that even with the adequate data, park agencies have limited capacity to •optimize potential benefits from tourism, and to manage visitation adequately. Three lines of work can address these barriers: Building the capacity of park managers in tourism and business planning and financials, such as pro- •posed by the innovative online training program on Business Planning for Protected Areas, organized by UNESCO-World Heritage Centre, The Nature Conservancy, and Washington State University, in collaboration with members of the Conservation Finance Alliance33, or by the User’s Manual “Managing Tourism and Biodiversity” developed to support the CBD Guidelines on Biodiversity and Tourism Development34.Developing new and more flexible institutional arrangements and management models for park agen- •cies, supported by adequate legislative and policy tools that allow them to capture an increasing part of tourism revenue flows and manage visitation impacts accordingly. Disseminating these new technologies, expertise and tools through a program (documents, training, •consulting) to park agencies, governments, civil society and NGOs, to facilitate greater contributions from tourism fees and charges to park budgets and enable a much more cost efficient and effective ap-proach to park tourism finance.
Dr. Paul Eagles, Department of Recreation and Leisure Studies, University of Waterloo, Waterloo, ON, N2L 3G1 Canada, [email protected].
Oliver Hillel, Secretariat of the Convention on Biological Diversity, 413 St. Jacques, H2Y 1N9 Montreal Canada, [email protected].
The Authors would like to express their thanks to Windekind Buteau-Duitschaever, Bonnie McCutcheon and Jasveen Rattan, graduate students of Waterloo University, for their useful comments and review.
33 http://capps.wsu.edu/sustainablefinance/courses.asp
34 http://tourism.cbd.int/manual.shtml
87
Ecosystems and Human Well-Being: UNESCO Biosphere Reserves as Learning Laboratories for Sustainable Development
eCoSYSTeMS ANd HUMAN weLL-BeING: UNeSCo BIoSPHere 11. reSerVeS AS LeArNING LABorATorIeS For SUSTAINABLe deVeLoPMeNT
Ana Persic, Salvatore Arico, Guillen Calvo and Natarajan IshwaranUNESCO, Secretariat of the Man and the Biosphere Programme
11.1 reCoNCILING CoNSerVATIoN ANd deVeLoPMeNT IN THe worLd NeTworK oF BIoSPHere reSerVeS
Biosphere reserves under the UNESCO Man and the Biosphere (MAB) programme have, conceptually as well as in practice, evolved from tools for biodiversity conservation and management to portions of the territory (both land and sea) where the main dimensions of the notion of sustainable development are operationalized (Batisse, 1982).
Established in the early 1970s, the MAB experiment relied on a set of research-driven projects, soon comple-mented by a World Network of Biosphere Reserves. The Network currently encompasses 529 sites in 105 countries and is the second largest network of natural sites established under an intergovernmental umbrella, the largest being the List of Wetlands of International Importance under the Convention on Wetlands (Ramsar, 1971). The two networks, together with relevant (natural and ‘mixed’) sites that are part of the World Heritage List under the UNESCO World Heritage Convention (1972), constitute an asset to back-up decisions by the Multilateral Environmental Agreements.
While both Ramsar and World heritage sites are designated under legally binding instruments, namely the Ramsar and the World Heritage Convention, respectively, the World Network of Biosphere Reserves is guided by soft instruments, namely the Statutory Framework and the Seville Strategy for Biosphere Reserves, adopted by the UNESCO Intergovernmental Coordinating Council of the MAB Programme in 1995. The Statutory Framework has been formulated with the objectives of “enhancing the effectiveness of individual biosphere reserves and strengthening common understanding, communication and cooperation at regional and inter-national levels”. While it states the definition and functions of biosphere reserves and main criteria for their designation, the Statutory Framework also recognizes differences in cultural and socio-economic conditions at the local and national levels, thus encouraging States to elaborate and implement national criteria for biosphere reserves that take into account the special conditions of the State concerned.
Biosphere reserves include a variety of natural and human-influenced ecosystems with the main goal to bring together biodiversity conservation and socio-economic development for the well-being of the ecosystems and communities living in those sites. Thus, by their definition, biosphere reserves are sites intended to enhance local communities’ socio-economic and cultural well-being through conservation and sustainable use of biodiversity and the sustainable management of natural resources built on sound science and community participation efforts. Biosphere reserves are structured in core and transition areas with buffer zones inter-mingled, thus performing, as a whole, a three-fold — conservation, knowledge and development — function (Figure 1). The three zones of biosphere reserves have various degrees of legal protection, and although they have an origin in the protected areas domain, since 1995 they have evolved into an international designation that allows context-specific conservation and development relationships to be developed in land- and sea-scapes where more than 80% of the designated area lies outside of legally protected core zones (Ishwaran et al., 2008). As such, biosphere reserves are not protected areas in the mere sense of the term but rather areas that provide context-specific places for working mutually-beneficial human-nature interactions in a post-Rio Summit era.
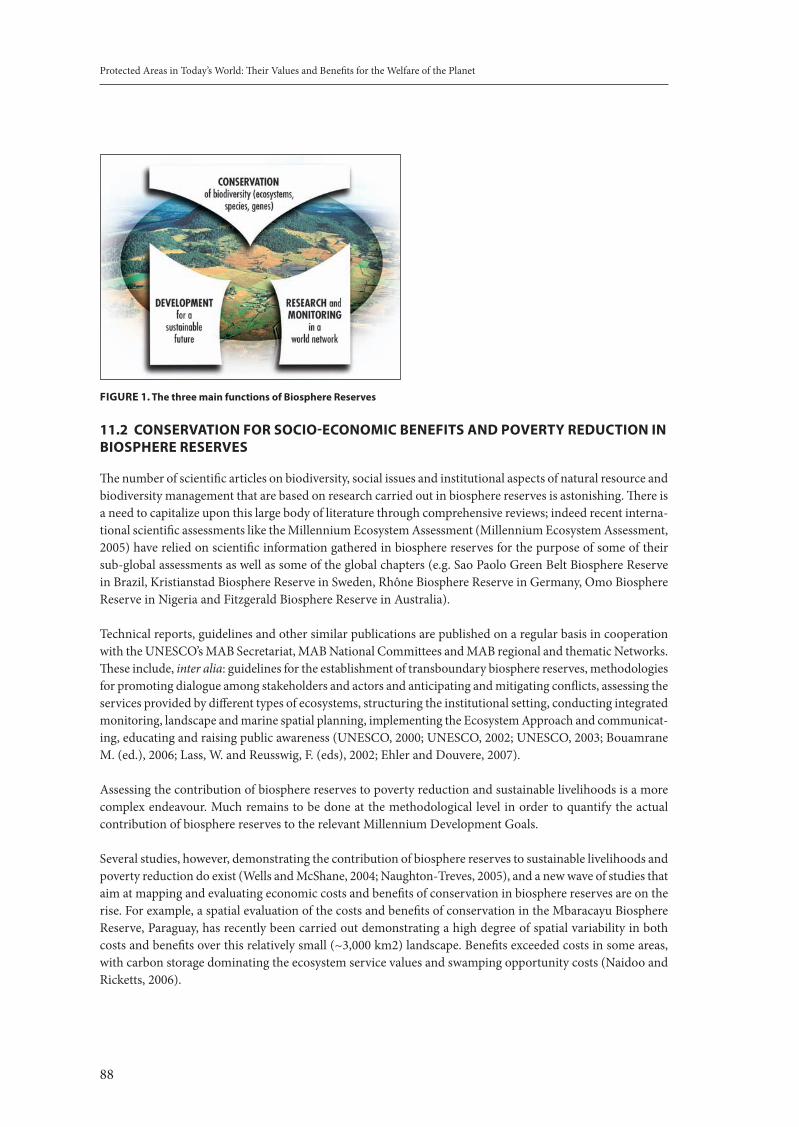
Protected Areas in Today’s World: Their Values and Benefits for the Welfare of the Planet
88
FIGUre 1. The three main functions of Biosphere reserves
11.2 CoNSerVATIoN For SoCIo-eCoNoMIC BeNeFITS ANd PoVerTY redUCTIoN IN BIoSPHere reSerVeS
The number of scientific articles on biodiversity, social issues and institutional aspects of natural resource and biodiversity management that are based on research carried out in biosphere reserves is astonishing. There is a need to capitalize upon this large body of literature through comprehensive reviews; indeed recent interna-tional scientific assessments like the Millennium Ecosystem Assessment (Millennium Ecosystem Assessment, 2005) have relied on scientific information gathered in biosphere reserves for the purpose of some of their sub-global assessments as well as some of the global chapters (e.g. Sao Paolo Green Belt Biosphere Reserve in Brazil, Kristianstad Biosphere Reserve in Sweden, Rhône Biosphere Reserve in Germany, Omo Biosphere Reserve in Nigeria and Fitzgerald Biosphere Reserve in Australia).
Technical reports, guidelines and other similar publications are published on a regular basis in cooperation with the UNESCO’s MAB Secretariat, MAB National Committees and MAB regional and thematic Networks. These include, inter alia: guidelines for the establishment of transboundary biosphere reserves, methodologies for promoting dialogue among stakeholders and actors and anticipating and mitigating conflicts, assessing the services provided by different types of ecosystems, structuring the institutional setting, conducting integrated monitoring, landscape and marine spatial planning, implementing the Ecosystem Approach and communicat-ing, educating and raising public awareness (UNESCO, 2000; UNESCO, 2002; UNESCO, 2003; Bouamrane M. (ed.), 2006; Lass, W. and Reusswig, F. (eds), 2002; Ehler and Douvere, 2007).
Assessing the contribution of biosphere reserves to poverty reduction and sustainable livelihoods is a more complex endeavour. Much remains to be done at the methodological level in order to quantify the actual contribution of biosphere reserves to the relevant Millennium Development Goals.
Several studies, however, demonstrating the contribution of biosphere reserves to sustainable livelihoods and poverty reduction do exist (Wells and McShane, 2004; Naughton-Treves, 2005), and a new wave of studies that aim at mapping and evaluating economic costs and benefits of conservation in biosphere reserves are on the rise. For example, a spatial evaluation of the costs and benefits of conservation in the Mbaracayu Biosphere Reserve, Paraguay, has recently been carried out demonstrating a high degree of spatial variability in both costs and benefits over this relatively small (~3,000 km2) landscape. Benefits exceeded costs in some areas, with carbon storage dominating the ecosystem service values and swamping opportunity costs (Naidoo and Ricketts, 2006).
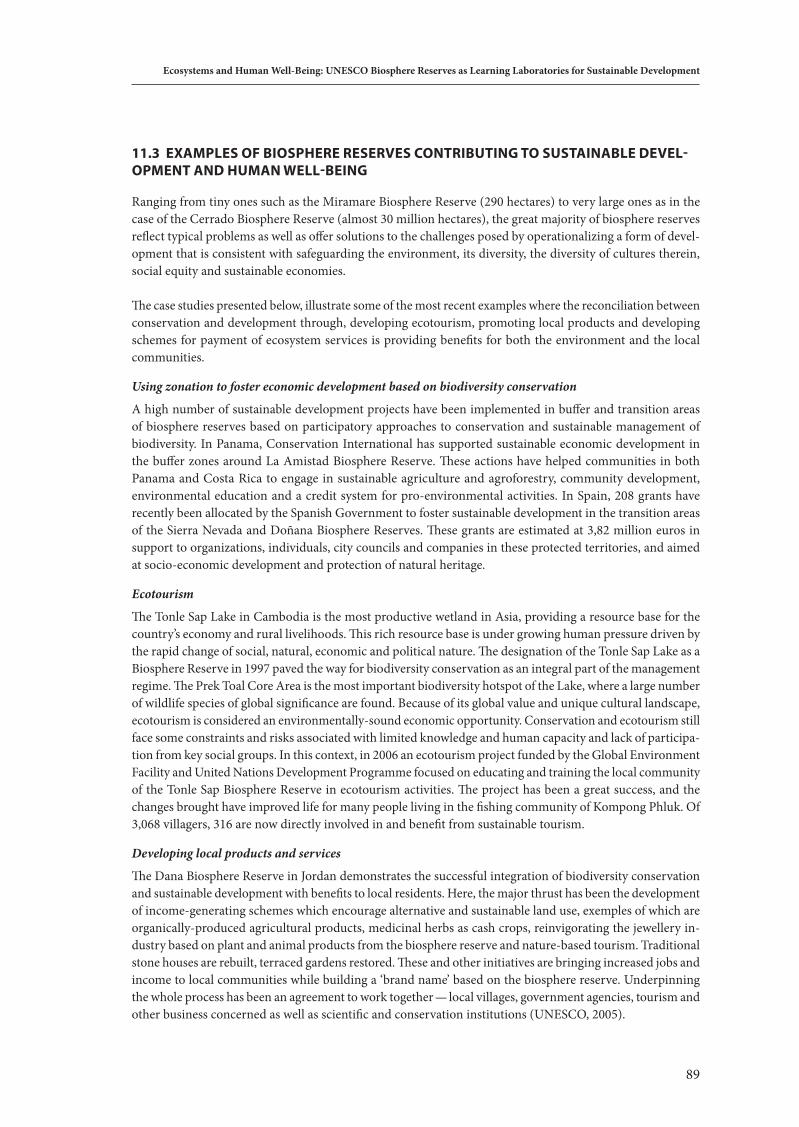
89
Ecosystems and Human Well-Being: UNESCO Biosphere Reserves as Learning Laboratories for Sustainable Development
11.3 eXAMPLeS oF BIoSPHere reSerVeS CoNTrIBUTING To SUSTAINABLe deVeL-oPMeNT ANd HUMAN weLL-BeING
Ranging from tiny ones such as the Miramare Biosphere Reserve (290 hectares) to very large ones as in the case of the Cerrado Biosphere Reserve (almost 30 million hectares), the great majority of biosphere reserves reflect typical problems as well as offer solutions to the challenges posed by operationalizing a form of devel-opment that is consistent with safeguarding the environment, its diversity, the diversity of cultures therein, social equity and sustainable economies.
The case studies presented below, illustrate some of the most recent examples where the reconciliation between conservation and development through, developing ecotourism, promoting local products and developing schemes for payment of ecosystem services is providing benefits for both the environment and the local communities.
Using zonation to foster economic development based on biodiversity conservation
A high number of sustainable development projects have been implemented in buffer and transition areas of biosphere reserves based on participatory approaches to conservation and sustainable management of biodiversity. In Panama, Conservation International has supported sustainable economic development in the buffer zones around La Amistad Biosphere Reserve. These actions have helped communities in both Panama and Costa Rica to engage in sustainable agriculture and agroforestry, community development, environmental education and a credit system for pro-environmental activities. In Spain, 208 grants have recently been allocated by the Spanish Government to foster sustainable development in the transition areas of the Sierra Nevada and Doñana Biosphere Reserves. These grants are estimated at 3,82 million euros in support to organizations, individuals, city councils and companies in these protected territories, and aimed at socio-economic development and protection of natural heritage.
Ecotourism
The Tonle Sap Lake in Cambodia is the most productive wetland in Asia, providing a resource base for the country’s economy and rural livelihoods. This rich resource base is under growing human pressure driven by the rapid change of social, natural, economic and political nature. The designation of the Tonle Sap Lake as a Biosphere Reserve in 1997 paved the way for biodiversity conservation as an integral part of the management regime. The Prek Toal Core Area is the most important biodiversity hotspot of the Lake, where a large number of wildlife species of global significance are found. Because of its global value and unique cultural landscape, ecotourism is considered an environmentally-sound economic opportunity. Conservation and ecotourism still face some constraints and risks associated with limited knowledge and human capacity and lack of participa-tion from key social groups. In this context, in 2006 an ecotourism project funded by the Global Environment Facility and United Nations Development Programme focused on educating and training the local community of the Tonle Sap Biosphere Reserve in ecotourism activities. The project has been a great success, and the changes brought have improved life for many people living in the fishing community of Kompong Phluk. Of 3,068 villagers, 316 are now directly involved in and benefit from sustainable tourism.
Developing local products and services
The Dana Biosphere Reserve in Jordan demonstrates the successful integration of biodiversity conservation and sustainable development with benefits to local residents. Here, the major thrust has been the development of income-generating schemes which encourage alternative and sustainable land use, exemples of which are organically-produced agricultural products, medicinal herbs as cash crops, reinvigorating the jewellery in-dustry based on plant and animal products from the biosphere reserve and nature-based tourism. Traditional stone houses are rebuilt, terraced gardens restored. These and other initiatives are bringing increased jobs and income to local communities while building a ‘brand name’ based on the biosphere reserve. Underpinning the whole process has been an agreement to work together — local villages, government agencies, tourism and other business concerned as well as scientific and conservation institutions (UNESCO, 2005).
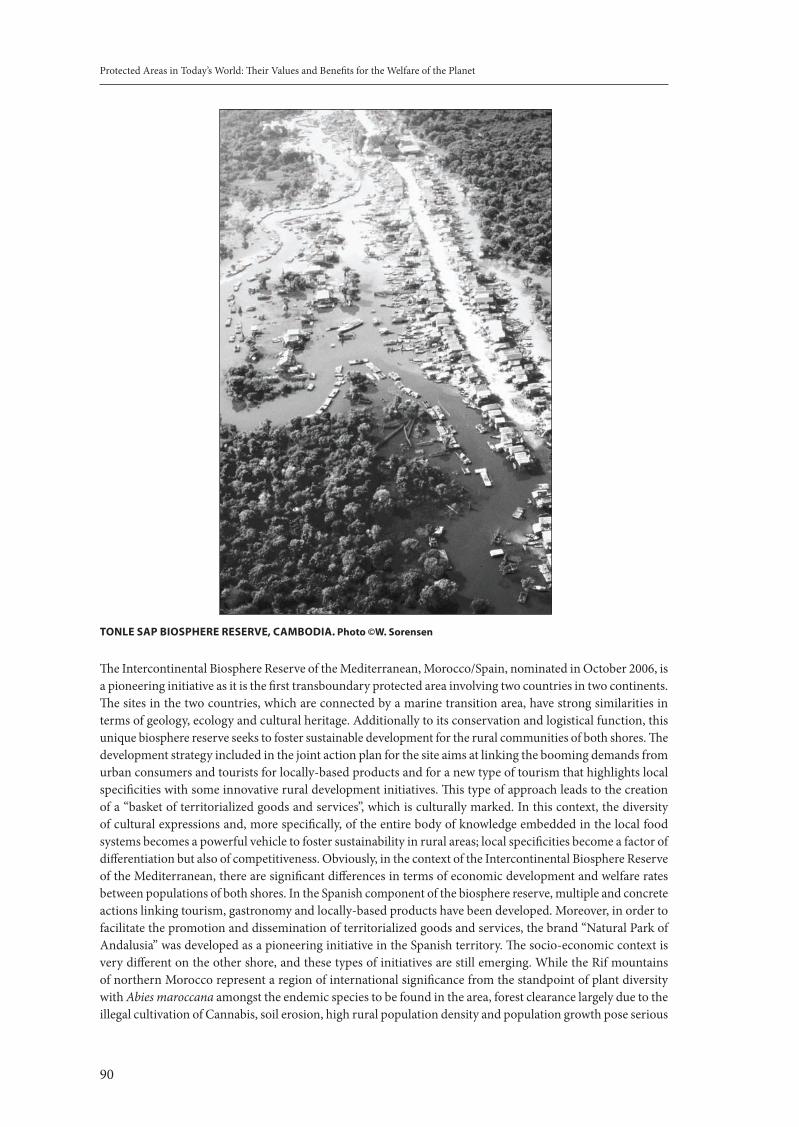
Protected Areas in Today’s World: Their Values and Benefits for the Welfare of the Planet
90
The Intercontinental Biosphere Reserve of the Mediterranean, Morocco/Spain, nominated in October 2006, is a pioneering initiative as it is the first transboundary protected area involving two countries in two continents. The sites in the two countries, which are connected by a marine transition area, have strong similarities in terms of geology, ecology and cultural heritage. Additionally to its conservation and logistical function, this unique biosphere reserve seeks to foster sustainable development for the rural communities of both shores. The development strategy included in the joint action plan for the site aims at linking the booming demands from urban consumers and tourists for locally-based products and for a new type of tourism that highlights local specificities with some innovative rural development initiatives. This type of approach leads to the creation of a “basket of territorialized goods and services”, which is culturally marked. In this context, the diversity of cultural expressions and, more specifically, of the entire body of knowledge embedded in the local food systems becomes a powerful vehicle to foster sustainability in rural areas; local specificities become a factor of differentiation but also of competitiveness. Obviously, in the context of the Intercontinental Biosphere Reserve of the Mediterranean, there are significant differences in terms of economic development and welfare rates between populations of both shores. In the Spanish component of the biosphere reserve, multiple and concrete actions linking tourism, gastronomy and locally-based products have been developed. Moreover, in order to facilitate the promotion and dissemination of territorialized goods and services, the brand “Natural Park of Andalusia” was developed as a pioneering initiative in the Spanish territory. The socio-economic context is very different on the other shore, and these types of initiatives are still emerging. While the Rif mountains of northern Morocco represent a region of international significance from the standpoint of plant diversity with Abies maroccana amongst the endemic species to be found in the area, forest clearance largely due to the illegal cultivation of Cannabis, soil erosion, high rural population density and population growth pose serious
ToNLe SAP BIoSPHere reSerVe, CAMBodIA. Photo ©w. Sorensen
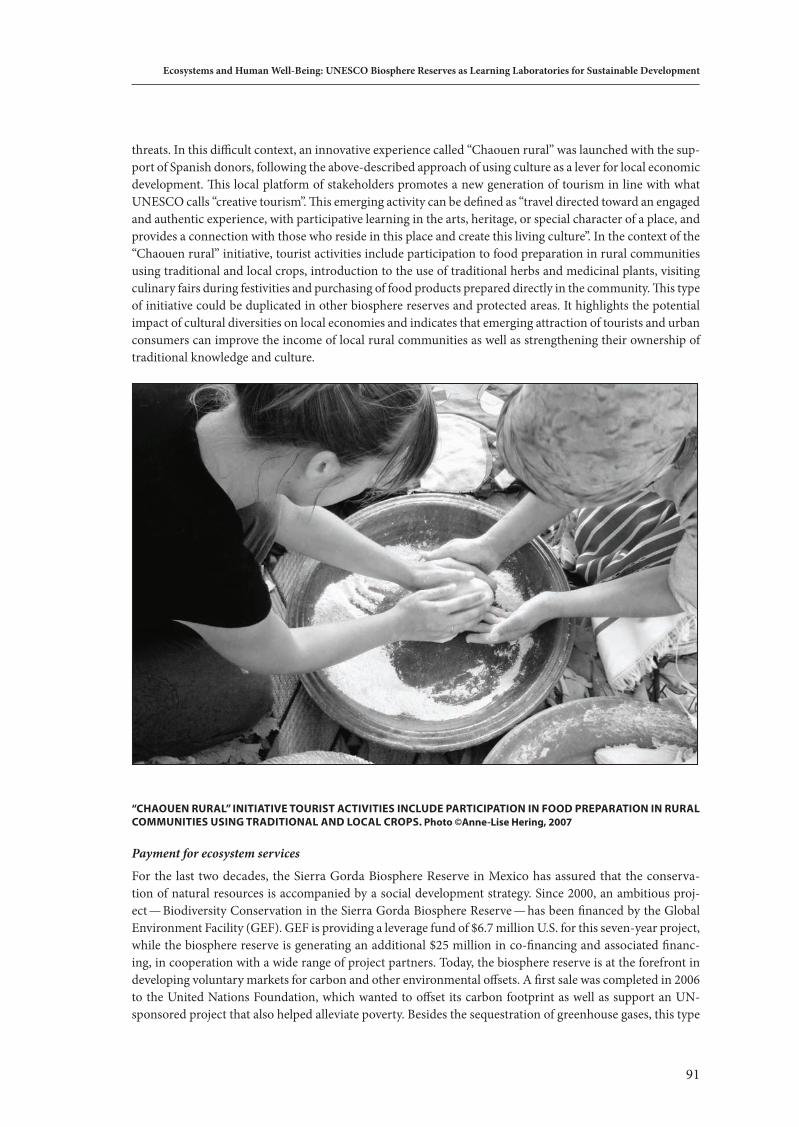
91
Ecosystems and Human Well-Being: UNESCO Biosphere Reserves as Learning Laboratories for Sustainable Development
threats. In this difficult context, an innovative experience called “Chaouen rural” was launched with the sup-port of Spanish donors, following the above-described approach of using culture as a lever for local economic development. This local platform of stakeholders promotes a new generation of tourism in line with what UNESCO calls “creative tourism”. This emerging activity can be defined as “travel directed toward an engaged and authentic experience, with participative learning in the arts, heritage, or special character of a place, and provides a connection with those who reside in this place and create this living culture”. In the context of the “Chaouen rural” initiative, tourist activities include participation to food preparation in rural communities using traditional and local crops, introduction to the use of traditional herbs and medicinal plants, visiting culinary fairs during festivities and purchasing of food products prepared directly in the community. This type of initiative could be duplicated in other biosphere reserves and protected areas. It highlights the potential impact of cultural diversities on local economies and indicates that emerging attraction of tourists and urban consumers can improve the income of local rural communities as well as strengthening their ownership of traditional knowledge and culture.
“CHAoUeN rUrAL” INITIATIVe ToUrIST ACTIVITIeS INCLUde PArTICIPATIoN IN Food PrePArATIoN IN rUrAL CoMMUNITIeS USING TrAdITIoNAL ANd LoCAL CroPS. Photo ©Anne-Lise Hering, 2007
Payment for ecosystem services
For the last two decades, the Sierra Gorda Biosphere Reserve in Mexico has assured that the conserva-tion of natural resources is accompanied by a social development strategy. Since 2000, an ambitious proj-ect — Biodiversity Conservation in the Sierra Gorda Biosphere Reserve — has been financed by the Global Environment Facility (GEF). GEF is providing a leverage fund of $6.7 million U.S. for this seven-year project, while the biosphere reserve is generating an additional $25 million in co-financing and associated financ-ing, in cooperation with a wide range of project partners. Today, the biosphere reserve is at the forefront in developing voluntary markets for carbon and other environmental offsets. A first sale was completed in 2006 to the United Nations Foundation, which wanted to offset its carbon footprint as well as support an UN-sponsored project that also helped alleviate poverty. Besides the sequestration of greenhouse gases, this type
Protected Areas in Today’s World: Their Values and Benefits for the Welfare of the Planet
92
of project also has significant sustainable development benefits by enhancing biodiversity in this area and by providing local landowners with an income to replace farming or herding. It is anticipated that the Sierra Gorda Carbon and Environmental Offsets will be increasingly in demand, as they can offer an important tool to individuals, businesses and organizations globally, as well as in Mexico, in meeting higher business standards for sustainability.
The examples presented above provide insights in some of the crucial components that are needed to en-courage economies that benefit from sustainable development practices. These include the development of innovative income-generating schemes that encourage reviving of local livelihoods while reducing the environmental footprint; involvement and active participation of local communities, recognition and support from government, private sector and civil society and establishing partnerships with a wide range of national and international stakeholders.
Table 1 suggests how ecosystem services that are supported by some of the biosphere reserves described in the above-presented case studies can be linked to some of the main dimensions of the Millennium Development Goals .
10.4 BIoSPHere reSerVeS AS LABorATorIeS For SUSTAINABLe deVeLoPMeNT
During the United Nations Decade of Education for Sustainable Development (UNDESD, 2004-2013), bio-sphere reserves are being promoted as learning laboratories for sustainable development with particular emphasis given to policy prescriptions and practices that drive mutually-reinforcing biodiversity conservation trends and social and economic change. The notion of learning laboratories for sustainable development emphasizes the importance for the geographical, administrative and legal space designated as a biosphere reserve to be considered as a context-specific ‘laboratory’ for testing the match between policy prescriptions and practices that drive socio-economic changes that are conscious of the need to reduce the rates of biodi-versity loss. At times, the mismatch between policy and practice may be attributable to information, data or knowledge gaps. But more often, it is due to the absence or lack of human or institutional resources that is a precondition for optimizing the use of available knowledge to influence policy and politics so as to gener-ate simultaneous benefits for people, biodiversity, ecology and economies of biosphere land- and seascapes (Ishwaran et al., 2008).
As noted by Ishwaran et al., 2008, “the Vietnam National Committee of the MAB Programme has developed a vision to articulate and convey the meaning of the notion of biosphere reserves as learning laboratories for sustainable development around a few essential features that anchor the idea:
the space under consideration must encompass the whole biosphere reserve, i.e. the core, buffer and 1. transition areas; conservation and development must be seen as interdependent and applicable to the functioning of all 2. three zones; it is not desirable to think of conservation, even with regard to the biodiversity in the core zone, as being free of any relationship to social and economic development in the broader biosphere landscape; similarly development in buffer and transition zones must clearly be related to environmental improvements, including sustainable use and conservation of biodiversity; clean energy and zero-emissions of greenhouse gases are becoming part of the ecological economics of 3. a warming world that introduce new dimensions into sustainable development practices. As one of the fastest growing economies in Asia, Vietnam intends to target buffer and transition areas of biosphere reserves as priority locations for experimenting with such new development pathways. Recently, one of Vietnam’s environmentally-friendly projects that uses bio-degradable rubbish and manure to produce biogas has received the 2006 Global Energy Award in Brussels, Belgium. This award is considered one of the most prestigious environmental honors in the world. The MAB National Committee of Vietnam wishes to use such experiences in gradually rendering buffer and transition zones of biosphere reserves as places for demonstrating clean development pathways; and;
93
Ecosystems and Human Well-Being: UNESCO Biosphere Reserves as Learning Laboratories for Sustainable Development
education, research and long-term monitoring continue to occupy the important role they have always 4. enjoyed throughout the origin and evolution of the concept and practice of biosphere reserves; together they constitute the link that promotes an iterative and learning interaction between policy and practice. In the case of Cat Ba Archipelago Biosphere Reserve, Hai Phong City, Vietnam, the local Government/People Committee is the coordinator with the authority to approve, defer or reject sustainable develop-ment projects and initiatives in and around the biosphere reserve and as foreseen under the Provincial Agenda 21 of Vietnam, which emphasizes the need to master the balance between conservation and socio-economic development at the provincial level. Hence the Cat Ba Biosphere Reserve serves as a laboratory to experiment with the conservation-development relationship that the authorities wish to apply throughout the Hai Phong Province. Cat Ba Biosphere Reserve is also a pilot whose experiences could be adapted for application to other biosphere reserves in the country.
In order to effectively test the model of biosphere reserves as learning laboratories, the MAB National Committee of Vietnam is turning to the Chair and the Vice-Chair of the People’s Committees of the Provinces where its biosphere reserves are located. The Vietnam MAB National Committee feels that effective coor-dination of all biosphere reserve functions in all three zones is only feasible through the active involvement of governance, management and administrative professionals in charge of the overall province where the biosphere reserve is located”.
11.6 CoNCLUSIoNS
For the last 35 years, the MAB Programme has been successful in conceptual advocacy and refinement of ideas related to biosphere reserves as both concepts and tools. Now, it is time to embark on a phase of em-phasizing evidence-based knowledge generation and iterative evolution of principles and practice. The time is also critical to demonstrate that biosphere reserves are the best designations for combining protection and production and, hence, for experimenting with place-specific opportunities and responses to the changing natural, cultural and socio-economic environment. Ecosystem services could be an interesting conceptual framework to superimpose on the multiple functions ranging from protection to production in biosphere land/seascapes. For example, the various zones of biosphere reserves can serve as places to attract new invest-ments into hitherto neglected services (climate regulation, water purification, biodiversity conservation) and improve environmental and social performance of provisioning (agriculture, forestry, fisheries) and cultural (tourism) services that may have been the principal recipients of investments to-date, thus enhancing the links between healthy and productive ecosystems and human well-being. Finally, in order to move from advocacy to knowledge generation and use, it will be critical to enhance global learning via networking and exchange of information, capacity and experiences between different sites of the World Network of Biosphere Reserves and with the MAB Programme and other national, regional and international partners.
References
Batisse, M. (1982). The biosphere reserve: A tool for environmental conservation and management. Environmental Conservation, 9 (2): 101-110.
Bouamrane M. (ed.). (2006). Biodiversity and stakeholders: concertation itineraries. Biosphere reserves — tech-nical Notes 1. UNESCO, Paris.
Ehler, C. and Douvere, F. 2007 Visions for a Sea Change. Report of the First International Workshop on marine Spatial Planning. Intergovernmental Oceanographic Commission and Man and the Biosphere programme, UNESCO. IOC Manual and Guides no. 48: 83 pp.
Ishwaran, N., Persic, A. and Tri, N. (2008) Concept and practice: the case of UNESCO biosphere reserves; In press, International Journal of Environment and Sustainable Development.
Lass, W. and Reusswig, F. (eds). 2002. Social Monitoring: Meaning and Methods for an Integrated Management in Biosphere Reserves. Report of an International Workshop. Rome, 2-3 September 2001. Biosphere Reserve Integrated Monitoring (BRIM) Series No. 1. UNESCO, Paris.
Protected Areas in Today’s World: Their Values and Benefits for the Welfare of the Planet
94
Naidoo, R. and Ricketts, T.H (2006) Mapping the Economic Costs and Benefits of Conservation, PLoS Biol.; 4(11): e360.
Naughton-Treves, L., Buck Holland, M. and Brandon, K (2005). The role of protected areas in conserving bio-diversity and sustaining local livelihoods. Annual Review of Environment and Resources 30: 219-252.
Wells, M. and McShane, T. O. (2004). Integrating protected area management with local needs and aspirations. Ambio, vol. 33, nº 8, p. 513-519.
UNESCO, 2000. Solving the puzzle: The Ecosystem approach and Biosphere Reserves, UNESCO, Paris.UNESCO, 2002. Biosphere Reserves: Special places for people and nature. UNESCO, Paris. UNESCO, 2003. Five Transboundary Biosphere Reserves in Europe. Biosphere Reserves Technical Notes.
UNESCO, Paris.UNESCO, 2005. Biosphere Reserves — Benefits and Opportunities. UNESCO, Paris. UNESCO MAB Programme http://www.unesco.org/mab/ Millennium Ecosystem Assessment http://www.millenniumassessment.org/
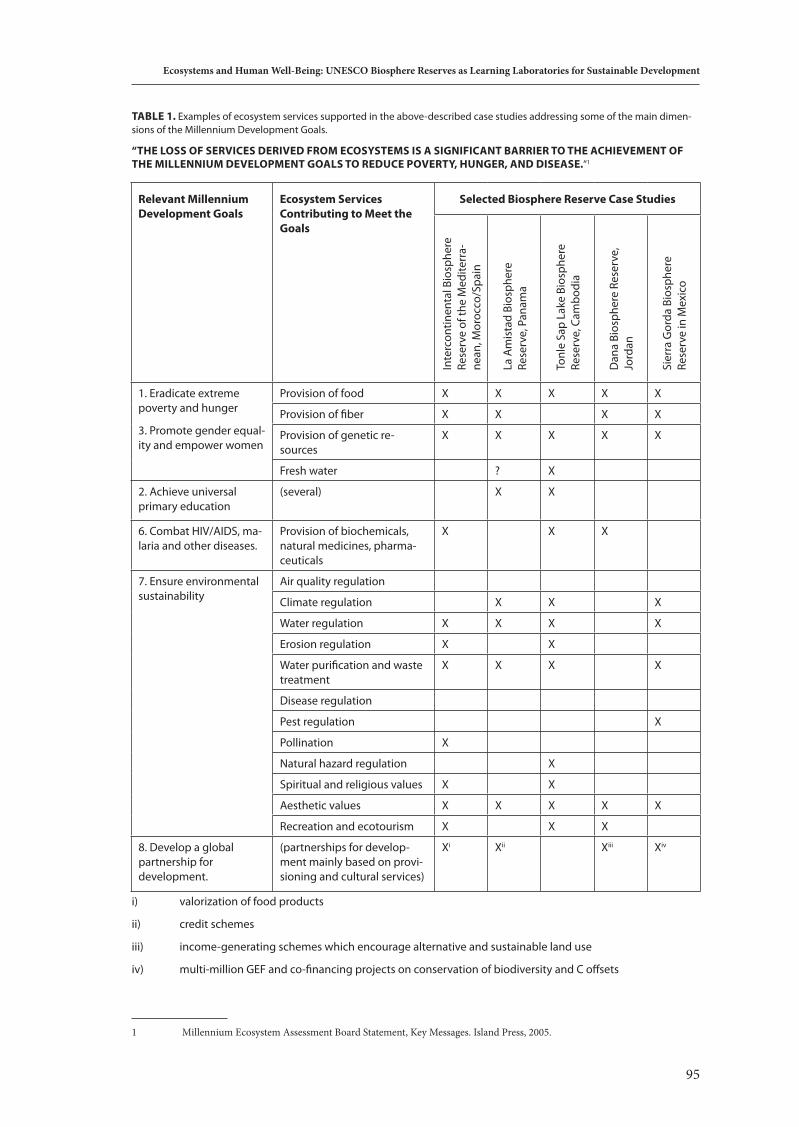
95
Ecosystems and Human Well-Being: UNESCO Biosphere Reserves as Learning Laboratories for Sustainable Development
TABLe 1. Examples of ecosystem services supported in the above-described case studies addressing some of the main dimen-sions of the Millennium Development Goals.
“THe LoSS oF SerVICeS derIVed FroM eCoSYSTeMS IS A SIGNIFICANT BArrIer To THe ACHIeVeMeNT oF THe MILLeNNIUM deVeLoPMeNT GoALS To redUCe PoVerTY, HUNGer, ANd dISeASe.”1
relevant Millennium development Goals
ecosystem Services Contributing to Meet the Goals
Selected Biosphere reserve Case Studies
Inte
rcon
tinen
tal B
iosp
here
Re
serv
e of
the
Med
iterr
a-ne
an, M
oroc
co/S
pain
La A
mis
tad
Bios
pher
e Re
serv
e, P
anam
a
Tonl
e Sa
p La
ke B
iosp
here
Re
serv
e, C
ambo
dia
Dan
a Bi
osph
ere
Rese
rve,
Jo
rdan
Sier
ra G
orda
Bio
sphe
re
Rese
rve
in M
exic
o
1. Eradicate extreme poverty and hunger
3. Promote gender equal-ity and empower women
Provision of food X X X X X
Provision of fiber X X X X
Provision of genetic re-sources
X X X X X
Fresh water ? X
2. Achieve universal primary education
(several) X X
6. Combat HIV/AIDS, ma-laria and other diseases.
Provision of biochemicals, natural medicines, pharma-ceuticals
X X X
7. Ensure environmental sustainability
Air quality regulation
Climate regulation X X X
Water regulation X X X X
Erosion regulation X X
Water purification and waste treatment
X X X X
Disease regulation
Pest regulation X
Pollination X
Natural hazard regulation X
Spiritual and religious values X X
Aesthetic values X X X X X
Recreation and ecotourism X X X
8. Develop a global partnership for development.
(partnerships for develop-ment mainly based on provi-sioning and cultural services)
Xi Xii Xiii Xiv
i) valorization of food products
ii) credit schemes
iii) income-generating schemes which encourage alternative and sustainable land use
iv) multi-million GEF and co-financing projects on conservation of biodiversity and C offsets
1 Millennium Ecosystem Assessment Board Statement, Key Messages. Island Press, 2005.
Protected Areas in Today’s World: Their Values and Benefits for the Welfare of the Planet
96
A
Arico, Salvatore 87
b
Bezaury-Creel, Juan 67Brandon, Katrina 29Bruner, Aaron 29
C
Calvo, Guillen 87Cartaya, Vanessa 67
d
Dudley, Nigel 18, 42
e
Eagles, Paul 77Emerton, Lucy 4
f
Fauzi, Akhmad 67Ford-Lloyd, Brian 42
g
Gil, Lila 67
H
Halim, Abdul 67Higgins-Zogib, Liza 18, 50Hillel, Oliver 77
i
Ishwaran, Natarajan 87
K
Kell, Shelagh 42Kothari, Ashish 57
l
Leon, Fernando 67Lopoukhine, Nikita (Nik) 1
m
Mansourian, Stephanie 18Maxted, Nigel 42
P
Pabon-Zamora, Luis 67Persic, Ana 87
s
Scherl, Lea M. 4Stolton, Sue 18, 42
V
Vega-Lopez, Eduardo 67
index bY AutHor