prospects for decarbonizing california industry through ... · 2 emissions calculated @ 119...
TRANSCRIPT
© 2019 Electric Power Research Institute, Inc. All rights reserved.w w w . e p r i . c o m
Perry StephensPrincipal Technical LeaderSreenidhi KrishnamoorthyEngineer/Scientist III
EPRI – Electrification for Customer Productivity
July 8, 2019
Prospects for Decarbonizing California Industry Through ElectrificationThe Role of the Industrial Sector in Meeting California’s Carbon Neutrality Goals
© 2019 Electric Power Research Institute, Inc. All rights reserved.w w w . e p r i . c o m2
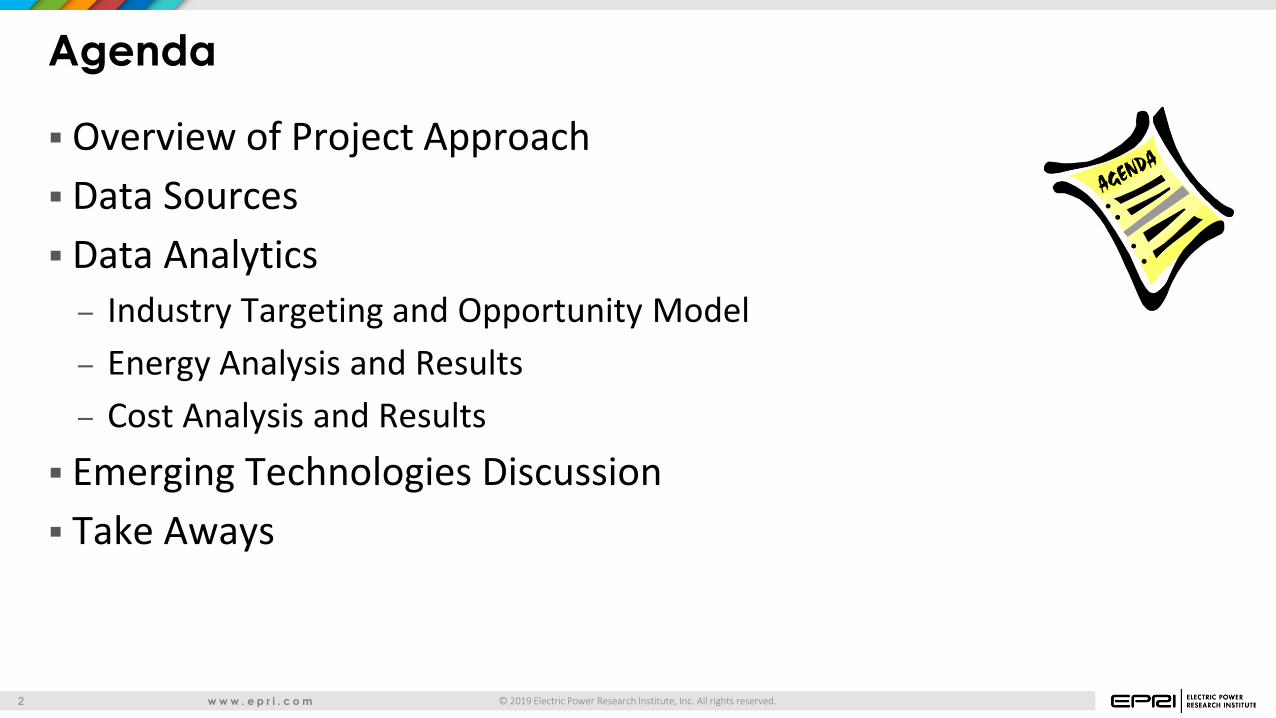
Agenda
Overview of Project Approach Data Sources Data Analytics
– Industry Targeting and Opportunity Model– Energy Analysis and Results– Cost Analysis and Results Emerging Technologies Discussion Take Aways
© 2019 Electric Power Research Institute, Inc. All rights reserved.w w w . e p r i . c o m3
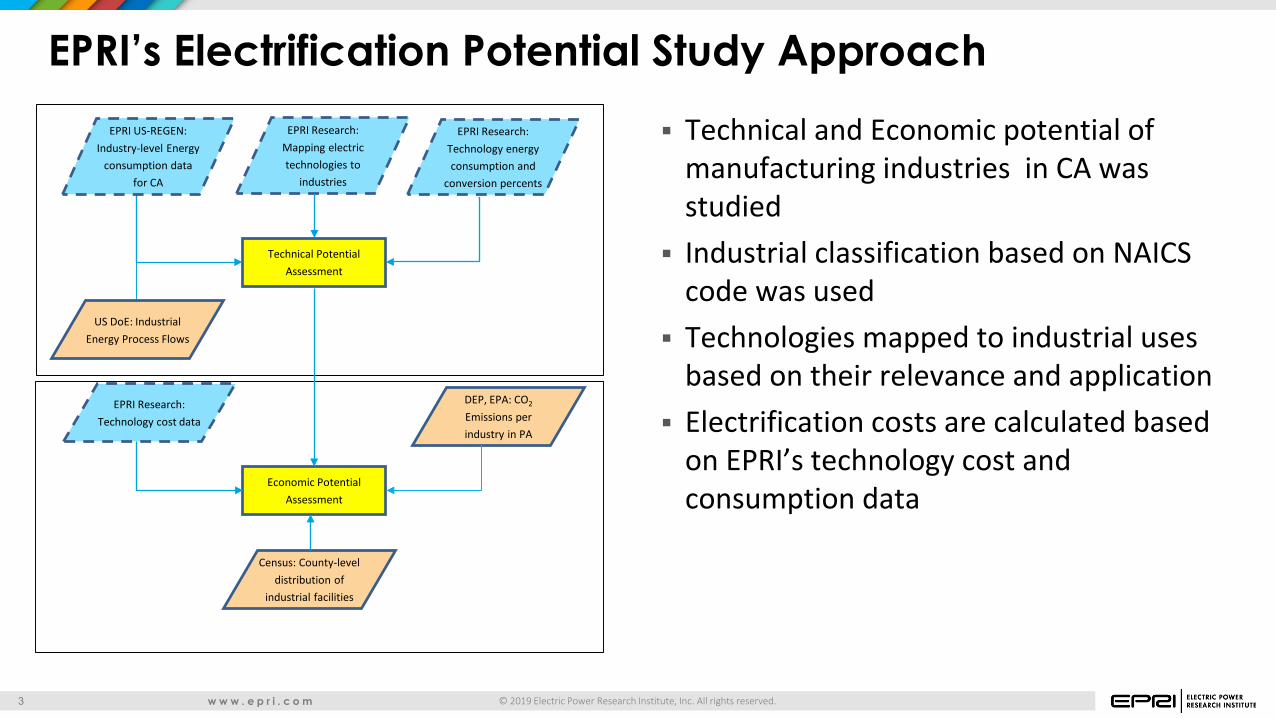
EPRI’s Electrification Potential Study Approach Technical and Economic potential of
manufacturing industries in CA was studied
Industrial classification based on NAICS code was used
Technologies mapped to industrial uses based on their relevance and application
Electrification costs are calculated based on EPRI’s technology cost and consumption data
EPRI Research: Technology cost data
Economic Potential Assessment
Census: County-level distribution of
industrial facilities
DEP, EPA: CO2
Emissions per industry in PA
EPRI Research: Technology energy consumption and
conversion percents
EPRI Research: Mapping electric technologies to
industries
Technical Potential Assessment
EPRI US-REGEN: Industry-level Energy
consumption data for CA
US DoE: Industrial Energy Process Flows
© 2019 Electric Power Research Institute, Inc. All rights reserved.w w w . e p r i . c o m4
Data Collected from External Sources Census Data: Number of enterprises by California counties and NAICS code
– Focused specifically on small, medium, and large enterprises, while excluding micro enterprises (those employing less that 10 people)
California Air Resources Board (ARB) : Emissions of CO2– ARB maintains an annual GHG inventory for California
US Environmental Protection Agency (EPA): Major Facilities that are emitters of CO2– EPA’s F.L.I.G.H.T. data tool provides list of facilities in each industry that are emitters of CO2– Covers nearly 80% of emitters in each industry at state-level
US DoE: Final energy consumption for each industry by fuel type – Sankey Diagrams showing process and non-process energy for Steam and Fossil Fuel
© 2019 Electric Power Research Institute, Inc. All rights reserved.w w w . e p r i . c o m5
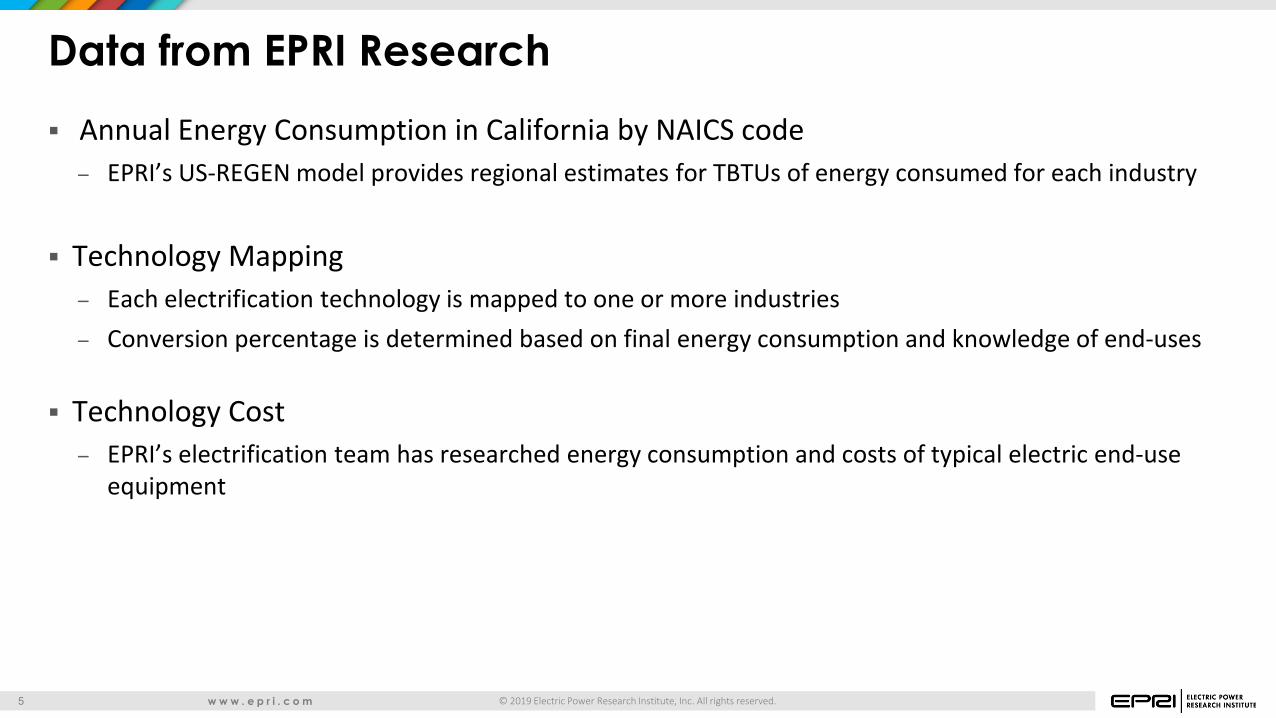
Data from EPRI Research Annual Energy Consumption in California by NAICS code
– EPRI’s US-REGEN model provides regional estimates for TBTUs of energy consumed for each industry
Technology Mapping– Each electrification technology is mapped to one or more industries– Conversion percentage is determined based on final energy consumption and knowledge of end-uses
Technology Cost– EPRI’s electrification team has researched energy consumption and costs of typical electric end-use
equipment
© 2019 Electric Power Research Institute, Inc. All rights reserved.w w w . e p r i . c o m6
0
100
200
300
400
500
600
700
800
900
1,000
AK AL AR AZ CA CO CT DC DE FL GA HI IA ID IL IN KS KY LA MA MD ME MI MN MO MS MT NC ND NE NH NJ NM NV NY OH OK OR PA RI SC SD TN TX UT VA VT WA WI WV WY
Valu
e of
Pro
duct
ion
Bulk chemicals Coal mining Refining Biofuel (ethanol) production Iron and steel (primary and secondary)
Food Paper pulp and wood Cement Aluminum Specialized Manufacturing
Other manufacturing Construction Agriculture Mining (non-energy products)
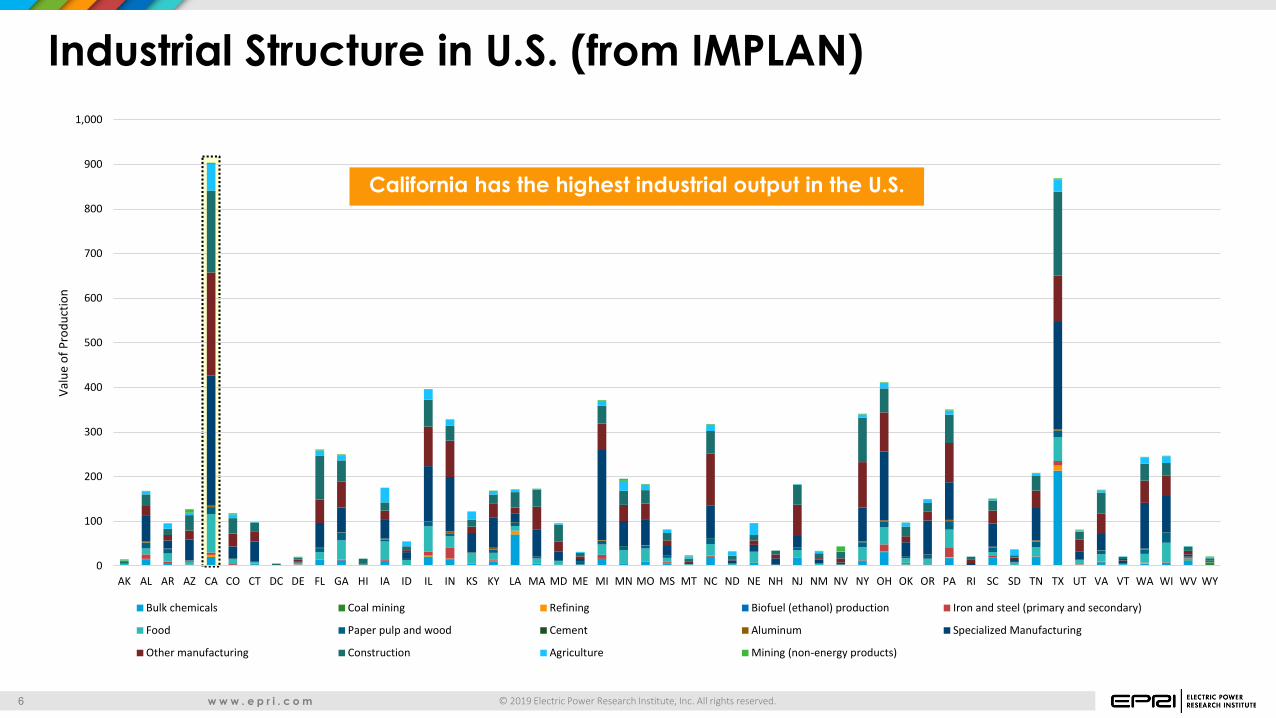
Industrial Structure in U.S. (from IMPLAN)
California has the highest industrial output in the U.S.
© 2019 Electric Power Research Institute, Inc. All rights reserved.w w w . e p r i . c o m7
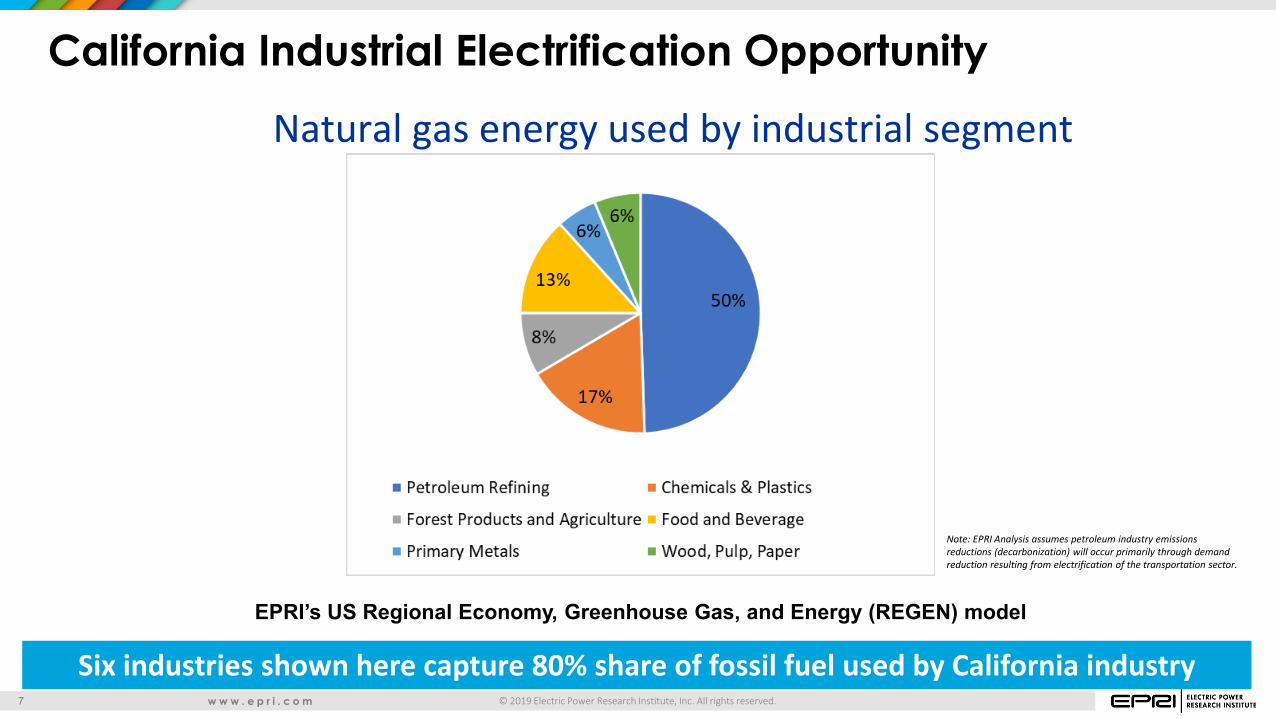
California Industrial Electrification Opportunity
Natural gas energy used by industrial segment
Six industries shown here capture 80% share of fossil fuel used by California industry
Note: EPRI Analysis assumes petroleum industry emissions reductions (decarbonization) will occur primarily through demand reduction resulting from electrification of the transportation sector.
EPRI’s US Regional Economy, Greenhouse Gas, and Energy (REGEN) model
© 2019 Electric Power Research Institute, Inc. All rights reserved.w w w . e p r i . c o m8
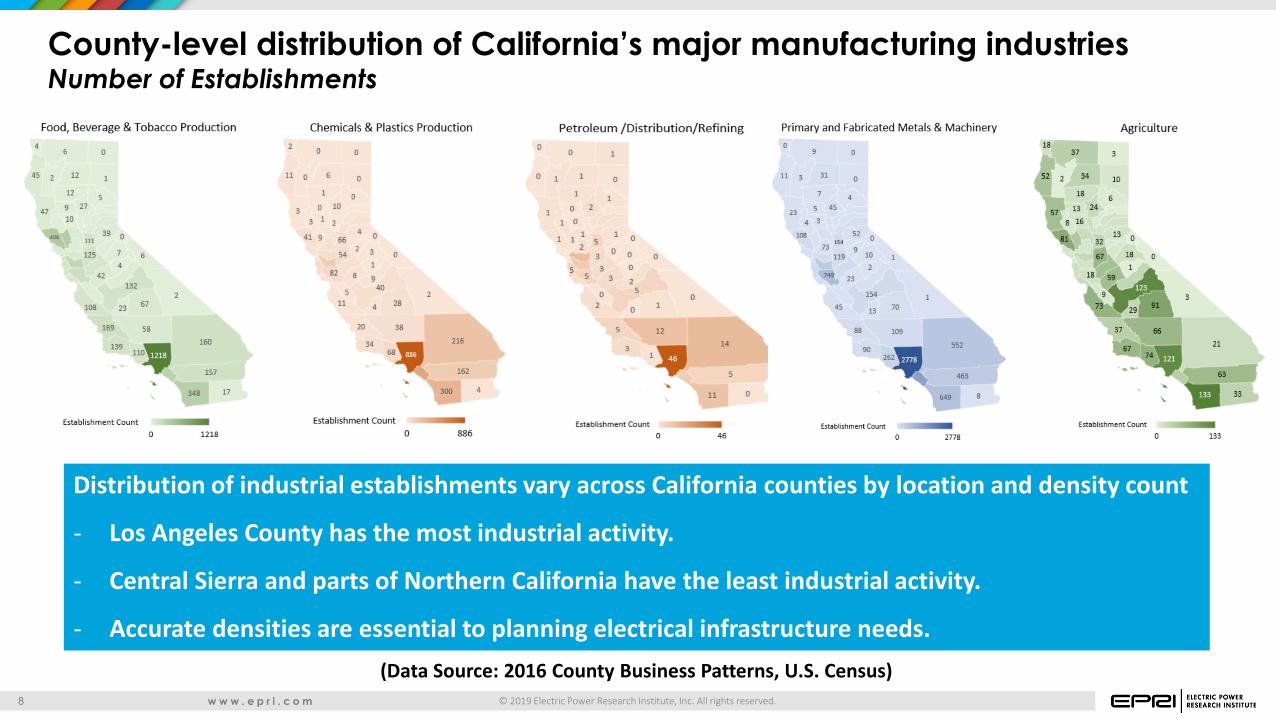
County-level distribution of California’s major manufacturing industriesNumber of Establishments
(Data Source: 2016 County Business Patterns, U.S. Census)
Distribution of industrial establishments vary across California counties by location and density count
- Los Angeles County has the most industrial activity.
- Central Sierra and parts of Northern California have the least industrial activity.
- Accurate densities are essential to planning electrical infrastructure needs.
© 2019 Electric Power Research Institute, Inc. All rights reserved.w w w . e p r i . c o m9
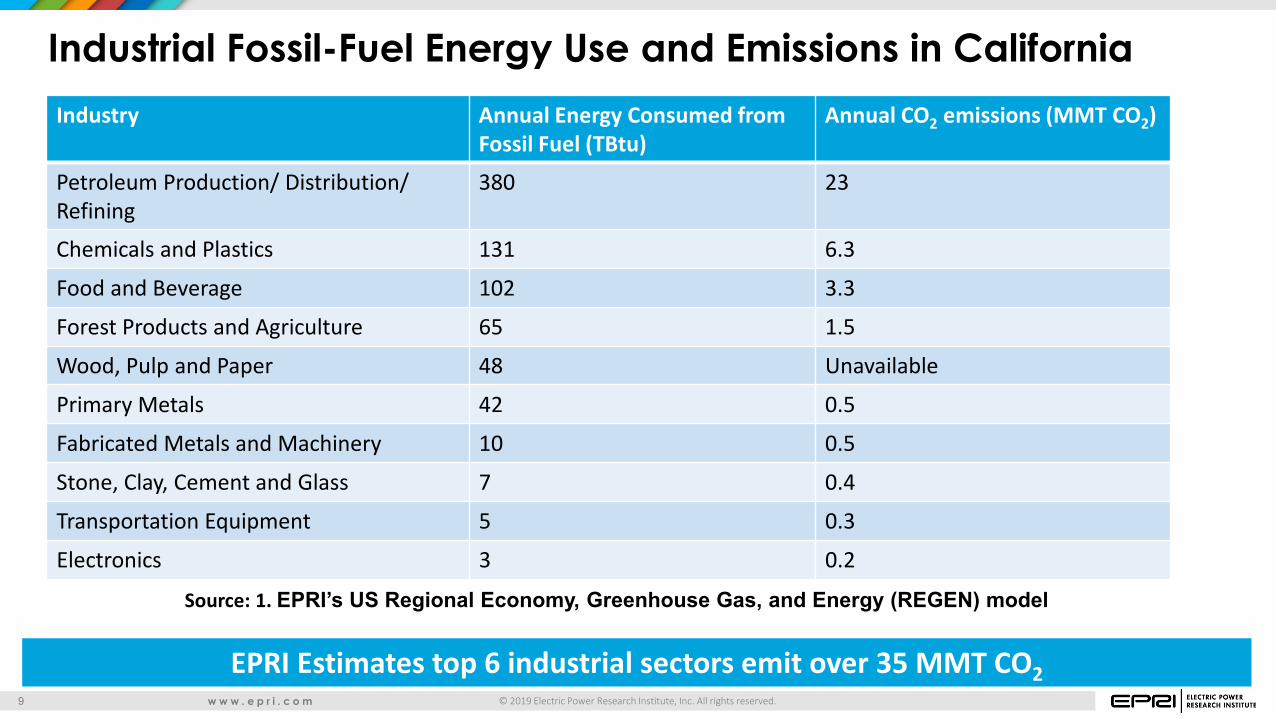
Industrial Fossil-Fuel Energy Use and Emissions in California
Source: 1. EPRI’s US Regional Economy, Greenhouse Gas, and Energy (REGEN) model
Industry Annual Energy Consumed from Fossil Fuel (TBtu)
Annual CO2 emissions (MMT CO2)
Petroleum Production/ Distribution/ Refining
380 23
Chemicals and Plastics 131 6.3
Food and Beverage 102 3.3
Forest Products and Agriculture 65 1.5
Wood, Pulp and Paper 48 Unavailable
Primary Metals 42 0.5
Fabricated Metals and Machinery 10 0.5
Stone, Clay, Cement and Glass 7 0.4
Transportation Equipment 5 0.3
Electronics 3 0.2
EPRI Estimates top 6 industrial sectors emit over 35 MMT CO2
© 2019 Electric Power Research Institute, Inc. All rights reserved.w w w . e p r i . c o m10
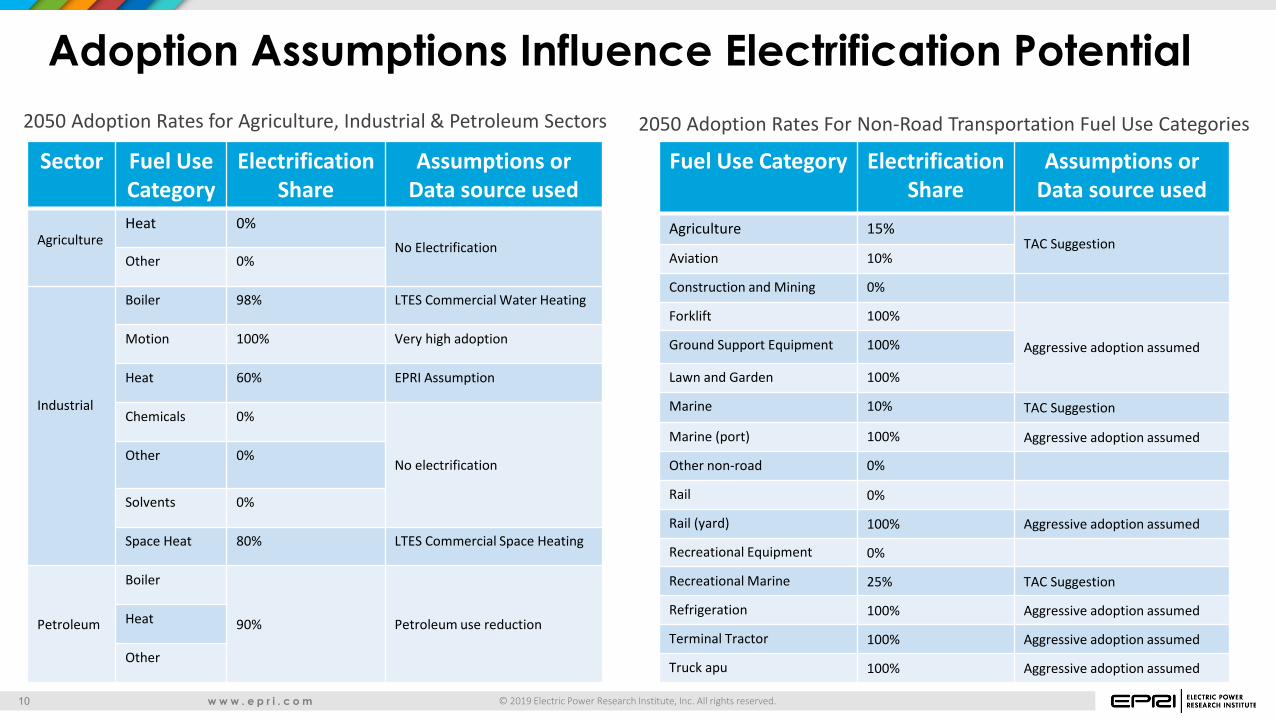
Adoption Assumptions Influence Electrification Potential
Sector Fuel Use Category
Electrification Share
Assumptions or Data source used
AgricultureHeat 0%
No ElectrificationOther 0%
Industrial
Boiler 98% LTES Commercial Water Heating
Motion 100% Very high adoption
Heat 60% EPRI Assumption
Chemicals 0%
No electrificationOther 0%
Solvents 0%
Space Heat 80% LTES Commercial Space Heating
Petroleum
Boiler
90% Petroleum use reductionHeat
Other
Fuel Use Category Electrification Share
Assumptions or Data source used
Agriculture 15%TAC Suggestion
Aviation 10%
Construction and Mining 0%
Forklift 100%
Aggressive adoption assumedGround Support Equipment 100%
Lawn and Garden 100%
Marine 10% TAC Suggestion
Marine (port) 100% Aggressive adoption assumed
Other non-road 0%
Rail 0%
Rail (yard) 100% Aggressive adoption assumed
Recreational Equipment 0%
Recreational Marine 25% TAC Suggestion
Refrigeration 100% Aggressive adoption assumed
Terminal Tractor 100% Aggressive adoption assumed
Truck apu 100% Aggressive adoption assumed
2050 Adoption Rates for Agriculture, Industrial & Petroleum Sectors 2050 Adoption Rates For Non-Road Transportation Fuel Use Categories
© 2019 Electric Power Research Institute, Inc. All rights reserved.w w w . e p r i . c o m11
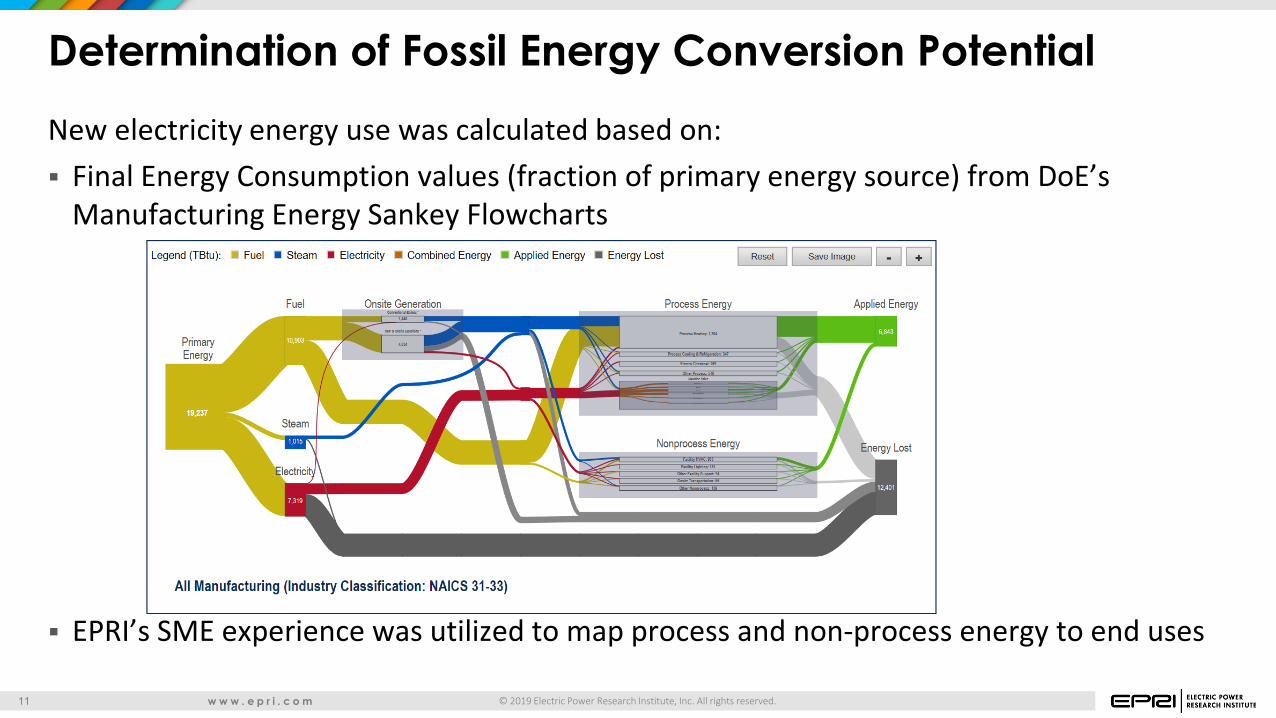
Determination of Fossil Energy Conversion PotentialNew electricity energy use was calculated based on: Final Energy Consumption values (fraction of primary energy source) from DoE’s
Manufacturing Energy Sankey Flowcharts
EPRI’s SME experience was utilized to map process and non-process energy to end uses
© 2019 Electric Power Research Institute, Inc. All rights reserved.w w w . e p r i . c o m12
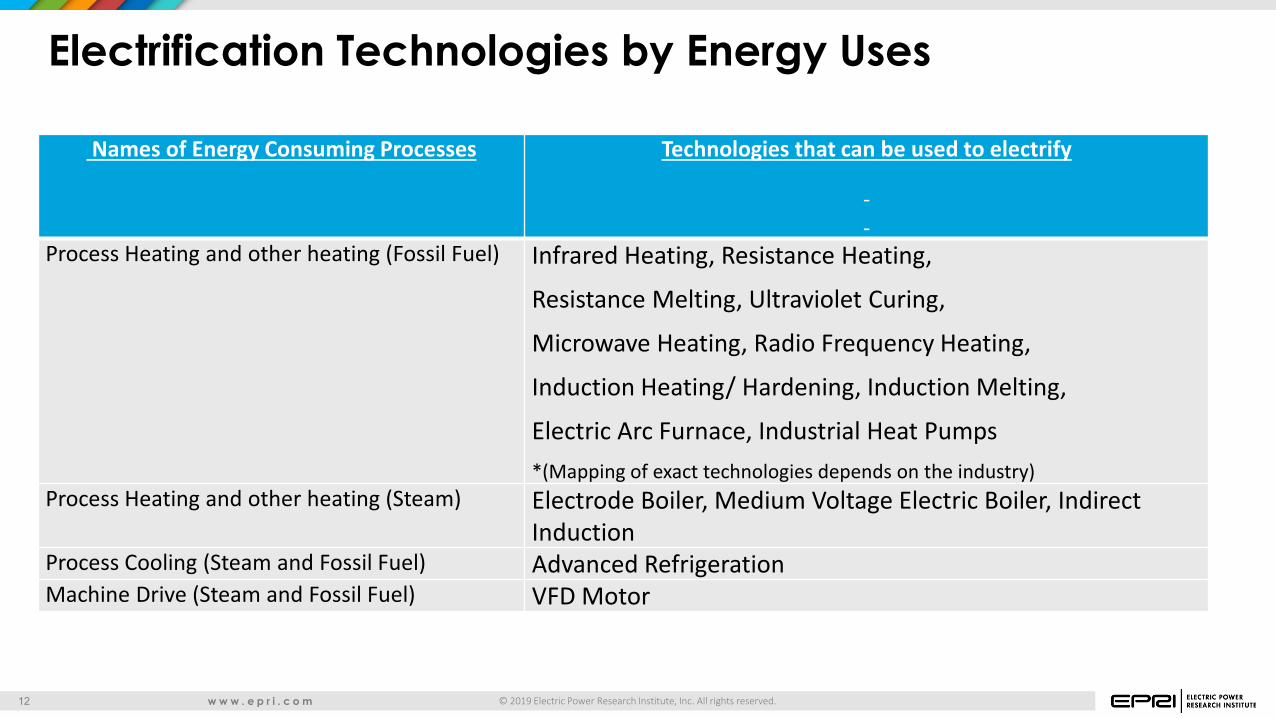
Electrification Technologies by Energy Uses
Names of Energy Consuming Processes Technologies that can be used to electrify
Process Heating and other heating (Fossil Fuel) Infrared Heating, Resistance Heating,
Resistance Melting, Ultraviolet Curing,
Microwave Heating, Radio Frequency Heating,
Induction Heating/ Hardening, Induction Melting,
Electric Arc Furnace, Industrial Heat Pumps*(Mapping of exact technologies depends on the industry)
Process Heating and other heating (Steam) Electrode Boiler, Medium Voltage Electric Boiler, Indirect Induction
Process Cooling (Steam and Fossil Fuel) Advanced RefrigerationMachine Drive (Steam and Fossil Fuel) VFD Motor
© 2019 Electric Power Research Institute, Inc. All rights reserved.w w w . e p r i . c o m13
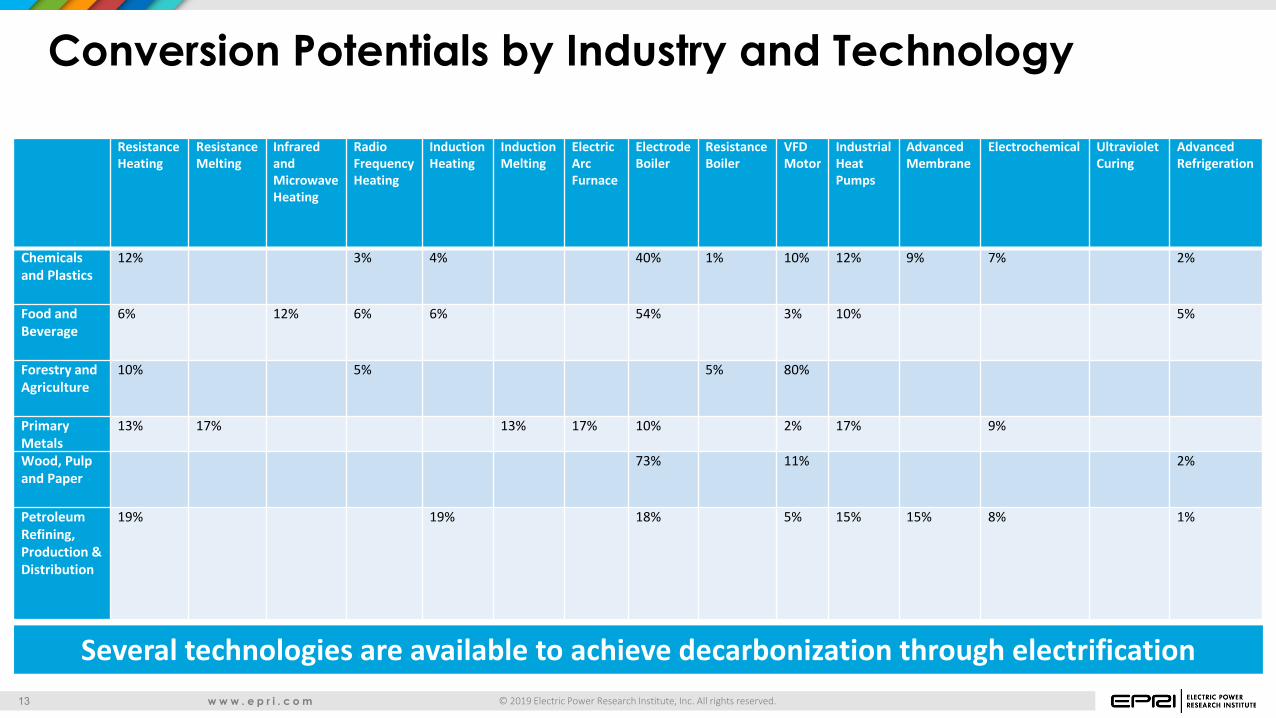
Conversion Potentials by Industry and Technology
Resistance Heating
Resistance Melting
Infrared and Microwave Heating
Radio Frequency Heating
Induction Heating
Induction Melting
Electric Arc Furnace
Electrode Boiler
Resistance Boiler
VFD Motor
Industrial Heat Pumps
Advanced Membrane
Electrochemical Ultraviolet Curing
Advanced Refrigeration
Chemicals and Plastics
12% 3% 4% 40% 1% 10% 12% 9% 7% 2%
Food and Beverage
6% 12% 6% 6% 54% 3% 10% 5%
Forestry and Agriculture
10% 5% 5% 80%
Primary Metals
13% 17% 13% 17% 10% 2% 17% 9%
Wood, Pulp and Paper
73% 11% 2%
Petroleum Refining, Production & Distribution
19% 19% 18% 5% 15% 15% 8% 1%
Several technologies are available to achieve decarbonization through electrification
© 2019 Electric Power Research Institute, Inc. All rights reserved.w w w . e p r i . c o m14
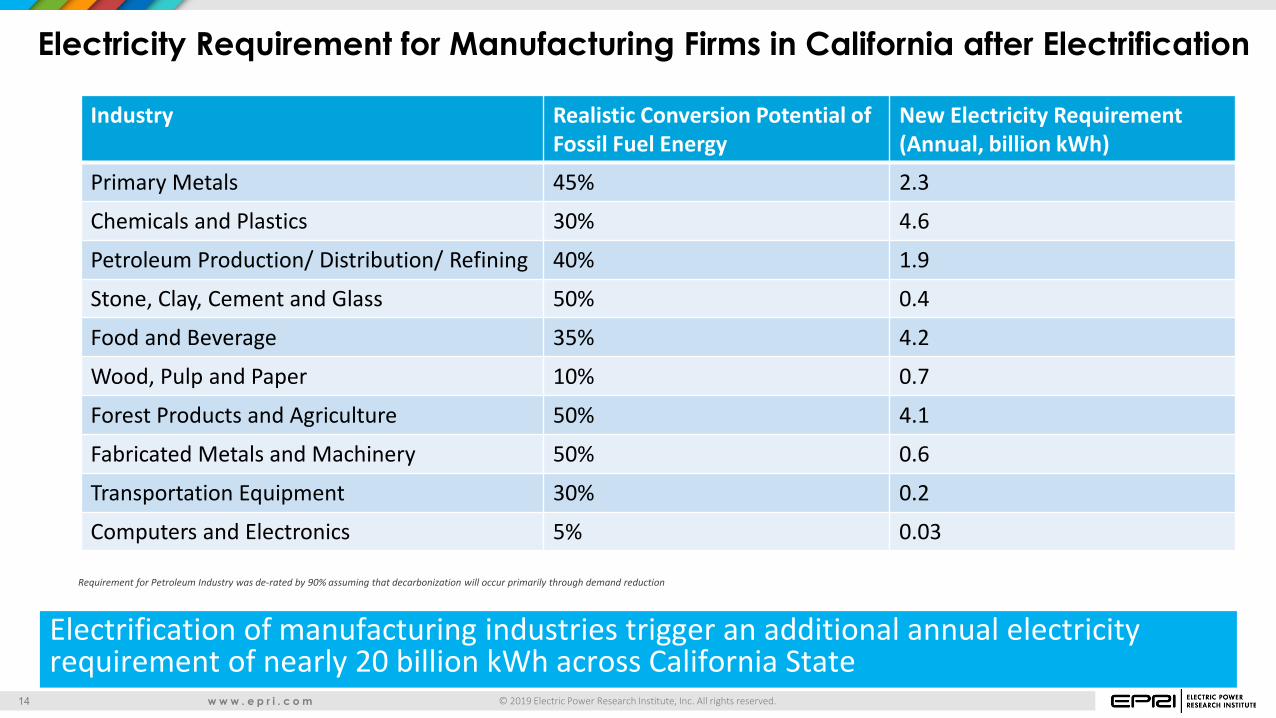
Electricity Requirement for Manufacturing Firms in California after Electrification
Industry Realistic Conversion Potential of Fossil Fuel Energy
New Electricity Requirement (Annual, billion kWh)
Primary Metals 45% 2.3
Chemicals and Plastics 30% 4.6
Petroleum Production/ Distribution/ Refining 40% 1.9
Stone, Clay, Cement and Glass 50% 0.4
Food and Beverage 35% 4.2
Wood, Pulp and Paper 10% 0.7
Forest Products and Agriculture 50% 4.1
Fabricated Metals and Machinery 50% 0.6
Transportation Equipment 30% 0.2
Computers and Electronics 5% 0.03
Electrification of manufacturing industries trigger an additional annual electricity requirement of nearly 20 billion kWh across California State
Requirement for Petroleum Industry was de-rated by 90% assuming that decarbonization will occur primarily through demand reduction
© 2019 Electric Power Research Institute, Inc. All rights reserved.w w w . e p r i . c o m15
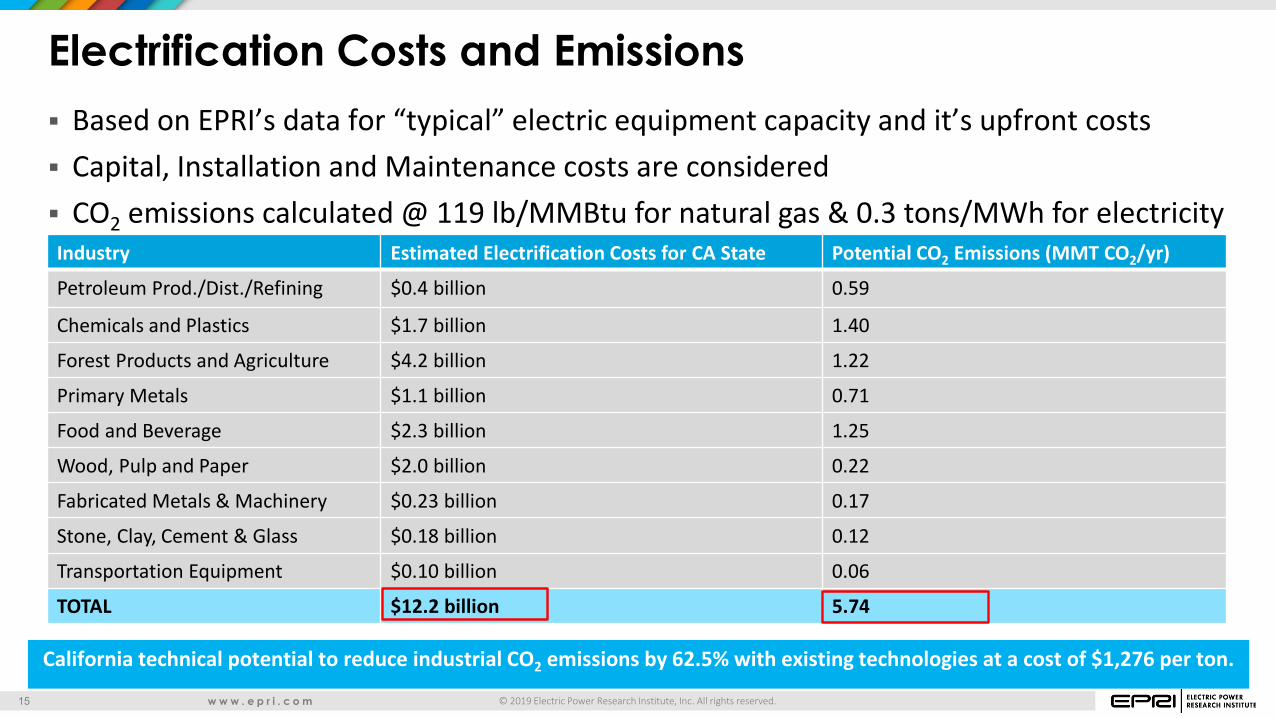
Electrification Costs and Emissions
Industry Estimated Electrification Costs for CA State Potential CO2 Emissions (MMT CO2/yr)
Petroleum Prod./Dist./Refining $0.4 billion 0.59
Chemicals and Plastics $1.7 billion 1.40
Forest Products and Agriculture $4.2 billion 1.22
Primary Metals $1.1 billion 0.71
Food and Beverage $2.3 billion 1.25
Wood, Pulp and Paper $2.0 billion 0.22
Fabricated Metals & Machinery $0.23 billion 0.17
Stone, Clay, Cement & Glass $0.18 billion 0.12
Transportation Equipment $0.10 billion 0.06
TOTAL $12.2 billion 5.74
Based on EPRI’s data for “typical” electric equipment capacity and it’s upfront costs Capital, Installation and Maintenance costs are considered CO2 emissions calculated @ 119 lb/MMBtu for natural gas & 0.3 tons/MWh for electricity
California technical potential to reduce industrial CO2 emissions by 62.5% with existing technologies at a cost of $1,276 per ton.

© 2019 Electric Power Research Institute, Inc. All rights reserved.w w w . e p r i . c o m16
Emerging Technologies
© 2019 Electric Power Research Institute, Inc. All rights reserved.w w w . e p r i . c o m17
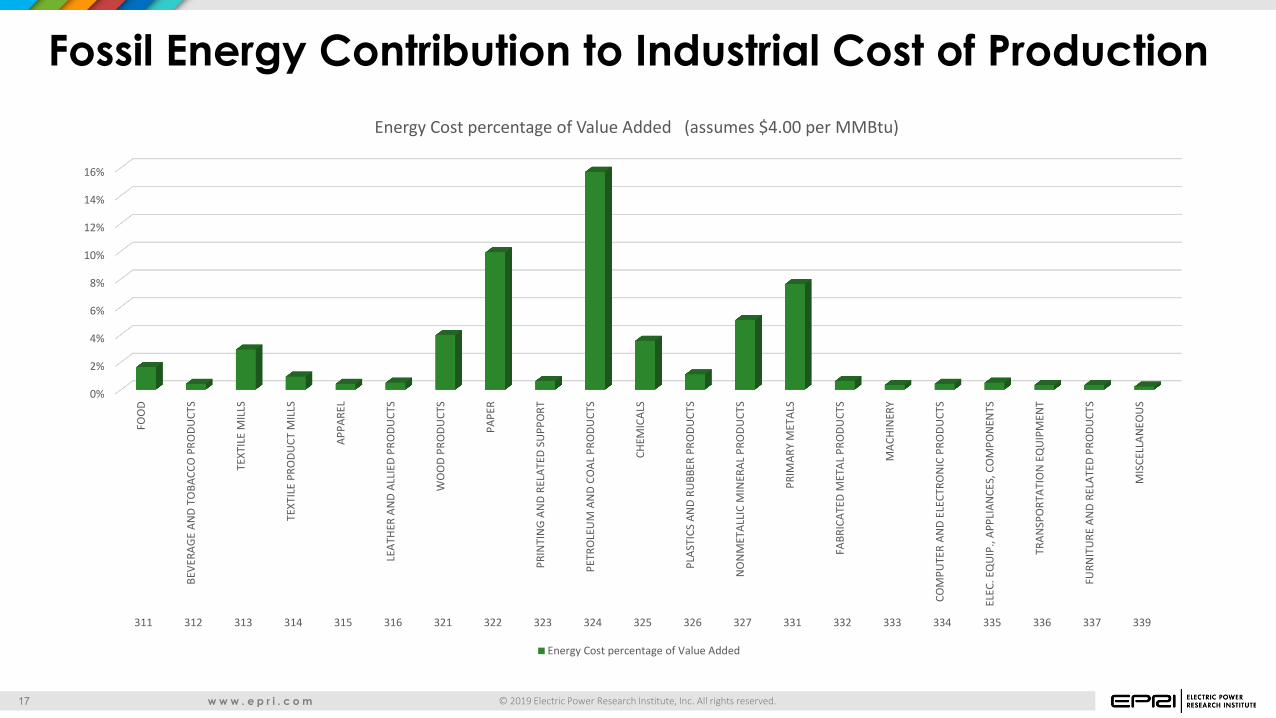
Fossil Energy Contribution to Industrial Cost of Production
0%
2%
4%
6%
8%
10%
12%
14%
16%
FOO
D
BEVE
RAGE
AN
D TO
BACC
O P
RODU
CTS
TEXT
ILE
MIL
LS
TEXT
ILE
PRO
DUCT
MIL
LS
APPA
REL
LEAT
HER
AND
ALLI
ED P
RODU
CTS
WO
OD
PRO
DUCT
S
PAPE
R
PRIN
TIN
G AN
D RE
LATE
D SU
PPO
RT
PETR
OLE
UM
AN
D CO
AL P
RODU
CTS
CHEM
ICAL
S
PLAS
TICS
AN
D RU
BBER
PRO
DUCT
S
NO
NM
ETAL
LIC
MIN
ERAL
PRO
DUCT
S
PRIM
ARY
MET
ALS
FABR
ICAT
ED M
ETAL
PRO
DUCT
S
MAC
HIN
ERY
COM
PUTE
R AN
D EL
ECTR
ON
IC P
RODU
CTS
ELEC
. EQ
UIP
., AP
PLIA
NCE
S, C
OM
PON
ENTS
TRAN
SPO
RTAT
ION
EQ
UIP
MEN
T
FURN
ITU
RE A
ND
RELA
TED
PRO
DUCT
S
MIS
CELL
ANEO
US
311 312 313 314 315 316 321 322 323 324 325 326 327 331 332 333 334 335 336 337 339
Energy Cost percentage of Value Added (assumes $4.00 per MMBtu)
Energy Cost percentage of Value Added

© 2019 Electric Power Research Institute, Inc. All rights reserved.w w w . e p r i . c o m18
Non-Energy Drivers (Benefits) Lean Manufacturing
– Productivity– Product Quality (Scrap & Repair)– Delivery– Process Flexibility– Inventory– Up-time
Labor Cost Raw Material Costs Capital (Equipment & Inventory) MRO, Consumables & Tooling Costs Product Features & New Products Health & Safety Environmental Brand Enhancement
© 2019 Electric Power Research Institute, Inc. All rights reserved.w w w . e p r i . c o m19
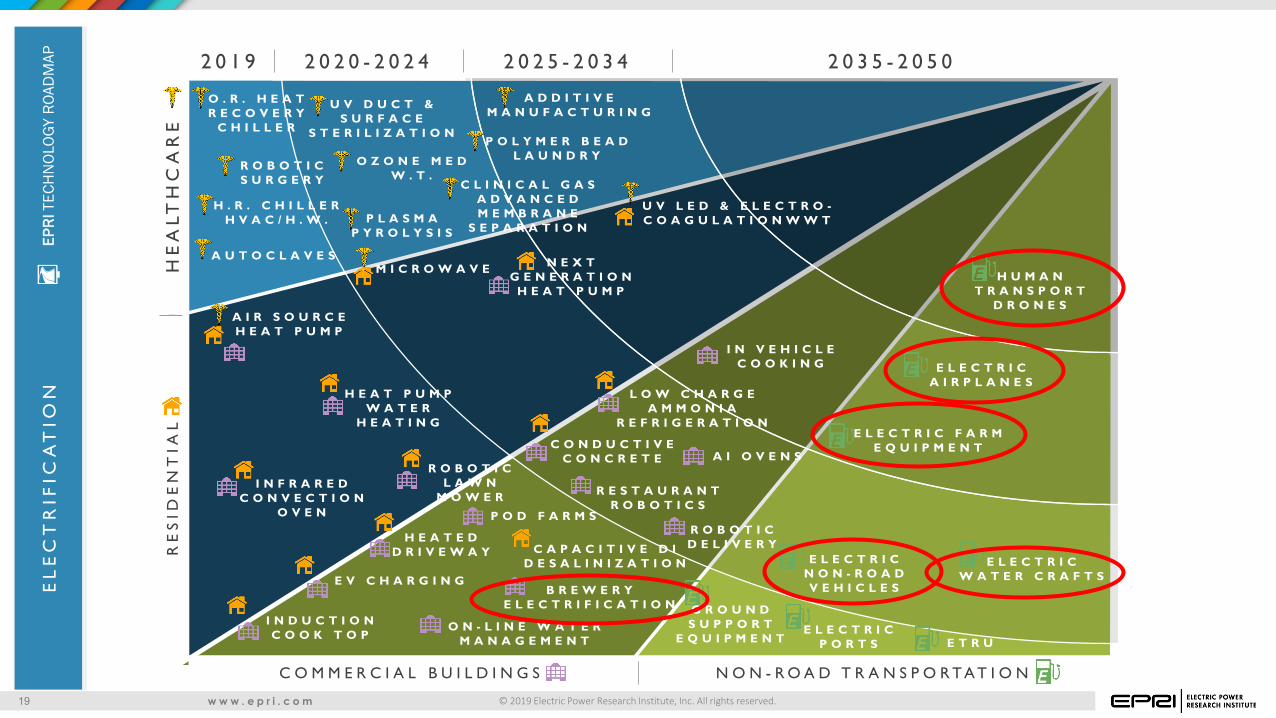
2 0 1 9 2 0 2 0 - 2 0 2 4 2 0 2 5 - 2 0 3 4 2 0 3 5 - 2 0 5 0
HE
ALT
HC
AR
ER
ES
IDE
NT
IAL
C O M M E R C I A L B U I L D I N G S N O N - R O A D T R A N S P O R T A T I O N
U V D U C T & S U R F A C E
S T E R I L I Z A T I O N
N E X T G E N E R A T I O N
H E A T P U M P
O Z O N E M E D W . T .
P O L Y M E R B E A D L A U N D R Y
O . R . H E A T R E C O V E R Y
C H I L L E R
C L I N I C A L G A S A D V A N C E D M E M B R A N E
S E P A R A T I O N
R O B O T I C S U R G E R Y
H E A T P U M P W A T E R
H E A T I N G
A I R S O U R C E H E A T P U M P
I N D U C T I O N C O O K T O P
R O B O T I C L A W N
M O W E R
M I C R O W A V E
P O D F A R M S
U V L E D & E L E C T R O -C O A G U L A T I O N W W T
G R O U N D S U P P O R T
E Q U I P M E N T
I N F R A R E D C O N V E C T I O N
O V E N
C O N D U C T I V E C O N C R E T E
A D D I T I V E M A N U F A C T U R I N G
L O W C H A R G E A M M O N I A
R E F R I G E R A T I O N
A U T O C L A V E S
E L E C T R I C N O N - R O A D V E H I C L E S
R O B O T I CD E L I V E R Y
I N V E H I C L E C O O K I N G
H E A T E D D R I V E W A Y
P L A S M A P Y R O L Y S I S
E V C H A R G I N G
R E S T A U R A N T R O B O T I C S
H . R . C H I L L E R H V A C / H . W .
A I O V E N S
O N - L I N E W A T E R M A N A G E M E N T
B R E W E R Y E L E C T R I F I C A T I O N
C A P A C I T I V E D I D E S A L I N I Z A T I O N
E L E C T R I C P O R T S E T R U
H U M A N T R A N S P O R T
D R O N E S
E L E C T R I C A I R P L A N E S
E L E C T R I C W A T E R C R A F T S
E L E C T R I C F A R M E Q U I P M E N T
EPRI
TEC
HNOL
OGY
ROAD
MAP
EL
EC
TR
IFIC
AT
ION
© 2019 Electric Power Research Institute, Inc. All rights reserved.w w w . e p r i . c o m20
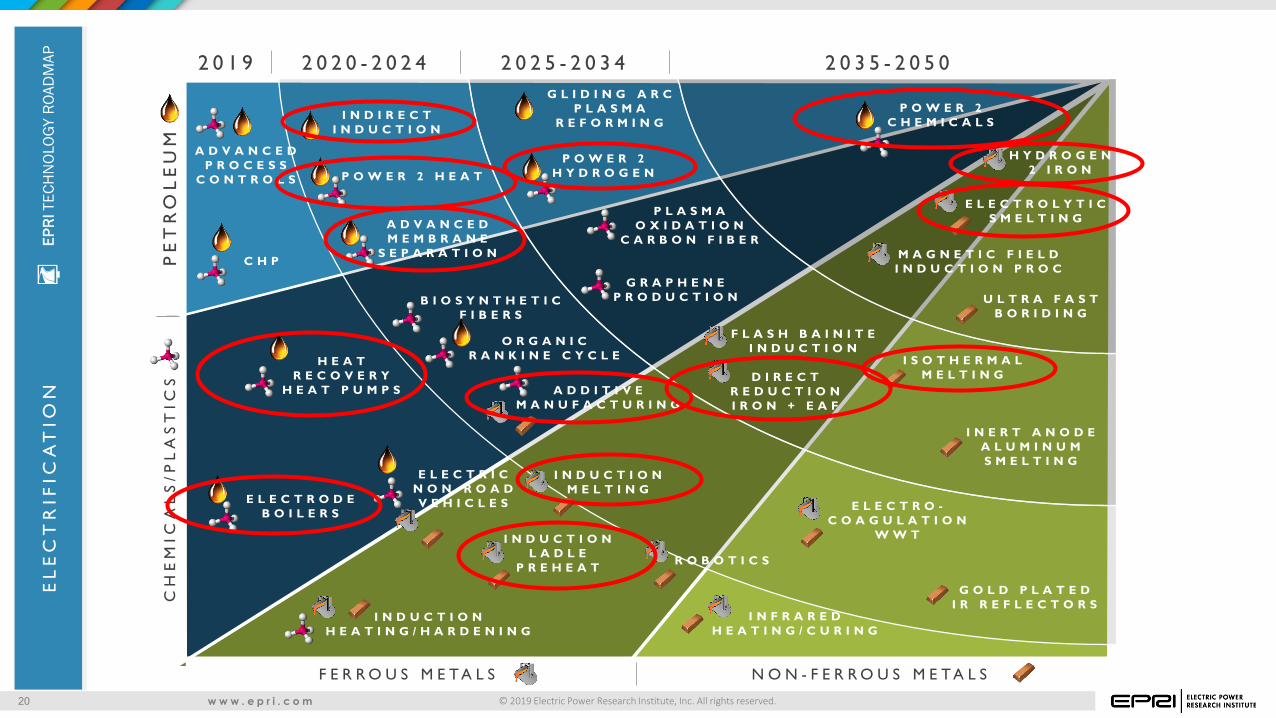
2 0 1 9 2 0 2 0 - 2 0 2 4 2 0 2 5 - 2 0 3 4 2 0 3 5 - 2 0 5 0
PE
TR
OL
EU
MC
HE
MIC
AL
S/P
LA
ST
ICS
F E R R O U S M E T A L S N O N - F E R R O U S M E T A L S
I N D I R E C T I N D U C T I O N
P O W E R 2 H E A TP O W E R 2
H Y D R O G E N
P O W E R 2 C H E M I C A L S
G R A P H E N E P R O D U C T I O N
M A G N E T I C F I E L D I N D U C T I O N P R O C
B I O S Y N T H E T I C F I B E R S
A D V A N C E D M E M B R A N E
S E P A R A T I O N
A D V A N C E D P R O C E S S
C O N T R O L S
H E A T R E C O V E R Y
H E A T P U M P S
C H P
E L E C T R O D E B O I L E R S
I N D U C T I O N L A D L E
P R E H E A T
I N D U C T I O N M E L T I N G
D I R E C T R E D U C T I O NI R O N + E A F
H Y D R O G E N 2 I R O N
E L E C T R O -C O A G U L A T I O N
W W T
G O L D P L A T E D I R R E F L E C T O R S
I N F R A R E D H E A T I N G / C U R I N G
I N D U C T I O N H E A T I N G / H A R D E N I N G
A D D I T I V E M A N U F A C T U R I N G
G L I D I N G A R C P L A S M A
R E F O R M I N G
P L A S M A O X I D A T I O N
C A R B O N F I B E R
E L E C T R I C N O N - R O A D V E H I C L E S
R O B O T I C S
I N E R T A N O D E A L U M I N U M S M E L T I N G
I S O T H E R M A L M E L T I N G
F L A S H B A I N I T E I N D U C T I O N
E L E C T R O L Y T I C S M E L T I N G
U L T R A F A S T B O R I D I N G
EPRI
TEC
HNOL
OGY
ROAD
MAP
EL
EC
TR
IFIC
AT
ION
O R G A N I C R A N K I N E C Y C L E
© 2019 Electric Power Research Institute, Inc. All rights reserved.w w w . e p r i . c o m21
EPRI
TEC
HNOL
OGY
ROAD
MAP
EL
EC
TR
IFIC
AT
ION
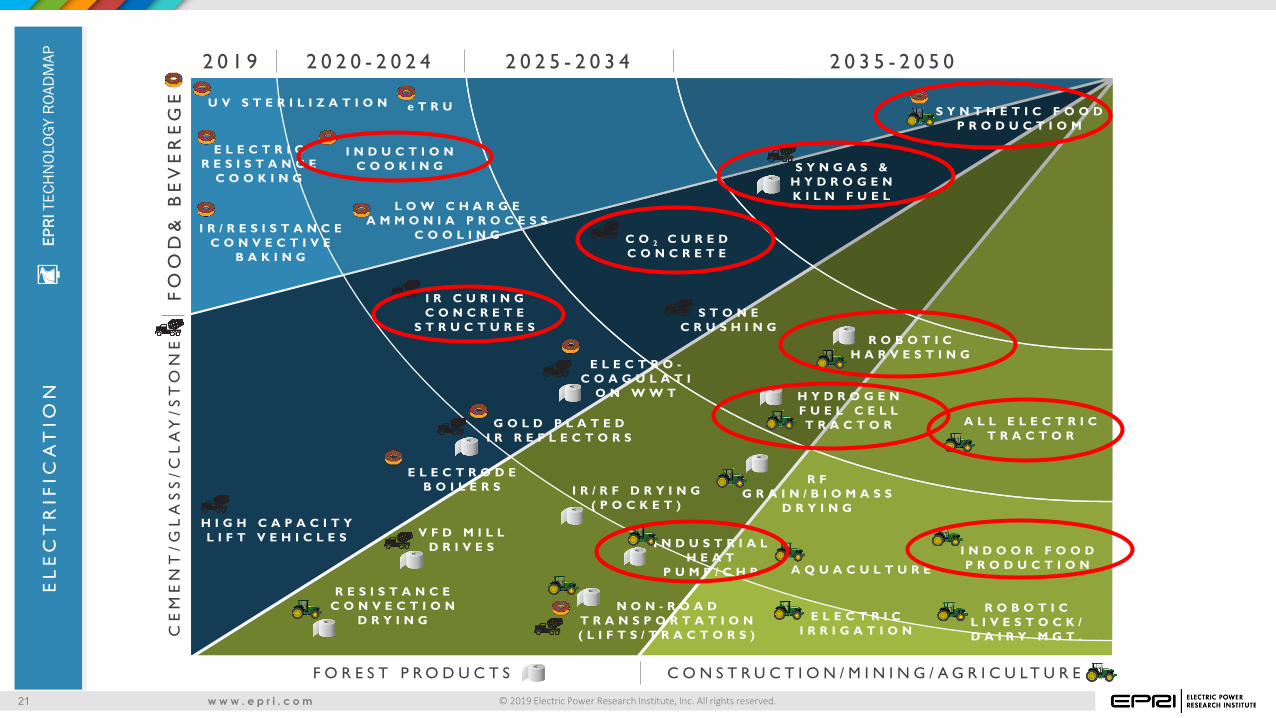
2 0 1 9 2 0 2 0 - 2 0 2 4 2 0 2 5 - 2 0 3 4 2 0 3 5 - 2 0 5 0
FO
OD
& B
EV
ER
EG
EC
EM
EN
T/G
LA
SS
/CL
AY
/ST
ON
E
F O R E S T P R O D U C T S C O N S T R U C T I O N / M I N I N G / A G R I C U L T U R E
U V S T E R I L I Z A T I O N
E L E C T R I C R E S I S T A N C E
C O O K I N G
I N D U C T I O N C O O K I N G
I R C U R I N G C O N C R E T E
S T R U C T U R E S
I R / R E S I S T A N C E C O N V E C T I V E
B A K I N G
H I G H C A P A C I T Y L I F T V E H I C L E S
N O N - R O A D T R A N S P O R T A T I O N ( L I F T S / T R A C T O R S )
R E S I S T A N C E C O N V E C T I O N
D R Y I N G
H Y D R O G E N F U E L C E L L T R A C T O R
S Y N T H E T I C F O O D P R O D U C T I O M
R F G R A I N / B I O M A S S
D R Y I N G
E L E C T R I C I R R I G A T I O N
R O B O T I C L I V E S T O C K /D A I R Y M G T .
I N D U S T R I A L H E A T
P U M P / C H P A Q U A C U L T U R E
I N D O O R F O O D P R O D U C T I O N
S T O N E C R U S H I N G
R O B O T I C H A R V E S T I N G
A L L E L E C T R I C T R A C T O R
I R / R F D R Y I N G ( P O C K E T )
E L E C T R O D E B O I L E R S
S Y N G A S & H Y D R O G E N K I L N F U E L
V F D M I L L D R I V E S
G O L D P L A T E D I R R E F L E C T O R S
E L E C T R O -C O A G U L A T I
O N W W T
e T R U
L O W C H A R G E A M M O N I A P R O C E S S
C O O L I N G C O 2 C U R E D C O N C R E T E

© 2019 Electric Power Research Institute, Inc. All rights reserved.w w w . e p r i . c o m22
Key Findings
© 2019 Electric Power Research Institute, Inc. All rights reserved.w w w . e p r i . c o m23
Summary of Key Take-Aways California has the largest industrial footprint of any state in the US. Six California industries account for 80 percent of the state’s fossil fuel consumption
totaling an estimated 768 Tbtu of electrification opportunity. Industrial process heating end-used are highly concentrated in specific coastal
regions including Los Angeles and surrounding counties and San Francisco Bay area counties. Agriculture and forestry related industries are more broadly dispersed with concentrations in the central valley and costal forests.
Petroleum industry emissions, the state’s largest, are expected to decline inversely proportional to the EV adoption. Electrification in non-road transportation would further reduce refinery related carbon emissions.
A handful of market-ready technologies represent the bulk of near term electrification potential totaling an estimated 20 TWh of additional electrical demand at an estimated cost to California industry of $ 12.2 Billion resulting in 5.74MMT CO2
Economic considerations will drive the need to develop competitive emerging electric technologies to supplant current fossil fuel fired processes in targeted industries.

© 2019 Electric Power Research Institute, Inc. All rights reserved.w w w . e p r i . c o m24
Together…Shaping the Future of Electricity