prosig data acquisition & analysis tools - · pdf filenoise & vibration measurement...
TRANSCRIPT
NOISE & VIBRATION MEASUREMENT HANDBOOK
PROSIG Data Acquisition & Analysis ToolsThird Edition
Prosig offers a free solutions disk that contains details of all Prosig’s products and services and a full set of Prosig Signal Processing Tutorials.
Visit http://www.prosig.com/democd.html to request your copy or contact Prosig using the details on the back of this catalog.
Free CD-ROM Solutions Disk
Technical AdviceWe have specialists experienced in every aspect of data capture and analysis that are at the disposal of our customers. More particularly, Prosig consultancy services can oversee an application from the identification of the problem through to the installation of the appropriate solution.
Sales Support & EvaluationProsig offers comprehensive pre-sales support either direct from our US or UK offices or from our network of global partners. To find out more about our products and what they can do, why not contact us or one of our partners.
There are many ways to experience and evaluate Prosig products. You can visit us at one of the exhibitions and conferences we attend each year. We can visit you and provide tailored demonstrations to suit your particular requirements, often by capturing and analyzing your own data. We may even be able to lend you a system for longer-term evaluation. You could visit us at one of our offices and, of course, we are always available at the end of a phone to answer any questions you might have. Our worldwide group of Distributors are equally keen to provide similar assistance with a local flavor. Why not take the time to discover just how good a Prosig system can be.
Test Equipment RentalIn addition to offering complete test systems for sale, Prosig can provide customers with hire equipment to help solve specific application problems. If you have an urgent requirement or a short-term need to extend your test capabilities then call and ask about our rental systems.
Support & TrainingAll Prosig systems are supplied with initial hardware and software support. Beyond that, we offer cost-effective, annual support contracts for all of our products.
Prosig provides a worldwide maintenance service for hardware under warranty or support contract. Cover includes parts, labor and can include return shipping costs. Repair can be ‘on site’ or ‘return to factory’ depending on the equipment and the speed of response required. Where speed of response is critical, spares may be supplied through local distributors. The calibration service is fully traceable to international standards. We offer UKAS traceable calibration certificates for our range of P8000 products.
DATS software support entitles the user to e-mail and telephone support. This covers every aspect of the software from installation to help in understanding the analysis functions. Also, with a support contract, the user has access to any software updates that are published.
In order to keep customers up to date of the latest information regarding Prosig products, signal capture and signal processing techniques, Prosig passes on its specialist knowledge at exhibitions, trade fairs, conferences, symposia and seminars.
The Prosig Signal Processing Newsletter is published regularly via e-mail. It contains a variety of articles on all aspects of testing, measurement and analysis. To read some previous articles and to sign up for the newsletter visit blog.prosig.com.
Signal Processing Blog & Newsletter
For almost 40 years engineers and scientists have been analyzing their vibration and acoustics data with Prosig signal processing software. Over this time computer platforms have evolved and improved, and so have Prosig data acquisition and analysis systems. The latest P8000 family of Prosig data capture front-ends use the latest 24-bit technology together with high-speed PC communications. The extensive range of analysis software, both real-time and post-processing, is built on signal processing algorithms that have had thousands of hours of testing and refinement. Our customers know they can trust the reliability and accuracy of a Prosig system and can have confidence in the results it produces.
Jim MarshallManaging Director, Prosig
“
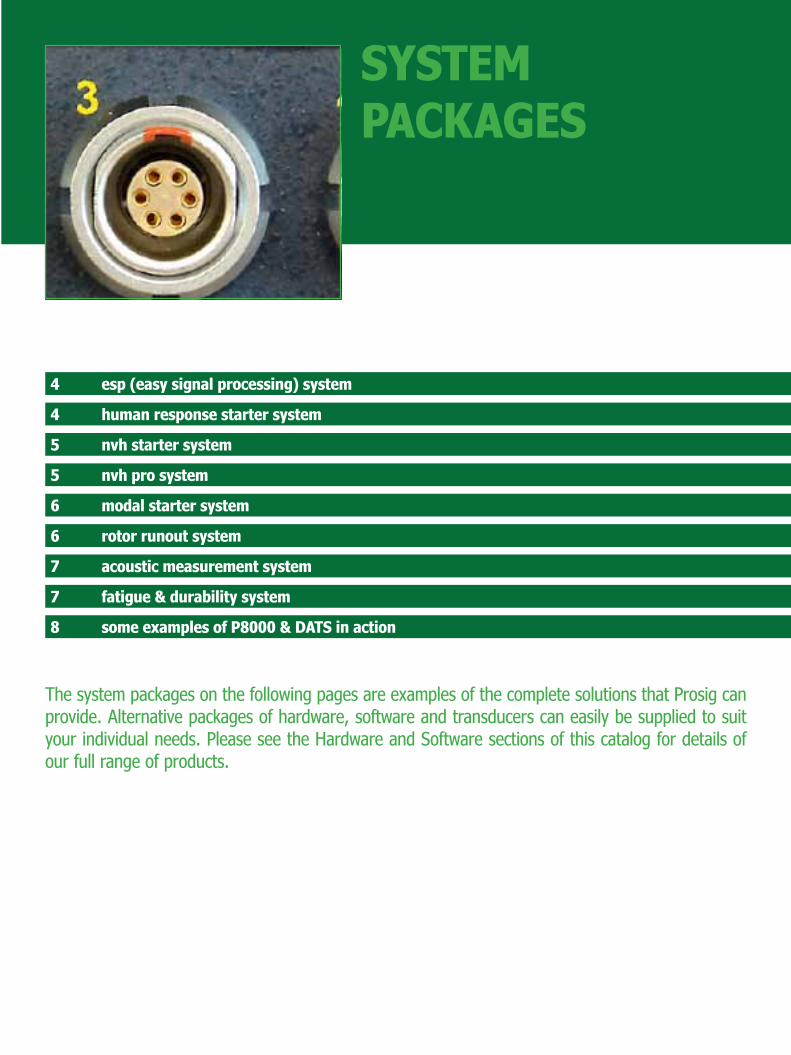
SYSTEM PACKAGES
4 esp (easy signal processing) system
4 human response starter system
5 nvh starter system
5 nvh pro system
6 modal starter system
6 rotor runout system
7 acoustic measurement system
7 fatigue & durability system
8 some examples of P8000 & DATS in action
The system packages on the following pages are examples of the complete solutions that Prosig can provide. Alternative packages of hardware, software and transducers can easily be supplied to suit your individual needs. Please see the Hardware and Software sections of this catalog for details of our full range of products.
http://www.prosig.com +1 248 443 2470 (USA) or contact your [email protected] +44 (0)1329 239925 (UK) local representative
SYSTEM PACKAGES
4
ESP & HUMAN RESPONSE
Sys
tem
Pac
kage
sH
ardw
are
Sof
twar
eCo
nditio
n M
onito
ring
Trai
ning
& S
uppo
rt Easy Signal Processing System
ESP System
03-33-834 ESP (Easy Signal Processing) System including4-channel P8004 and integrated DATS-lite data acquisition & signal processing software.
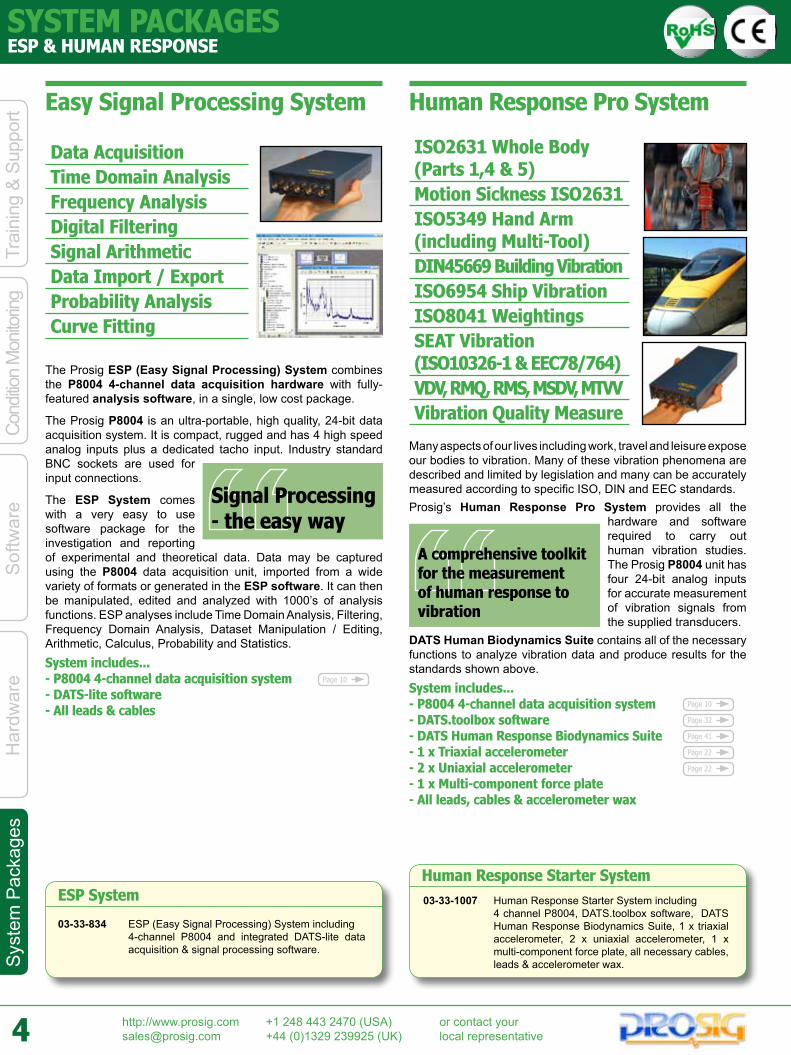
The Prosig ESP (Easy Signal Processing) System combines the P8004 4-channel data acquisition hardware with fully-featured analysis software, in a single, low cost package.
The Prosig P8004 is an ultra-portable, high quality, 24-bit data acquisition system. It is compact, rugged and has 4 high speed analog inputs plus a dedicated tacho input. Industry standard BNC sockets are used for input connections.
The ESP System comes with a very easy to use software package for the investigation and reporting of experimental and theoretical data. Data may be captured using the P8004 data acquisition unit, imported from a wide variety of formats or generated in the ESP software. It can then be manipulated, edited and analyzed with 1000’s of analysis functions. ESP analyses include Time Domain Analysis, Filtering, Frequency Domain Analysis, Dataset Manipulation / Editing, Arithmetic, Calculus, Probability and Statistics.System includes...- P8004 4-channel data acquisition system- DATS-lite software- All leads & cables
Data AcquisitionTime Domain AnalysisFrequency AnalysisDigital FilteringSignal ArithmeticData Import / ExportProbability AnalysisCurve Fitting
Signal Processing - the easy way
Human Response Pro System
Many aspects of our lives including work, travel and leisure expose our bodies to vibration. Many of these vibration phenomena are described and limited by legislation and many can be accurately measured according to specific ISO, DIN and EEC standards. Prosig’s Human Response Pro System provides all the
hardware and software required to carry out human vibration studies. The Prosig P8004 unit has four 24-bit analog inputs for accurate measurement of vibration signals from the supplied transducers.
DATS Human Biodynamics Suite contains all of the necessary functions to analyze vibration data and produce results for the standards shown above.System includes...- P8004 4-channel data acquisition system- DATS.toolbox software- DATS Human Response Biodynamics Suite- 1 x Triaxial accelerometer- 2 x Uniaxial accelerometer- 1 x Multi-component force plate- All leads, cables & accelerometer wax
Human Response Starter System03-33-1007 Human Response Starter System including
4 channel P8004, DATS.toolbox software, DATS Human Response Biodynamics Suite, 1 x triaxial accelerometer, 2 x uniaxial accelerometer, 1 x multi-component force plate, all necessary cables, leads & accelerometer wax.
ISO2631 Whole Body (Parts 1,4 & 5)Motion Sickness ISO2631 ISO5349 Hand Arm (including Multi-Tool)DIN45669 Building VibrationISO6954 Ship VibrationISO8041 WeightingsSEAT Vibration (ISO10326-1 & EEC78/764)VDV, RMQ, RMS, MSDV, MTVVVibration Quality Measure
A comprehensive toolkit for the measurement of human response to vibration
Page 10
Page 32
Page 41
Page 22
Page 22
Page 10

http://www.prosig.com +1 248 443 2470 (USA) or contact your [email protected] +44 (0)1329 239925 (UK) local representative
SYSTEM PACKAGESNVH STARTER & NVH PRO
5
Sys
tem
Pac
kage
sH
ardw
are
Sof
twar
eCo
nditio
n M
onito
ring
Trai
ning
& S
uppo
rtNVH Starter System
The Prosig NVH Starter System is a complete hardware and software bundle that provides a test engineer with everything needed to capture and analyze noise and vibration data. The
Prosig P8004 unit has four 24-bit analog inputs and a dedicated tacho input. Capture speeds of up to 400k samples per second per channel are available.The DATS.nvh package
includes data acquisition software to control the P8004 system and a full analysis & reporting package.Analysis functions are provided for waterfall analysis, order extraction, sound quality metrics, frequency domain processing (FFT, power spectra, etc), digital filtering and much more. Complex multi-channel analysis applications can be easily created using Prosig’s unique Visual Scripting environment.System includes...- P8004 4-channel data acquisition system- DATS.nvh Software package- 1 x Microphone - 3 x Uniaxial Accelerometers- 1 x Ignition lead pickup tachometer sensor- All leads, cables & accelerometer wax
NVH Starter System03-33-1008 NVH Starter System including
4 channel P8004, DATS.nvh software, 1 x microphone, 3 x uniaxial accelerometers, 1 x ignition lead pickup tachometer sensor, all necessary cables, leads & accelerometer wax.
Noise & Vibration Studies• Engine• Transmission• Pump Noise• Muffler / Exhaust• Sub-system & Component Testing
Sound Quality Studies• Vehicle Cabin Noise• Loudness, AI, Harshness etc.
Noise Source IdentificationSound Power Measurement
Everything you need to capture and analyze NVH and refinement data.
NVH Pro System
The Prosig NVH Pro System provides everything that the Starter System contains, but adds extra input channels, CAN-bus capability and more application software. The Prosig P8020 unit is configured with sixteen 24-bit analog inputs, dual CAN-bus inputs and two dedicated tacho inputs.As well as the DATS.nvh software bundle the Pro system adds the Hammer Impact, Psychoacoustics and Structural Animation packages.
System includes...- P8020 16-channel data acquisition system- CAN-bus input- DATS.nvh software package- DATS Hammer Impact software- DATS Psychoacoustic analysis suite- DATS Structural Animation software- 2 x Microphone - 4 x Triaxial Accelerometers- 2 x Uniaxial Accelerometers- 1 x Ignition Lead Pickup Tachometer Sensor- 1 x Impact / Impulse Hammer- 1 x Microphone Calibrator- All leads, cables & accelerometer wax
NVH Pro System03-33-1009 NVH Pro System including
P8020 with 16 analog channels & CAN input, DATS.nvh software, DATS Hammer Impact Software, DATS Structural Animation software, DATS Psychoacoustic software, 2 x microphone, 4 x triaxial accelerometers, 2 x uniaxial accelerometers, 1 x ignition lead pickup tachometer sensor, 1 x impact/impulse hammer, 1 x microphone calibrator, all necessary cables, leads & accelerometer wax.
Noise & Vibration StudiesEngine, Transmission, Pump Noise, Muffler / Exhaust, Steering, Suspension, Sub-systems & Components
Sound Quality StudiesAnimation / ODSPsychoacoustic MetricsNoise Source IdentificationSound Power MeasurementChassis Dynamics
The essential toolkit for high quality, cost effective NVH analysis
Page 11
Page 15
Page 34
Page 39
Page 43
Page 22
Page 39
Page 23
Page 22
Page 22
Page 23
Page 10
Page 34
Page 22
Page 22
Page 23
http://www.prosig.com +1 248 443 2470 (USA) or contact your [email protected] +44 (0)1329 239925 (UK) local representative
SYSTEM PACKAGES
6
MODAL STARTER & ROTOR RUNOUT
Light Portable Rugged
USB 2.0
24 bit IEPECAN
busACDCorTEDSTacho
input
Sys
tem
Pac
kage
sH
ardw
are
Sof
twar
eCo
nditio
n M
onito
ring
Trai
ning
& S
uppo
rt Modal Starter System
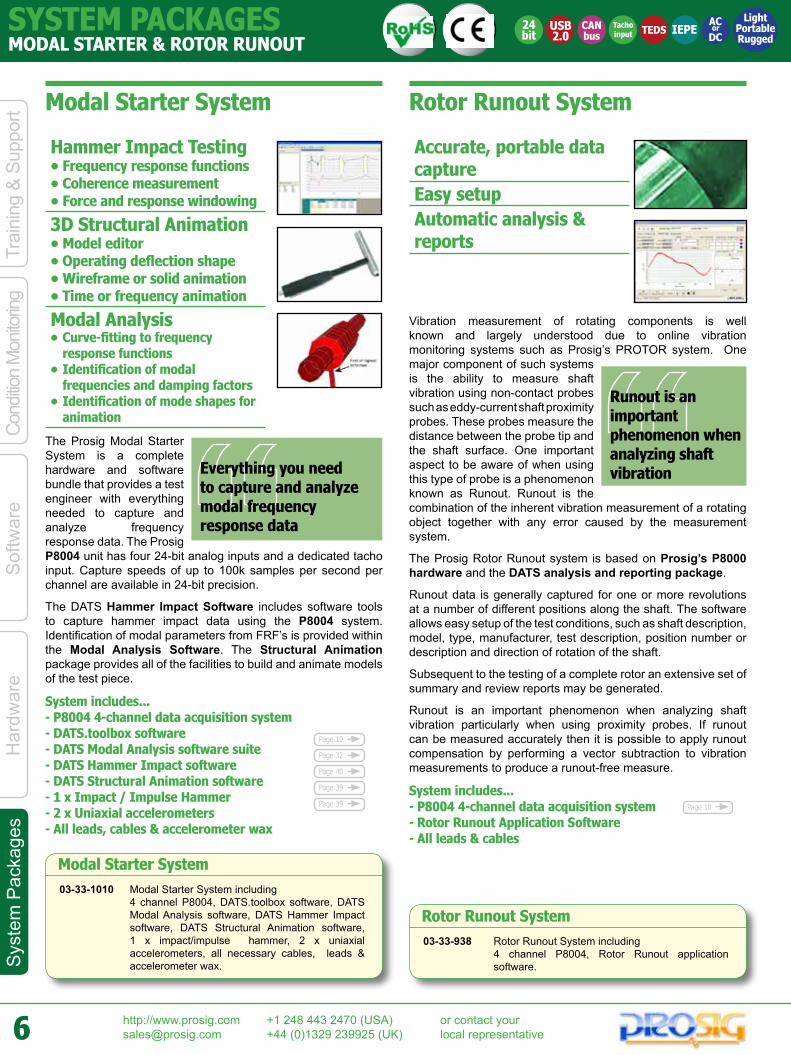
The Prosig Modal Starter System is a complete hardware and software bundle that provides a test engineer with everything needed to capture and analyze frequency response data. The Prosig P8004 unit has four 24-bit analog inputs and a dedicated tacho input. Capture speeds of up to 100k samples per second per channel are available in 24-bit precision.
The DATS Hammer Impact Software includes software tools to capture hammer impact data using the P8004 system. Identification of modal parameters from FRF’s is provided within the Modal Analysis Software. The Structural Animation package provides all of the facilities to build and animate models of the test piece.
System includes...- P8004 4-channel data acquisition system- DATS.toolbox software- DATS Modal Analysis software suite- DATS Hammer Impact software- DATS Structural Animation software- 1 x Impact / Impulse Hammer- 2 x Uniaxial accelerometers- All leads, cables & accelerometer wax
Modal Starter System03-33-1010 Modal Starter System including
4 channel P8004, DATS.toolbox software, DATS Modal Analysis software, DATS Hammer Impact software, DATS Structural Animation software, 1 x impact/impulse hammer, 2 x uniaxial accelerometers, all necessary cables, leads & accelerometer wax.
Hammer Impact Testing• Frequency response functions• Coherence measurement• Force and response windowing
3D Structural Animation• Model editor• Operating deflection shape• Wireframe or solid animation• Time or frequency animation
Modal Analysis• Curve-fitting to frequency
response functions• Identification of modal
frequencies and damping factors • Identification of mode shapes for
animation
Everything you need to capture and analyze modal frequency response data
Rotor Runout System
Vibration measurement of rotating components is well known and largely understood due to online vibration monitoring systems such as Prosig’s PROTOR system. One major component of such systems is the ability to measure shaft vibration using non-contact probes such as eddy-current shaft proximity probes. These probes measure the distance between the probe tip and the shaft surface. One important aspect to be aware of when using this type of probe is a phenomenon known as Runout. Runout is the combination of the inherent vibration measurement of a rotating object together with any error caused by the measurement system.
The Prosig Rotor Runout system is based on Prosig’s P8000 hardware and the DATS analysis and reporting package.
Runout data is generally captured for one or more revolutions at a number of different positions along the shaft. The software allows easy setup of the test conditions, such as shaft description, model, type, manufacturer, test description, position number or description and direction of rotation of the shaft.
Subsequent to the testing of a complete rotor an extensive set of summary and review reports may be generated.
Runout is an important phenomenon when analyzing shaft vibration particularly when using proximity probes. If runout can be measured accurately then it is possible to apply runout compensation by performing a vector subtraction to vibration measurements to produce a runout-free measure.
System includes...- P8004 4-channel data acquisition system- Rotor Runout Application Software- All leads & cables
Rotor Runout System03-33-938 Rotor Runout System including
4 channel P8004, Rotor Runout application software.
Accurate, portable data captureEasy setupAutomatic analysis & reports
Runout is an important phenomenon when analyzing shaft vibration
Page 10
Page 32
Page 40
Page 39
Page 39 Page 10

http://www.prosig.com +1 248 443 2470 (USA) or contact your [email protected] +44 (0)1329 239925 (UK) local representative
SYSTEM PACKAGESACOUSTIC MEASUREMENT & FATIGUE
7
USB 2.0
24 bit IEPE
ACDCorTacho
input
Ultra PortableTEDS
Sys
tem
Pac
kage
sH
ardw
are
Sof
twar
eCo
nditio
n M
onito
ring
Trai
ning
& S
uppo
rtAcoustic Measurement System Fatigue & Durability System
The Acoustic system combines a high quality P8004 measurement system with the rich functionality of the DATS.acoustic software package.The Prosig P8004 is an ultra-portable, high quality, 24-bit data acquisition system. It is compact, rugged and has 4 high speed
analog inputs. Industry standard BNC sockets are used for input connections.The DATS.acoustic package has a complete range of time domain and frequency domain functions from the DATS.toolbox package. In addition it has functions specific to acoustic measurement such as a Sound Level Meter, 1/N Filters, a
Room Acoustics suite, Reverberation Time T60, Total Absorption and so on.
System includes...- P8004 4-channel data acquisition system- DATS.acoustic software package- 4 x Microphones- 1 x Microphone calibrator- All leads & cables
Transportation StudiesTraffic NoiseNoise Level MeasurementHall AcousticsStudio Design
A must-have measurement solution for the serious acoustic engineer or consultant
Acoustic Measurement System03-33-1011 Acoustic Measurement System including
4 channel P8004, DATS.acoustic software, 4 x microphone, 1 x microphone calibrator, all necessary cables and leads.
Life PredictionStress LifeWeld LifeStrain LifeS-N & Є-N CurvesMaterials Database & Editor
In engineering, fatigue can be thought of as a material failure under a repeated or varying load. The measurement of fatigue is an important part of product design. In fact, in applications such as aircraft design it has a critical impact on safety.The Prosig Fatigue & Durability System provides everything needed to successfully instrument a test piece and then capture data and analyze it.The P8020 system comes configured with 20 high speed inputs and is supplied with cables offering bare end inputs. Also included is an initial supply of 200 strain gauges and connection blocks. Glue and cables are also provided.The DATS.fatigue package contains all of the DATS.toolbox facilities (data capture, reporting, visual scripting and so on) plus the specialist analyses required for fatigue analysis.
System includes...- P8020 with 20 analog inputs- 20 x Lemo to bare end cable- DATS.fatigue software package- 200 x strain gages, various types- 200 x strain gage connection blocks- 500 meters 3 core cable- Strain gauge glue- All leads & cables
The measurement of fatigue often has a critical impact on safety
Fatigue & Durability System03-33-1012 Fatigue & Durability System including
20-channel P8020, DATS.fatigue software, 20 x Lemo to bare end cables, 200 x strain gauge, 200 x strain gauge connection blocks, 100 metres 3-core cable, strain gauge glue, all necessary cables and leads.
Page 10
Page 37
Page 11
Some examples of the P8000 and DATS in actionThere are many obvious uses for the P8000, DATS and the related application packages. For instance, automotive companies worldwide use the P8000 and DATS NVH software for their refinement testing. Below are some of the more diverse applications that the systems has been used for...
Brake Squeal Evaluation on High Performance Vehicle
The customer uses microphones, accelerometers, thermocouples & pressure transducers attached to a performance vehicle to measure brake squeal events. A Prosig P8020 is used to capture, store and analyse all significant events during a two hour road test. Sophisticated pre- and post-trigger capture along with data visualisation in DATS helps to achieve a better understanding of brake squeal. The Prosig system was selected after similar, competitive systems were unable to cope with the environmental and capture/analysis requirements.
Measurement of Vibration and Pressure in Rocket Motor
The digital control lines of the firing control sequence from solid propellant rocket motors are used to control a Prosig P8048, which measures vibration and pressure signals. The P8048 system is configured with a digital control module and custom acquisition software for transducer calibration, automatic data structuring and rocket test sequence measurement.
Assessment of Human Exposure to Vibration
A Prosig P8004 and the DATS Human Biodynamics Analysis Suite is used to make assessments on the exposure of the human body to vibration data. The data is captured on a moving train. Health and comfort criteria are calculated according to various ISO standards and provided to the user in the form of standard reports. The end-user has used many of the results in expert testimony work in legal cases.
Evaluation of Vibration in Industrial Packaging Robot
A Prosig system is used to simultaneously capture CAN-bus data and vibration signals on an industrial robot. The robot is controlled by a CAN-bus and the Prosig P8000 measures the relationship between sending commands to the robot and seeing the vibration effects caused by the displacement of the hydraulics. The combination of CAN-bus and vibration measurement make the P8000 an ideal fit for this application.
Testing in Low Temperature Transonic Wind Tunnel
A high channel-count P8048 system is used to capture the vibration signals from an aircraft model sited in a wind tunnel that can operate at temperatures as low as -261C and flow speeds as high as Mach 1.3. Strain and acceleration measurements at various locations on the body of the model are taken over a preset range of tunnel conditions. An additional 8-channel Prosig system monitors the real-time forces and moments experienced by the balance gauge mounted inside the model.
Investigation of Road Surface Materials
The customer uses a Prosig P8004 connected to a custom triaxial accelerometer to study tarmac surfaces. As a car moves over a road it causes a ripple in the road surface. DATS is used to derive displacement from the measured accelerations. The results are used to study different types of surface and changes due to humidity and temperature. The goal is to find a surface that does not flex and break, but is not too rigid.
Monitoring Flow in New Domestic Water Meter
Prosig have supplied a turnkey industrial monitoring system that measures the accuracy of an innovative new design of domestic water meter. A P8020 system is used to capture pre-conditioned fluid pressure signals together with other test rig control parameters such as temperatures and pressures. Advanced pulse analysis software in DATS processes the captured signals and produces detailed reports that compare meter performance at different flow rates under various test conditions.
Motorcycle Helmet Compliance Testing
A weight is dropped on to a motor cycle helmet mounted on a dummy head. The acceleration of the weight and helmet is measured. Different acceleration profiles must be achieved for different test standards. The DATS Biomechanics software is used to check if the test has met the required profile and to verify whether the helmet meets the necessary standards.
Pre-build Assessment of Vibration in Tower Block
The customer needs to check whether noise and vibration from an underground train line is going to cause a nuisance in a proposed multi- storey housing block. A sophisticated measuring system based on a triaxial accelerometer is connected to a Prosig P8000, which is used to capture the data. The results of further analysis are used to determine if the noise and vibration of the trains will fall within prescribed limits.
Testing Seats Against ISO/ANSI Standards
A Prosig P8000 system is used to measure vibrations at defined points on seats designed for commercial / industrial / agricultural vehicles. The seats are tested on a 3-axis shaker rig while suitably loaded. The DATS Human Response software is then used to check that the seat complies with the relevant standard.
HARDWARE PRODUCTS
10 P8004
11 P8012 / P8020
12 P8048
13 P8000 cards
17 “made to measure”
20 “what are dB, noise floor & dynamic range”
22 P8000 measurement transducers
24 “strain gauges explained”
24 “modern accelerometer mounting methods”
29 P8000 accessories

http://www.prosig.com +1 248 443 2470 (USA) or contact your [email protected] +44 (0)1329 239925 (UK) local representative
HARDWARE PRODUCTS
10
DATA ACQUISITION SYSTEMS
Ultra Portable
USB 2.0
24 bit
IEPE
ACDCor TEDS
Tacho input
Sys
tem
Pac
kage
sH
ardw
are
Sof
twar
eCo
nditio
n M
onito
ring
Trai
ning
& S
uppo
rt
P8004 - Ultra Portable 4-Channel system
• Small, light, ultra portable• 24-bit precision• Sample at up to 400k samples/second/channel• 4 analog channels plus tacho input• 105dB dynamic range• -120dB noise floor• USB 2.0
The Prosig P8004 is an ultra portable, high quality, 24-bit data acquisition system. It has 4 analog inputs plus a dedicated tacho input. Input connection is via industry standard BNC connectors. Each input can be configured for AC/DC or IEPE with programmable gain and anti-alias filter.
System
Analog inputs 4 channels plus tacho input Maximum sampling
rate100k samples/sec per channel (24 bit)400k samples/sec per channel (16 bit)
Tacho input and external trigger
Programmable ±28V
Programmability All features under software controlResolution 24 bit
Overall accuracy ± 0.10% full scaleNon-linearity Less than 1LSB
Input voltage range ±10mV to ±10VInput impedance 1Mohm
Analog over voltage protection
± 24V
Communications USB 2.0Signal Conditioning
Signal inputs Direct voltageIEPE with TEDS
Anti-alias protection >100dBAutozero Signal autozero and amplifier
autozeroDC offset control ±50% full scale range in 32768 steps
Dynamic range 105dBNoise floor -120dB
Environmental
Shock and vibration Suitable for mobile use (10g rms)Operating temperature 0oC to +40oC (32oF to +104oF)
Humidity 80% RH, non-condensingWeight 1 kg (2.2 lbs)
General
Power usage <6WSupply voltage Choice of 10-17V DC (e.g. vehicle bat-
tery) or AC mains (adapter supplied)Connectors BNC
Dimensions† (H x W x D)
50mm x 120mm x 240mm (2” x 4.7” x 9.4”)
† Dimensions are measured exclusive of any handles or other attachments

http://www.prosig.com +1 248 443 2470 (USA) or contact your [email protected] +44 (0)1329 239925 (UK) local representative
HARDWARE PRODUCTSDATA ACQUISITION SYSTEMS
11
Sys
tem
Pac
kage
sH
ardw
are
Sof
twar
eCo
nditio
n M
onito
ring
Trai
ning
& S
uppo
rt
Light Portable Rugged
USB 2.0
24 bit
IEPE CAN bus
ACDCor TEDS
Charge input
Tacho input
DAC
oCoF
Bridge
• P8012 - 3 card chassis• P8020 - 5 card chassis• Configurable channel options• 24-bit precision• Up to 100k samples/sec/channel (24bit)• Up to 400k samples/sec/channel (16bit)• Up to 40 analog channels plus tacho
The P8012 supports 24 analog inputs plus two dedicated tacho inputs. The P8020 supports up to 40 analog inputs plus two tachos. Units can be stacked to expand the system up to 160 channels. Various input options are available. These include analog, thermocouple, strain gauge, high speed tacho, charge, CAN and GPS. Each option is complete with programmable signal conditioning, that is controlled by the DATS™ software. Each input card can be programmed to sample at its own rate.
Available cards are:4ch ADC + Tacho, IEPE, Direct (03-33-8402)4ch ADC + Tacho, IEPE, Direct, Bridge (03-33-8404)8ch ADC + Tacho, IEPE, Direct (03-33-8412)8ch ADC + Tacho, Direct, Bridge (03-33-8414)8ch Thermocouple (03-33-8408)4ch Advanced Tacho (03-33-8420)2ch/4ch DAC, Digital I/O (03-33-8424)4ch ADC + Tacho, Charge Input (03-33-8405)CAN, GPS (03-33-8440)
P8020
P8012
P8012 & P8020 - Portable 24-bit Data Acquisition
SystemAnalog inputs Up to 40 channels plus tachos
Expansion Flexible packaging optionsSplit rate sampling Multiple sampling rates can run
concurrently on separate cardsProgrammability All features under software
controlCommunications USB 2.0
EnvironmentalShock and vibration Suitable for mobile use (7g rms)
Operating temperature 0oC to +40oC (32oF to +104oF)Humidity 80% RH, non-condensing
Weight Dependent on configuration, channel count & chassis
GeneralSupply voltage Choice of 10-17V DC (e.g.
vehicle battery) or AC mains (adapter supplied)
Dimensions† P8012 (H x W x D)
50mm x 290mm x 270mm (2.0” x 11.4” x 9.4”)
P8020 50mm x 380mm x 330mm(2.0” x 15.0” x 13.0”)
† Dimensions are measured exclusive of any handles or other attachments

http://www.prosig.com +1 248 443 2470 (USA) or contact your [email protected] +44 (0)1329 239925 (UK) local representative
HARDWARE PRODUCTS
12
DATA ACQUISITION SYSTEMS
Sys
tem
Pac
kage
sH
ardw
are
Sof
twar
eCo
nditio
n M
onito
ring
Trai
ning
& S
uppo
rtUSB 2.0
24 bit
IEPE CAN bus
ACDCor TEDS
Charge input
Tacho input
DAC
oCoF
Bridge Up to 1024
channels
• High channel count• 12 card chassis• Standalone or rack mount• 24-bit precision• Up to 100k samples/sec/channel (24bit)• Up to 400k samples/sec/channel (16bit)• Up to 1024 channels• Configurable channel options
P8048 - High Channel Count System
The P8048 is the high channel count version of the Prosig P8000 24-bit data acquisition system. It has all the same signal conditioning as the P8012/P8020. It can also be configured with all the same cards as follows;
Available cards are:4ch ADC + Tacho, IEPE, Direct (03-33-8502)4ch ADC + Tacho, IEPE, Direct, Bridge (03-33-8504)8ch ADC + Tacho, IEPE, Direct (03-33-8512)8ch ADC + Tacho, Direct, Bridge (03-33-8514)8ch Thermocouple (03-33-8508)4ch Advanced Tacho (03-33-8520)2ch/4ch DAC, Digital I/O (03-33-8524)4ch ADC + Tacho, Charge Input (03-33-8505)CAN, GPS (03-33-8540)
SystemAnalog inputs 48 to 1024 channels plus tachos
Expansion Flexible packaging optionsSplit rate sampling Multiple sampling rates can run
concurrently in separate cardsProgrammability All features under software
controlCommunications USB 2.0
EnvironmentalShock and vibration Suitable for mobile use (5g rms)
Operating temperature 0oC to +40oC (32oF to +104oF)Humidity 80% RH, non-condensing
Weight Dependent on configuration, channel count & chassis
GeneralSupply voltage Choice of 10-17V DC (e.g.
vehicle battery) or AC mains (adapter supplied)
Dimensions† (H x W x D)
185mm x 450mm x 400mm (7.3” x 17.7” x 15.7”)
† Dimensions are measured exclusive of any handles or other attachments
http://www.prosig.com +1 248 443 2470 (USA) or contact your [email protected] +44 (0)1329 239925 (UK) local representative
HARDWARE PRODUCTSDATA ACQUISITION SYSTEMS
13
Sys
tem
Pac
kage
sH
ardw
are
Sof
twar
eCo
nditio
n M
onito
ring
Trai
ning
& S
uppo
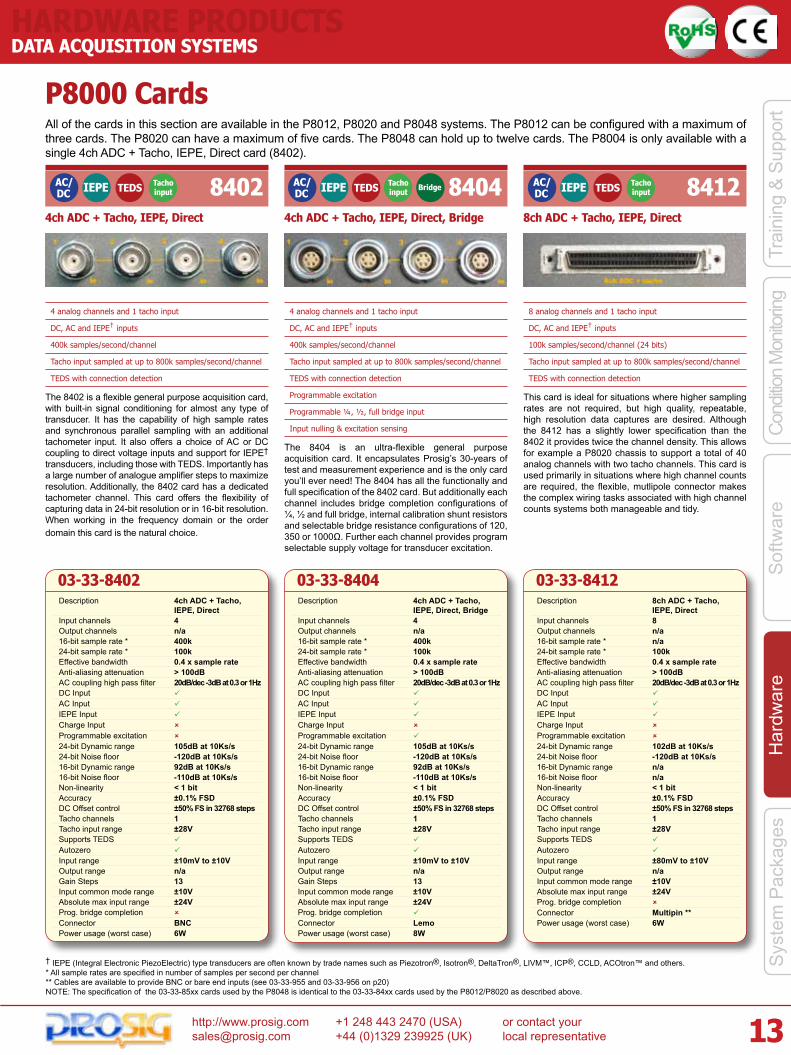
rtAll of the cards in this section are available in the P8012, P8020 and P8048 systems. The P8012 can be configured with a maximum of three cards. The P8020 can have a maximum of five cards. The P8048 can hold up to twelve cards. The P8004 is only available with a single 4ch ADC + Tacho, IEPE, Direct card (8402).
4 analog channels and 1 tacho input
DC, AC and IEPE† inputs
400k samples/second/channel
Tacho input sampled at up to 800k samples/second/channel
TEDS with connection detection
The 8402 is a flexible general purpose acquisition card, with built-in signal conditioning for almost any type of transducer. It has the capability of high sample rates and synchronous parallel sampling with an additional tachometer input. It also offers a choice of AC or DC coupling to direct voltage inputs and support for IEPE† transducers, including those with TEDS. Importantly has a large number of analogue amplifier steps to maximize resolution. Additionally, the 8402 card has a dedicated tachometer channel. This card offers the flexibility of capturing data in 24-bit resolution or in 16-bit resolution. When working in the frequency domain or the order domain this card is the natural choice.
P8000 Cards
03-33-8402Description 4ch ADC + Tacho,
IEPE, DirectInput channels 4Output channels n/a16-bit sample rate * 400k24-bit sample rate * 100kEffective bandwidth 0.4 x sample rateAnti-aliasing attenuation > 100dBAC coupling high pass filter 20dB/dec -3dB at 0.3 or 1HzDC Input AC Input IEPE Input Charge Input Programmable excitation 24-bit Dynamic range 105dB at 10Ks/s24-bit Noise floor -120dB at 10Ks/s16-bit Dynamic range 92dB at 10Ks/s16-bit Noise floor -110dB at 10Ks/sNon-linearity < 1 bitAccuracy ±0.1% FSDDC Offset control ±50% FS in 32768 stepsTacho channels 1Tacho input range ±28VSupports TEDS Autozero Input range ±10mV to ±10VOutput range n/aGain Steps 13Input common mode range ±10VAbsolute max input range ±24VProg. bridge completion Connector BNCPower usage (worst case) 6W
† IEPE (Integral Electronic PiezoElectric) type transducers are often known by trade names such as Piezotron®, Isotron®, DeltaTron®, LIVM™, ICP®, CCLD, ACOtron™ and others.* All sample rates are specified in number of samples per second per channel** Cables are available to provide BNC or bare end inputs (see 03-33-955 and 03-33-956 on p20)NOTE: The specification of the 03-33-85xx cards used by the P8048 is identical to the 03-33-84xx cards used by the P8012/P8020 as described above.
03-33-8404Description 4ch ADC + Tacho,
IEPE, Direct, BridgeInput channels 4Output channels n/a16-bit sample rate * 400k24-bit sample rate * 100kEffective bandwidth 0.4 x sample rateAnti-aliasing attenuation > 100dBAC coupling high pass filter 20dB/dec -3dB at 0.3 or 1HzDC Input AC Input IEPE Input Charge Input Programmable excitation 24-bit Dynamic range 105dB at 10Ks/s24-bit Noise floor -120dB at 10Ks/s16-bit Dynamic range 92dB at 10Ks/s16-bit Noise floor -110dB at 10Ks/sNon-linearity < 1 bitAccuracy ±0.1% FSDDC Offset control ±50% FS in 32768 stepsTacho channels 1Tacho input range ±28VSupports TEDS Autozero Input range ±10mV to ±10VOutput range n/aGain Steps 13Input common mode range ±10VAbsolute max input range ±24VProg. bridge completion Connector LemoPower usage (worst case) 8W
03-33-8412Description 8ch ADC + Tacho,
IEPE, DirectInput channels 8Output channels n/a16-bit sample rate * n/a24-bit sample rate * 100kEffective bandwidth 0.4 x sample rateAnti-aliasing attenuation > 100dBAC coupling high pass filter 20dB/dec -3dB at 0.3 or 1HzDC Input AC Input IEPE Input Charge Input Programmable excitation 24-bit Dynamic range 102dB at 10Ks/s24-bit Noise floor -120dB at 10Ks/s16-bit Dynamic range n/a16-bit Noise floor n/aNon-linearity < 1 bitAccuracy ±0.1% FSDDC Offset control ±50% FS in 32768 stepsTacho channels 1Tacho input range ±28VSupports TEDS Autozero Input range ±80mV to ±10VOutput range n/aInput common mode range ±10VAbsolute max input range ±24VProg. bridge completion Connector Multipin **Power usage (worst case) 6W
IEPE TEDS Tacho input
4ch ADC + Tacho, IEPE, Direct
8402AC/DC
8 analog channels and 1 tacho input
DC, AC and IEPE† inputs
100k samples/second/channel (24 bits)
Tacho input sampled at up to 800k samples/second/channel
TEDS with connection detection
This card is ideal for situations where higher sampling rates are not required, but high quality, repeatable, high resolution data captures are desired. Although the 8412 has a slightly lower specification than the 8402 it provides twice the channel density. This allows for example a P8020 chassis to support a total of 40 analog channels with two tacho channels. This card is used primarily in situations where high channel counts are required, the flexible, mutlipole connector makes the complex wiring tasks associated with high channel counts systems both manageable and tidy.
8ch ADC + Tacho, IEPE, Direct
8412IEPE TEDS Tacho input
AC/DC
4 analog channels and 1 tacho input
DC, AC and IEPE† inputs
400k samples/second/channel
Tacho input sampled at up to 800k samples/second/channel
TEDS with connection detection
Programmable excitation
Programmable ¼, ½, full bridge input
Input nulling & excitation sensing
The 8404 is an ultra-flexible general purpose acquisition card. It encapsulates Prosig’s 30-years of test and measurement experience and is the only card you’ll ever need! The 8404 has all the functionally and full specification of the 8402 card. But additionally each channel includes bridge completion configurations of ¼, ½ and full bridge, internal calibration shunt resistors and selectable bridge resistance configurations of 120, 350 or 1000Ω. Further each channel provides program selectable supply voltage for transducer excitation.
IEPE TEDS Tacho input
4ch ADC + Tacho, IEPE, Direct, Bridge
8404AC/DC
Bridge

http://www.prosig.com +1 248 443 2470 (USA) or contact your [email protected] +44 (0)1329 239925 (UK) local representative
HARDWARE PRODUCTS
14
DATA ACQUISITION SYSTEMS
Sys
tem
Pac
kage
sH
ardw
are
Sof
twar
eCo
nditio
n M
onito
ring
Trai
ning
& S
uppo
rt All of the cards in this section are available in the P8012, P8020 and P8048 systems. The P8012 can be configured with a maximum of three cards. The P8020 can have a maximum of five cards. The P8048 can hold up to twelve cards. The P8004 is only available with single 4ch ADC + Tacho, IEPE, Direct card (8402).
P8000 Cards
03-33-8414Description 8ch ADC + Tacho,
Direct, BridgeInput channels 8Output channels n/a16-bit sample rate * n/a24-bit sample rate * 100kEffective bandwidth 0.4 x sample rateAnti-aliasing attenuation > 100dBAC coupling high pass filter 20dB/dec -3dB at 0.3 or 1HzDC Input AC Input IEPE Input Charge Input Programmable excitation 24-bit Dynamic range 102dB at 10Ks/s24-bit Noise floor -120dB at 10Ks/s16-bit Dynamic range n/a16-bit Noise floor n/aNon-linearity < 1 bitAccuracy ±0.1% FSDDC Offset control ±50% FS in 32768 stepsTacho channels 1Tacho input range ±28VSupports TEDS Autozero Input range ±80mV to ±10VOutput range n/aInput common mode range ±10VAbsolute max input range ±24VProg. bridge completion Connector Multipin **Power usage (worse case) 12W
03-33-8408Description 8ch ThermocoupleInput channels 8Output channels n/a16-bit sample rate * n/a24-bit sample rate * 500Effective bandwidth n/aAnti-aliasing attenuation n/aDC Input AC Input IEPE Input Charge Input Programmable excitation Non-linearity < 1 bitAccuracy ±0.1% FSDTacho channels n/aTacho input range n/aSupports TEDS Autozero Input range ThermocoupleOutput range n/aGain Steps 4Input common mode range n/aAbsolute max input range n/aProg. bridge completion Connector IsoThermal BlockPower usage (worst case) 6.2W
03-33-8420Description Advanced TachoTacho input channels 4Tacho input range ±28VAbsolute max input range ±50VSlope selection +ve, -veDynamic noise rejection Resolution 16.6nsConnector BNCPower usage (worst case) 1.3W
* All sample rates are specified in number of samples per second per channel** Cables are available to provide BNC or bare end inputs (see 03-33-955 and 03-33-956 on p20)NOTE: The specification of the 03-33-85xx cards used by the P8048 is identical to the 03-33-84xx cards used by the P8012/P8020 as described above.
Programmable signal conditioning to de-bounce inputs
60MHz resolution
Pulse counting
Noise Offset’ & ‘Hold Off’ setting
Programmable threshold & slope
Pulse time stamping
The 8420 card is intended as a solution for situations with rotating machines where positional information and time relative to position information are required. This would classically be a very high speed shaft encoder with a fine resolution. This card is used in applications where there is a requirement to accurately measure rotational speed at several points in a drivetrain. The high speed and resolution of this card mean it is suitable for in depth rotational machine analysis such as torsional and angular vibration. The 8420 card measures the time between pulses with a 16ns resolution.
Tacho input
4ch Advanced Tacho
8420
Eight channels of single ended thermocouple inputs
Universal input connector supports all popular thermocouple types
Smallest step change 0.075 degrees (assuming 1 degree = 40µV)
Integral cold junction reference
Typical accuracy : 0.5°C
This is the universal thermocouple card suitable for use with industry standard connector types, but also supporting universal input connectors. The 8408 provides up to eight thermocouple inputs and supports all popular thermocouple types. This card gives the option for temperature data to be integrated and synchronised with noise and vibration data.
8ch Thermocouple
oCoF 8408
8 analog channels and 1 tacho input
DC, AC inputs
100k samples/second/channel (24 bits)
Tacho input sampled at up to 800k samples/second/channel
Programmable excitation
Programmable ¼, ½, full bridge input
Input nulling & excitation sensing
This card has the main features of the 8412 and includes bridge completion and transducer excitation. Each channel provides bridge completion configurations of ¼, ½ and full bridge, internal calibration shunt resistors and selectable bridge resistance of 120, 350 or 1000Ω. The 8414 has a slightly lower specification than the 8404, but provides twice the channel density. This allows a P8020 chassis to support up to 40 analog channels and two tacho channels. The flexible mutlipole connector gives these systems manageable wiring and offers the option of fast connection external boxes if desired.
8ch ADC + Tacho, Direct, Bridge
8414Tacho input
AC/DC
Bridge

http://www.prosig.com +1 248 443 2470 (USA) or contact your [email protected] +44 (0)1329 239925 (UK) local representative
HARDWARE PRODUCTSDATA ACQUISITION SYSTEMS
15
Sys
tem
Pac
kage
sH
ardw
are
Sof
twar
eCo
nditio
n M
onito
ring
Trai
ning
& S
uppo
rtAll of the cards in this section are available in the P8012, P8020 and P8048 systems. The P8012 can be configured with a maximum of three cards. The P8020 can have a maximum of five cards. The P8048 can hold up to twelve cards. The P8004 is only available with single 4ch ADC + Tacho, IEPE, Direct card (8402).
P8000 Cards
03-33-8424Description 2ch/4ch DAC, Digital I/O
Option 1 - 4ch DACAnalogue output channels 4Digital input channels 0Digital output channels 024-bit sample rate * 288kAnalog output range ±4VDigital output range n/aConnector 4 x BNCPower usage (worst case) 1.8W
Option 2 - 2ch DAC, Digital I/OAnalogue output channels 2Digital input channels 4Digital output channels 424-bit sample rate * 288kAnalog output range ±4VDigital output range TTL compatibleConnector 2 x BNC + 9-way D-typePower usage (worst case) 1.8W
Option 3 - Digital I/O onlyAnalogue output channels 0Digital input channels 8Digital output channels 824-bit sample rate * n/aDigital output range TTL compatibleConnector 2 x 9-way D-typePower usage (worst case) 1.8W
03-33-8405Description 4ch ADC + Tacho,
Charge InputInput channels 4Output channels n/a16-bit sample rate * 400k24-bit sample rate * 100kEffective bandwidth 0.4 x sample rateAnti-aliasing attenuation > 100dBAC coupling high pass filter 40dB/dec -3dB at 0.5HzDC Input AC Input IEPE Input Charge Input Programmable excitation 24-bit Dynamic range 105dB at 10Ks/s24-bit Noise floor -120dB at 10Ks/s16-bit Dynamic range 92dB at 10Ks/s16-bit Noise floor -110dB at 10Ks/sNon-linearity < 1 bitAccuracy ±0.1% FSDDC Offset control ±50% FS in 32768 stepsTacho channels 1Tacho input range ±28VSupports TEDS Autozero Input range ±68pC to ±68000pCOutput range n/aGain Steps 13Input common mode range n/aAbsolute max input range n/aProg. bridge completion Connector BNCPower usage (worst case) 6W
03-33-8440Description CANLink interface ISO11898Bus rates 250kHz, 500kHz, 1MHzOperating modes Passive, Log all traffic
Active, request PID etcPower usage (worst case) 1.3WCAN Bus inputs 2
GPS Option 1Receiver type 50 channels, GPS L1Update rate 4HzVelocity accuracy 0.1 m/secPosition accuracy 2.5mTime accuracy 30ns RMS
GPS Option 2Receiver type GPS L1Update rate 20HzVelocity accuracy 0.03m/sPosition accuracy 1.8mTime accuracy 20ns RMS
* All sample rates are specified in number of samples per second per channel** Cables are available to provide BNC or bare end inputs (see 03-33-955 and 03-33-956 on p20)NOTE: The specification of the 03-33-85xx cards used by the P8048 is identical to the 03-33-84xx cards used by the P8012/P8020 as described above.
CAN-bus input
Passive and active CAN modes
Time stamping: time or sample number
GPS Data
The 8440 card supports both simple monitoring, where messages are read and logged from the bus, and PID mode, where automatic PIDs can be requested under user control. CAN Bus gives the flexibility of access to the tens or hundreds of parameters that are already present on an automotive vehicle or even modern air-craft communication bus.
The 8440 card supports two separate independent CAN Bus inputs for dual system monitoring and cap-ture.
A GPS option is available so that position, velocity or accurate wall clock time can be recorded with the data. Further there are GPS options that have different spec-ification depending on the customer’s requirements.
CAN bus
CAN, GPS
8440
Four analog output channels - DAC
288k samples/second/channel maximum output
Digital interpolating filter
Optional integral digital I/O with 8 inputs & 8 outputs
The 8424 DAC card, often known as an analog output card, is ideal for situations where analog replay of signals is required. Traditionally, it is used in applications such as modal analysis or general noise and vibration analysis. Analogue output is most often used where driving a multi-post shaker is required. Captured or various generated signals can be replayed as analog voltages at optimal sample rates.
A selection of optional front panel configuration offers either four DAC outputs, two DAC outputs combined with digital I/O or digital I/O only. These options offer greater flexibility and integration with other systems.
2ch/4ch DAC, Digital I/O
DAC 8424
Four analog 24-bit charge inputs
BNC connectors
Tacho input sampled at up to 800k samples/second/channel
The 8405 provides 4 inputs for charge mode transducers. These are normally high temperature accelerometers. Charge mode transducers are normally used in automotive and aerospace applications where heat and low frequency response are important. The 8405 offers an impressive input range of ±68pC to ±68000pC Full Scale Deflection with, importantly, a large number of analogue amplifier steps to maintain and maximize signal resolution.
Charge input
Tacho input
4ch ADC + Tacho, Charge Input
8405 GPS

HARDWARE PRODUCTSDATA ACQUISITION SYSTEMS
Sys
tem
Pac
kage
sH
ardw
are
Sof
twar
eCo
nditio
n M
onito
ring
Trai
ning
& S
uppo
rt
http://www.prosig.com +1 248 443 2470 (USA) or contact your [email protected] +44 (0)1329 239925 (UK) local representative16
P8012 / P8020 systems03-33-8012 12-channel (3 card) chassis. Includes
• P8012 chassis (capable of holding a maximum of 3 cards)• PC to P8012 USB 2.0 communications cable (02-33-852)• Mains power supply for P8012 (02-33-883)• In-vehicle power cable for P8012 (02-33-884)
03-33-8020 20-channel (5 card) chassis. Includes• P8020 chassis (capable of holding a maximum of 5 cards)• PC to P8020 USB 2.0 communications cable (02-33-852)• Mains power supply for P8020 (02-33-854)• In-vehicle power cable for P8020 (02-33-885)
Select any combination of the following cards up to a maximum of 3 cards (P8012) or 5 cards (P8020)03-33-8402 4ch ADC + Tacho, IEPE, Direct (BNC connectors) *03-33-8404 4ch ADC + Tacho, IEPE, Direct, Bridge (6-pin Lemo connectors) *03-33-8405 4ch ADC + Tacho, Charge Input03-33-8408 8ch Thermocouple03-33-8412 8ch ADC + Tacho, IEPE, Direct03-33-8414 8ch ADC + Tacho, Direct, Bridge03-33-8420 4ch Advanced Tacho03-33-8424 2ch/4ch DAC, Digital I/O03-33-8440 CAN, GPS
P8020
P8012
* The P8012/P8020 chassis has two tacho inputs (T1 & T2). To have a tacho input available on T1 either an 8402, 8404, 8412 or 8414 card needs to be fitted in slot 1. Similarly, to have a tacho input available on T2 either an 8402, 8404, 8412 or 8414 card needs to be fitted in slot 2.
P8048 systems
03-33-8048 48-channel (12 card) chassis. Includes• Rack mount chassis (capable of holding a maximum of 12 cards. Racks can be linked for higher channel counts)• PC to P8048 USB 2.0 communications cable (02-33-852)• Mains power supply for P8048 (02-33-867)• In-vehicle power cable for P8048 (02-33-866)
Select any combination of the following cards up to a maximum of 12 cards03-33-8502 4ch ADC + Tacho, IEPE, Direct (BNC connectors) *03-33-8504 4ch ADC + Tacho, IEPE, Direct, Bridge (6-pin Lemo connectors) *03-33-8505 4ch ADC + Tacho, Charge Input03-33-8508 8ch Thermocouple03-33-8512 8ch ADC + Tacho, IEPE, Direct03-33-8514 8ch ADC + Tacho, Direct, Bridge03-33-8520 4ch Advanced Tacho03-33-8524 2ch/4ch DAC, Digital I/O03-33-8540 CAN, GPS
* The P8048 chassis has two tacho inputs (T1 & T2). To have a tacho input available on T1 either an 8502, 8504, 8512 or 8514 card needs to be fitted in slot 1. Similarly, to have a tacho input available on T2 either an 8502, 8504, 8512 or 8514 card needs to be fitted in slot 2.
P8048
P8004 systems
03-33-8004 P8004 4-channel system. Includes • 4 analog channels with tacho module & BNC connectors• PC to P8004 USB 2.0 communications cable (02-33-852)• Mains power supply for P8004 (02-33-853)• In-vehicle power cable for P8004 (02-33-846)
P8004
HARDWARE PRODUCTSMADE TO MEASURE
Sys
tem
Pac
kage
sH
ardw
are
Sof
twar
eCo
nditio
n M
onito
ring
Trai
ning
& S
uppo
rt
http://www.prosig.com +1 248 443 2470 (USA) or contact your [email protected] +44 (0)1329 239925 (UK) local representative
17
Made To MeasureWhat types of measurements can I make with a P8000 system?
The purpose of these pages is to introduce the different types of transducers that can be used with the Prosig P8000 series data acquisition system. The article deals with the design and function of
the different types of transducer and the applications they are normally associated with.
Accelerometer
An accelerometer is a device that measures acceleration. It is normally attached directly to the surface of the test specimen. As the object moves, the accelerometer causes an electric current to flow, which is proportional to the acceleration. Acceleration and vibration are similar but not the same. If a material or structure has a vibration then it will be subject to certain accelerations. The frequency content and the magnitude of these accelerations are directly proportional to the vibration.
The main type of accelerometer is a piezo electric type. The official name for this type is IEPE, which stands for Integrated Electronic Piezo Electric. This is often referred to by product names such as Piezotron®, Isotron®, DeltaTron®, LIVM™, ICP®, CCLD, ACOtron™ and others, which are all trademarks of their respective owners. Because of the internal electronics of these transducers the acquisition equipment must include suitable power supplies and signal conditioning to work with them.
IEPE transducers are usually based on quartz crystals. These transducers normally have the crystal mounted on a mass. When the mass is subjected to an accelerative force a small voltage is induced across the crystal. This voltage is proportional to the acceleration.
There are also many other types of accelerometer in the market: capacitive types, piezoresistive, hall effect, magnetoresistive and heat transfer types.
Accelerometers normally come in two distinct packages, side and top mounted. The side mounted package have the interconnecting cable or connector on the side and the top mounted package have these on the top. Different circumstances require different mounting methods. Accelerometers can come in one of two different types: single axis and tri-axis. The single axis accelerometer measures acceleration in one direction, where as the triaxial accelerometer measures the acceleration in
the classical 3 dimensional planes.
Mounting methods are very important for an accelerometer. It is normally best not to rely on just one attachment method from a reliability point of view. The mounting method for an accelerometer is effectively an undamped spring and the frequency response effects of this spring on the frequency related magnitude of the measured vibration must be considered. That
is the reason why there is no single attachment method that is best for all cases. The most widely used attachment is a sticky wax, although super glue is also very popular. Both these have different frequency transmission characteristics as well as other advantages and disadvantages.
Accelerometers are probably the most widely used transducers in any investigation work on a structure of any kind. NVH (Noise, Vibration & Harshness) testing is just one of many fields that make use of them. If there
is a requirement to find the frequency of a vibration, for example, an accelerometer would be the obvious choice. It is important to make sure the frequency that is being investigated is within the usable range of the accelerometer and that the maximum amplitude capability of the accelerometer is not exceeded at any point during the test.
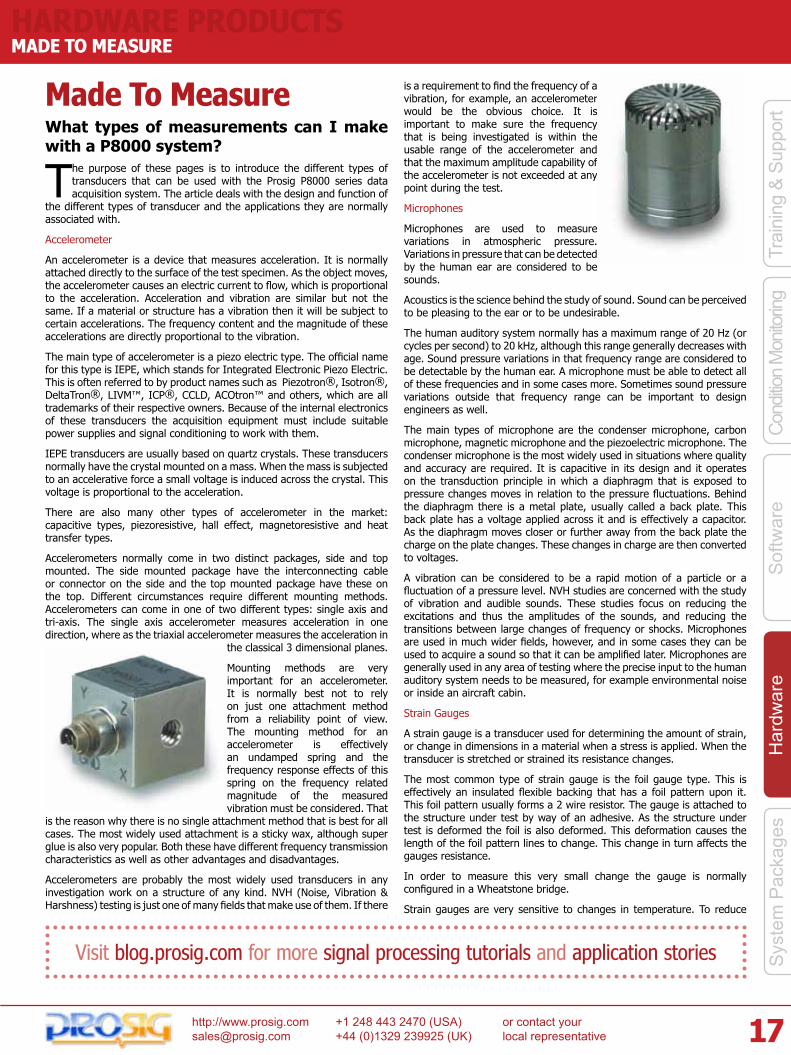
Microphones
Microphones are used to measure variations in atmospheric pressure. Variations in pressure that can be detected by the human ear are considered to be sounds.
Acoustics is the science behind the study of sound. Sound can be perceived to be pleasing to the ear or to be undesirable.
The human auditory system normally has a maximum range of 20 Hz (or cycles per second) to 20 kHz, although this range generally decreases with age. Sound pressure variations in that frequency range are considered to be detectable by the human ear. A microphone must be able to detect all of these frequencies and in some cases more. Sometimes sound pressure variations outside that frequency range can be important to design engineers as well.
The main types of microphone are the condenser microphone, carbon microphone, magnetic microphone and the piezoelectric microphone. The condenser microphone is the most widely used in situations where quality and accuracy are required. It is capacitive in its design and it operates on the transduction principle in which a diaphragm that is exposed to pressure changes moves in relation to the pressure fluctuations. Behind the diaphragm there is a metal plate, usually called a back plate. This back plate has a voltage applied across it and is effectively a capacitor. As the diaphragm moves closer or further away from the back plate the charge on the plate changes. These changes in charge are then converted to voltages.
A vibration can be considered to be a rapid motion of a particle or a fluctuation of a pressure level. NVH studies are concerned with the study of vibration and audible sounds. These studies focus on reducing the excitations and thus the amplitudes of the sounds, and reducing the transitions between large changes of frequency or shocks. Microphones are used in much wider fields, however, and in some cases they can be used to acquire a sound so that it can be amplified later. Microphones are generally used in any area of testing where the precise input to the human auditory system needs to be measured, for example environmental noise or inside an aircraft cabin.
Strain Gauges
A strain gauge is a transducer used for determining the amount of strain, or change in dimensions in a material when a stress is applied. When the transducer is stretched or strained its resistance changes.
The most common type of strain gauge is the foil gauge type. This is effectively an insulated flexible backing that has a foil pattern upon it. This foil pattern usually forms a 2 wire resistor. The gauge is attached to the structure under test by way of an adhesive. As the structure under test is deformed the foil is also deformed. This deformation causes the length of the foil pattern lines to change. This change in turn affects the gauges resistance.
In order to measure this very small change the gauge is normally configured in a Wheatstone bridge.
Strain gauges are very sensitive to changes in temperature. To reduce
Visit blog.prosig.com for more signal processing tutorials and application stories
HARDWARE PRODUCTSMADE TO MEASURE
Sys
tem
Pac
kage
sH
ardw
are
Sof
twar
eCo
nditio
n M
onito
ring
Trai
ning
& S
uppo
rt
http://www.prosig.com +1 248 443 2470 (USA) or contact your [email protected] +44 (0)1329 239925 (UK) local representative18
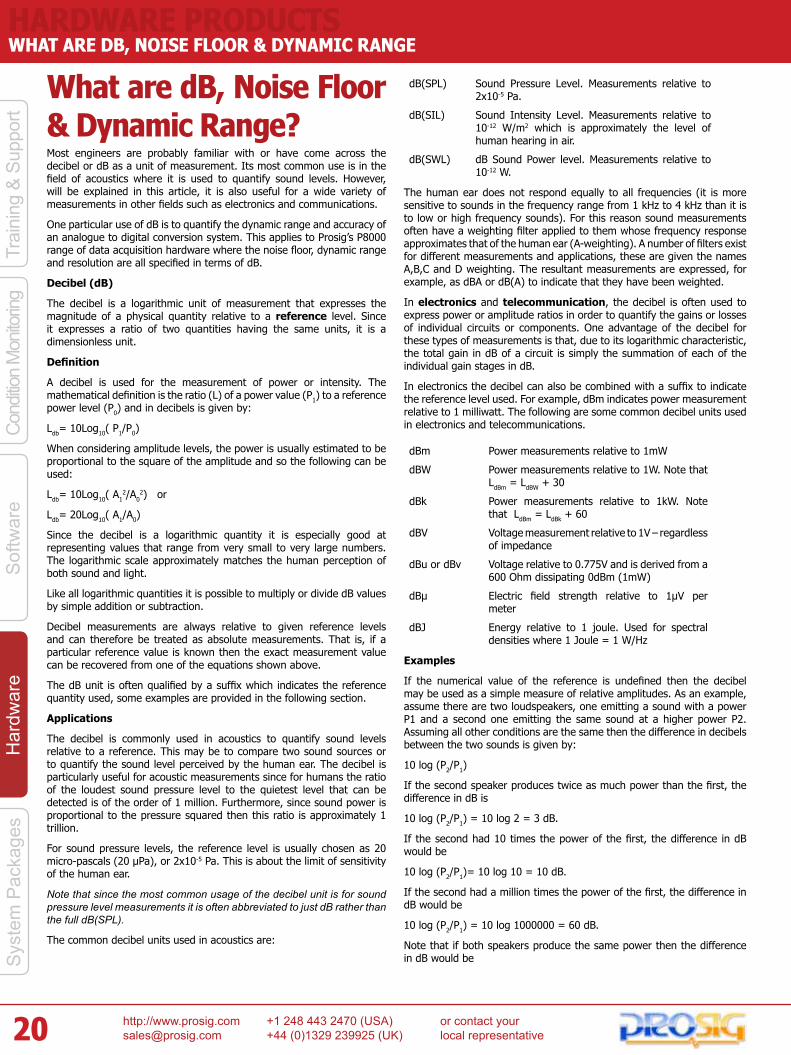
the effect of this potential corruption a Wheatstone bridge is used with voltage supply sensing. This reduces the effect of temperature changes.
Strain gauges are also available as thin film types and as semiconductor types. The thin film types are used in higher temperature applications where they are applied directly on to the surface of the structure. This has the additional advantage of not disrupting airflow in aerodynamic design. The semiconductor types of gauges are referred to as piezoresistors. These gauges are used in preference to the resistive foil types when the strain is small. The piezoresistors are the most sensitive to temperature change and are the most fragile strain gauge type.
Strain gauges are used in many disciplines of science and engineering, the classical use for strain gauges is in material and structural fatigue prediction, but strain gauges are also used in areas as diverse as medicine, biology, aircraft structures and even bridge design.
Torque Sensors
Torque measurement is the measurement of the angular turning moment at a particular location and instantaneous time in a shaft.
Torque is usually measured in one of two ways: either by sensing the actual shaft deflection caused by the shaft twisting or by measuring the effects of this deflection. From the measured deflections it is possible to calculate the torque in the shaft.
Classical torque sensors, normally based on strain gauges, are used to measure the deflection in a shaft. These gauges are mounted at 90 degrees to each other. One is mounted in parallel to the main axis of the shaft the other perpendicular to this.
Torque transducers based on strain gauges are often foil types, but can also be diffused semiconductor and thin film types. However, any strain gauge based device will be subject to temperature variations. Unless the change due to temperature is sensed and accounted for then corruption of results can occur. In order to correct for this effect bridge supply sensing is required.
There are also more modern types of torque transducer; these include inductive, capacitive or optical types. These types use a slightly different method to measure the torque in which the angular displacement between two positions on a shaft is measured and the torque deduced from the amount of twist.
Torque transducers are used to measure many parameters such as the amount of power from an automotive engine, an electric motor, a turbine or any other rotating shaft.
Recently torque sensors have been used increasingly as part of hand tools on a production line. This enables the measurement of torque as screws or bolts are tightened, which can be used to improve quality control.
Impact Hammer
The function of an impact hammer is to deliver an impulsive force into a test specimen or material. The force gauge that is built into the hammer measures the magnitude and frequency content of this excitation.
An impact hammer is usually used in conjunction with at least one accelerometer. These accelerometers would normally be single axis, however tri-axial accelerometers can also be used. These accelerometers measure the response of the impulsive force in the material. From the
combined measurements of the excitation and response a frequency function can be calculated. It is possible to change the frequency characteristics of the impulse by changing the type of ‘tip’ on the hammer head. A harder tip will generally produce a shorter impact time, and will often be used for situations where higher frequency analysis is of interest.
Impact hammers, sometimes called Modally Tuned® impact hammers, are normally applied manually. These devices often resemble common everyday hammers. They would be used in a classical structural or modal analysis situations, although they can also be used for acoustic testing. To use an impact hammer it is necessary to ‘hit’ the structure with the hammer. The weight and the type of hammer head must be first correctly selected for the amount of force required to excite the structure. The bigger and heavier the structure the larger the mass of the hammer head must be and greater the force used.
The reason the impact hammer is sometimes referred to as a Modally Tuned® hammer is that the structural design of the hammer has been optimized so that the structural resonances of the hammer during the ‘hit’ will not affect the frequencies of interest in the structure and will therefore not corrupt the test data.
Impact hammers are used in many fields from automotive and aerospace design and development through to bridge health assessment.
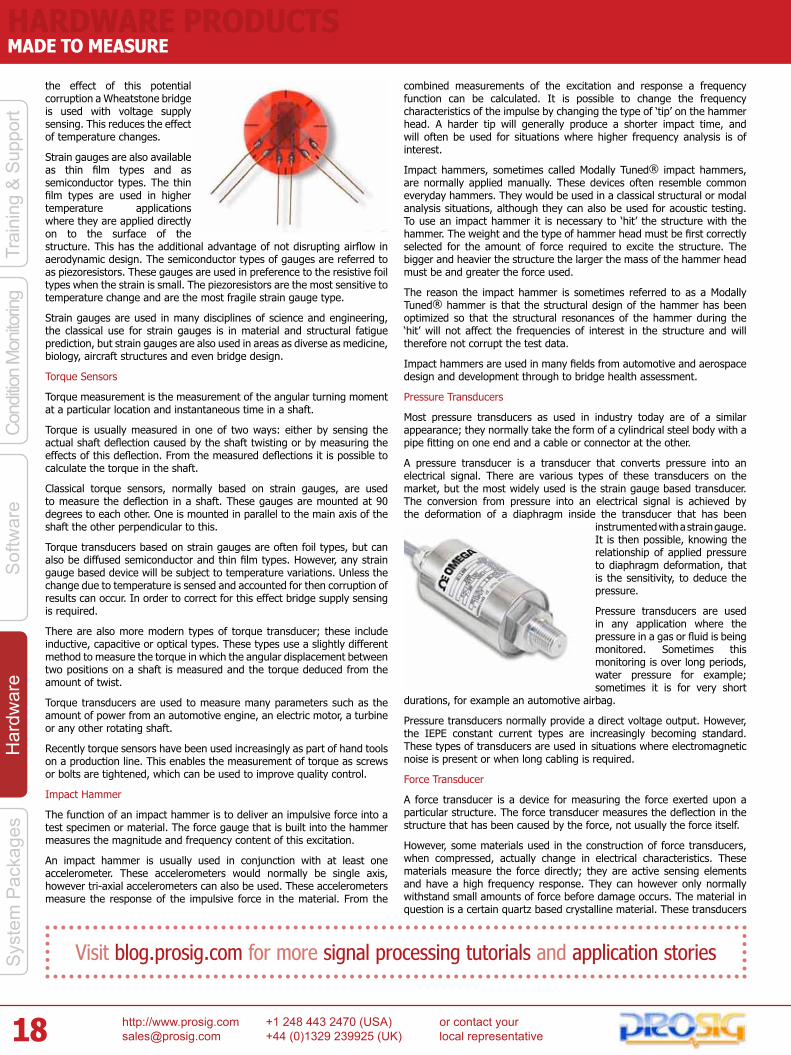
Pressure Transducers
Most pressure transducers as used in industry today are of a similar appearance; they normally take the form of a cylindrical steel body with a pipe fitting on one end and a cable or connector at the other.
A pressure transducer is a transducer that converts pressure into an electrical signal. There are various types of these transducers on the market, but the most widely used is the strain gauge based transducer. The conversion from pressure into an electrical signal is achieved by the deformation of a diaphragm inside the transducer that has been
instrumented with a strain gauge. It is then possible, knowing the relationship of applied pressure to diaphragm deformation, that is the sensitivity, to deduce the pressure.
Pressure transducers are used in any application where the pressure in a gas or fluid is being monitored. Sometimes this monitoring is over long periods, water pressure for example; sometimes it is for very short
durations, for example an automotive airbag.
Pressure transducers normally provide a direct voltage output. However, the IEPE constant current types are increasingly becoming standard. These types of transducers are used in situations where electromagnetic noise is present or when long cabling is required.
Force Transducer
A force transducer is a device for measuring the force exerted upon a particular structure. The force transducer measures the deflection in the structure that has been caused by the force, not usually the force itself.
However, some materials used in the construction of force transducers, when compressed, actually change in electrical characteristics. These materials measure the force directly; they are active sensing elements and have a high frequency response. They can however only normally withstand small amounts of force before damage occurs. The material in question is a certain quartz based crystalline material. These transducers
Visit blog.prosig.com for more signal processing tutorials and application stories

HARDWARE PRODUCTSMADE TO MEASURE
Sys
tem
Pac
kage
sH
ardw
are
Sof
twar
eCo
nditio
n M
onito
ring
Trai
ning
& S
uppo
rt
http://www.prosig.com +1 248 443 2470 (USA) or contact your [email protected] +44 (0)1329 239925 (UK) local representative
19
are sometimes called piezoelectric crystal transducers. Electronic charges are formed in the crystal surface in proportion to the rate of change of that force being applied to the crystal. There are other types of force transducer available, for example the ceramic capacitive type.
Typically force transducers are used for bench testing and for monitoring quality during reshaping or bonding operations on a production line.
Force transducers are heavily used in the aerospace industry, they are often used as part of a pilot controls. It is important in these situations not just to have positional information on the pilots’ controls, but also the force being applied to the control system.
Load Cell
A load cell is basically a transducer that converts a load into an electronic signal. The majority of load cells in the market are strain gauge based, however there are some other alternatives. In almost any modern application that involves weighing, a load cell
comprised of strain gauges in a Wheatstone bridge configuration is used.
Load cells based on strain gauges consist normally of four strain gauges bonded on to beam structure that deforms as weight or mass is applied to the load cell. In most cases strain gauges are used in a Wheatstone bridge configuration as this offers the maximum sensitivity and temperature compensation. Two of the four gauges are usually used for temperature compensation.
There are several ways in which load cells can operate internally: bending, shear, compression or tension. All of these types are based on strain gauges.
Less common are the hydraulic load cell and the pneumatic load cell. The hydraulic load cell, as the name implies is based on a fluid under pressure. As the pressure or weight on the cell changes a diaphragm is moved. This type of load cell is more commonly used in situations where temperature can be highly dynamic. Hydraulic load cells can be almost as accurate as the strain gauge based type. Pneumatic load cells operate on the force balance principle; they use multiple dampener chambers to provide higher accuracy than the hydraulic load cell. They would normally be used in situations where the mass being weighed is small, and as they are not based on fluid they can be used in clean room environments. Additionally, they have a very high tolerance of variation in temperature.
Load cells are often used in automotive brake testing and development; the force applied to the pedal is compared to the force generated at the disk or drum, for example. The assist braking system can then be optimized for the expected use. It is possible to adjust the system so that for a given force on the pedal an appropriate force is generated at the brake pad to optimize the vehicle deceleration. Load cells are also used in such diverse areas as engine dynamometry, suspension spring testing, production line batch weighing and production line connector insertion force monitoring.
Thermocouples
A thermocouple is a sensor for measuring temperature. It normally consists of two dissimilar materials joined at one end that produce a small voltage at a given temperature proportional to the difference in temperature of the two materials.
Thermocouples are among the easiest temperature sensors to use, and are used heavily in industry. They are based on the Seebeck effect that occurs in electrical conductors that undergo a temperature change along
their length.
Thermocouples are available in different combinations of metals. The four most common types are the J, K, T and E types. Each has a different temperature range and is intended for use in a different environment.
Thermocouples are often used for temperature measurement of corrosive liquids or gasses, usually at high pressures. Thermocouples are used extensively in the steel and iron production industries; they are used to monitor temperatures through the manufacturing process. Because of their low cost they are suitable for extreme environments where they often have to be replaced. They are a versatile transducer type and are probably the one used in most fields, from aerospace to cryogenic applications.
TEDS - Transducer Electronic Data Sheets
Transducer Electronic Data Sheet or TEDS for short, is a set of electronic data in a standardized format defined within the IEEE-P1451.4 standard. This data specifies what type of sensor is present, describes its interface, and gives technical information such as sensitivity, reference frequency, polarity and so on.
TEDS offers large benefits in that it simplifies troubleshooting, greatly reduces costs and removes the need for recalibration when changing or replacing sensors.
From the users point of view, when using a TEDS transducer, upon connection certain important fields are automatically uploaded from the transducer microprocessor and can then be filled in the test setup matrix. This can be very useful in the field. Further, when used in conjunction with a transducer database, all the fields in the test setup matrix will be automatically filled in upon transducer connection.
CAN-bus
Whilst not strictly a measurement transducer in its own right the CAN-bus is having an increasing impact on engineering measurement across a wide range of applications.
The Controller Area Network or CAN-bus for short, is a multicast shared serial bus standard, originally developed in the 1980s by Robert Bosch GmbH. The bus is designed for use when connecting electronic control units. CAN was specifically designed to be robust in noisy electromagnetic environments and can utilize a differential balanced line like RS-485. It can be even more robust against noise if twisted pair wire is used.
Although initially created for the automotive market, it is now used in many embedded control applications that may be subject to high levels of external noise. The use of the CAN bus continues to grow in all automotive sectors, and even in the aerospace sector.
Conclusion
All of the transducers and measurement systems in this article are supported by the P8000 hardware. However, there are many other types of transducers not discussed here that can be used with the P8000. If you have other requirements please contact Prosig to discuss.
Visit blog.prosig.com for more signal processing tutorials and application stories
http://www.prosig.com +1 248 443 2470 (USA) or contact your [email protected] +44 (0)1329 239925 (UK) local representative
HARDWARE PRODUCTS
20
WHAT ARE DB, NOISE fLOOR & DyNAMIC RANgE
Sys
tem
Pac
kage
sH
ardw
are
Sof
twar
eCo
nditio
n M
onito
ring
Trai
ning
& S
uppo
rt
What are dB, Noise Floor & Dynamic Range?Most engineers are probably familiar with or have come across the decibel or dB as a unit of measurement. Its most common use is in the field of acoustics where it is used to quantify sound levels. However, will be explained in this article, it is also useful for a wide variety of measurements in other fields such as electronics and communications.
One particular use of dB is to quantify the dynamic range and accuracy of an analogue to digital conversion system. This applies to Prosig’s P8000 range of data acquisition hardware where the noise floor, dynamic range and resolution are all specified in terms of dB.
Decibel (dB)
The decibel is a logarithmic unit of measurement that expresses the magnitude of a physical quantity relative to a reference level. Since it expresses a ratio of two quantities having the same units, it is a dimensionless unit.
Definition
A decibel is used for the measurement of power or intensity. The mathematical definition is the ratio (L) of a power value (P1) to a reference power level (P0) and in decibels is given by:
Ldb= 10Log10( P1/P0)
When considering amplitude levels, the power is usually estimated to be proportional to the square of the amplitude and so the following can be used:
Ldb= 10Log10( A12/A0
2) or
Ldb= 20Log10( A1/A0)
Since the decibel is a logarithmic quantity it is especially good at representing values that range from very small to very large numbers. The logarithmic scale approximately matches the human perception of both sound and light.
Like all logarithmic quantities it is possible to multiply or divide dB values by simple addition or subtraction.
Decibel measurements are always relative to given reference levels and can therefore be treated as absolute measurements. That is, if a particular reference value is known then the exact measurement value can be recovered from one of the equations shown above.
The dB unit is often qualified by a suffix which indicates the reference quantity used, some examples are provided in the following section.
Applications
The decibel is commonly used in acoustics to quantify sound levels relative to a reference. This may be to compare two sound sources or to quantify the sound level perceived by the human ear. The decibel is particularly useful for acoustic measurements since for humans the ratio of the loudest sound pressure level to the quietest level that can be detected is of the order of 1 million. Furthermore, since sound power is proportional to the pressure squared then this ratio is approximately 1 trillion.
For sound pressure levels, the reference level is usually chosen as 20 micro-pascals (20 μPa), or 2x10⁻⁵ Pa. This is about the limit of sensitivity of the human ear.
Note that since the most common usage of the decibel unit is for sound pressure level measurements it is often abbreviated to just dB rather than the full dB(SPL).
The common decibel units used in acoustics are:
dB(SPL) Sound Pressure Level. Measurements relative to 2x10⁻⁵ Pa.
dB(SIL) Sound Intensity Level. Measurements relative to 10-12 W/m2 which is approximately the level of human hearing in air.
dB(SWL) dB Sound Power level. Measurements relative to 10-12 W.
The human ear does not respond equally to all frequencies (it is more sensitive to sounds in the frequency range from 1 kHz to 4 kHz than it is to low or high frequency sounds). For this reason sound measurements often have a weighting filter applied to them whose frequency response approximates that of the human ear (A-weighting). A number of filters exist for different measurements and applications, these are given the names A,B,C and D weighting. The resultant measurements are expressed, for example, as dBA or dB(A) to indicate that they have been weighted.
In electronics and telecommunication, the decibel is often used to express power or amplitude ratios in order to quantify the gains or losses of individual circuits or components. One advantage of the decibel for these types of measurements is that, due to its logarithmic characteristic, the total gain in dB of a circuit is simply the summation of each of the individual gain stages in dB.
In electronics the decibel can also be combined with a suffix to indicate the reference level used. For example, dBm indicates power measurement relative to 1 milliwatt. The following are some common decibel units used in electronics and telecommunications.
dBm Power measurements relative to 1mW
dBW Power measurements relative to 1W. Note that LdBm = LdBW + 30
dBk Power measurements relative to 1kW. Note that LdBm = LdBk + 60
dBV Voltage measurement relative to 1V – regardless of impedance
dBu or dBv Voltage relative to 0.775V and is derived from a 600 Ohm dissipating 0dBm (1mW)
dBμ Electric field strength relative to 1μV per meter
dBJ Energy relative to 1 joule. Used for spectral densities where 1 Joule = 1 W/Hz
Examples
If the numerical value of the reference is undefined then the decibel may be used as a simple measure of relative amplitudes. As an example, assume there are two loudspeakers, one emitting a sound with a power P1 and a second one emitting the same sound at a higher power P2. Assuming all other conditions are the same then the difference in decibels between the two sounds is given by:
10 log (P2/P1)
If the second speaker produces twice as much power than the first, the difference in dB is
10 log (P2/P1) = 10 log 2 = 3 dB.
If the second had 10 times the power of the first, the difference in dB would be
10 log (P2/P1)= 10 log 10 = 10 dB.
If the second had a million times the power of the first, the difference in dB would be
10 log (P2/P1) = 10 log 1000000 = 60 dB.
Note that if both speakers produce the same power then the difference in dB would be
http://www.prosig.com +1 248 443 2470 (USA) or contact your [email protected] +44 (0)1329 239925 (UK) local representative
HARDWARE PRODUCTSWHAT ARE DB, NOISE fLOOR & DyNAMIC RANgE
21
Sys
tem
Pac
kage
sH
ardw
are
Sof
twar
eCo
nditio
n M
onito
ring
Trai
ning
& S
uppo
rt
10 log (P2/P1) = 10 log 1 = 0 dB.
This illustrates some common features of the dB scale irrespective of the measurement type:
• A doubling of power is represented approximately by 3dB and a doubling of amplitude by 6dB.
• A halving of power is given by -3dB and a halving of amplitude by -6dB
• 0dB means that the measured value is the same as the reference. Note that this does not mean there is no power or signal.
Noise floor
Any practical measurement will be subject to some form of noise or unwanted signal. In acoustics this may be background noise or in electronics there are often things like thermal noise, radiated noise or any other interfering signals. In a data acquisition measurement system the system itself will actually add noise to the signals it is measuring. The general rule of thumb is: the more electronics in the system the more noise imposed by the system.
In data acquisition and signal processing the noise floor is a measure of the summation of all the noise sources and unwanted signals generated within the entire data acquisition and signal processing system. The noise floor limits the smallest measurement that can be taken with certainty since any measured amplitude cannot on average be less than the noise floor.
In summary, the noise floor is the level of background noise in a signal, or the level of noise introduced by the system, below which the signal that’s being captured cannot be isolated from the noise.
Figure 1.
Figure 2
As shown in Figure 1 the noise floor is better than -120 dB.
Figure 2 shows that only signals above the noise floor can be measured with any degree of certainty. In this case the signal level of -100dB at 20KHz could be measured. If however, the noise floor increased above the -120dB level then it would become more difficult to measure this signal.
For example, it is possible for the human ear to hear a very low sound such as a pin drop or a whisper. However, this is only possible if the noise floor or background noise of the particular environment is very low such as in a soundproof or quiet room. It would not be possible to hear or discriminate such low levels in a noisy room.
Various techniques are employed by the Prosig P8000 data acquisition system in order to ensure that the noise floor of the equipment is kept as low as possible. These include signal-processing functions as well as practical features such as the ability to disable cooling fans during acquisition scans.
Dynamic range and resolution
Dynamic range is a term used to describe the ratio between the smallest and largest signals that can be measured by a system.
The dynamic range of a data acquisition system is defined as the ratio between the minimum and maximum amplitudes that a data acquisition system can capture.
In practice most Analogue to Digital Converters (ADC) have a voltage range of ± 10V. Sometimes amplification may be applied to signals before they are input to an ADC in order to maximize the input voltages within the available ADC range.
The resolution of a measurement system is determined by the number of bits that the ADC uses to digitise an input signal. Most ADCs have either 16-bit or 24-bit resolution. For a 16-bit device the total voltage range is represented by 216 (65536) discrete digital values. Therefore the absolute minimum level that a system can measure is represented by 1 bit or 1/65536th of the ADC voltage range. For a system with a voltage range of ±10V then the smallest voltage that the system can distinguish will be:
20 / 65536 = 0.3 mV
In decibels this dynamic range is therefore expressed as:
20 Log10 (1 / 65536) = 96dB
Therefore for a 16-bit ADC the dynamic range is 96dB. Using the same calculations the dynamic range of a 24-bit ADC is 144dB.
The noise floor of a measurement system is also limited by the resolution of the ADC system. For example, the noise floor of a 16-bit measurement system can never be better than -96dB and for a 24-bit system the lower limit is limited to -144 dB. In practice, however, the noise floor will always be higher than this due to electronic noise within the measurement system.
Modern data acquisition systems, such as the Prosig P8000, employ a number of sophisticated digital signal processing techniques to improve the amplitude resolution and thereby allow low amplitude data, such as noise floor signals, to be measured with greater precision and with greater accuracy.

http://www.prosig.com +1 248 443 2470 (USA) or contact your [email protected] +44 (0)1329 239925 (UK) local representative
HARDWARE PRODUCTS
22
TRANSDUCERS
Sys
tem
Pac
kage
sH
ardw
are
Sof
twar
eCo
nditio
n M
onito
ring
Trai
ning
& S
uppo
rt
P8000 Compatible Measurement TransducersMicrophones
IEPE Mode Accelerometers
Microphones04-55-901 ½" prepolarized condenser microphone, free field04-55-902 ½" IEPE preamplifier for ½” microphone above04-55-903 ½" microphone and integral IEPE preamplifier04-55-904 ¼" prepolarized condenser microphone, pressure04-55-905 ¼" IEPE preamplifier for ¼" microphone above04-55-906 ¼" microphone and integral IEPE preamplifier
IEPE Mode Accelerometers04-55-907 High frequency, quartz shear IEPE accelerometer04-55-908 High sensitivity, ceramic shear IEPE accelerometer04-55-909 Miniature, lightweight (0.2gm) ceramic shear IEPE accelerometer04-55-910 Miniature, lightweight (0.8gm) ceramic shear IEPE accelerometer04-55-911 Shock, IEPE accelerometer04-55-912 Seismic, miniature (50gm) ceramic shear accelerometer04-55-913 Modal array, ceramic shear IEPE accelerometer04-55-914 General purpose, quartz shear IEPE accelerometer
Triaxial IEPE Mode Accelerometers04-55-915 Triaxial, lightweight (1.0gm) miniature, ceramic shear IEPE accelerometer04-55-916 Triaxial, mini (5gm) high sensitivity, IEPE accelerometer04-55-917 Triaxial, thru-hole mounting, ceramic shear, miniature IEPE accelerometer04-55-918 Triaxial, high sensitivity, ceramic shear IEPE accelerometer
Charge Mode Accelerometers
Charge Mode Accelerometers04-55-919 Miniature (0.14gm), teardrop shape, charge output accelerometer04-55-920 High temperature, miniature (2gm), ceramic shear, charge output accelerometer04-55-921 High temperature (up to 260ºC), ceramic shear, charge output accelerometer04-55-922 High temperature (up to 480ºC), ceramic shear, charge output accelerometer04-55-923 In-line charge converter to IEPE
Strain Gauges
Strain Gauges04-55-924 Single element strain gauge04-55-925 90º 2-element Rosette strain gauge04-55-926 45º/90º 3-element Rosette strain gauge
IEPE (Integral Electronic PiezoElectric) type transducers are often known by trade names such as Piezotron®, Isotron®, DeltaTron®, LIVM™, ICP®, CCLD, ACOtron™ and others. If required, Prosig can offer a complete system from transducers to analysis software. These pages provide only a sample of the types and specification of measurement transducers that Prosig can provide. Please enquire if you do not see what you require. Items of different specification may be offered by Prosig or its partners depending on your application. The manufacturer and model may vary.

http://www.prosig.com +1 248 443 2470 (USA) or contact your [email protected] +44 (0)1329 239925 (UK) local representative
HARDWARE PRODUCTSTRANSDUCERS
23
Sys
tem
Pac
kage
sH
ardw
are
Sof
twar
eCo
nditio
n M
onito
ring
Trai
ning
& S
uppo
rt
Thermocouples
Load Cells
Thermocouples04-55-927 Type ‘J’ thermocouple04-55-928 Type ‘K’ thermocouple
Load Cells04-55-929 Compression load cell
Impact Hammers
Displacement Transducers
Speed / Tachometer SensorsSpeed / Tachometer Sensors04-55-932 Ignition lead pickup04-55-933 Magnetic speed / tachometer sensor04-55-934 Magnetic speed / tachometer sensor (high temperature)04-55-948 IEPE Laser tachometer
Displacement Transducers04-55-931 Displacement transducer
Impact Hammers04-55-930 Impact / Impulse Hammer
P8000 Compatible Measurement Transducers
IEPE (Integral Electronic PiezoElectric) type transducers are often known by trade names such as Piezotron®, Isotron®, DeltaTron®, LIVM™, ICP®, CCLD, ACOtron™ and others. If required, Prosig can offer a complete system from transducers to analysis software. These pages provide only a sample of the types and specification of measurement transducers that Prosig can provide. Please enquire if you do not see what you require. Items of different specification may be offered by Prosig or its partners depending on your application. The manufacturer and model may vary.

http://www.prosig.com +1 248 443 2470 (USA) or contact your [email protected] +44 (0)1329 239925 (UK) local representative
HARDWARE PRODUCTS
24
STRAIN gAUgES ExPLAINED
Sys
tem
Pac
kage
sH
ardw
are
Sof
twar
eCo
nditio
n M
onito
ring
Trai
ning
& S
uppo
rt
Strain Gauges ExplainedA strain gauge is an electrical sensor which is used to accurately measure strain in a test piece. Strain gauges are usually based on a metallic foil pattern. The gauge is attached to the test piece with a special adhesive. As the test piece is deformed, so the adhesive deforms equally and thus the strain gauge deforms at the same rate and amount as the test piece. It’s for this reason that the adhesive must be carefully chosen. If the adhesive cracks or becomes detached from the test piece any test results will be useless.
Strain gauges are used not just for metals; they have been connected to the retina of the human eye, insects,
plastics, concrete and indeed any material where strain is under investigation. Modern composite materials like carbon fibre when under development are often constructed with strain gauges between the layers of the material.
The strain gauge is effectively a resistor. As the strain increases so the resistance increases.
In a basic sense a strain gauge is simply a long piece of wire. Gauges are mostly made from copper or aluminium (Figure 1). As the wire in the strain gauge is mostly laid from end to end, the strain gauge is only sensitive in that direction.
When an electrical conductor is stretched within the limits of its elasticity it will become thinner and longer. It is important to understand that strain gauges actually deform only a very small amount, the wire is not stretched anywhere near its breaking point. As it becomes thinner and longer it’s electrical characteristics change. This is because resistance is a function of both cable length and cable diameter.
The formula for resistance in a wire is
Resistance in ohms (R) =ρ x L ρ = Resistivity (ohms per meter)
L = length in metersα = cross section (m2)α
For example, the resistance of a copper wire which has a resistivity of 1.8 x 10⁻⁸ Ω/m, is 1 meter long and has a cross sectional area of 2mm2 would be
R =1.8x10-8 x 1
=0.000000018
= 0.0045Ω0.0022 0.000004
Resistivity is provided by the manufacturer of the material in question and is a measurement of how strongly the material opposes the flow of current. It is measured in ohm’s per meter (Ω/m).
If in our example the cable was then put under certain strain its length would extended to 2 meters, as it was stretched longer it would get thinner, it’s cross sectional area would decrease. In this example to 0.5 mm2 the resistance now would be
R =1.8x10-8 x 2
=0.000000018
= 0.072Ω0.0052 0.00000025
As can clearly be seen the resistance is now different, but the resistances in question are very small. This example shows only the difference when the characteristics of the copper wire have
changed. It is not practically possible to stretch and extend a piece of copper wire by these amounts. The example merely shows how resistance changes with respect to length and cross sectional area and demonstrates that strain gauges, by their very nature, exhibit small resistance changes with respect to strain upon them.
These small resistance changes are very difficult to measure. So, in a practical sense, it is difficult to measure a strain gauge, which is just a long wire. Whatever is used to measure the strain gauges resistance will itself have its own resistance. The resistance of the measuring device would almost certainly obscure the resistance change of the strain gauge.
The solution to this problem is to use a Wheatstone bridge to measure the resistance change. A Wheatstone bridge is a device used to measure an unknown electrical resistance. It works by balancing two halves of a circuit, where one half of the circuit includes the unknown resistance. Figure 2 shows a classical Wheatstone bridge, Rx represents the strain gauge.
Resistors R2, R3 and R4 are known resistances. Normally, 120Ω, 350Ω or 1000Ω are used depending on the application. Knowing the supply voltage and the returned signal voltage it’s possible to calculate the resistance of Rx very accurately.
For example if R2, R3 and R4 are 1000Ω and if the measured signal voltage between measurement points A and B was 0 Volts then the resistance of Rx is
R3=
Rxor Rx =
R3x R2
R4 R2 R1
For our example we get
Rx =1000Ω
x 1000Ω = 1000Ω1000Ω
This implies a perfectly balanced bridge. In practice, because the strain gauge goes through different strain levels its resistance changes, the measured signal level between measurement points A and B is not zero. This is not a problem when using a system like the Prosig P8000 as it can accurately measure the voltage between measurement points A and B.
It is necessary to know the relationship between resistance and voltage. Only then can the measured voltage be related to a resistance and, hence, a strain value.
Figure 3 shows the addition of another resistor RS, called the shunt resistor. The shunt resistor is a known fixed value, normally 126,000Ω.
The Shunt resistor is added for calibration purposes and is a very high precision resistor. By measuring the voltage between
Figure 1: A strain gauge
Figure 2: A Wheatstone bridge
Figure 3: With shunt resistor

Sys
tem
Pac
kage
sH
ardw
are
Sof
twar
eCo
nditio
n M
onito
ring
Trai
ning
& S
uppo
rt
http://www.prosig.com +1 248 443 2470 (USA) or contact your [email protected] +44 (0)1329 239925 (UK) local representative
HARDWARE PRODUCTSSTRAIN gAUgES ExPLAINED
25
measurement points A and B with the shunt resistor across Rx, a voltage with the shunt resistor in place is known. Then by removing the shunt resistor, which is a known 126,000Ω and measuring the voltage between measurement points A and B again, it’s possible to relate the measured voltage change to a known resistance change. Therefore the volt per ohm value is known for this particular bridge and this particular Rx.
In order to go one step further and calculate the strain from the resistance, the gauge factor must be known. This is a calibrated number provided by the manufacturer of the strain gauge. With this information the sensitivity of the whole sensor can be calculated. That is, the volt per strain is known.
Inside the P8000 the resistors used to complete the bridge are very high precision. This allows the Prosig P8000 to calculate the resistance, and therefore, strain with a high degree of accuracy.
Strain gauge readings can be affected by variations in the temperature of the strain gauge or test piece. The wire in the strain gauge will expand or contract as an effect of thermal expansion, which will be detected as a change in strain levels by the measuring system as it will manifest itself as a resistance change. In order to address this most strain gauges are made from constantan or karma alloys. These are designed so that temperature effects on the resistance of the strain gauge cancel out the resistance change of the strain gauge due to the thermal expansion of the test piece. Because different materials have different thermal properties they therefore have differing amounts of thermal expansion.
So, where temperature change during the test is an issue, temperature compensating strain gauges can be used. However this requires correctly matching the strain gauge alloy with the thermal expansion properties of the test piece and the temperature variation during the test. In certain circumstances temperature compensating strain gauges are either not practical nor cost effective. Another more commonly used option is to make use of the Wheatstone bridge for temperature compensation.
When using a Wheatstone bridge constructed of four strain gauges, it is possible to attach the four gauges in a fashion to remove the changes in resistance caused by temperature variation. This requires attaching the strain gauge Rx in the direction of interest and then attaching the remaining strain gauges, R2, R3 and R4, perpendicular to this. The piece under test however must only exhibit strain in the direction across Rx and not in the perpendicular direction.
It’s important to understand that the R2, R3 and R4 strain gauges should not be under strain, hence their direction. This means the whole bridge is subject to the same temperature variations and therefore stays balanced from a thermal expansion point of view. As the resistance changes due to temperature, all the resistances in all four gauges change by the same amount. So the voltage at measurement point A and B stays constant due to temperature fluctuations. Only the strain in the desired direction, across Rx, in the test piece affects the measured voltage readings.
The Prosig P8000 system has multi-pin inputs, these allow for the connection of strain gauges in all the various different bridge configurations.
The configurations that strain gauges can be used in are,
Quarter Bridge is the most common strain gauge configuration. As can be seen in Figure 4 it is actually a three wire configuration.
The rest of the bridge as shown in Figure 2 is completed inside the Prosig P8000 system. Quarter Bridge uses three wires to allow for accurate measurement of the actual voltage across S1.
Half Bridge is not an often used strain gauge configuration. As can be seen in Figure 5 it is actually a five wire configuration. The rest of the bridge as shown in Figure 2 is completed inside the Prosig P8000 system. The main advantage of the Half Bridge configuration is that both the strain gauges S1 and S2 can be attached to the test piece, but perpendicular to each other. Which as previously discussed allows for temperature compensation.
Full bridge is used for situations where the fullest degree of accuracy is required. The Full Bridge configuration is a six wire system, as shown in Diagram-5. The Full Bridge configuration is the most accurate in terms of temperature variation because it can have two active gauges, S1 and S4. The gauges can be configured with S1 and S4 in the direction of interest on the test piece and S2 and S3 perpendicular to this. Further the voltage sense lines have no effective current flow and therefore have no voltage drop, therefore the voltage measured by the Prosig P8000 system is the actual voltage that is exciting the bridge. The reason for this requirement is that strain gauges are often on long wires and all wires have their own resistance. The Prosig P8000 system could be exciting the gauge with 5 Volts for example, but the voltage at the active part of the bridge might be 4.95 Volts because of the resistance of the wires carrying the supply voltage. This small change once measured using the sense lines it can be allowed for automatically in the strain calculations inside the data acquisition system.
Strain gauge measurements with direction.
Strain Gauges can be configured in a particular pattern that allows for the calculation of the overall strain component, this is often referred to as a strain gauge rosette. As shown in Figure 7, three strain gauges are placed either very close together or in some cases on top of each other. These can be used to measure a complex strain, the strain is complex because it has both amplitude and a direction. Using the Prosig DATS software it is possible to calculate the principle component of the strain, the amplitude over time and to calculate the direction as an angle from the reference X axis over time.
Figure 4: Quarter bridge
Figure 5: Half bridge
Figure 6: Full bridge
Figure 7: Strain gauge rosette

http://www.prosig.com +1 248 443 2470 (USA) or contact your [email protected] +44 (0)1329 239925 (UK) local representative
HARDWARE PRODUCTS
26
ACCELEROMETER MOUNTINg
Sys
tem
Pac
kage
sH
ardw
are
Sof
twar
eCo
nditio
n M
onito
ring
Trai
ning
& S
uppo
rt
Modern Accelerometer Mounting MethodsThis article is an overview of information gathered from discussions with automotive testing engineers in the USA and UK. It reflects modern practice in testing in the area of design and refinement and also in end-of-line production applications where not only accuracy but speed of measurement is a primary consideration.
IntroductionIn many vehicle testing situations, the mounting of a transducer needs to be treated with as much importance as the selection of the transducer itself. If the motion of the test structure is not accurately transmitted to the transducer, it cannot be accurately measured. The choice of transducer mounting method, the surface flatness and surface preparation can significantly affect the amplitude-frequency response of the measurement particularly at high frequencies. When attaching a transducer to a structure using adhesives, the stiffness and strength of the glue will affect the usable frequency range of the transducer. It is also important that any mounting method that is different from that used for calibration should be characterized for its dynamic characteristics over the intended frequency and amplitude range.
Theory of Accelerometer OperationAn accelerometer is an inertial measurement device that converts mechanical motion into an electrical signal. It consists of a piezoelectric (quartz) crystal and a seismic mass enclosed in a protective metal case. Acceleration is transmitted from the surface of a vibrating structure into the case of the accelerometer through the base. As the mass applies force to the crystal, the crystal creates a charge proportional to acceleration. The charge output is measured in pico Coulombs per g (pC/g) where g is the force of gravity, or pico Coulombs per metres/second2 (pC/m/sec2). Some sensors have an internal charge amplifier, while others have an external charge amplifier. The charge amplifier converts the charge output of the crystal to a proportional voltage (mV/g or mV/m/sec2). By design, accelerometers have a natural resonance (corresponding to fn in figure 1) which is 3 to 5 times higher than the advertised high end frequency response. The operating frequency response range is limited to the lower part of the operating range that has a flat frequency response. The advertised range is achievable only by using bolt (threaded stud) mounting. Any other mounting method will lower the frequency of the natural resonance, and consequently reduce the usable frequency response range.
Mounting using Threaded StudsFor permanent installations, where a very secure attachment of the accelerometer to the test structure is preferred, stud mounting is recommended. The stud may be integral, i.e., machined as part of the accelerometer or it may be separate (removable). Stud mounting provides higher transmissibility than any other method. The transducer should be mounted using the specified stud or screw, so that the entire base of the transducer is in intimate contact with the surface of the test article. A smooth, flat area at least the size of the sensor base should be ground or machined on the test object according to the manufacturer’s specifications. Then a hole must be tapped in accordance with the supplied installation drawing, ensuring that the hole is perpendicular to the mounting surface. When installing accelerometers with the mounting stud it is important that the stud does not reach the bottom of either the mounting surface or accelerometer base (see figure 2). Good mounting studs have depth-limiting shoulders that prevent the stud from bottoming-out into the accelerometer’s base. Each base incorporates a counterbore so that the accelerometer does not rest on the shoulder. Any stud bottoming or interfering between the accelerometer base and the structure will inhibit acceleration transmission and affect measurement accuracy. When installing a stud, it is best to first thread the stud into the accelerometer to ensure that the stud fully enters the threaded hole, then to thread the accelerometer into the mounting hole until the surfaces meet and finally screw in place using a torque wrench.
Any nicks, scratches, or other deformations of the mounting surface
or the transducer will affect frequency response. They may also result in damage to the accelerometer. With regards to surface preparation, good machine-shop practices are usually adequate - Surface Flatness 0.076 mm TIR (Total Indicator Runout), Surface Roughness 0.8 μm, Perpendicularity of Hole: 1 degree ± 0.5°, Tap Class 2. (when using studs). Also, a thin application of a light lubricant such silicone grease will improve transmissibility by filling voids with nearly incompressible fluid, thereby increasing the compressive stiffness of the joint. This is particularly important for measurements above 2 kHz, where changes in resonance have a significant effect on measurements. A torque wrench should be used to mount all accelerometers ensuring repeatability in the installation of the transducers and preventing thread damage. A thread-locking compound may be applied to the threads of the mounting stud to safeguard against loosening.
Two stud mount designs are illustrated in figure 3, the removable stud (a) and the integral stud (b).
The removable stud style of accelerometer is the most popular for several reasons:
1. The removable stud allows easy access to the mounting surface of the accelerometer for restoration of surface flatness should this become necessary. Even with normal care, eventually after many installations, the mounting surface of the accelerometer may become worn or damaged to a point where it is no longer flat enough to achieve a satisfactory mount and frequency response will be compromised as shown in figure 4. It is a simple matter to restore flatness if the stud can be removed and the accelerometer base can be applied directly to a lapping plate for restoration of flatness. When the stud is integral and cannot be removed, refurbishment of the mounting surface becomes very difficult and can only be performed at the factory.
2. If the integral stud is broken or the threads become stripped or otherwise damaged, the transducer becomes unusable. On the other hand, the removable stud can be easily replaced.
3. At times, with radial connector style accelerometers it is important during installation, to orient the connector so that nearby obstacles may be avoided. By exchanging mounting studs, the desired orientation may be obtained.
4. The removable stud type accelerometer can also be adhesive mounted
Figure 1: Accelerometer schematic
Figure 2: Example of stud mounting

http://www.prosig.com +1 248 443 2470 (USA) or contact your [email protected] +44 (0)1329 239925 (UK) local representative
HARDWARE PRODUCTSACCELEROMETER MOUNTINg
27
Sys
tem
Pac
kage
sH
ardw
are
Sof
twar
eCo
nditio
n M
onito
ring
Trai
ning
& S
uppo
rt
therefore quite popular with engineers who need to perform quick tests.
A variety of adhesives are available from many manufacturers, who usually provide specification charts and application notes for their adhesives, for example Loctite provides a wide range of adhesives in its “Automotive Aftermarket” division. For applications at extreme temperatures, there are commercially available adhesives that are specifically formulated to handle the hot or cold environments. For cryogenic applications, at room temperature cure, a two component polymer epoxy resin system has been proven to be effective down to -200°C. It is important for a low-temperature adhesive to be able to withstand cryogenic thermal shock without showing signs of cracking. For applications at very high temperature (up to 700°C), ceramic based adhesives are typically used due to their heat resistant properties. But ceramic adhesives also require a high curing temperature, which prevents their use in most transducer mounting applications. At lower temperatures (from a maximum of 200 to 300°C), a few commercial suppliers offer proprietary modified epoxy resins that are room temperature cured, and can operate up to 260°C.
At normal temperatures, anodized aluminium-cementing studs for adhesively mounting a stud mount accelerometer can be used. For higher temperature requirements stainless steel studs may be required.
Alternatively, when higher temperatures are involved, aluminised Mylar tape can be applied to the test structure and the accelerometer mounted with an adhesive base using an appropriate high temperature adhesive. After the test, the tape can be easily removed without damaging the surface finish of the structure.
In general the dismounting of any adhesively-mounted transducer must be carried out with great care. It should not be removed with impacts, but instead with solvents, allowing softening of the bond, supplemented by light shearing torque. All traces of adhesives should be removed using recommended solvents only. Most damages to miniature accelerometers are caused by improper removal techniques
Mounting using Magnetic AdaptersThe magnetic mounting method is typically used for temporary measurements with a portable data collector or analyzer. They are popular in industrial vibration monitoring applications where quick point- to-point measurements are to be made periodically. This method is not recommended for permanent monitoring, because the transducer may be inadvertently moved and the multiple surfaces and materials of the magnet may interfere with or increase high frequency signals.
Special attention is required when using a magnetic mounting adapter. During installation, the magnetic force that pulls the adapter/accelerometer assembly towards the mounting structure often induces an unexpectedly high level of shock input to the accelerometer at the time of contact, causing damage in the sensing elements or the internal electronics. Effective use of magnets for mid-level frequencies requires detailed surface preparation, which may extend the overall test timeframe.
Wedged, dual-rail magnetic bases are generally used for installations on curved surfaces, such as motor and compressor housings and pipes. However, dual-rail magnets usually significantly decrease the operational frequency range of an accelerometer. For best results, the magnetic base
without using a mounting adapter.
Mounting using Threaded Screws (Bolts)When installing accelerometers onto thin-walled structures, a cap screw passing through a hole of sufficient diameter is an acceptable means of securing the accelerometer to the structure. The screw engagement length as usual should always be checked to ensure that the screw does not bottom into the accelerometer base. A thin layer of silicone grease at the mounting interface
ensures high-frequency transmissibility.
Mounting using AdhesivesOccasionally, mounting by stud or screw is impractical. For such cases, adhesive mounting offers an alternative method of attachment without the need for extensive machining. However, this mounting method will typically reduce the operational frequency response range. This reduction is due to the damping and stiffness qualities of the adhesive. Also, removal of the accelerometer is more difficult than any other attachment method. For this reason the use of separate adhesive mounting bases is recommended which prevents the adhesive from damaging the accelerometer base or from clogging the mounting threads. Some adhesive mounting bases also provide electrical isolation, which eliminates potential noise pick-up and ground loop problems.
In the case of miniature accelerometers stud mounting is not an option. Most of them can only be mounted using an adhesive, which then becomes part of the structure being measured. Often they are provided with the integral stud removed to form a flat base. The stiffness of the cured adhesive is critical to the measurement performance of the total system. No adhesive is as stiff as a normal mounting stud. The more adhesive joints there are between the test structure and the accelerometer, the greater the degradation of transmissibility. Also, surface cleanliness is of prime importance for proper adhesive bonding. Since the manufacturer calibrates his transducer using a specific mounting adhesive, it is critical to follow the manufacturer’s recommendation in obtaining the intended performance. Different adhesives should be evaluated over the intended frequency and amplitude range.
Figure 6 illustrates two adhesive mount installations: one a direct mount and the other a mount with an adhesive adapter. Diagram (c) shows a direct mount with an undesirable thick layer of glue and (d) shows the mechanical analogy of the thick glue layer mount. In this situation the layer of adhesive acts like a spring and creates an effect similar to that caused by surface deformation as shown earlier.
To avoid mounting problems caused by thick glue layers it is better to use a cyanoacrylate adhesive, sometimes known as “Super Glue” or “Instant Bond” adhesive. This type of adhesive is widely available and has the following advantages:
1. It sets very quickly.
2. Not much adhesive is required for a strong bond so glue depths will naturally tend to be very thin.
3. It can be removed easily with acetone.
4. It has the best coupling characteristics at room temperature over a wide frequency range.
Dental cement is also worth considering. It is highly rigid which results in acceptable transmissibility characteristics even though a slightly thicker layer of glue has to be used. However, the problem with dental cement lies with its strength and tenacity; there is no suitable solvent available that readily dissolves it, so removal of the accelerometer can result in damage to the transducer.
Hot glue (glue gun) adhesive is the least effective in terms of rigidity and hence transmissibility, but it can be easily applied and removed, and is
Figure 3: Removable stud v integral stud
Figure 4: Error due to faulty surface

http://www.prosig.com +1 248 443 2470 (USA) or contact your [email protected] +44 (0)1329 239925 (UK) local representative
HARDWARE PRODUCTS
28
ACCELEROMETER MOUNTINg
Sys
tem
Pac
kage
sH
ardw
are
Sof
twar
eCo
nditio
n M
onito
ring
Trai
ning
& S
uppo
rt
should be attached to a smooth, flat surface. A thin layer of silicone grease should be applied between the sensor and magnetic base, as well as between the magnetic base and the structure.
When surfaces are uneven or non-magnetic, steel pads can be welded or epoxy-glued in place to accept the magnetic base. Use of such a pad ensures that periodic measurements are taken from the exact same location. This is an important consideration when trending measurement data.
Mounting using Triaxial Blocks and Isolation AdaptersMany installations require the transducer to be mounted on an adapter block for triaxial (three orthogonal axes) measurement, or for electrical ground isolation purposes. The block itself becomes part of the structure being measured, and acts as an additional spring mass system, whose transfer function needs to be defined before use. To maximise transmissibility, a good mounting block or adapter should be as small, lightweight and stiff as possible. The ideal material is beryllium, but it is not commonly used due to safety regulations and cost. Other materials, such as magnesium or aluminium are widely used with some compromise in transmissibility above 10kHz. It is therefore recommended that the accelerometers be calibrated together with the mounting block or adapter. There are triaxial accelerometers on the market that come in a single housing, designed to minimise mounting block related effects. There are also transducers that feature built-in electrical ground isolation, which eliminates the use of an isolation adapter.
Ground Isolation, Ground Noise and Ground LoopsWhen installing accelerometers onto electrically conductive surfaces, there is always a possibility of ground noise pick-up. Noise from other electrical equipment and machines that are grounded to the structure, such as motors, pumps, and generators, can enter the ground path of the measurement signal through the base of a standard accelerometer. When the sensor is grounded at a different electrical potential than the signal conditioning and readout equipment, ground loops can occur. This phenomenon usually results in current flow at the line power frequency (and harmonics thereof), potential erroneous data, and signal drift. Under such conditions, it is advisable to electrically isolate or “float” the accelerometer from the test structure. This can be accomplished in several ways. Most accelerometers can be provided with an integral ground isolation base. Some standard models may already include this feature, while others offer it as an option. The use of insulating adhesive mounting bases, isolation mounting studs, isolation bases, and other insulating materials, such as paper beneath a magnetic base, are effective ground isolation techniques. It is important to note that any additional ground-isolating hardware can reduce the upper frequency limits of the accelerometer.
Automotive ApplicationsTypically, stud mounting of transducers is not often used because usually transducers have to be attached and removed very frequently. Stud mounting directly to the structure is only used for very special development tests where the transducers are mounted only once and a series of tests is performed without removing the transducer. Clearly, this is not a practical option for testing customer vehicles or testing vehicles from the assembly line. As an alternative, a transducer can be stud mounted to a small, light-weight aluminium or titanium block and the block in turn attached to the structure using an adhesive. The block can be machined to the desired shape so that the transducer can either be mounted at a specified
location which may not have a flat surface or a mounted on a surface that is parallel or perpendicular to one of the vehicle’s major coordinates.
For many automotive applications hot glue adhesive is used despite the restriction this imposes on the effective frequency range. However, since the frequency range of interest is typically less than 1000 Hz this is not usually a problem. Good hot glue will provide sufficient adhesion for small to moderate sized accelerometers so there are no concerns about the proximity of the resonant frequencies of the mounted transducers.
Bees wax or petroleum wax is not widely used, but if it is used then the temperature must be less than 20 deg C. However, wax adhesive is sometimes preferred for hammer impact testing or in general Frequency Response Function testing when the response transducer needs to be moved frequently.
Cyanoacrylate glue (super-glue) is sometimes used in calibration laboratories, but this method is rarely used for mounting transducers on vehicles.
For transducer mounting positions which experience elevated temperatures (typically under vehicles or in engine compartments) dental cement is used especially when performing (hot) tests on running vehicles. Mounting blocks are often used to keep adhesive cement away from the threaded holes of the transducer.
Mounting transducers on vehicle steering wheels presents a different sort of problem which is the need to avoid marking or destroying the steering wheel. One solution is to wrap duct tape around the steering wheel rim at the desired position and then use a clamp such as a hose clamp to grip a mounting block to the rim. If desired the mounting block can be attached to the clamp by adhesive such as hot glue. The transducer itself may then be stud mounted to the mounting block.
Magnetically mounted transducers are sometimes used for quick vehicle setup. This technique is not widely used, but can be useful if the test engineer can find a suitable magnetic flat surface to which to attach the mounting magnet.
Recommendations
There is no one “best” mounting method for all applications because of the many different structural and environmental considerations, such as temporary or permanent mount, temperature, type of surface finish, and so forth. Almost any of the mounting methods described earlier when used at low acceleration levels provides the full frequency range of use if the mounting surface is reasonably flat.
As surface irregularities increase or the thickness of the adhesive increases, the usable frequency range decreases. The less-stiff, temporary adhesives reduce an accelerometer’s usable frequency range much more than the more rigid, harder adhesives. Nevertheless, temporary adhesives are quite satisfactory for low-frequency (<1000 Hz) structural testing at room temperatures.
When using adhesives, problems can be expected at high frequencies in proportion to the size of mass of the accelerometer. If possible, an accelerometer should be calibrated using a back-to-back accelerometer system using exactly the same mounting method that will be used in the actual test. In this manner, the precise behavior of the measurement system can be determined at the expected frequencies.
Figure 6: Direct, adapter and different glue mountings
Figure 5: Mounting using threaded screws

http://www.prosig.com +1 248 443 2470 (USA) or contact your [email protected] +44 (0)1329 239925 (UK) local representative
HARDWARE PRODUCTSWHAT ARE DB, NOISE fLOOR & DyNAMIC RANgE
29
Sys
tem
Pac
kage
sH
ardw
are
Sof
twar
eCo
nditio
n M
onito
ring
Trai
ning
& S
uppo
rt
02-33-855
P8000 AccessoriesPower supplies, batteries and cables
Interconnection kits and cables
Signal input adapters
P8000 power supplies & cables02-33-853 Mains power supply for P800402-33-883 Mains power supply for P801202-33-854 Mains power supply for P802002-33-867 Mains power supply for P804802-33-846 In-vehicle power cable for P800402-33-884 In-vehicle power cable for P801202-33-885 In-vehicle power cable for P802002-33-866 In-vehicle power cable for P8048
P8000 cables02-33-852 PC to P8000 USB 2.0 communications cable02-33-855 P8012 / P8020 interconnection cable02-33-873 P8048 interconnection cable
02-33-953 P8012 stacker kit (includes 02-33-855 Interconnection cable)02-33-856 P8020 stacker kit (includes 02-33-855 Interconnection cable)
P8000 interconnection kits
P8000 signal input adapters
02-33-670 6-pin Lemo® plug to BNC socket for P800002-33-671 4-pin Lemo® plug to BNC socket for P800002-33-1013 7-pin Lemo® plug to BNC socket for P800002-33-710 6-pin Lemo® to bare-ended cable02-33-874 4-pin Lemo® to bare-ended cable02-33-1014 7-pin Lemo® to bare-ended cable02-33-711 6-pin Lemo® to BNC cable02-33-954 4-pin Lemo® to BNC cable02-33-1015 7-pin Lemo® to BNC cable03-33-955 Multi-way to BNC cable *03-33-956 Multi-way to bare end cable ** Specifically for use with cards 03-33-8412 & 03-33-8414
P8000 batteries02-33-1016 P8004 power unit02-33-1017 P8012 power unit02-33-1018 P8020 power unit
02-33-710
02-33-883
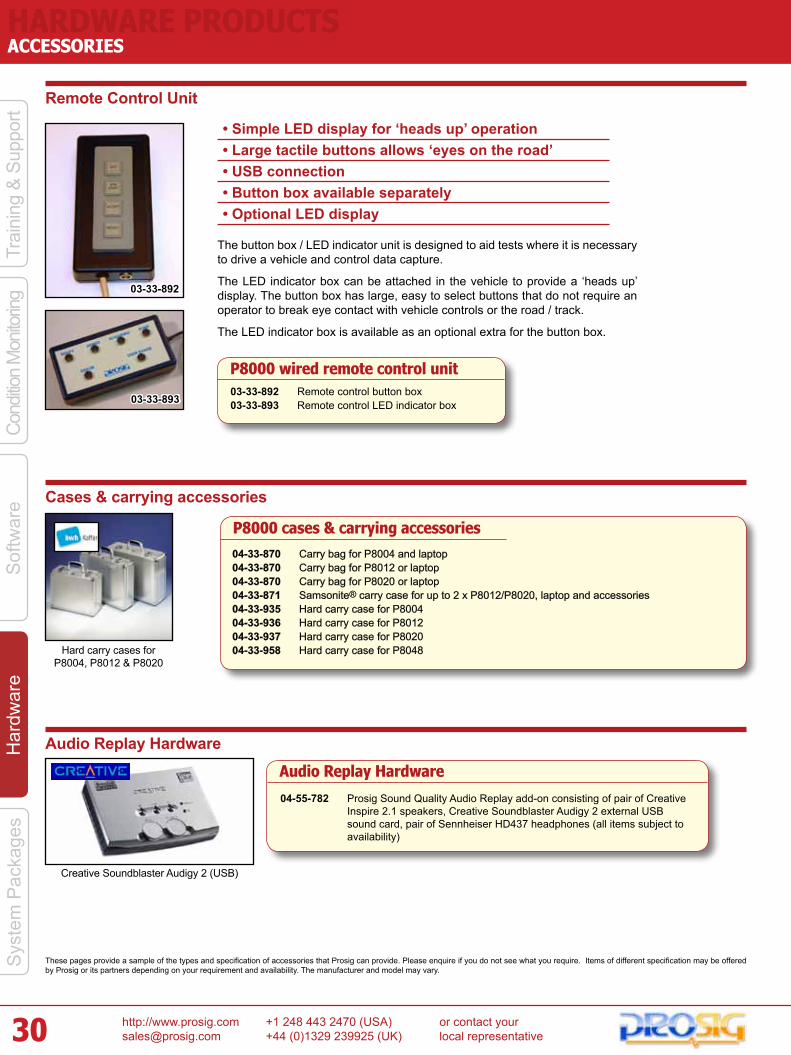
http://www.prosig.com +1 248 443 2470 (USA) or contact your [email protected] +44 (0)1329 239925 (UK) local representative
HARDWARE PRODUCTS
30
ACCESSORIES
Sys
tem
Pac
kage
sH
ardw
are
Sof
twar
eCo
nditio
n M
onito
ring
Trai
ning
& S
uppo
rt
• Simple LED display for ‘heads up’ operation• Large tactile buttons allows ‘eyes on the road’• USB connection• Button box available separately• Optional LED display
The button box / LED indicator unit is designed to aid tests where it is necessary to drive a vehicle and control data capture.
The LED indicator box can be attached in the vehicle to provide a ‘heads up’ display. The button box has large, easy to select buttons that do not require an operator to break eye contact with vehicle controls or the road / track.
The LED indicator box is available as an optional extra for the button box.
03-33-892
03-33-893
Remote Control Unit
03-33-892 Remote control button box03-33-893 Remote control LED indicator box
P8000 wired remote control unit
Hard carry cases for P8004, P8012 & P8020
Cases & carrying accessories
P8000 cases & carrying accessories04-33-870 Carry bag for P8004 and laptop04-33-870 Carry bag for P8012 or laptop04-33-870 Carry bag for P8020 or laptop04-33-871 Samsonite® carry case for up to 2 x P8012/P8020, laptop and accessories04-33-935 Hard carry case for P800404-33-936 Hard carry case for P801204-33-937 Hard carry case for P802004-33-958 Hard carry case for P8048
These pages provide a sample of the types and specification of accessories that Prosig can provide. Please enquire if you do not see what you require. Items of different specification may be offered by Prosig or its partners depending on your requirement and availability. The manufacturer and model may vary.
Creative Soundblaster Audigy 2 (USB)
Audio Replay Hardware
Audio Replay Hardware
04-55-782 Prosig Sound Quality Audio Replay add-on consisting of pair of Creative Inspire 2.1 speakers, Creative Soundblaster Audigy 2 external USB sound card, pair of Sennheiser HD437 headphones (all items subject to availability)
SOFTWARE PRODUCTS
32 dats.toolbox package
34 dats.nvh package
35 dats.rotate
36 dats.fatigue
37 dats.acoustic
38 nvh analysis suite
38 rotating machinery analysis suite
39 hammer impact analysis software
39 structural animation software
40 modal analysis suite
40 sound quality audio replay software
41 human response biodynamics suite
41 sound mapping software
42 multiplane balancing software
42 acoustics analysis suite
43 psychoacoustics analysis software
43 source path analysis suite
44 time-frequency analysis suite
44 fatigue life analysis suite
45 signal processing articles

http://www.prosig.com +1 248 443 2470 (USA) or contact your [email protected] +44 (0)1329 239925 (UK) local representative
SOFTWARE PRODUCTS
32
DATS.TOOLBOx
Sys
tem
Pac
kage
sH
ardw
are
Sof
twar
eCo
nditio
n M
onito
ring
Trai
ning
& S
uppo
rt
& phase and so on. For more complex applications there are 3D styles such as isometric, colored surface, waterfall, contour, colormaps, intensity plots etc.
All of the capture, import/export, analysis and graph functions can be easily combined using the DATS Visual Scripting interface. Functions may be
configured as necessary using a simple icon based interface. Visual Scripts can contain complex structures such as loops and if conditions as well as using forms and producing reports.
For programmers, DATS comes with a built in BASIC scripting language. This can be used to automate any part of the DATS processing mechanism and build complete applications. Scripts can contain data capture, data import, analyses, user input forms, graphical results, report generation and data export. DATS BASIC Scripts also support OLE automation for seamless integration with other products such as Microsoft Office.
The Intaglio Report Generator makes it easy to produce top quality reports time after time. It uses the powerful OLE technology built into Windows to add DATS graphs and other related information (numbers, labels and text) to standard Microsoft Word documents. Intaglio uses a system of templates that, once created, can be used over and over again.
DATS.toolbox comes with all of the functionality mentioned above. The following pages contain details of the add-on software options that are available.
DATS is a comprehensive package of data capture and signal processing tools. DATS offers outstanding value both in cost and productivity gains. Many man-years of signal processing expertise have been spent on DATS during its 30 or more years of development. When you purchase DATS you are purchasing a share in our knowledge. We understand the requirements of our customers. DATS software has proved itself time and time again in diverse and demanding applications around the world.
Because Prosig manufactures both the hardware and software, DATS is fully integrated with the Prosig P8000 series hardware. The data acquisition software
in DATS contains everything needed to view, calibrate, monitor, and store your data. As well as capturing data using the P8000, DATS can be used on data from a huge range of sources using its unique import and export filters.
DATS.toolbox software has an unparalleled depth of signal processing functions. A full list of analysis functions can be seen on the page opposite.
The DATS environment offers a rich selection of different graph styles to view and explore your data. 2D styles include lines, bars, symbols, X v Y graphs, bode plots, polar plots, modulus
Graphical interactive and automated capture, analysis & reporting
Realtime graphical displays during capture & almost instant post capture results
Extensive 2D & 3D graphics styles
toolbox
Data Acquisition (Capture)2D & 3D GraphsData Arithmetic
Frequency SpectraTime Domain Analysis
Digital FilteringCurve Fitting
Shock SpectraData Generation & Synthesis
Probability AnalysisMaths, Statistics & Calculus
Data Import & ExportBuilt-in Report Generator
Worksheet AutomationScript (Macro) Automation
A comprehensive set of tools for the noise and vibration engineer. “
http://www.prosig.com +1 248 443 2470 (USA) or contact your [email protected] +44 (0)1329 239925 (UK) local representative
SOFTWARE PRODUCTSDATS.TOOLBOx
33
Sys
tem
Pac
kage
sH
ardw
are
Sof
twar
eCo
nditio
n M
onito
ring
Trai
ning
& S
uppo
rtArithmetic (Data & Data)Data & Data Arithmetic (+ - * /) Data + Ind. Var. Arithmetic (+ - * /)Data and Reference
Arithmetic (Data & Constant)Real Data & Constant (+ - * /)Complex Data & Constant (+ - * /)Mod/Phase Data & Constant (+ - * /)
CalculusDifferentiate IntegrateIntegrate X with YOmega Arithmetic RMS over Frequency Band Complex FunctionsComplex to & from Mod/Phase Complex to Real Complex to Imaginary Complex Output (Imag+iReal, Real+i0, Imag+i0, Real+iZ) Data & Conjugate(Data) (+ - * /)
Curve FittingAlpha-Beta SmoothFit Stepped DataLagrangeLeast Squares PolynomialMean Median DespikeRemove Spikes from Data SmoothSpline Fit
Data AcquisitionSpreadsheet Style SetupMulti-channel realtime displays of numeric values, time histories, FFT, spectrum waterfalls, ordersSetup Information Stored with DataMulti-channel range displayDynamic/Static Signal Calibration Tools Automatic Gain RangingOver-range indicationsAutomatic Increment of filenames
Event ProcessingExtract EventMark EventRemove Event
Export DataASCIIComma Separated Variables (CSV)SDF (HP/Agilent)MatlabMS ExcelRPC IIITecPlotUniversal File (UFF)WAV
FilteringAlpha Beta Filter Bessel (Low, high & band pass & band stop)Butterworth (Low, high & band pass &
band stop)Chebyshev (Low, high & band pass & band stop)Equalisation FilterFilter Octave (Band Pass)Frequency Characteristics (Butterworth, Chebyshev & Bessel)Impulse Response FilterNotch RC FilterShelving FilterSmoothing
Frequency AnalysisAuto (Power) SpectrumAuto (Power) Spectrum (Limit Hold)Auto (Power) Spectrum (Hopping)Cepstrum Coherence Spectrum Complex to Mod/Phase Cross SpectrumCross Spectrum (Limit Hold)dB Weighting DFTDFT (Goertzel)Weighting (A,B,C,D) FFT (Full Range) FFT (Half Range) Hopping FFT Inverse FFT (Full / Half Range) Inverse FFT (Long Complex Full Range)Omega Arithmetic Third Octave Bands RMS Over Frequency Band Autoregressive Filter Coefficients Envelope (Complex Demodulation)Envelope (Fourier) Long FFTInstantaneous Frequency Interpolate SignalMinimum Phase Spectrum Maximum Entropy AutoregressiveMaximum Entropy Spectral EstimateShort Time FFTSpectrum LevelSpectrum Level (Limit Hold & Hopping)Transfer FunctionWinograd Transform Zoom FFTZoom Auto Spectral Density Zoom Cross Spectral Density
Generate DataSine (Sine, Damped, Linear & Log Sweep, Modulated & Pulsed)Random (Autoregressive, Gaussian, Rectangular, Narrow Band, Pink & Red Noise, Rayleigh Random Numbers)ImpulseSquare (Pulse & Swept) StepTriangle Saw Tooth Exponential DecayStraight Lines & Ramps
Import DataArtemisASCII
BinaryB & K PulseComma Separated Variables (CSV)DASYLabDIA / DIAdemDX3SDF (HP/Agilent)LabVIEWMatlabMS ExcelnCodePICOLogRealwave Pocket AnalyserRES DataRion WAVRPC II / IIIStore Plex (Racal)TEACUniversal File (UFF)WAVWaveView (Iotech)
Math FunctionsAbsolute Arcsin, Arccos, Arctan, Arcosec, Arcsec, ArccotanArcsinh, Arccosh, Arctanh, Arccosech, Arcsech, ArccothAntilogBackward & Forward DifferenceConjugateError Function (ERF)ExponentialGamma FunctionInverse ERFLinear to dB, dB to LinearLog e, Log 10NegateNth Integer RootRaise To PowerReciprocalSin, Cos, Tan, Cosec, Sec, CotSinh, Cosh, Tanh, Cosech, Arcsech, ArccothSquare Root
Pulse AnalysisAngular Vibration of ShaftPulses to RatePulses to AmountPulse Duration (All Crossings, Pos-Pos, Neg-Neg, Pos-Neg, Neg-Pos)Create Speed Signal
Shock Spectral AnalysisPrimary, Residual & CompositeLinear spacing, Logarithmic spacing & Octave spacingShock Time History (Lin, Log, Octave Spacing)
Signal ManipulationAdd Named ElementsAmend Control RecordAppend Signal to DatasetApply Classic WindowApply Exponential DecayApply Force WindowApply Sine/Cosine/Ramp Taper
Copy Whole SignalCopy Section of SignalExtract Named ElementsInclude Signals to DatasetJoin SignalsMesh Two Signals Modify Named ElementsRepair SignalReplace Signal Replace Single Named ElementReverse SignalSignal Quality CheckSort SignalView Signal History
Statistics Signal DecimationStatistical CountingLevel Count (Number of Intervals, Size of Duration Interval, Interval Size as %age, Output All Duration, Referenced to Signal Mean, Specify Reference Level) Mean Crossing Peak Count Net Peak Count Peak and Trough CountRainflow Counting (Cycle Peak / Trough)Rainflow Counting (Cycle Range / Mean)
Time Domain AnalysisADC Simulation Apply ThresholdAuto / Cross Correlation (Lagged Products or Fourier Transform)Bias removal Coherence Related Time HistoryConvolution in the Time Domain Cosine Taper FunctionEnsemble StatisticsEvaluate Trend (Mean, SD, RMS, skew, kurtosis, M5, M6, Min, Max) Generate Actuator Stepped Sine WaveGenerate Actuator Swept Sine Wave Generate Break Points Generate Spectrum Generate Gaussian Probability Density Generate Log Probability Density Generate Rayleigh Probability Density Generate Sine Probability Density Generate Data Window Generate Cosine Taper WindowGenerate Exponential Decay Window Generate Force WindowRandom Time History from spectrumJoint Probability Density FunctionNormalize
Probability AnalysisPercentile CalculationsProbability Density Function Signal DecimationSignal GenerationStatisticsTime Reverse Trend AnalysisTrend Removal (Linear Averaging Points, Exponential Averaging & Linear Averaging Duration)
Analysis functions included in the DATS.toolbox package
DATS.toolbox Software
01-55-622 DATS Professional software. Includes Intaglio reporting suite, DATS BASIC Script support and P8000 acquisition software.
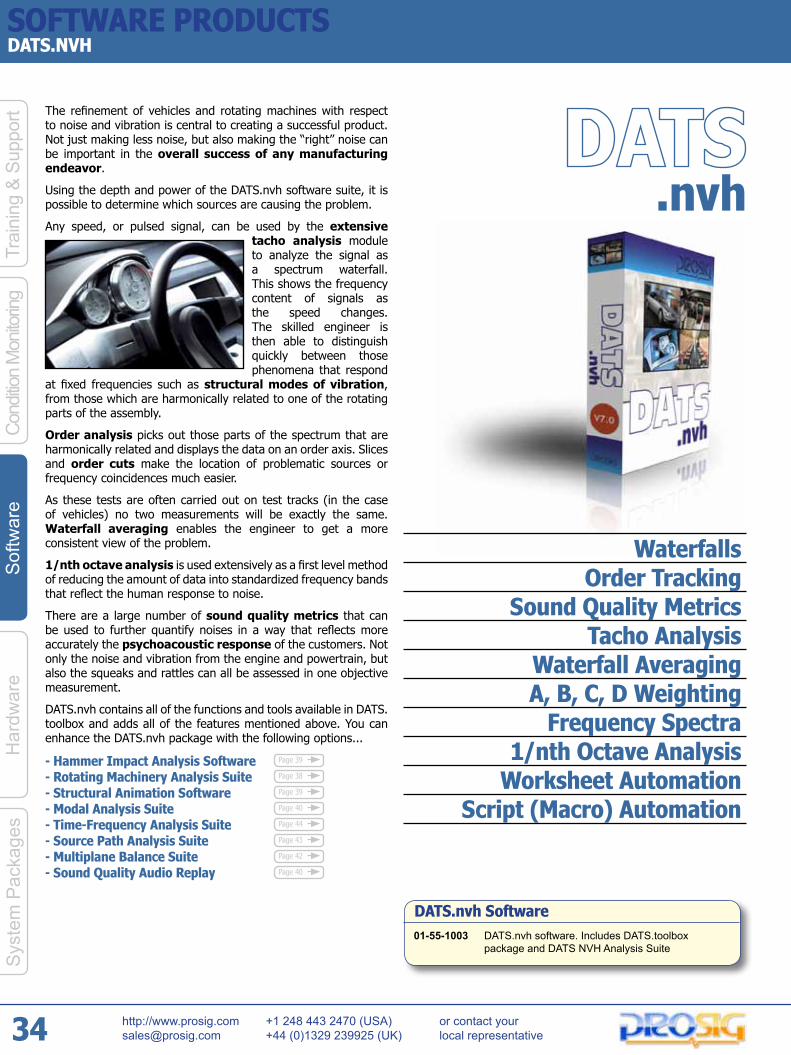
http://www.prosig.com +1 248 443 2470 (USA) or contact your [email protected] +44 (0)1329 239925 (UK) local representative
SOFTWARE PRODUCTS
34
DATS.NVH
Sys
tem
Pac
kage
sH
ardw
are
Sof
twar
eCo
nditio
n M
onito
ring
Trai
ning
& S
uppo
rt
.nvh
The refinement of vehicles and rotating machines with respect to noise and vibration is central to creating a successful product. Not just making less noise, but also making the “right” noise can be important in the overall success of any manufacturing endeavor.
Using the depth and power of the DATS.nvh software suite, it is possible to determine which sources are causing the problem.
Any speed, or pulsed signal, can be used by the extensive tacho analysis module to analyze the signal as a spectrum waterfall. This shows the frequency content of signals as the speed changes. The skilled engineer is then able to distinguish quickly between those phenomena that respond
at fixed frequencies such as structural modes of vibration, from those which are harmonically related to one of the rotating parts of the assembly.
Order analysis picks out those parts of the spectrum that are harmonically related and displays the data on an order axis. Slices and order cuts make the location of problematic sources or frequency coincidences much easier.
As these tests are often carried out on test tracks (in the case of vehicles) no two measurements will be exactly the same. Waterfall averaging enables the engineer to get a more consistent view of the problem.
1/nth octave analysis is used extensively as a first level method of reducing the amount of data into standardized frequency bands that reflect the human response to noise.
There are a large number of sound quality metrics that can be used to further quantify noises in a way that reflects more accurately the psychoacoustic response of the customers. Not only the noise and vibration from the engine and powertrain, but also the squeaks and rattles can all be assessed in one objective measurement.
DATS.nvh contains all of the functions and tools available in DATS.toolbox and adds all of the features mentioned above. You can enhance the DATS.nvh package with the following options...
- Hammer Impact Analysis Software- Rotating Machinery Analysis Suite- Structural Animation Software- Modal Analysis Suite- Time-Frequency Analysis Suite- Source Path Analysis Suite- Multiplane Balance Suite- Sound Quality Audio Replay
WaterfallsOrder Tracking
Sound Quality MetricsTacho Analysis
Waterfall AveragingA, B, C, D Weighting
Frequency Spectra1/nth Octave Analysis
Worksheet AutomationScript (Macro) Automation
DATS.nvh Software01-55-1003 DATS.nvh software. Includes DATS.toolbox
package and DATS NVH Analysis Suite
Page 39
Page 38
Page 44
Page 40
Page 39
Page 40
Page 42
Page 43
http://www.prosig.com +1 248 443 2470 (USA) or contact your [email protected] +44 (0)1329 239925 (UK) local representative
SOFTWARE PRODUCTSDATS.ROTATE
35
Sys
tem
Pac
kage
sH
ardw
are
Sof
twar
eCo
nditio
n M
onito
ring
Trai
ning
& S
uppo
rt
.rotate
WaterfallsOrder TrackingTacho Analysis
Waterfall AveragingTime Domain Analysis
Frequency Domain AnalysisOrder Domain Analysis
Shaft TwistTorsional Vibration
Worksheet AutomationScript (Macro) Automation
The analysis of rotating machinery is central to refinement activities in many fields including automotive, aerospace, power generation and general industry. It enables engineers to trace faults in gearboxes, transmission systems and bearings. Every rotating part in a machine generates vibration and hence noise as a result of small imperfections in the balance or smoothness of the components of the machine. With variable speed machines, it is a considerable challenge to reduce noise and vibration to acceptable levels. DATS.rotate contains a complete set of tools for analyzing the sources of vibration and noise.
One of the main tools for rotating machinery analysis is classical waterfall analysis, which produces frequency spectra related to the speed of rotation. The software includes comprehensive tacho conditioning software so that a high quality speed signal can be produced. The waterfall can optionally be produced with a phase component relative to the tachometer. This can be useful in balancing applications. Waterfalls can also be averaged. The software allows many different visualizations of the waterfall. Data can be displayed versus frequency or order and this is often useful in the investigation of coincident frequencies. Order cuts and frequency cuts can also be displayed; this gives the result of the analysis at a single order, frequency or speed. Orders can be extracted as integer ratios for the analysis of engines and motors, or at fractional orders, more useful for the analysis of gearboxes. Band-pass filtering and envelope analysis can be carried out for bearing analysis.
In addition, data can also be viewed and analyzed in the angle domain. This allows the data to be easily analyzed using a Discrete Fourier Transform to extract the orders directly, even if the speed varies dramatically during a cycle. Data that is synchronously sampled in this way can be averaged across cycles in the angle domain thus reducing noise.
Other special analyses are provided to investigate phenomena such as torsional vibration and shaft twist.
The acquisition software has additional displays available on the realtime page for use with DATS.rotate. These include order tracking, order snapshot, waterfall, speed v. time curve and needle gauge.
DATS.rotate contains all of the functions and tools available in DATS.toolbox and adds all of the features mentioned above. You can enhance the DATS.rotate package with the following options...
- NVH Analysis Suite- Multiplane Balance Suite
DATS.rotate Software01-55-1004 DATS.rotate software. Includes DATS.toolbox
package and DATS Rotating Machinery Analysis Suite
Page 38
Page 42

http://www.prosig.com +1 248 443 2470 (USA) or contact your [email protected] +44 (0)1329 239925 (UK) local representative
SOFTWARE PRODUCTS
36
DATS.FATIGUE
Sys
tem
Pac
kage
sH
ardw
are
Sof
twar
eCo
nditio
n M
onito
ring
Trai
ning
& S
uppo
rt
.fatigue
DATS.fatigue provides a comprehensive set of programs for the fatigue & durability test engineer. The DATS software allows all of the fatigue analyses to be easily automated for efficient data classification.
Fatigue analysis may be broadly categorized under the following headings:
• Cycle Counting
• Component Data (Material Selection)
• Life Prediction
The first, and one of the most important stages is to collect a sufficiently long signal representative of the strain imposed on the structure. Typically signals are recorded from strain gauges sited near to a critical part of the component. After the signal is captured, using a Prosig P8000, the data manipulation stage begins by finding the peaks and troughs (turning points) within the data. This turning point data, together with the material selected from the database, may then be analyzed with one of the many life prediction functions. From the combination of the turning points and the material data the component’s life prediction can now be estimated.
Fatigue life estimation is divided into two classes both of which are based upon an increment of fatigue occurring for every stress-strain cycle.
The two basic analysis categories are...
• measured stress range versus number of cycles to failure curves, (S-N curves)
• strain life and critical location methods based upon cyclic strain history
These two approaches assume that the material has effectively fatigued when a crack is initiated. This type of analysis is most appropriate for use with highly stressed parts such as a car axle where the time between crack initiation and final failure is short.
DATS.fatigue contains all of the functions and tools available in DATS.toolbox and adds all of the features described above.
DATS.fatigue Software01-55-1005 DATS.fatigue software. Includes DATS.toolbox
package and DATS Fatigue Life Analysis Suite
Rainflow CountingLife Prediction
Stress LifeWeld Life
Strain LifeS-N CurvesЄ-N Curves
Materials DatabaseMaterials Editor
Worksheet AutomationScript (Macro) Automation

http://www.prosig.com +1 248 443 2470 (USA) or contact your [email protected] +44 (0)1329 239925 (UK) local representative
SOFTWARE PRODUCTSDATS.ACOUSTICS
37
Sys
tem
Pac
kage
sH
ardw
are
Sof
twar
eCo
nditio
n M
onito
ring
Trai
ning
& S
uppo
rt
.acoustic
The DATS.acoustics package is a complete and comprehensive set of functions for the study of acoustic phenomena.
The 1/N Octave filters can be used with either time signals or narrow band spectral data.
The Sound Power Analysis scripted measurement procedure allows the measurement of sound power using either sound intensity probes or microphones according to the international standards ISO3744, ISO3745 and ISO9614-1.
The Sound Level Meter module provides a number of analyses that mimic the operation of a simple sound level meter.
The Transmission Loss modules are automated measurement and analysis procedures for determining the effectiveness of either panels for room acoustics or pipes for exhaust mufflers.
The Room Acoustics Reverberation Time T60 and Total Absorption modules use the noise source switch-off method. The T60 determination is based on a practical measurement with a decay in the room of less than 60dB.
The Two-Microphone Impedance Measurement Tube, (B&K Type 4206), is a completely scripted measurement procedure for guiding the user in making an accurate measurement of the acoustic properties of small material samples, it complies with ISO10534 and ANSI E1050.
DATS.acoustic contains all of the functions and tools available in DATS.toolbox and adds all of the features mentioned above. You can enhance the DATS.acoustic package with the following options:-
- Psychoacoustics Analysis Suite- Source Path Analysis Suite
DATS.acoustic Software01-55-1006 DATS.acoustic software. Includes DATS.toolbox
package and DATS Acoustics Analysis Suite
1/N Octave FiltersSound Power
Sound IntensitySound Level Meter
Transmission Loss Room Acoustics
Two Microphone Impedance TubesWorksheet Automation
Script (Macro) Automation
Page 43
Page 43
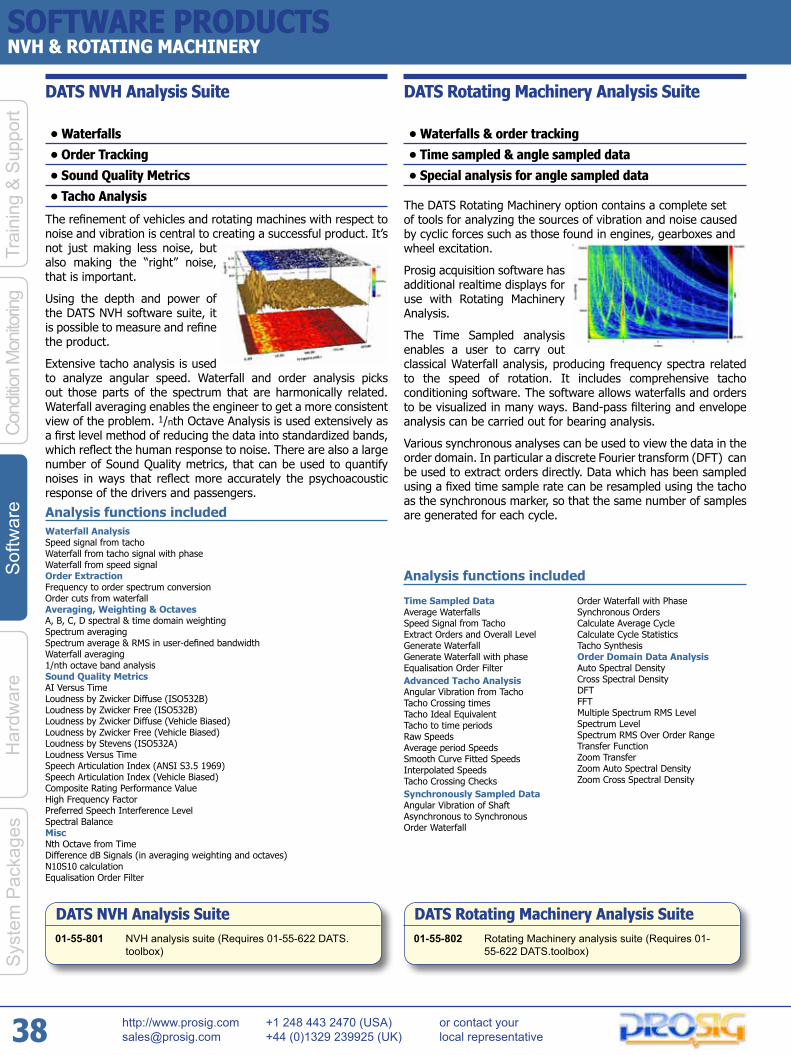
DATS NVH Analysis Suite
http://www.prosig.com +1 248 443 2470 (USA) or contact your [email protected] +44 (0)1329 239925 (UK) local representative
SOFTWARE PRODUCTS
38
NVH & ROTATING MACHINERY
DATS Rotating Machinery Analysis Suite
Sys
tem
Pac
kage
sH
ardw
are
Sof
twar
eCo
nditio
n M
onito
ring
Trai
ning
& S
uppo
rt
• Waterfalls
• Order Tracking
• Sound Quality Metrics
• Tacho Analysis
The refinement of vehicles and rotating machines with respect to noise and vibration is central to creating a successful product. It’s not just making less noise, but also making the “right” noise, that is important.
Using the depth and power of the DATS NVH software suite, it is possible to measure and refine the product.
Extensive tacho analysis is used to analyze angular speed. Waterfall and order analysis picks out those parts of the spectrum that are harmonically related. Waterfall averaging enables the engineer to get a more consistent view of the problem. 1/nth Octave Analysis is used extensively as a first level method of reducing the data into standardized bands, which reflect the human response to noise. There are also a large number of Sound Quality metrics, that can be used to quantify noises in ways that reflect more accurately the psychoacoustic response of the drivers and passengers.
Analysis functions includedWaterfall AnalysisSpeed signal from tachoWaterfall from tacho signal with phaseWaterfall from speed signalOrder ExtractionFrequency to order spectrum conversionOrder cuts from waterfallAveraging, Weighting & OctavesA, B, C, D spectral & time domain weightingSpectrum averagingSpectrum average & RMS in user-defined bandwidthWaterfall averaging1/nth octave band analysisSound Quality MetricsAI Versus TimeLoudness by Zwicker Diffuse (ISO532B)Loudness by Zwicker Free (ISO532B)Loudness by Zwicker Diffuse (Vehicle Biased)Loudness by Zwicker Free (Vehicle Biased)Loudness by Stevens (ISO532A)Loudness Versus TimeSpeech Articulation Index (ANSI S3.5 1969)Speech Articulation Index (Vehicle Biased)Composite Rating Performance ValueHigh Frequency FactorPreferred Speech Interference LevelSpectral BalanceMiscNth Octave from TimeDifference dB Signals (in averaging weighting and octaves)N10S10 calculationEqualisation Order Filter
• Waterfalls & order tracking
• Time sampled & angle sampled data
• Special analysis for angle sampled data
The DATS Rotating Machinery option contains a complete set of tools for analyzing the sources of vibration and noise caused by cyclic forces such as those found in engines, gearboxes and wheel excitation.
Prosig acquisition software has additional realtime displays for use with Rotating Machinery Analysis.
The Time Sampled analysis enables a user to carry out classical Waterfall analysis, producing frequency spectra related to the speed of rotation. It includes comprehensive tacho conditioning software. The software allows waterfalls and orders to be visualized in many ways. Band-pass filtering and envelope analysis can be carried out for bearing analysis.
Various synchronous analyses can be used to view the data in the order domain. In particular a discrete Fourier transform (DFT) can be used to extract orders directly. Data which has been sampled using a fixed time sample rate can be resampled using the tacho as the synchronous marker, so that the same number of samples are generated for each cycle.
Analysis functions included
Time Sampled DataAverage WaterfallsSpeed Signal from TachoExtract Orders and Overall LevelGenerate WaterfallGenerate Waterfall with phaseEqualisation Order FilterAdvanced Tacho AnalysisAngular Vibration from TachoTacho Crossing timesTacho Ideal EquivalentTacho to time periodsRaw SpeedsAverage period SpeedsSmooth Curve Fitted SpeedsInterpolated SpeedsTacho Crossing ChecksSynchronously Sampled DataAngular Vibration of ShaftAsynchronous to Synchronous Order Waterfall
Order Waterfall with PhaseSynchronous OrdersCalculate Average CycleCalculate Cycle StatisticsTacho SynthesisOrder Domain Data AnalysisAuto Spectral DensityCross Spectral DensityDFTFFTMultiple Spectrum RMS LevelSpectrum LevelSpectrum RMS Over Order RangeTransfer FunctionZoom TransferZoom Auto Spectral DensityZoom Cross Spectral Density
DATS NVH Analysis Suite01-55-801 NVH analysis suite (Requires 01-55-622 DATS.
toolbox)
DATS Rotating Machinery Analysis Suite01-55-802 Rotating Machinery analysis suite (Requires 01-
55-622 DATS.toolbox)

http://www.prosig.com +1 248 443 2470 (USA) or contact your [email protected] +44 (0)1329 239925 (UK) local representative
SOFTWARE PRODUCTSHAMMER IMPACT & STRUCTURAL ANIMATION
39
DATS Structural Animation Software
Sys
tem
Pac
kage
sH
ardw
are
Sof
twar
eCo
nditio
n M
onito
ring
Trai
ning
& S
uppo
rt
• frequency & Time Based Animation
• Operating Deflection Shapes
• full 3D Views
• Sophisticated Model Editor
• Built-in Hammer Acquisition Support
Frequency Animation uses the magnitude and phase of Frequency Response Functions (FRFs), FFTs, or cross spectra at each measurement position on the structure to reveal the motion at different frequencies.
Time Animation takes time based data and uses it to directly show the true position at each measurement point at each time step.
The graphical representation of the structure is achieved by setting up two- or three-dimensional space-frame models. The model may be created using a fully featured 3D graphical editor. Models can also be imported from NASTRAN, CSV and Universal files.
DATS Structural Animation Software01-55-629 Structural Animation with Frequency Domain
Animation and Time Domain Animation (Requires 01-55-622 DATS.toolbox)
• Animates data in time or frequency domains • Comes with fully featured, easy to use model editor • Split view display with VCR/PVR style playback and navigation • Built in interactive hammer acquisition for immediate results • Interactive band reject and band pass filtering in the time domain • Real time animation overlays for instant comparisons• A wide range of displays including: • Stress/Vibration/Intensity color map • Magnitude and Divergence • Nodal Persistence• Acceleration, Displacement and Velocity readouts • Support for CAE and SAE coordinate systems • Import geometry data from NASTRAN and generic CSV files • Export animations to video for presentations and results sharing• Attach all your model data with a single click• Many examples and templates to get you going
Features included
DATS Hammer Impact Analysis Software
• frequency Response functions (fRf)
• Structural Response Measurements
• Double Impact Detection
• Accept/Reject by User
• Automatic Averaging
• Integrated with DATS Structural Animation
Structural Response Measure-ments are an essential require-ment for engineers working on Noise and Vibration problems. The Hammer Impact Analysis guides the user through the process of making the measure-ments. Single-input, multi-out-put measurements are support-
ed. Transducer gain, sensitivity and triggering setup are provided by the familiar DATS signal setup.
The software gives the user full control over all aspects of the test including...
• the frequency range and resolution
• force & exponential window settings
• number of averages per measurement point
• auto reject double impacts and overloads
• use of Prosig remote keypad
A pre-test Wizard assists the user in setting up trigger levels and response window weighting factors.
An initial display of Time Histories and FFT spectra enables the input signal to be checked before the Transfer Functions are calculated. Vibration data can be displayed as Inertance, Apparent Mass, Mobility, Impedance, Receptance or Obstructance. The latest measurement is shown with the accumulating average. A reference target transfer function can also be superimposed.
The measurements can be saved in numerically sequenced datasets and the user has full control over whether just the H1 or H2 is required for each response, or whether any of the associated spectra (H2, Coherence, ASD, CSD) or the time histories are to be saved.
This package can also be used in other applications where a triggered acquisition, immediate data inspection and frequency response measurements are required.
DATS Hammer Impact Analysis Software01-55-627 Hammer Impact analysis software for P5000/P8000
(Requires 01-55-622 DATS.toolbox)

http://www.prosig.com +1 248 443 2470 (USA) or contact your [email protected] +44 (0)1329 239925 (UK) local representative
SOFTWARE PRODUCTS
40
MODAL ANALySIS & SOUND QUALITy AUDIO REPLAy
Sys
tem
Pac
kage
sH
ardw
are
Sof
twar
eCo
nditio
n M
onito
ring
Trai
ning
& S
uppo
rt
DATS Sound Quality Audio Replay Software
• Playback & Compare Multiple Signals
• Synthesis of Audio by filtering
• filter frequencies or Orders
• Vary filter with Speed
• Import from WAV
• Export to WAV & WMA
• View Sound Quality Metrics
The DATS Sound Quality Audio Replay (SQAR) package allows a user to listen to and analyze audio data. The replay software displays various data views (time series, orders, sound quality metrics, speed) with simultaneous audio output for listening. A click on one of the graphs will jump straight to a particular place or a couple of clicks will make the replay loop around a small section.
Multiple signals are loaded to form a playlist. While listening a simple click will switch between different signals. If the data is speed based the software will switch between signals at the same speed.
Multiple filtering with combinations of order filters and frequency filters allows detailed investigations and “what if?” analysis. The playlist may include both the original and the modified signals for direct comparison with each other. All filters have an optional speed profile. This allows varying amounts of filtering or gain to be applied to different parts of the signal according to the speed at that point.
VisualizationsTime HistoriesTime-Speed CurveOrder PlotsWaterfall PlotWaterfall Color MapSound Quality MetricsReal-time Speed ReadoutFiltersOrder PassOrder RejectButterworth Frequency (Band Pass)Butterworth Frequency (Band Reject)Filter Attenuation versus Speed
Features includedSound Quality MetricsLoudness Zwicker FreeZwicker DiffuseISO532B & Vehicle BiasedStevens (ISO532A)
Speech Articulation IndexANSI S3.5 1969Vehicle Biased
Composite Rating Performance ValueHigh Frequency FactorSpeech Interference LevelSpectral Balance
DATS Sound Quality Audio Replay Software01-55-717 Sound Quality Audio Replay software. (Requires
01-55-622 DATS.toolbox)04-55-782 Prosig Sound Quality Audio Replay add-on
consisting of a pair of Creative Inspire 2.1 speakers, Creative Soundblaster Audigy 2 external USB sound card, a pair of Sennheiser HD437 headphones (all items subject to availability)
DATS Modal Analysis Suite
• Experimental Modal Analysis (EMA)
• Operational Modal Analysis (OMA)
• Modal Parameter Identification
• Alternative Curve fitting Algorithms: SDOF MSDOF & MDOF (Frequency Domain) ERA-DC (Time Domain)
• Stability Diagram
• fRf Synthesis from Modal Parameters
• forced Response Prediction
The DATS Modal Analysis suite is provided for analysts who want to determine Modal Frequencies, Damping Factors & Modal Amplitudes from either measured frequency response functions, impulse response functions or from response-only data. A variety of frequency and time domain identification methods are provided for the extraction of these parameters. These include Half-Power methods, SDOF, MSDOF, MDOF and ERA-DC. The identified mode shapes can be displayed and animated using the Prosig Structural Animation package. A synthesis module is provided to enable Frequency Response Functions (FRF) to be regenerated from the identified parameters thereby revealing the accuracy of the modal model fitting. Forced responses can also be predicted by convolution of the regenerated FRFs with either simulated or known force inputs.
Features includedParametric identification of • Modal Frequencies• Damping Factors • Modal Amplitudes
Frequency and Time Domain Methods• Half-power estimates• SDOF, MSDOF, MDOF• ERA-DC
OMA Methods•FSDD (Frequency)•ERA-DC (Time)
FRF synthesis from Modal Parameters
DATS Modal Analysis Suite01-55-848 Modal analysis suite (Requires 01-55-622 DATS.
toolbox)

http://www.prosig.com +1 248 443 2470 (USA) or contact your [email protected] +44 (0)1329 239925 (UK) local representative
SOFTWARE PRODUCTSHUMAN RESPONSE & SOUND MAPPING
41
Sys
tem
Pac
kage
sH
ardw
are
Sof
twar
eCo
nditio
n M
onito
ring
Trai
ning
& S
uppo
rt
DATS Human Response Biodynamics Suite
• ISO2631 Weighting
• ISO8041 Weighting
• Vibration Dose Values
• SEAT Testing
• Vehicle Crash Biomechanics
The way in which we respond to vibration from tools, vehicles and machines affects the quality of our lives, and ultimately our health. The detrimental effect of vibration of the human body has been the subject of considerable research. The understanding of this subject has now advanced the knowledge of acceptable frequency limits for vibration exposure. The weighting filters for whole-body vibration, affecting vibrational and ride comfort, and those for the exposure to hand-arm vibration are included in the DATS Human Biodynamics package. Dose values can be calculated to ensure the acceptability of the product in an environment where the customer is ever more aware of comfort requirements, and the dangers of exposure to environmental effects.
Also included are functions to analyze vehicle crash data with special emphasis on data from dummies. Analyses include the Head Injury Criteria, FIR100 filtering and CFC filters. All the modules comply with the relevant SAEJ211 and NHTSA requirements.
The suite also includes analyses necessary for S.E.A.T. compliance testing.
DATS Human Response Biodynamics Suite01-55-803 Human Response Biodynamics analysis suite
(Requires 01-55-622 DATS.toolbox)
Human VibrationBuilding Vibration Assessment WeightingDIN45669 Building Vibration ExposureISO2631 Vibration Effects (pts 1,4 & 5)ISO5349 Hand ArmISO8041 Hand Arm WeightingISO8041 Body-X,Y,Z & Combined WeightingISO8041 Motion Sickness WeightingISO8041 No WeightingMax Transient Vibration Value (MTVV)Motion Sickness Dose Value (MSDV)Root Mean Quad (RMQ) MeasureVibration Dose Value (VDV & eVDV)Vibration Quality MeasuresVibration (BS6841) WeightingVibration (ISO2631) Weighting Vibration (ISO8041) WeightingVibration Quality Measures with TimeISO6954 Ship Vibration (Habitability)Short term Vibration Quality MeasuresSEAT TestingISO Time History from EM SpectrumISO 10326 Excitation Limits
Analysis functions includedGenerate EM SpectrumClass ‘n’ (ISO 10326)New Class
Gaussian Probability DensityAuto (Power) SpectrumProbability Density DistributionS.E.A.T Factor (ISO)Corrected S.E.A.T. RMS (EEC)Average S.E.A.T Factor (ISO)Average Corrected S.E.A.T. RMS (EEC)Compression in Time DomainCrash BiomechanicsSAEJ211 Filter (CFC60, 180, 600 & 1000)FIR100 FilterCheck Maximum ValueChest Severity IndexDeflection of Dummy RibsExceedance DurationHead Injury Criterion (HIC)Thoracic Trauma Index (TTI)Viscus Criterion (VC)Calculate x,y,z ResultantRemove Signal Bias
DATS Sound Mapping Software
• Sound Pressure Mapping
• Sound Intensity Mapping
• Sound Power Mapping
• graphical Overlays
• Color & Contour Maps
• full grid / Model Editor
The DATS Sound Mapping software package consists of two main facilities:
The first takes sound pressure measurements from a grid of microphones (or a single microphone moved between different grid points). The measurements are then used to create either a two-dimensional map of the sound emitted by the test piece as pressures or to create a two-dimensional map of the sound power. Both options display results as color or contour maps.
The second facility takes data from an intensity probe at a series of grid points across a test piece, this data is then used to create a sound intensity color or contour map to allow visualization of the sound fields. This data can also be used to create a sound power color or contour map.
In both cases the color or contour map can be overlaid on a picture of the test item to allow better visualization of the data.
DATS Sound Mapping Software01-55-636 Sound Mapping Software (Requires 01-55-622
DATS.toolbox)
Output TypesIntensity [W/m2]Intensity Density [(W/m2)/Hz]Power [W]Pressure [dB] or [dBA]Display TypesIntensity MapContour MapGraphical Overlays
Features includedBandwidth TypesNarrow Band SpectrumThird Octave Spectrum

http://www.prosig.com +1 248 443 2470 (USA) or contact your [email protected] +44 (0)1329 239925 (UK) local representative
SOFTWARE PRODUCTS
42
MULTIPLANE BALANCE & ACOUSTIC ANALySIS
Sys
tem
Pac
kage
sH
ardw
are
Sof
twar
eCo
nditio
n M
onito
ring
Trai
ning
& S
uppo
rt
DATS Acoustic Analysis Suite
• 1/N Octave filters
• Sound Power
• Sound Intensity
• Sound Level Meter
• Transmission Loss
• Room Acoustics
• Two Microphone Impedance Tubes
The 1/N Octave filters can be used with either time signals or narrow band spectral data.
The Sound Power Analysis scripted measurement procedure allows the measurement of sound power using either sound intensity probes or microphones according to the international standards ISO3744, ISO3745 and ISO9614-1.
The Sound Level Meter module provides a number of analyses that mimic the operation of a simple sound level meter.
The Transmission Loss modules are automated measurement and analysis procedures for determining the effectiveness of either panels for room acoustics or pipes for exhaust mufflers.
The Room Acoustics Reverberation Time T60 and Total Absorption modules use the noise source switch-off method. The T60 determination is based on a practical measurement with a decay in the room of less than 60dB.
The Two-Microphone Impedance Measurement Tube, (B&K Type 4206), is a completely scripted measurement procedure for guiding the user in making an accurate measurement of the acoustic properties of small material samples, it complies with ISO10534 and ANSI E1050.
DATS Acoustics Analysis Suite01-55-791 Acoustics analysis suite (Requires 01-55-622
DATS.toolbox)
DATS Multiplane Balancing Software
• Dual Tacho Support for 4x4 Vehicles
• Zero Imbalance
• Specified Imbalance
• Split Weight Calculation
Multi-plane Balancing analyzes the baseline vibrations and then the vibrations resulting from adding a trial mass (inertia) at each balance plane in turn. The software guides the user throughout the entire process. These measurements enable influence coefficients to be calculated. A least squares, optimized, multi-plane balancing algorithm, using a singular value decomposition algorithm (SVD), forms the mathematical heart of the software. An option to add bias is included.
Once the influence coefficients are known the software predicts the masses required to achieve a zero imbalance or some user specified imbalance. Test runs at these conditions may be made giving the actual weights added to compare the predicted and achieved results.
The user interface is designed to automate repetitive testing, taking the user through the necessary steps to perform the baseline capture and trials capture. Shaft configurations, containing such details as balance plane name, radius, preferred trial weight and split weight locations, may be set up and saved.
A pre-balance run-up allows identification of the ideal shaft speed to perform balance. Displays include first order components for each measurement position with individual and average values. The split weight graphical display shows the required shaft positions.
Diagrams of standard shaft configurations are provided to enable easy set up of vehicle balancing applications.
Features included
Multi-plane balancingDual Tacho support for 4x4 vehiclesSplit Weight calculationSpecified ImbalanceZero ImbalanceBias Factor SelectionSVD (Single Value Decomposition)
Primary SolutionRefinement by Least Squares MinimisationSynchronous ResamplingData Quality ChecksUser Defined Level of AveragingStandard Driveline Configurations
DATS Multiplane Balancing Software01-55-731 Multiplane Balancing Software (Requires 01-55-
622 DATS.toolbox)
Sound Quality MetricsAI Versus TimeLoudness (Zwicker) (ISO532B)Loudness by Stevens (ISO532A)Loudness Versus TimeNth Octave RMS Versus TimeSpeech Articulation Index (ANSI S3.5 1969)Speech Articulation Index (Vehicle Biased)Composite Rating Performance ValueHigh Frequency FactorPreferred Speech Interference LevelSpectral BalanceSound PowerSound Power from Sound Pressure (ISO3744, ISO3745) Sound Power from Sound Intensity (ISO9614-1) Sound Level Meter rms S time constantrms F time constantrms I time constant (peak)rms selectable time constantLeq with S time constantLeq with F time constantLeq with I time constant (peak)
Analysis functions includedLeq with selectable time constantLN Measure with S time constantLN Measure with F time constantLN Measure with selectable time constantSEL with S time constantSEL with F time constantSEL with selectable time constantMiscNth OctaveNth Octave RMS OutputNth Octave FilterThird OctaveMicrophone CalibrationSpectrum Weighting (A,B,C,D)Sound IntensityDifference dB SignalsA, B or C Weight Time SignalImpedance Tube ReflectionImpedance Tube AbsorptionReverberation TimesTransmission Loss through panelsTransmission Loss through pipes

http://www.prosig.com +1 248 443 2470 (USA) or contact your [email protected] +44 (0)1329 239925 (UK) local representative
SOFTWARE PRODUCTSPSyCHOACOUSTIC ANALySIS & SOURCE PATH ANALySIS
43
Sys
tem
Pac
kage
sH
ardw
are
Sof
twar
eCo
nditio
n M
onito
ring
Trai
ning
& S
uppo
rt
DATS Source Path Analysis Suite
• Transfer Path Analysis
• Source Contribution Analysis
• Path Contribution Ranking
The interior noise & vibration in a vehicle compartment is caused by various contributing exterior sources - primarily suspension and engine vibration. This raises two fundamental questions: “Which sources cause the most audible or tactile interior response?” and “Which paths are the most critical in transferring energy from the sources to the vehicle interior?” Transfer Path Analysis (also known as Noise Path Analysis or Source-Receiver Path Analysis) attempts to answer these questions by relating the vibrations measured at different locations around the vehicle to the sounds and vibrations measured inside the vehicle.
The first stage of experimental Transfer Path Analysis is the computation of the Principal Components of the system using Singular Value Decomposition (SVD). The SVD computation
produces a transformation (eigenvector) matrix that is used to derive virtual cross spectra between the virtual (vibration) references and the measured (sound/vibration) responses. These virtual cross spectra are then used to calculate Reference Related Auto (RRA) spectra at every response position. Each
RRA spectrum is related to just the coherent contributions from a particular reference source input.
Full Transfer Path Analysis requires not only data at the Source and Response locations, but also frequency response (FRF) functions referenced to the attachment points of the vibration isolators (anti-vibration mountings). The software estimates the dynamic forces present at the isolators and determines the contribution from each location as perceived at the (driver) response positions. The various contributions from the paths are ranked according to their severity at different frequencies or speeds.
DATS Source Path Analysis Suite01-55-799 Source Contribution Analysis software (Requires
01-55-622 DATS.toolbox)01-55-872 Transfer Path Analysis software (includes Source
Contribution Analysis) (Requires 01-55-622 DATS.toolbox)
DATS Psychoacoustics Analysis Suite
• Loudness
• Sharpness
• Roughness
• fluctuation Strength
• Prominence Ratio
In simple terms, psychoacoustics is the study of the relationship between the physical measures of sound, amplitude and frequency and the human perception of them.
The DATS psychoacoustics software extension provides a host of functions for the objective description of subjective sounds.
Hearing is not purely wave propagation from one medium to another, it is a sensory and perceptual event. When a person hears a sound, it arrives at the ear as a wave travelling through the air, but within the ear it is transformed into neural signals by a number of mechanisms. These nerve
pulses then travel to the brain where they are perceived. Hence for many problems in acoustics it is advantageous to take into account not just the mechanics of the environment, but also the fact that both the ear and the brain are involved in a person’s listening experience.
Human hearing can be compared to a spectrum analyzer - the ear resolves the spectral content of the pressure wave. This even includes phase information, which provides a significant part of the directional sensation of sound.
One good example of the power of psychoacoustics is listening to crackly, hiss-filled, vinyl records; the listener soon stops noticing the background noise, and enjoys the music, despite the presence of the hiss in the audible sound. A listener who does this often appears to forget about the noise altogether and may not be able to tell after listening if there was noise present. This effect is called psychoacoustical masking.
DATS Psychoacoustics Analysis Suite01-55-997 Psychoacoustics analysis suite (Requires 01-55-
622 DATS.toolbox)
Analysis functions included
LoudnessSharpnessRoughnessFluctuation StrengthTonalityProminence Ratio
Prominence StandardsANSI S1.13-2005ECMA74DIN 45681:2005

http://www.prosig.com +1 248 443 2470 (USA) or contact your [email protected] +44 (0)1329 239925 (UK) local representative
SOFTWARE PRODUCTS
44
TIME fREQUENCy ANALySIS & fATIgUE LIfE ANALySIS
Sys
tem
Pac
kage
sH
ardw
are
Sof
twar
eCo
nditio
n M
onito
ring
Trai
ning
& S
uppo
rt
DATS fatigue Life Analysis Suite
• Rainflow Counting
• Life Prediction
• Stress & Weld Life
• Strain Life
• S-N Curves & Є-N Curves
• Materials Database & Editor
The Fatigue Analysis package provides a comprehensive set of programs for the fatigue test engineer. DATS worksheets and Scripts can be used to automate the testing and analysis process from data capture to report preparation.
DATS fatigue Life Analysis Suite01-55-625 Fatigue Life Analysis suite (Requires 01-55-622
DATS.toolbox)
GeneralMaterials EditorPeak and Trough CountPrinciple StrainPrinciple StressResolve Rosette into x,y directionsRainflow CountingPeak and Trough CountDowning and SocieASTM 1049Construct Histogram Histogram Matrix PrintHistogram Matrix to ExcelStress LifeStress Life Fatigue PredictionS-N Fatigue Curve GenerationStress Life Load Sensitivity
Analysis functions included
Weld Failure ProbabilityWeld Life (Detailed)Weld Life (All Classes Report)Weld Life Load SensitivityStrain LifePeak and Trough ExtractLife Prediction Cycle by Cycle DetailLife Sensitivity with LoadLife Sensitivity with Notch FactorLife Prediction from Histogram Dataset
DATS Time-Frequency Analysis Suite
• Wavelets
• Born-Jordan
• Wigner Ville
• Zhao Atlas Marks
Two simple questions are often asked in Time Series Analysis. The first is - When did it happen? The second is - What frequency is it? These two questions can be answered by standard analyses. However, a third question - What frequency was it when it happened? - is less easily answered.
In the Time-Frequency Analysis package, Prosig have been able to implement a number of different algorithms including Wigner Ville, Atlas Zhao Marks, and Born Jordan, which all give slightly different emphasis to features of the signal.
DATS Time-Frequency Analysis Suite01-55-804 Time-Frequency analysis suite (Requires 01-55-
622 DATS.toolbox)
Born-JordanThe BORN-JORDAN module uses the Born-Jordan transform to analyze the time history signal into successive sections providing an estimation of frequency content as a function of time.
Wigner VilleThe DATS WIGNER module uses the Wigner Ville transform to analyze the time history signal into successive sections providing an estimation of frequency content as a function of time.
Zhao Atlas MarksThe ‘Zhao Atlas Marks’ distribution analyzes a time history into successive sections to provide an estimation of the frequency content as a function of time. It enhances the time and frequency resolution and suppresses the cross terms.
Also includes Wavelet Analysis
Mother Wavelet GenerationWavelet TransformsWavelet ReconstructionWavelet De-noisingWavelet Filtering
Analysis functions included
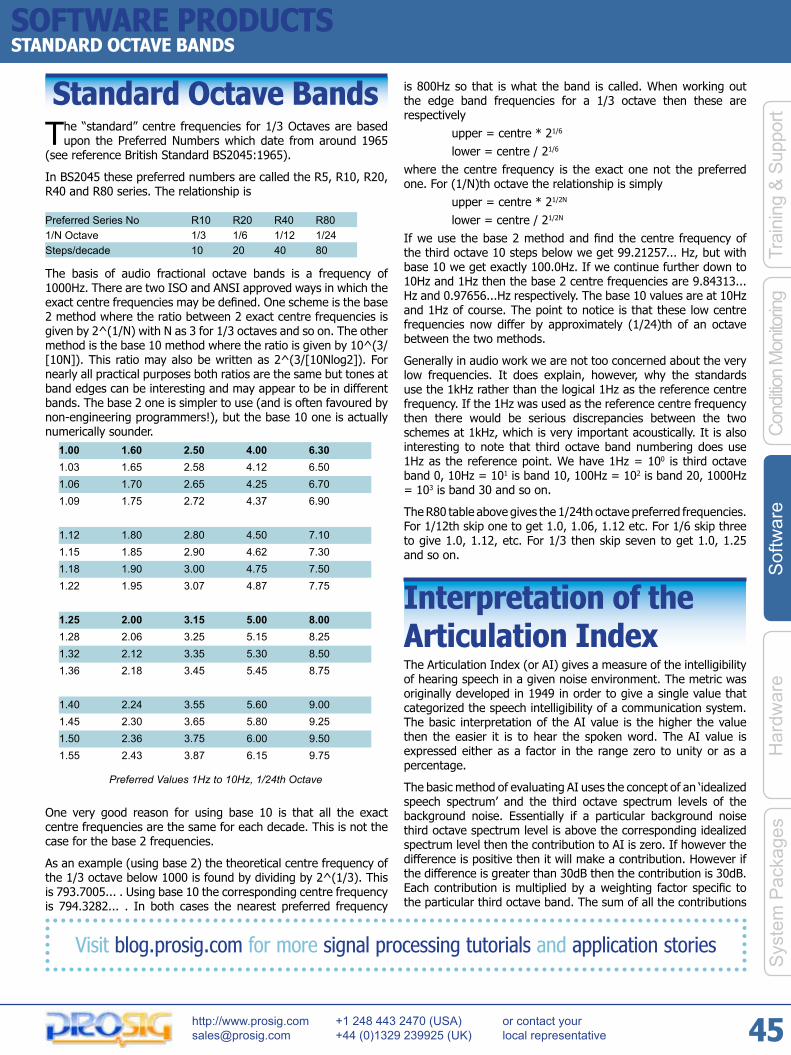
http://www.prosig.com +1 248 443 2470 (USA) or contact your [email protected] +44 (0)1329 239925 (UK) local representative
SOFTWARE PRODUCTSSTANDARD OCTAVE BANDS
45
Sys
tem
Pac
kage
sH
ardw
are
Sof
twar
eCo
nditio
n M
onito
ring
Trai
ning
& S
uppo
rt
Standard Octave BandsThe “standard” centre frequencies for 1/3 Octaves are based
upon the Preferred Numbers which date from around 1965 (see reference British Standard BS2045:1965).
In BS2045 these preferred numbers are called the R5, R10, R20, R40 and R80 series. The relationship is
Preferred Series No R10 R20 R40 R801/N Octave 1/3 1/6 1/12 1/24Steps/decade 10 20 40 80
The basis of audio fractional octave bands is a frequency of 1000Hz. There are two ISO and ANSI approved ways in which the exact centre frequencies may be defined. One scheme is the base 2 method where the ratio between 2 exact centre frequencies is given by 2^(1/N) with N as 3 for 1/3 octaves and so on. The other method is the base 10 method where the ratio is given by 10^(3/[10N]). This ratio may also be written as 2^(3/[10Nlog2]). For nearly all practical purposes both ratios are the same but tones at band edges can be interesting and may appear to be in different bands. The base 2 one is simpler to use (and is often favoured by non-engineering programmers!), but the base 10 one is actually numerically sounder.
One very good reason for using base 10 is that all the exact centre frequencies are the same for each decade. This is not the case for the base 2 frequencies.
As an example (using base 2) the theoretical centre frequency of the 1/3 octave below 1000 is found by dividing by 2^(1/3). This is 793.7005... . Using base 10 the corresponding centre frequency is 794.3282... . In both cases the nearest preferred frequency
1.00 1.60 2.50 4.00 6.301.03 1.65 2.58 4.12 6.501.06 1.70 2.65 4.25 6.701.09 1.75 2.72 4.37 6.90
1.12 1.80 2.80 4.50 7.101.15 1.85 2.90 4.62 7.301.18 1.90 3.00 4.75 7.501.22 1.95 3.07 4.87 7.75
1.25 2.00 3.15 5.00 8.001.28 2.06 3.25 5.15 8.251.32 2.12 3.35 5.30 8.501.36 2.18 3.45 5.45 8.75
1.40 2.24 3.55 5.60 9.001.45 2.30 3.65 5.80 9.251.50 2.36 3.75 6.00 9.501.55 2.43 3.87 6.15 9.75
Preferred Values 1Hz to 10Hz, 1/24th Octave
is 800Hz so that is what the band is called. When working out the edge band frequencies for a 1/3 octave then these are respectively upper = centre * 21/6
lower = centre / 21/6
where the centre frequency is the exact one not the preferred one. For (1/N)th octave the relationship is simply upper = centre * 21/2N
lower = centre / 21/2N
If we use the base 2 method and find the centre frequency of the third octave 10 steps below we get 99.21257... Hz, but with base 10 we get exactly 100.0Hz. If we continue further down to 10Hz and 1Hz then the base 2 centre frequencies are 9.84313...Hz and 0.97656...Hz respectively. The base 10 values are at 10Hz and 1Hz of course. The point to notice is that these low centre frequencies now differ by approximately (1/24)th of an octave between the two methods.
Generally in audio work we are not too concerned about the very low frequencies. It does explain, however, why the standards use the 1kHz rather than the logical 1Hz as the reference centre frequency. If the 1Hz was used as the reference centre frequency then there would be serious discrepancies between the two schemes at 1kHz, which is very important acoustically. It is also interesting to note that third octave band numbering does use 1Hz as the reference point. We have 1Hz = 100 is third octave band 0, 10Hz = 101 is band 10, 100Hz = 102 is band 20, 1000Hz = 103 is band 30 and so on.
The R80 table above gives the 1/24th octave preferred frequencies. For 1/12th skip one to get 1.0, 1.06, 1.12 etc. For 1/6 skip three to give 1.0, 1.12, etc. For 1/3 then skip seven to get 1.0, 1.25 and so on.
Interpretation of the Articulation IndexThe Articulation Index (or AI) gives a measure of the intelligibility of hearing speech in a given noise environment. The metric was originally developed in 1949 in order to give a single value that categorized the speech intelligibility of a communication system. The basic interpretation of the AI value is the higher the value then the easier it is to hear the spoken word. The AI value is expressed either as a factor in the range zero to unity or as a percentage.
The basic method of evaluating AI uses the concept of an ‘idealized speech spectrum’ and the third octave spectrum levels of the background noise. Essentially if a particular background noise third octave spectrum level is above the corresponding idealized spectrum level then the contribution to AI is zero. If however the difference is positive then it will make a contribution. However if the difference is greater than 30dB then the contribution is 30dB. Each contribution is multiplied by a weighting factor specific to the particular third octave band. The sum of all the contributions
Visit blog.prosig.com for more signal processing tutorials and application stories

http://www.prosig.com +1 248 443 2470 (USA) or contact your [email protected] +44 (0)1329 239925 (UK) local representative
SOFTWARE PRODUCTS
46
INTERPRETATION Of THE ARTICULATION INDEx
Sys
tem
Pac
kage
sH
ardw
are
Sof
twar
eCo
nditio
n M
onito
ring
Trai
ning
& S
uppo
rt
is the AI value. This may be expressed as shown below.
Contribution = IdealisedSpectrumdB[k] – NoiseLeveldB[k]
If (Contribution < 0.0) Contribution = 0.0
If (Contribution > 30.0 ) Contribution = 30.0
Contribution = Contribution * WeightingFactor[k]
The contribution is found for each third octave band in the specified frequency range and summed to give the AI value.
There is however some confusion as there are three separate approaches for calculating the AI value. One method is the strict ANSI S3.5-1969 scheme, another one is generally known as the vehicle AI value and the third one as the Room AI value. We distinguish between these as $AI_ANSI, $AI_Veh and $AI_Room. The ANSI method uses third octaves in the bands 200Hz to 5kHz whilst the Vehicle and Room versions add the 6.3kHz band as well. The fundamental difference in the calculations is that the ANSI scheme attempts to take account of the existing overall noise level to adjust the levels of the Idealized Spectrum. The idea here is that if the background noise level changes then we speak either louder or softer as appropriate. That is it is strictly concerned with speech intelligibility and is not as concerned with the volume or loudness required. The vehicle and room versions of the AI are concerned with assessing sound quality in the interior environment of the vehicle or room. Thus they use what may be described as a fixed target speech spectrum. In consequence the overall level as well as the spectrum shape affect the metric. By convention the $AI_ANSI and $AI_Room values are usually given as an index from zero to unity but the $AI_Veh is usually given as a percentage. The $AI_Veh and $AI_Room give quite similar values. Figure 1 below shows the ANSI Ideal Speech spectrum, the fixed ‘target’ spectrum for $AI_Veh and a raised version of the ANSI spectrum whose overall matches that of the vehicle target spectrum.
The differences in the two principle spectra are obvious. However by comparing the ANSI ‘raised’ spectrum to the vehicle ‘target’ spectrum, it is clear that the vehicle target spectrum is more accommodating at the higher frequencies but less tolerant at the
lower frequencies.
The ANSI method uses 65dB as the reference level to adjust for the overall level of the background noise level. If the background noise has an overall level of P dB, then (P –65) dB is added to each idealized spectrum third octave level. That is to a large extent $AI_ANSI is independent of the overall level. This is not the case for $AI_Veh which uses a fixed idealized speech spectrum level.
The ANSI scheme also has an absolute ‘maximum tolerable level’ and a ‘threshold level’ for each third octave band. Thus if any adjusted level is above or below these, then the corresponding limit value is used in the adjusted spectrum. There is also another aspect in the $AI_ANSI calculation for high overall level signals. This is an anechoic correction which basically reduces the idealized speech spectrum so that the $AI_ANSI value falls with very loud background noise levels. The $AI_Veh and $AI_Room calculations do not have these factors.
The final difference between the three approaches is that each has different weighting values. All the sets of weighting values are biased towards the 1.6 and 2kHz bands with the $AI_ANSI being slightly flatter. Actually the $AI_Room calculation method is slightly different as it uses a comparison vector for each third octave band. If a measured third octave noise level is less than j comparison levels in its vector then the added contribution is (j 0.01). There are of course 100 comparison levels.
Figure 2 shows the example third octave background noise level given in the ANSI specification. This has an overall level of 75.2dB and an ANSI Articulation Index of 0.547
The $AI_ANSI and $AI_Veh values were calculated for this spectrum and several identically shaped spectra adjusted to different overall levels. The loudness in Sones was also computed. Results are shown in the table below.
Overall dB $AI_ANSI $AI_Veh %
Loudness Sones
45 0.547 99.70 2.93
55 0.547 94.21 6.24
65 0.547 76.89 12.31
75 0.547 46.61 23.35
85 0.544 18.77 43.27
95 0.410 2.75 79.37
105 0.204 0 149.65
Note The $AI_ANSI value is shown as an index from zero to unity
Visit blog.prosig.com for more signal processing tutorials and application stories
Figure 1: Standard example AI noise spectrumFigure 2: Third octave background noise level

http://www.prosig.com +1 248 443 2470 (USA) or contact your [email protected] +44 (0)1329 239925 (UK) local representative
SOFTWARE PRODUCTSA, B & C WEIGHTING
47
Sys
tem
Pac
kage
sH
ardw
are
Sof
twar
eCo
nditio
n M
onito
ring
Trai
ning
& S
uppo
rt
but that $AI_Veh is shown as a percentage.
From the table it is clear that the ANSI AI is sensibly independent of the overall level until the anechoic factors take effect at high overall levels. The Vehicle AI however with its fixed target does vary with overall level. It has essentially an inverse relationship of some form to loudness.
Both AI calculation methods are valid for the purposes for which they were designed. The ANSI version tests speech intelligibility, the vehicle and room versions test what may be called normal level speech quality.
A, B and C WeightingThe DATS analysis function WEIGHT provides the ability to apply A, B, C or D weighting to any frequency spectra. The input may be an FFT, an auto-spectrum or a cross spectrum and may be in real, complex or modulus & phase form.
Some devices, particularly digital tape recorders, apply A-weighting to all their data in order to achieve acceptable data compression. This is fine unless you want to analyze the unweighted data or apply a different weighting factor. Using DATS it is a simple task to instruct the WEIGHT module to either simply unweight the data or remove one weighting factor and apply another.
The presence of the Named Element $WEIGHT in a signal is used to tell DATS whether any weighting has been applied to a signal. Correctly setting this for data gathered with A-weighting will inform the WEIGHT module to treat it accordingly.
Fig. 1 : Example of A, B & C weighting
The screenshot above shows four DATS signals. Each one is the frequency spectrum of a broad band random input. The first ,dark blue is unweighted and the red trace shows the same data A-weighted. It can be easily seen how A weighting depresses frequencies below 500Hz whilst increasing slightly those above 1250Hz. For completeness the B-weighted signal is shown along with the C-weighted one. These weightings suppress frequencies below about 250Hz and 20Hz respectively.
D weighting, which for clarity is not shown, is similar to B weighting except that it significantly boosts frequencies in the 1250Hz to 10kHz region. It was designed specifically for assessment of aircraft noise.
Generally speaking the overall level found from A weighted spectra correlates well with subjective assessment of loudness. The C weighting curve gives equal emphasis over the normal hearing range from 31.5Hz to 8kHz.
Audio Equalisation Filter & Parametric Filtering
When working with audio signals a common requirement is to be able to equalise, cut or boost various frequency bands. A large number of hardware devices on the market provide this capability. The key aspect is that such filters are able to control bandwidth, centre frequency and gain separately. There are broadly two
Visit blog.prosig.com for more signal processing tutorials and application stories

http://www.prosig.com +1 248 443 2470 (USA) or contact your [email protected] +44 (0)1329 239925 (UK) local representative
SOFTWARE PRODUCTS
48
AUDIO EQUALISATION fILTER & PARAMETRIC fILTERINg
Sys
tem
Pac
kage
sH
ardw
are
Sof
twar
eCo
nditio
n M
onito
ring
Trai
ning
& S
uppo
rt
classes of filter used, a “shelving” filter and an “equalizing “filter (also known as a “peak” filter). A shelving filter is akin to low pass and high pass filters. An equalizing filter is like a bandpass or band reject filter.
For sound quality replay and similar the interest is in equalizing filters, specifically in conjunction with removing narrow band resonances our, when dealing with rotating machines, with removal of orders. Actually it is not necessarily the removal of an order but its reduction, or increase, by a specific amount (gain).
The basic component of an equalizing filter is an All Pass filter used in a feedback loop. Equalizing filters could be based upon standard filters such as Butterworth, Chebyshev and similar. However, experience in audio reconstruction suggests that a more “rounded” filter characteristic is better for audio replay. Accordingly a software version of a standard audio equalizing filter has been implemented in DATS. The initial version allows simple band reject (cut) and band increase (boost) by setting the dB gain as negative for cut and positive for boost. The bandwidth and centre frequency are specified independently.
Another aspect caused by filtering is the phase of the output signal. The software allows a choice of “phaseless” or standard filtering. The results for a typical set of values (gain = -10 dB, bandwidth =4Hz) are shown below. In this example the cut filter gives a +/- 30 degrees of phase change. The phaseless implementation reduces this to less than +/- 0.2 degrees.
A major use of the equalizing filter is in enhancing or cutting orders by a specific amount. For example it then becomes possible
Visit blog.prosig.com for more signal processing tutorials and application stories
to consider what a signal sounds like if a particular order was reduced by N dB.
In the example below we have used the standard run down dataset and reduced first order by 6dB. We used one tacho pulse per rev.
After equalizing the original time history both signals were waterfall analyzed and first order extracted. The results are shown below.
The 6dB reduction is clearly seen. The ratio (black line) between the two order cuts should be a constant, which it is except at rapid rates of change of the order. Even there the variations are generally within +/- 1dB.
Standard phase
Order 1 cut
“Phaseless“
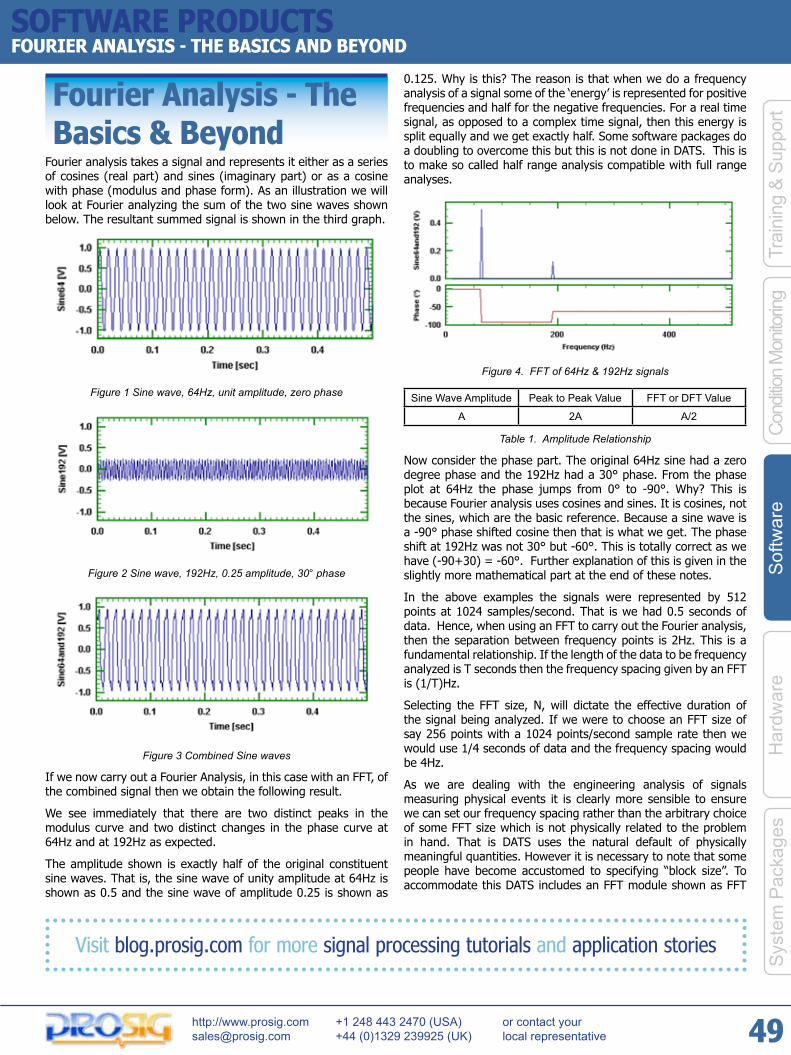
http://www.prosig.com +1 248 443 2470 (USA) or contact your [email protected] +44 (0)1329 239925 (UK) local representative
SOFTWARE PRODUCTSfOURIER ANALySIS - THE BASICS AND BEyOND
49
Sys
tem
Pac
kage
sH
ardw
are
Sof
twar
eCo
nditio
n M
onito
ring
Trai
ning
& S
uppo
rt
Fourier Analysis - The Basics & Beyond
Fourier analysis takes a signal and represents it either as a series of cosines (real part) and sines (imaginary part) or as a cosine with phase (modulus and phase form). As an illustration we will look at Fourier analyzing the sum of the two sine waves shown below. The resultant summed signal is shown in the third graph.
Figure 1 Sine wave, 64Hz, unit amplitude, zero phase
Figure 2 Sine wave, 192Hz, 0.25 amplitude, 30° phase
Figure 3 Combined Sine waves
If we now carry out a Fourier Analysis, in this case with an FFT, of the combined signal then we obtain the following result.
We see immediately that there are two distinct peaks in the modulus curve and two distinct changes in the phase curve at 64Hz and at 192Hz as expected.
The amplitude shown is exactly half of the original constituent sine waves. That is, the sine wave of unity amplitude at 64Hz is shown as 0.5 and the sine wave of amplitude 0.25 is shown as
0.125. Why is this? The reason is that when we do a frequency analysis of a signal some of the ‘energy’ is represented for positive frequencies and half for the negative frequencies. For a real time signal, as opposed to a complex time signal, then this energy is split equally and we get exactly half. Some software packages do a doubling to overcome this but this is not done in DATS. This is to make so called half range analysis compatible with full range analyses.
Figure 4. FFT of 64Hz & 192Hz signals
Sine Wave Amplitude Peak to Peak Value FFT or DFT Value
A 2A A/2
Table 1. Amplitude Relationship
Now consider the phase part. The original 64Hz sine had a zero degree phase and the 192Hz had a 30° phase. From the phase plot at 64Hz the phase jumps from 0° to -90°. Why? This is because Fourier analysis uses cosines and sines. It is cosines, not the sines, which are the basic reference. Because a sine wave is a -90° phase shifted cosine then that is what we get. The phase shift at 192Hz was not 30° but -60°. This is totally correct as we have (-90+30) = -60°. Further explanation of this is given in the slightly more mathematical part at the end of these notes.
In the above examples the signals were represented by 512 points at 1024 samples/second. That is we had 0.5 seconds of data. Hence, when using an FFT to carry out the Fourier analysis, then the separation between frequency points is 2Hz. This is a fundamental relationship. If the length of the data to be frequency analyzed is T seconds then the frequency spacing given by an FFT is (1/T)Hz.
Selecting the FFT size, N, will dictate the effective duration of the signal being analyzed. If we were to choose an FFT size of say 256 points with a 1024 points/second sample rate then we would use 1/4 seconds of data and the frequency spacing would be 4Hz.
As we are dealing with the engineering analysis of signals measuring physical events it is clearly more sensible to ensure we can set our frequency spacing rather than the arbitrary choice of some FFT size which is not physically related to the problem in hand. That is DATS uses the natural default of physically meaningful quantities. However it is necessary to note that some people have become accustomed to specifying “block size”. To accommodate this DATS includes an FFT module shown as FFT
Visit blog.prosig.com for more signal processing tutorials and application stories
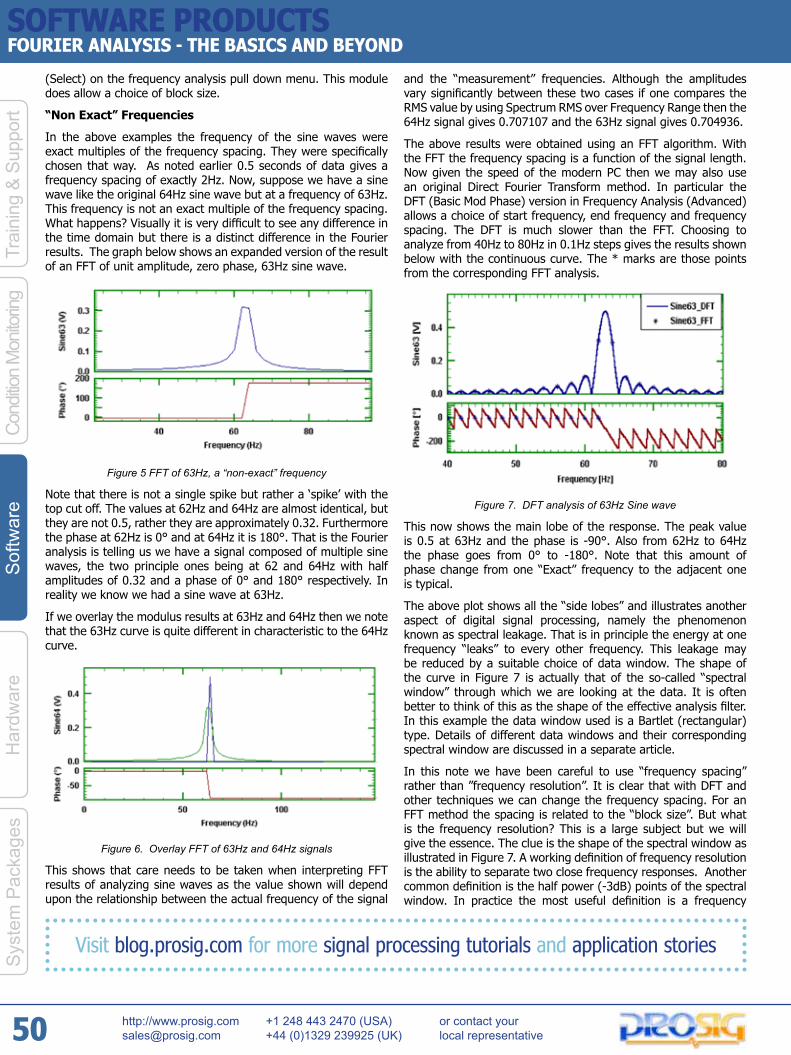
http://www.prosig.com +1 248 443 2470 (USA) or contact your [email protected] +44 (0)1329 239925 (UK) local representative
SOFTWARE PRODUCTS
50
fOURIER ANALySIS - THE BASICS AND BEyOND
Sys
tem
Pac
kage
sH
ardw
are
Sof
twar
eCo
nditio
n M
onito
ring
Trai
ning
& S
uppo
rt
(Select) on the frequency analysis pull down menu. This module does allow a choice of block size.
“Non Exact” Frequencies
In the above examples the frequency of the sine waves were exact multiples of the frequency spacing. They were specifically chosen that way. As noted earlier 0.5 seconds of data gives a frequency spacing of exactly 2Hz. Now, suppose we have a sine wave like the original 64Hz sine wave but at a frequency of 63Hz. This frequency is not an exact multiple of the frequency spacing. What happens? Visually it is very difficult to see any difference in the time domain but there is a distinct difference in the Fourier results. The graph below shows an expanded version of the result of an FFT of unit amplitude, zero phase, 63Hz sine wave.
Figure 5 FFT of 63Hz, a “non-exact” frequency
Note that there is not a single spike but rather a ‘spike’ with the top cut off. The values at 62Hz and 64Hz are almost identical, but they are not 0.5, rather they are approximately 0.32. Furthermore the phase at 62Hz is 0° and at 64Hz it is 180°. That is the Fourier analysis is telling us we have a signal composed of multiple sine waves, the two principle ones being at 62 and 64Hz with half amplitudes of 0.32 and a phase of 0° and 180° respectively. In reality we know we had a sine wave at 63Hz.
If we overlay the modulus results at 63Hz and 64Hz then we note that the 63Hz curve is quite different in characteristic to the 64Hz curve.
Figure 6. Overlay FFT of 63Hz and 64Hz signals
This shows that care needs to be taken when interpreting FFT results of analyzing sine waves as the value shown will depend upon the relationship between the actual frequency of the signal
and the “measurement” frequencies. Although the amplitudes vary significantly between these two cases if one compares the RMS value by using Spectrum RMS over Frequency Range then the 64Hz signal gives 0.707107 and the 63Hz signal gives 0.704936.
The above results were obtained using an FFT algorithm. With the FFT the frequency spacing is a function of the signal length. Now given the speed of the modern PC then we may also use an original Direct Fourier Transform method. In particular the DFT (Basic Mod Phase) version in Frequency Analysis (Advanced) allows a choice of start frequency, end frequency and frequency spacing. The DFT is much slower than the FFT. Choosing to analyze from 40Hz to 80Hz in 0.1Hz steps gives the results shown below with the continuous curve. The * marks are those points from the corresponding FFT analysis.
Figure 7. DFT analysis of 63Hz Sine wave
This now shows the main lobe of the response. The peak value is 0.5 at 63Hz and the phase is -90°. Also from 62Hz to 64Hz the phase goes from 0° to -180°. Note that this amount of phase change from one “Exact” frequency to the adjacent one is typical.
The above plot shows all the “side lobes” and illustrates another aspect of digital signal processing, namely the phenomenon known as spectral leakage. That is in principle the energy at one frequency “leaks” to every other frequency. This leakage may be reduced by a suitable choice of data window. The shape of the curve in Figure 7 is actually that of the so-called “spectral window” through which we are looking at the data. It is often better to think of this as the shape of the effective analysis filter. In this example the data window used is a Bartlet (rectangular) type. Details of different data windows and their corresponding spectral window are discussed in a separate article.
In this note we have been careful to use “frequency spacing” rather than ”frequency resolution”. It is clear that with DFT and other techniques we can change the frequency spacing. For an FFT method the spacing is related to the “block size”. But what is the frequency resolution? This is a large subject but we will give the essence. The clue is the shape of the spectral window as illustrated in Figure 7. A working definition of frequency resolution is the ability to separate two close frequency responses. Another common definition is the half power (-3dB) points of the spectral window. In practice the most useful definition is a frequency
Visit blog.prosig.com for more signal processing tutorials and application stories

http://www.prosig.com +1 248 443 2470 (USA) or contact your [email protected] +44 (0)1329 239925 (UK) local representative
SOFTWARE PRODUCTSfOURIER ANALySIS - THE BASICS AND BEyOND
51
Sys
tem
Pac
kage
sH
ardw
are
Sof
twar
eCo
nditio
n M
onito
ring
Trai
ning
& S
uppo
rt
bandwidth known as the Equivalent Noise Band Width (ENBW). This is very similar to the half power points definition. ENBW is determined entirely by the shape of the data window used and the duration of the data used in the FFT processing.
Signal Duration Effects
If we have data taken over a longer period then the frequency spacing will be narrower. In many cases this will assist the problem but if there is no exact match the same phenomenon will arise.
Fourier analysis tells us the amplitude and phase of that set of cosines which have the same duration as the original signal. Suppose now we take a signal which again is composed of unit amplitude 64Hz sine wave and a 0.25 amplitude 192Hz sine wave signals but this time the 64Hz signal occupies the first half and the 192Hz signal occupies the second half. That is we now have a one second signal as shown below.
Figure 8. Two sines joined
The result of an FFT of these two joined signals is shown below.
Figure 9 FFT of two joined sinewaves
There are, as expected, significant frequencies at 64Hz and 192Hz. However the half amplitudes are now 0.25 (instead of 0.5) and 0.0625 (instead of 0.125). One interpretation of what the FFT is telling us is that there is a cosine wave at 64Hz of half amplitude 0.25 for the whole one second duration and another one of half amplitude 0.0625 for the whole duration. But we know that we had a 64Hz signal with a half amplitude of 0.5 for the first part of the time and a 192Hz signal with a half amplitude of 0.125 for the second part. What is happening?
A closer look at the spectrum around 64Hz as shown below reveals that we have a large number of frequencies around 64Hz. This time they are 1Hz apart as we had one second of data. Their relative amplitudes and phases combine to double the amplitude
at 64Hz over the first part and to cancel during the second part. The same of course happens in reverse around those frequencies close to 192Hz.
Figure 10. FFT (part) of joined signals
Another example is where a signal is extended by zeroes. Again the amplitude is reduced. In this case the reduction is proportional to the percentage extension by zeroes.
The important point to note is that the Fourier analysis assumes that the sines and cosines last for the entire duration.
Swept Sine Signal
With a swept sine signal theoretically each frequency only lasts for an instant in time. A swept sine signal sweeping from 10Hz to 100Hz is shown below.
Figure 11 Swept sine, unit amplitude, !0 to 100Hz.
Figure 12 FFT of Swept Sine
This has 512 points at 1024 samples/second. Thus the sweep rate was 180Hz/second. The FFT of that signal shows an amplitude of about 0.075. Over the duration of the sweep the phase goes from around zero to -2000° and then settles to -180° above 100Hz. If the sweep rate is lowered to around 10Hz/second then the amplitude becomes about 0.019. The relationship between the
Visit blog.prosig.com for more signal processing tutorials and application stories

http://www.prosig.com +1 248 443 2470 (USA) or contact your [email protected] +44 (0)1329 239925 (UK) local representative
SOFTWARE PRODUCTS
52
fOURIER ANALySIS - THE BASICS AND BEyOND
Sys
tem
Pac
kage
sH
ardw
are
Sof
twar
eCo
nditio
n M
onito
ring
Trai
ning
& S
uppo
rt
spectrum level the amplitude and sweep rate of the original swept sine is not straight forward.
It is clear that one has to interpret a simple Fourier analysis, whether it is done by an FFT or by a DFT, with some care. A Fourier analysis shows the (half) amplitudes and phases of the constituent cosine waves that exist for the whole duration of that part of the signal that has been analyzed. Although we have not discussed it, a Fourier analyzed signal is invertible. That is if we have the Fourier analysis over the entire frequency range from zero to half sample rate then we may do an inverse Fourier transform to get back to the time signal. One point that arises from this is that if the signal being analyzed has some random noise in it, then so does the Fourier transformed signal. Fourier analysis by itself does nothing to remove or minimise the effects of noise. Thus simple Fourier analysis is not suitable for random data, but it is for signals such as transients and complicated or simple periodic signals such as those generated by an engine running at a constant speed.
We have not considered Auto Spectral Density (also sometimes called Power Spectral Density) or RMS Spectrum Level Analyses here. They are discussed in another article. However for completeness it is worth noting that the essential difference between ASD analysis and FFT analysis is that ASDs are describing the distribution in frequency of the ‘power’ in the signal whilst Fourier analysis is determining (half) amplitudes and phases. While ASDs and RMS Spectrum Level analyses do reduce the effects of any randomness, Fourier analysis does not. Where confusion occurs is that both analysis methods may use FFT algorithms. This is not to do with the objective of the analysis or its properties but rather with efficiency of implementation. After all every analysis will use addition. That is just a mathematical operation and so, in that sense, is the use of an FFT.
A Little Mathematics
We will not go into all the mathematical niceties except to see that a Fourier series could be written in the forms below. In real and imaginary terms we have
and in modulus and phase form as
The above forms are a slightly unusual way of expressing the Fourier expansion. For instance θ is in degrees. More significantly the product fntk is shown explicitly. Usually in an FFT then fn is expressed as n/NΔt and tk as kΔt where Δt is the time between samples. This gives the relationship of the form
However, the point of using fntk explicitly above is to indicate that nothing in the Fourier expansion inhibits the choice of actual frequency at which we evaluate the Fourier coefficients. The FFT gains speed by being selective about where it evaluates the coefficients and also restrictive in the values of N that are permitted. There are ways around these but in most implementations, for practical purposes N is restricted to being a power of 2.
This means that with a DFT we can actually evaluate the Fourier coefficients at any frequency provided we obey the anti aliasing (Nyquist) criterion. The DFT is slower than an FFT. Another way of getting at the finer detail and still getting some speed advantage is to use the so-called Zoom FFT based on the Chirp-z transform. Again the relative advantages are discussed elsewhere.
As a historical note it is perhaps interesting to recall that Fourier did not generate his series in order to carry out frequency analysis but rather to determine a least squares error approximation to a function.
Visit blog.prosig.com for more signal processing tutorials and application stories
DR COLIN MERCERThe articles in this section are written by Dr Colin Mercer, Technical Director, of Prosig. You can find many more articles, as well as
application stories and news articles, on the Prosig Signal Processing Blog at http://blog.prosig.com. Colin Mercer is the Technical Director of Prosig and has prime responsibility for signal processing and its applications. He was formerly at the Institute of Sound and Vibration research (ISVR), Southampton University where he founded the Data Analysis Centre. He is a Chartered Engineer and a Fellow of the British Computer Society.

CONDITION MONITORING
54 protor system
57 protor screenshots
58 protor in action
59 protor mobile system
60 “protor for shaft displacement measurements”
61 “protor signal conditioning for high-common mode and isolation”
62 “protor for auxiliary machine monitoring”
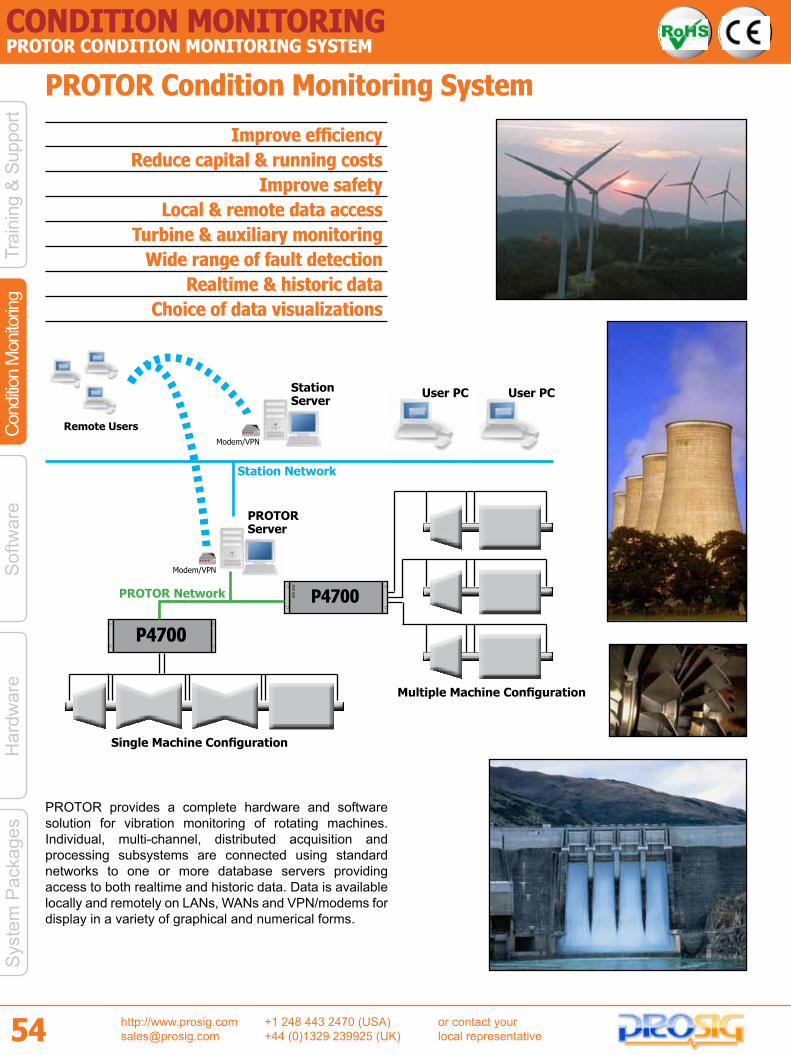
CONDITION MONITORINGPROTOR CONDITION MONITORING SYSTEM
Sys
tem
Pac
kage
sH
ardw
are
Sof
twar
eCo
nditio
n M
onito
ring
Trai
ning
& S
uppo
rt
http://www.prosig.com +1 248 443 2470 (USA) or contact your [email protected] +44 (0)1329 239925 (UK) local representative54
PROTOR Condition Monitoring System
PROTOR provides a complete hardware and software solution for vibration monitoring of rotating machines. Individual, multi-channel, distributed acquisition and processing subsystems are connected using standard networks to one or more database servers providing access to both realtime and historic data. Data is available locally and remotely on LANs, WANs and VPN/modems for display in a variety of graphical and numerical forms.
Improve efficiencyReduce capital & running costs
Improve safetyLocal & remote data access
Turbine & auxiliary monitoringWide range of fault detection
Realtime & historic dataChoice of data visualizations
User PC
Modem/VPN
PROTORServer
Remote Users
Station Network
PROTOR Network
Single Machine Configuration
Multiple Machine Configuration
User PC
Modem/VPN
StationServer
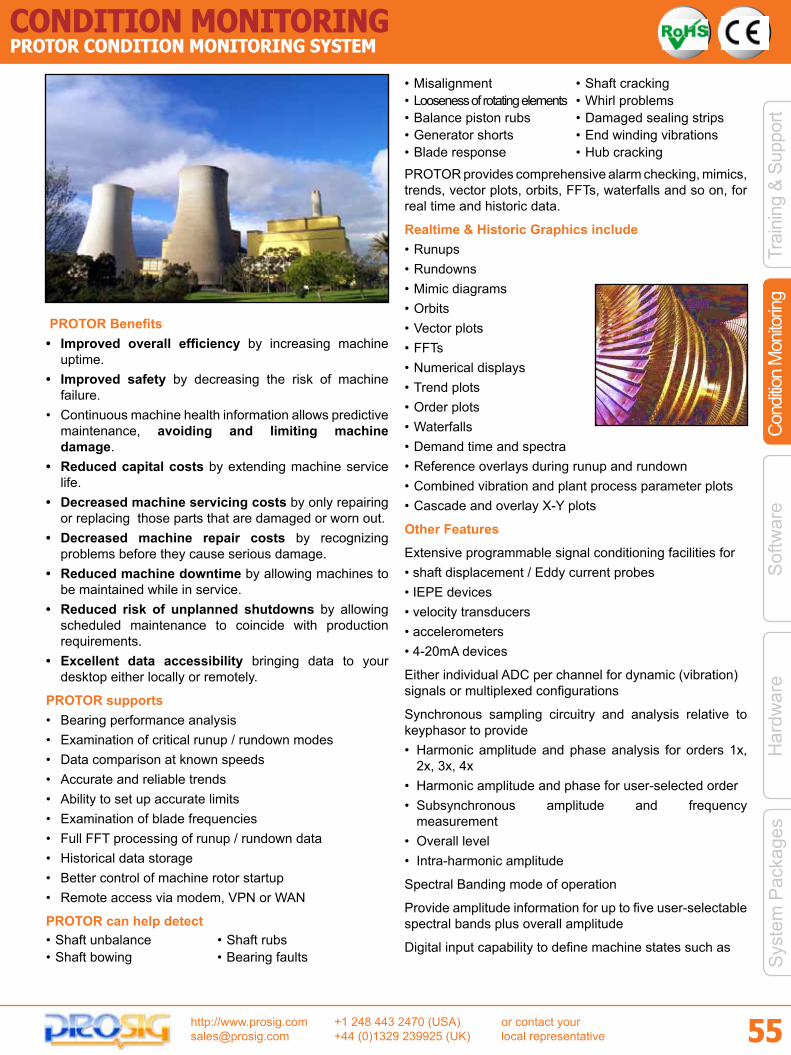
CONDITION MONITORINGPROTOR CONDITION MONITORING SYSTEM
Sys
tem
Pac
kage
sH
ardw
are
Sof
twar
eCo
nditio
n M
onito
ring
Trai
ning
& S
uppo
rt
http://www.prosig.com +1 248 443 2470 (USA) or contact your [email protected] +44 (0)1329 239925 (UK) local representative
55
PROTOR Benefits• Improved overall efficiency by increasing machine
uptime.• Improved safety by decreasing the risk of machine
failure.• Continuous machine health information allows predictive
maintenance, avoiding and limiting machine damage.
• Reduced capital costs by extending machine service life.
• Decreased machine servicing costs by only repairing or replacing those parts that are damaged or worn out.
• Decreased machine repair costs by recognizing problems before they cause serious damage.
• Reduced machine downtime by allowing machines to be maintained while in service.
• Reduced risk of unplanned shutdowns by allowing scheduled maintenance to coincide with production requirements.
• Excellent data accessibility bringing data to your desktop either locally or remotely.
PROTOR supports• Bearing performance analysis• Examination of critical runup / rundown modes• Data comparison at known speeds• Accurate and reliable trends• Ability to set up accurate limits• Examination of blade frequencies• Full FFT processing of runup / rundown data• Historical data storage• Better control of machine rotor startup• Remote access via modem, VPN or WAN
PROTOR can help detect• Shaft unbalance • Shaft rubs• Shaft bowing • Bearing faults
• Misalignment • Shaft cracking• Looseness of rotating elements • Whirl problems• Balance piston rubs • Damaged sealing strips• Generator shorts • End winding vibrations• Blade response • Hub crackingPROTOR provides comprehensive alarm checking, mimics, trends, vector plots, orbits, FFTs, waterfalls and so on, for real time and historic data.
Realtime & Historic Graphics include• Runups• Rundowns• Mimic diagrams• Orbits• Vector plots• FFTs• Numerical displays• Trend plots• Order plots• Waterfalls• Demand time and spectra• Reference overlays during runup and rundown• Combined vibration and plant process parameter plots• Cascade and overlay X-Y plots
Other Features
Extensive programmable signal conditioning facilities for • shaft displacement / Eddy current probes • IEPE devices • velocity transducers • accelerometers • 4-20mA devices
Either individual ADC per channel for dynamic (vibration) signals or multiplexed configurations
Synchronous sampling circuitry and analysis relative to keyphasor to provide • Harmonic amplitude and phase analysis for orders 1x,
2x, 3x, 4x • Harmonic amplitude and phase for user-selected order• Subsynchronous amplitude and frequency
measurement • Overall level • Intra-harmonic amplitude
Spectral Banding mode of operation
Provide amplitude information for up to five user-selectable spectral bands plus overall amplitude
Digital input capability to define machine states such as

http://www.prosig.com +1 248 443 2470 (USA) or contact your [email protected] +44 (0)1329 239925 (UK) local representative
CONDITION MONITORING
56
PROTOR CONDITION MONITORING SYSTEM
Sys
tem
Pac
kage
sH
ardw
are
Sof
twar
eCo
nditio
n M
onito
ring
Trai
ning
& S
uppo
rt
• Running / Stopped • Onload / Offload • Barring / Not Barring
Digital output capability for alarm indicators and watchdog
PROTOR Hardware
The PROTOR P4700 range of hardware has been designed for the monitoring and analysis of vibration and associated parameters within an industrial environment. The P4700 hardware seamlessly integrates with Prosig’s existing PROTOR products for rotating machine vibration monitoring and protection.
The P4700 is designed to be mounted close to the signal source thus reducing expensive cabling costs. Communication to the P4700 is via standard TCP/IP Ethernet. For particularly harsh environments the P4700 may be mounted in an appropriately IP-rated enclosure for protection from excessive dirt and moisture. P4700 uses 24V DC power.
Summary
PROTOR is the most cost effective and efficient way of capturing, analyzing and reporting data from rotating plant. The PROTOR system protects your plant and provides a future-proof solution to health monitoring.
Dimensions Height 178mm (4U) x Width 448mm ( 19inch rack mounting) x Depth 361mm
Power Requirements 24V DC150W or 6A @24V External rail-mount 110/220V AC to 24V DC power supply available as an option.
Input channels Up to 32 channels per chassisMultiple chassis may be configured.
Resolution 16-bitMaximum Sample Rate 20K samples/second per channelInput Frequency Range DC to 10KHzInput Coupling Programmable DC Direct , AC with 1Hz high pass filter.Transducer Excitation Programmable 24V DC power per channel.ICP® Transducer support 4mA supply from 24v sourceInput Voltage Programmable +/- 24V, +/-10V +/- 1V +/- 100mVInput Impedance 800 KOhm. Galvanic isolation available as an option.Maximum Common Mode Voltage
±200V common mode compliance.
Anti-aliasing Filter Programmable 8-pole Butterworth low-pass filter in range 200Hz to 20KHz.
Phase matching Better than 1deg between channels. Phase compensation for filter delays performed.
Tacho Input Range ±24VTacho Frequency Range 0 to 120,000 RPMTacho Conditioning Dedicated conditioning for up to 4 tachometer signals
per unit. Programmable threshold, slope and re-trigger period.
Speed Reading Accuracy Better than +/- 1RPMSynchronous Sampling Programmable synchronous sampling circuitry to
provide 16,32,64,128 or 256 pulses per cycle.Constant Sampling Programmable constant rate sampling clock.Frequency Resolution Selectable FFT sizes of 128, 256, 512 or 1024Amplitude accuracy Accuracy of both AC and DC measurements referenced
to full scale amplitude. Measurements are better than 2% fsd for amplitude and 2% in phase in all conditions apart from very low-speed or high rates of change of speed ( > 50RPM/sec)
Speed Resolution < 10RPM increments for speed change < 50 RPM/sec.AC/DC separation Circuitry allows DC (Gap) component and AC
(Vibration) component to be measured simultaneously for displacement or proximity type transducers.
Time Synchronisation Accepts synchronisation commands from PROTOR Host. Internal, battery-backed date/time storage.
Indicators Front-panel LEDS for Power and Tacho trigger.Signal Inputs D-type sockets on back panel. Rail-mount screw
terminalsPower Fail Recovery The system is capable of re-booting and restarting
normal operation following power failures and without user intervention.
Diagnostic Functions Each data acquisition card within the system contains an onboard signal generator for fault diagnosis. Under software control, each channel on that card may be temporarily switched from reading its normal external input to reading the signal from the internal generator. The signal follows the same signal path as the normal vibration signal. The resultant waveform is analyzed by the system and compared to a table of expected results. Any deviations from expected within a certain tolerance are highlighted and reported to the System log.

http://www.prosig.com +1 248 443 2470 (USA) or contact your [email protected] +44 (0)1329 239925 (UK) local representative
CONDITION MONITORINGPROTOR CONDITION MONITORING SYSTEM
57
Sys
tem
Pac
kage
sH
ardw
are
Sof
twar
eCo
nditio
n M
onito
ring
Trai
ning
& S
uppo
rt
Some screenshots of the PROTOR system in action
PROTOR “Home” Page Mimic Diagram
Vector Plot Waterfall
Trend Plot Shaft Gap

http://www.prosig.com +1 248 443 2470 (USA) or contact your [email protected] +44 (0)1329 239925 (UK) local representative
CONDITION MONITORING
58
PROTOR CONDITION MONITORING SYSTEM
Sys
tem
Pac
kage
sH
ardw
are
Sof
twar
eCo
nditio
n M
onito
ring
Trai
ning
& S
uppo
rt
Some examples of PROTOR in actionPROTOR is used worldwide for the continuous monitoring of rotating machines such as steam turbines, gas turbines and auxiliary pumps and fans. PROTOR’s continuous monitoring of the amplitude and phase of the main harmonics and sophisticated alarm processing means that it can be used to assist in early detection and diagnosis of vibration problems which if left untreated may cause damage and subsequent loss in revenue. The following are some example case studies where PROTOR was used...
This shows that a fall in vibration is not necessarily a good thing.
Pilot Exciter Bearing Failure
Compressor Tie Bolt Failure
Gas Turbine Rotor Disk Crack
The failure was initially detected by a fall in 1st order vibration. Problem was confirmed by corresponding increase in higher harmonics. The PROTOR elliptical boundary alarms detect fall in vibration as well as rise. By early detection the bearing could be replaced without causing further more substantial damage.Having detected and diagnosed a bearing failure the plant was either allowed to run to a convenient outage or quickly changed preventing secondary damage. Only the affected item needed attention.
Disk crack seen as persistent vector change with initially small phase change.After regular return to service underlying vector changed followed by exponential rise in vibration amplitude and change in phase.
Slow rise in vibration with phase changeVibration levels not high enough to trigger level alarms. Early detection by vector gradient alarm meant machine taken out of service before catastrophic failure. Investigation revealed cracked compressor tie bolt
In this case the vibration levels were not high enough to trigger conventional alarms. The fault was detected by vector change.
Decisive, informed action reduced outage time and minimized lost revenue.

http://www.prosig.com +1 248 443 2470 (USA) or contact your [email protected] +44 (0)1329 239925 (UK) local representative
CONDITION MONITORINGPROTOR MOBILE SySTEM
59
Sys
tem
Pac
kage
sH
ardw
are
Sof
twar
eCo
nditio
n M
onito
ring
Trai
ning
& S
uppo
rt
PROTOR Mobile System
PROTOR-Mobile is the ideal investigative tool for condition monitoring of rotating machinery. It provides the same extensive facilities as a standard PROTOR system but as a portable unit, rugged enough to withstand the typical power station environment.
PROTOR-Mobile provides high quality, high-speed data acquisition and analysis. Data acquired synchronous to a once per revolution tachometer signal to provide high accuracy harmonic and sub-harmonic measurements or time-based for slow speed conditions or where a tachometer signal is not available.
A standard signal conditioning module allows inputs to be taken from accelerometers, velocity or displacement probes. The system can provide 24V DC excitation for proximity probes and also supports IEPE transducers. Signal conditioning parameters such as gain, AC/DC coupling and anti-aliasing filter selection are programmable.
PROTOR-Mobile is a standalone unit. Access is provided either by standard monitor, keyboard and mouse ports or by Ethernet or by modem. Typically access will be via a Notebook computer running Windows and using an Ethernet connection. Connection may also be via an existing station network which would then provide local area connection even remote connection should Wide Area or VPN facilities be available. Using either connection PROTOR-Mobile may be configured and set to work, thereafter the system may be left unattended to collect and store data to its internal disk.
PROTOR-Mobile is available in two packages one supports up to 16 transducer inputs with two phase-reference or tachometer signals and the other supports up-to 32 inputs and four phase-reference signals. The inputs may be configured as either vibration signals (dynamics) or plant process parameters (statics). Each of the phase reference signals may be associated with an 8-channel signal group. This provides great flexibility in configuring the system for a number of different applications. In the simplest case the system may be configured to monitor a single machine
using all channels relative to a single tacho. Alternatively it is possible to monitor multiple machines each with their own 8-channel blocks and individual phase-reference signals. The total channels allocated to each machine can be configured as any combination of dynamic and static channels.
PROTOR-Mobile provides the same intuitive Graphical User Interface as used by the standard PROTOR system. This simply allows the user to select the type of display and the channels to be displayed by pop-up and pull-down menus using ‘point and click’ selection and the graphical selection of the data to be displayed.
PROTOR-Mobile allows screen shots to be easily cut and pasted into standard Windows software and data to be easily exported.
LightweightRugged
PortableLocal & remote data access
Turbine & auxiliary monitoringWide range of fault detection
Realtime & historic dataChoice of data visualizations

CONDITION MONITORINGPROTOR fOR SHAfT DISPLACEMENT MEASUREMENTS
Sys
tem
Pac
kage
sH
ardw
are
Sof
twar
eCo
nditio
n M
onito
ring
Trai
ning
& S
uppo
rt
http://www.prosig.com +1 248 443 2470 (USA) or contact your [email protected] +44 (0)1329 239925 (UK) local representative60
PROTOR for Shaft Displacement Measurements
Shaft displacement is an important vibration measurement for rotating machines. Shaft displacement is usually monitored by non-contact shaft displacement probes such as eddy-current probes. These probes produce a voltage proportional to the distance of the shaft surface relative
to the tip of the probe. For maximum benefit, ideally two shaft displacement probes will be fitted to measure the displacement in both the horizontal and vertical directions.
The diagram opposite shows a typical arrangement.
This shows that the vibration signal from shaft displacement probes contains both AC and DC components. The DC component is a measure of the overall distance of the shaft from the probe, this is called the gap. The AC component is measure of the movement of the rotating shaft about its central position. In general the DC component is large (typically -15V) with a much smaller AC component. The PROTOR data acquisition hardware includes dedicated signal conditioning which allows both the AC and DC components to be measured with high accuracy using only a single input channel.
Shaft VibrationThe AC component is usually analyzed with respect to a
‘once per revolution’ tachometer signal to provide measurements which are an indication of the movement of the shaft on a rotational or ‘per cycle’ basis. This
provides information which is used to detect phenomena such as unbalance, misalignment, rotor bends, cracks and so on. For example, assume a rotor, supported by two bearings, has a bend or bow as shown below (greatly exaggerated for display purposes then the displacement time history would be sinusoidal.
The PROTOR system measures the AC signal for displacement probes and performs frequency analysis on the signal with reference to the tachometer signal to identify the Overall displacement on a cyclic basis together with its constituent components such as the 1st, 2nd, 3rd, 4th and higher harmonics (both amplitude and phase), sub-harmonic (amplitude and frequency) and intra-harmonic components. These measured components are collected
and stored on a regular basis and made available for real-time mimic diagrams, trend displays, vector diagrams, alert processing and also for historical analysis.
Transducer OrientationTo be of most benefit a pair of perpendicular shaft displacement probes are often used to allow measurement of the movement in both the vertical and horizontal directions.
NOTE: It is often not physically possible to mount probes in the actual vertical and horizontal planes. The PROTOR system configuration allows the actual transducer mounting position to be defined. It can then mathematically combine the contributions of a pair of probes to estimate the actual displacement in the true vertical and horizontal planes.
Orbit PlotsTwo perpendicular shaft displacement signals may be either directly measured or determined through the orientation software. When two such signals are available then PROTOR is able to display the data in the form of a shaft ‘Orbit’. An Orbit display is effectively a dynamic display of the movement of the centre of the shaft. Within PROTOR it is possible to display the ‘filtered’ orbits, that is the individual contributions from each of the measured orders. Alternatively you can select which orders to include in the orbit display.
Shaft GapsAs mentioned above the signal from a shaft displacement probe also has a DC component which is proportional to the average gap between the probe tip and the shaft surface. The PROTOR system also measures and logs these components and makes them available for trending and display. If bearing clearance information is available then this may be entered and the movement of the shaft shown relative to the clearance.
Figure1:EddyCurrentprobes
Figure2:Rotorsupportedbytwobearings

CONDITION MONITORINGPROTOR SIgNAL CONDITIONINg fOR HIgH COMMON MODE AND ISOLATION
Sys
tem
Pac
kage
sH
ardw
are
Sof
twar
eCo
nditio
n M
onito
ring
Trai
ning
& S
uppo
rt
http://www.prosig.com +1 248 443 2470 (USA) or contact your [email protected] +44 (0)1329 239925 (UK) local representative
61
PROTOR Signal Conditioning for High-Common mode and Isolation For monitoring systems in an industrial environment special care and attention is required for both signal cables and input signal conditioning circuitry. Typical problems in this environment include long cable runs and cable routes in the proximity of high voltage sources can cause noise induction and large ground potential differences to exist. The effect of differing ground potentials between the signal source and the measurement system is of particular interest. For monitoring systems in a clean or laboratory environment then the signal source and measurement system are close together and ground or earth differences are negligible and so can be ignored. The following notes describe some of the concepts and terminology related to these phenomena and describe ways in which these effects can be minimized by careful selection of signal cabling and signal conditioning components.
Single-Ended InputsWith single-ended inputs a single connection is made from the signal source to the data acquisition system. The measurement made is the difference between the signal and the ground or earth. In order for the measurements to be accurate then we must ensure that the signal source is grounded (earthed) and the signal source and the acquisition system’s earth have the same value. In most practical or industrial applications the ground or earths may be significantly different between the transducer source and the measurement system. Single-ended inputs are also sensitive to noise errors, in particular for long cable runs.
Differential InputsOne way to eliminate this problem is to use differential inputs to a differential amplifier. With differential inputs, two connections are made from the signal source to the measurement system. The differential amplifier gives the difference between the two inputs, meaning that any voltage common to both wires is removed. Therefore, providing the difference in earth potential between the source and measurement system is not too large, then it does not affect measurement accuracy.However in a number of cases especially in industrial environments where the signal source may be a long distance from the measurement system or when ‘floating’ inputs are used (which have no ground reference) then the difference in grounds may be significant. In these cases we need to take account of the voltage compliance range of the input amplifier and if necessary use specialist components or circuitry which removes or rejects this voltage difference.
Common-ModeThe common-mode voltage is defined as the voltage that is measured with respect to a common-mode reference point and is present on (or common to) both sides of a differential input signal. Most frequently, the common-mode reference point for a complete system is the system earth or ground. Problems arise if this common-mode voltage exceeds voltage compliance of the signal conditioning input circuitry, typically < 15V. A solution is to use an instrumentation amplifier with a high Common-Mode Rejection Ratio (CMRR). The CMRR is a measure of how well the amplifier rejects the common-mode voltage. An ideal amplifier will have a CMRR of infinity. In practice, high-common mode amplifiers have a CMRR of around 80 to 90 dB. The higher the rejection ratio the better. The other important factor is the common mode range. This is the maximum common-mode voltage with which the amplifier can cope. Typical Common Mode Range values are +/- 200V. There are cases where extreme common-mode voltages may exist which may require further conditioning. In such cases Isolating amplifiers may be required.
IsolationIn some situations, a number of monitoring systems may ‘share’ signal inputs from a transducer, in this case care must be taken to ensure that the system does not affect the signal in anyway. In this case isolation amplifiers should be used such that electrical isolation is provided between the measurement system’s input and its measurement circuitry. Such devices pass the signal from its input to the measurement device (ADC) without a physical connection by using transformer, optical, or capacitive coupling techniques. This ensures that no possibility of electrical current flowing from one measurement system to another.
PROTOR SolutionsAs standard all PROTOR system are provided with high-common mode signal conditioning. For the PROTOR-4 range of hardware the programmable P4751 8-channel module provides the high-common mode characteristics. Galvanic isolation may also be provided as an option. For PROTOR-4 the software programmable P4761 card is available.

http://www.prosig.com +1 248 443 2470 (USA) or contact your [email protected] +44 (0)1329 239925 (UK) local representative
CONDITION MONITORING
62
PROTOR fOR AUxILIARy MACHINE MONITORINg
Sys
tem
Pac
kage
sH
ardw
are
Sof
twar
eCo
nditio
n M
onito
ring
Trai
ning
& S
uppo
rt
PROTOR for auxiliary machine monitoring The use of the PROTOR system for monitoring vibration from large rotating machines fitted with fluid-filled journal bearings such as steam or gas turbines is well understood. Vibration from these components generally falls within the main harmonics or orders of the shaft rotational speed such as 1st, 2nd 3rd or 4th harmonic. Some energy may also exist below the 1st order, called the sub-synchronous component. Most energy exists below 1KHz and so standard displacement probes or velocity transducers are generally fitted. The PROTOR system collects this data in amplitude and phase form, relative to a ‘once-per-revolution’ phase reference signal, as standard and allows data to be displayed in real-time as mimic diagrams, trend plots, orbit and vector displays.
Less well known is the PROTOR system’s ability to effectively monitor auxiliary items of plant such as pumps or fans. This includes rotating machines with gearboxes, rolling-element bearings, impellers and dual shaft machines. For these types of machine the vibration spectra may contain information over a wide range of frequencies that may be related to gear-mesh frequencies for gearboxes or inner or outer race frequencies for rolling element bearings. The following features are provided as standard within PROTOR and the PROTOR hardware for auxiliary plant item monitoring is exactly the same as that used for main turbines and so standard spares cover all items.
High frequency analysisOne major difference when monitoring vibration information for some auxiliary items compared with standard steam or gas turbines is the ability to monitor high-frequency content. As mentioned above, for turbines most vibration information is within the 0 to 1KHz frequency band. For high-speed auxiliary machines with gearboxes or rolling-element bearings then some frequency components may be much higher, possibly up to 10KHz. For these machines accelerometers will generally be fitted. The PROTOR P4700 system supports accelerometers as standard and will also provide a constant-current source for IEPE transducers under software control. The P4700 system contains a programmable low-pass filter and allows sampling in excess of 20K samples per second per channel.
Multi-machine configurationOne main advantage of the PROTOR system for this type of analysis is the flexibility of the system hardware and configuration. A number of auxiliary plant equipment such as boiler feed pumps or FD and ID fans contain components running at different speeds such as a motor and a pump or a motor and a fan. A PROTOR P4700 data acquisition unit can take in up to four separate ‘once per revolution’ speed or phase reference signals and each 8-channel data acquisition card may be associated with any one of these speed signals.
In this example we have a LP and HP turbine each with their own
phase reference signal. Signals from the LP and HP units are analyzed relative to their own phase reference. Signals from the gearbox are ‘shared’ and analyzed twice, once relative to the LP tacho and then relative to the HP tacho.
Spectral band analysis harmonic configurationAnother feature of the PROTOR system is the ability to configure the system to analyze and collect specific harmonics. For example, for a Gas Circulator within a nuclear power station one primary frequency component is related to the number of impeller blades, in this case 31. For this case PROTOR was configured to measure the 31st harmonic as standard. This component is then available alongside the other standard harmonics for display, trending and alarm checking.
Spectral band analysisAnother feature of PROTOR is the ability to configure spectral bands. These frequency bands may be set by user for a particular machine and can be set dependent on the machine configuration around particular frequencies of interest such as gear-mesh frequencies or blade-passing frequencies. This method is used when the frequency content is well known and understood. Alternatively when the frequency content is not well known, the bands may be set for general zones of interest, say a low-frequency zone (below running speed) , a running speed zone, a general vibration zone (encompassing 2nd, 3rd and 4th harmonics) and a high-frequency zone.
Gearbox ratiosPROTOR also handles situations where only a single speed or phase reference signal is available. For example, with some gearboxes a single tachometer signal positioned on one side of the box is often the only speed reference available. In this case
it is possible to define the gearbox ratio and to specify the channels associated with either side of the gearbox. For channels where the speed signal is available then normal harmonic analysis is
performed. For channels on the other side of the gearbox then the speed measured by the available tachometer signal is factored by the gearbox ratio, the resultant speed is then used to determine the expected harmonic locations on this channels.

SUPPORT & TRAINING
64 support & maintenance
65 training

http://www.prosig.com +1 248 443 2470 (USA) or contact your [email protected] +44 (0)1329 239925 (UK) local representative
SUPPORT & TRAINING
64
SUPPORT & MAINTENANCE
Sys
tem
Pac
kage
sH
ardw
are
Sof
twar
eCo
nditio
n M
onito
ring
Trai
ning
& S
uppo
rt
Prosig’s support services are unrivalled and offer outstanding value. All systems come with an initial period of support. This can be extended annually.
Prosig provide a world-wide maintenance service for hardware under warranty or support contract. Cover includes parts, labor and return shipping costs. Repair can be ‘on site’ or ‘return to factory’ depending on the equipment and the speed of response required. Where speed of response is critical, spares may be pre-positioned with local distributors. A fully traceable calibration service is also available.
DATS software support entitles the user to unlimited e-mail and telephone support. This covers every aspect of the software from installation to help in understanding the analysis functions.
Support & Maintenance
Support, calibration & maintenance
06-44-683 Calibration for P5000 unit. Return to factory calibration service for P5000 series data acquisition system. Including calibration certificate traceable to NAMAS standards.
06-33-951 Calibration for P8000 unit. Return to factory calibration service for P8000 series data acquisition system. Including calibration certificate traceable to NAMAS standards.
06-88-714 Hardware support for P5000 unit. Return to factory repair and replacement, any faults or damage to P5000 unit is covered.
06-33-952 Hardware support for P8000 unit. Return to factory repair and replacement, any faults or damage to P8000 unit is covered.
07-55-669 Software support for DATS analysis software. Software support and update service for DATS signal processing software, including all optional DATS add- on packages. Software support also provides access to Prosig’s team of support engineers.
07-22-877 Software support for PROTOR analysis software.
Software support and update service for PROTOR software, including all optional PROTOR add-on packages. Software support also provides access to Prosig’s team of support engineers.
06-22-875 Hardware support for PROTOR unit, return to factory level.
Return to factory repair and replacement, any faults or damage to PROTOR unit is covered.
06-22-876 Hardware support for PROTOR unit, on site level.
On site repair and replacement, any faults or damage to PROTOR unit is covered. All repairs and replacements are carried out at the customers site.
Thank you again for you help and quick responses to my issues.
Thanks for that. As usual you guys are responsive and on the ball! It’s always a pleasure dealing with you.
Thanks to you for consistently providing professional and technical support in our work with Prosig.
Your service is great! Thanks for getting right to this request.
What Our Customers Say...

http://www.prosig.com +1 248 443 2470 (USA) or contact your [email protected] +44 (0)1329 239925 (UK) local representative
SUPPORT & TRAININGTRAINING
65
Sys
tem
Pac
kage
sH
ardw
are
Sof
twar
eCo
nditio
n M
onito
ring
Trai
ning
& S
uppo
rt
Prosig offer training in all aspects of test, measurement and analysis. Starting with basic and advanced signal processing courses and going all the way through to the advanced uses of the Prosig analysis software. Prosig’s signal processing lecturers have decades of real world experience and are, of course, expert in the use of Prosig data acquisition systems, DATS analysis software and PROTOR systems.
Training
DATS & P8000 Training Courses
08-55-939 Introduction to DATS & P8000 Half day08-55-673 DATS Worksheets & Analysis One day08-55-940 DATS Automation & Scripting One day08-55-680 DATS Refresher Course Half day08-55-674 Making Automated Reports with DATS & Intaglio Half day08-55-681 Using DATS Structural Animation Half day08-55-941 Using DATS Modal Analysis Half day08-55-675 Using DATS Fatigue Analysis Half day08-55-942 Using DATS Noise, Vibration and Harshness Analysis Half day08-55-943 Using DATS Rotating Machinery Analysis Half day08-55-677 Using DATS Multi-Plane Balance Half day08-55-678 Using DATS Source Path Analysis (covering Source Contribution Analysis and
Transfer Path Analysis)Half day
08-55-679 Using DATS Hammer Impact Software Half day08-55-676 Using DATS Data Acquisition Software Half day
Signal Processing Training Courses
08-55-672 Basic Mathematics and Signal Processing for DATS Two days08-55-944 Advanced Mathematics and Signal Processing for DATS Two days
Application Training Courses
08-55-945 How to capture data with Prosig equipment Half day08-55-946 How to process your captured data with DATS One day08-55-947 How to use DATS to produce high quality automated reports from your captured
dataHalf day
08-55-949 How to visually animate your captured data Half day08-55-950 How to process your results from a shaker or impact hammer Half day
PROTOR Training Courses
08-22-878 PROTOR Operator course. Covers basic structure, operation and use alarms and alarm Logs, archive / restore, printing / plotting.
One day
08-22-879 PROTOR Advanced course. Covers system design, historic data, configuration, vector runout, transducer orientation.
One day
08-22-880 PROTOR Front Line Maintenance course. Covers basic fault finding & diagnostics. One day08-22-881 PROTOR System Management course. Covers system concepts and architecture,
maintenance of system software, interaction with UNIX, passwords, extra users, theory, practical.
One day
08-22-882 PROTOR Vibration Analysis and Interpretation course. Covers basic principles, theory, examples.
One day
Courses are usually held at Prosig offices, but can be held at customer premises by prior arrangement. Refreshments (tea / coffee) are provided during all courses held at Prosig offices. During full-day courses lunch is provided.

http://www.prosig.com +1 248 443 2470 (USA) or contact your [email protected] +44 (0)1329 239925 (UK) local representative
HARDWARE REQUIREMENTS
66
HOST COMPUTER CONFIGURATION
Host Computer ConfigurationIn order to make full use of the facilities available, the DATS software has the following recommended system requirements.
P8000 & DATS™ Software
To run the DATS software, Prosig recommend the following specification of PC hardware.
• 2 GHz multicore processor (or faster)• Windows Vista®
• 2 GB memory• DVD drive• PCI-E graphics adapter (256 MB or more)• USB 2.0 port• 1 GB of hard drive space *• Latest Windows Vista® Service Pack
* This is for kit installation. Working space will be dependent on size of data files generated.
The DATS software is supplied on a CDROM. Customers with a valid software support contract can download updates from prosig.com.
To use all of the facilities of the DATS licensing scheme users will need a connection to the Internet.
Other Windows® operating systems are also supported. Please contact us if you require more information.
DATS Intaglio
To make full use of the facilities provided by the DATS Intaglio Report Generator Prosig recommend that Microsoft® Word 2007 (Microsoft® Office 2007) is used.
Other versions of Microsoft® Office are also supported. Please contact us if you require more information.
DATS Audio Replay
Recommended: Creative Soundblaster Audigy 2 USB soundcard, Creative 2.1 speakers and Sennheiser headphones (available as Professional Quality Audio Hardware (04-55-782) from Prosig).
67

67
When you buy a Prosig system you are buying more than just hardware and software. You are gaining a share of decades of knowledge and experience in instrumentation, engineering, signal processing, data capture systems and software engineering. We will advise and support you and help you gain the maximum benefit from your investment. Think of Prosig as part of your engineering team.
Chris MasonTechnical Director (DATS Products), Prosig
“
The RoHS Directive bans the placing on the EU market of new electrical and electronic equipment containing more than agreed levels of lead, cadmium, mercury, hexavalent chromium, polybrominated biphenyl (PBB) and polybrominated diphenyl ether (PBDE) flame retardants. From June 2008 all PROSIG P8000 and PROTOR Series boards are RoHS Compliant.
The CE Mark indicates that the product it is affixed to conforms to all relevant essential requirements and other applicable provisions that have been imposed upon it by means of European directives, and that the product has been subject to the appropriate conformity assessment procedure(s). The essential requirements refer, among other things, to safety, public health and consumer protection. Both P8000 series and PROTOR are EMC tested.
The EU Waste Electrical and Electronic Equipment (WEEE) Directive is one of a series of ‘producer responsibility’ Directives that makes EU producers of new equipment pay for the recycling and/or safe treatment and disposal of the products they put on the market when they eventually come to be thrown away. PROSIG is part of a compliancy scheme and should the end-user return a system to us at its end of life we will ensure that it is correctly disposed of.
Some symbols used in this catalog
24 bit
Uses a 24-bit A/D for high precision, high accuracy measurement.
Charge input
Provides direct connection to charge type transducers.
USB 2.0
Connects to the host computer using USB 2.0.
ACDCor
DC or AC inputs supported.
CAN bus
Supports CAN-bus data capture. TEDS
Provides supports for transducer electronic datasheet (TEDS) accelerometers.
IEPESupports IEPE† type transducers. oC
oF
Thermocouple inputs.
Tacho input
Provides a dedicated tacho input for accurate measurement of pulse trains. Typically used to measure rotational speed.
DACDigital to analogue capability for data replay.
BridgeProvides selectable supply voltage and bridge configuration for ¼, ½ and full bridge.
GPSCaptures and records GPS data including position, velocity and accurate wall clock time.
† IEPE (Integral Electronic PiezoElectric) type transducers are often known by trade names such as Piezotron®, Isotron®, DeltaTron®, LIVM™, ICP®, CCLD, ACOtron™ and others.
ABB Power GenerationAlstomArvin MeritorAugustaWestlandBAE SystemsBNFL MagnoxCastellon UniversityCIS AmreinCranfield UniversityDaimlerEMATEuropean Transonic Windtunnel (ETW)First InertiaFord UKFord OtosanGECIABGINSEANInternational PowerIstanbul Technical UniversityISVRJaguarKAB SeatingKillingholme PowerKlippanLand RoverMCT / MELMIRANewcastle UniversityNottingham UniversityPerkinsPowergenQinetiQRolls RoyceRWE InnogySAICScottish PowerSeabank PowerSiemens Energy & AutomationTRL (Transport Research Laboratory)TRWTUVTXU-EuropeUniversity of CoventryUniversity of CracowUniversity of RomeUniversity of ValenciaVattenfallVibrotecVisteonVolkswagenVolvoWestland Helicoptors
UK & EUROPE
ADEAdvanced System Laboratory (ASL)Central Power Research Institute (CPRI)GE BELGTREIndian Institute of Science (IISc)KLN EngineeringNALRane TRWSouthern SystemsTVS MotorcyclesVikhram Sarabhai Space Center (VSSC)
INDIA
Australian National PowerFord AustraliaHazelwood Power
AUSTRALIA
Chery MotorsDow ChinaFAWHyundai (HMC)Jaingling MotorsKiaMazdaSAIC
JAPAN, CHINA & SE ASIA
AK SteelAmerican National PowerAMTEC CorpATK USAAxiconChryslerDefianceDow AutomotiveDow ChemicalDynamic Technology IncEagle PicherEaton CorpFord ArgentinaFord BrazilFord CanadaFord MexicoFord Motor Company (USA)GetragGEGeneral MotorsHoneywellJohn CraneLawrence Tech UniversityLeybold SystemsLivernois Vehicle DevelopmentLockheed-MartinMarvin EngineeringMazdaMGA ResearchMichelinMotor CoachNASANational Technical SystemsNAWCNWS (Earle)Oakland UniversityRicardo Vehicle SystemsRoushTelcordiaTexas A & M UniversityTrentecTokicoTRWTTX CompanyUnited Defense LPUS Army (Redstone Arsenal)US Steel ResearchVeridianVerizonWestinghouseWoco USAYazaki NA
NORTH & SOUTH AMERICA
Some major organizations that use Prosig products

Working At The Heart Of Test & Measurement
Prosig OfficesProsig (USA), Inc.Sales & Engineering Support OfficeSuite 100A29200 Southfield Road, SouthfieldMI, 48076USATel: +1 248 443 2470Fax: +1 248 443 2706Email: [email protected]
Prosig Ltd.Link HouseHigh St.Fareham, HampshirePO16 7BQUKTel: +44 (0)1329 239925Fax: +44 (0)1329 239159Email: [email protected]
Your Local Representative
Whilst every effort has been made to check and validate the accuracy of all informa-tion within this catalog, Prosig reserves the right to change or withdraw any product without prior notice. The information contained in this catalog may change and shall not form part of any contract.
No part of this catalog may be reproduced or used in any medium without the prior permission of Prosig Ltd.
Isotron is a registered trademark of Endevco Corporation. DeltaTron is a registered trademark of Brüel & Kjær Sound & Vibration Measurement A/S. Piezotron is a registered trademark of Kistler Instrumente AG. LIVM is a trademark of Dytran Instruments, Inc. ACOtron is a trademark of ACO Pacific, Inc. ICP is a registered trademark of PCB Group, Inc. Modally Tuned is a registered trademark of PCB Group, Inc. LEMO is a registered trademark of LEMO SA. SENNHEISER is a trademark of Sennheiser Electronic Corp. The Creative Logo, Sound Blaster, Audigy & Creative Inspire are trademarks or registered trademarks of Creative Technology Ltd. or Cambridge SoundWorks, Inc. in the United States and/or other countries. Samsonite is a registered trademark of the Samsonite Corporation. NASTRAN is a registered trademark of the National Aeronautics and Space Administration (NASA). Microsoft, Windows, Windows XP and Windows Vista are either registered trademarks or trademarks of Microsoft Corporation in the United States and/or other countries. All other company and product names in this catalog are trademarks of their respective owners.
Copyright © 2009 Prosig Ltd. All rights reserved.