proposed set of mental health indicators; definitions
TRANSCRIPT

Proposed set of mental health indicators; definitions, description and sources
EUROPEAN COMMISSION

The project received financial support from the European Commission. Neither the European Commission nor any person acting on its behalf is liable for any use made of the following information.
2
Annex I ....................................................................................................................................................................................................1
Proposed set of mental health indicators; definitions, description and sources .............................................................1 List of abbreviations................................................................................................................................................................. 3
1. Preamble.............................................................................................................................................................................................4 2. The concept of mental health.........................................................................................................................................................4
Indicator, types and their definitions..................................................................................................................................... 6 3. The mental health indicators by domains....................................................................................................................................6
3.1. Demographic and socio-economic factors .........................................................................................................................7 3.2. Health status ..............................................................................................................................................................................8
3.2.2. Morbidity, disease specific (ECHI: 2.2.) ....................................................................................................................... 9 3.2.3. Morbidity, generic (ECHI 2.3.) ..................................................................................................................................... 11
3.3. Determinants of health.........................................................................................................................................................12 3.3.1.1. Personal conditions (ECHI 3.1.2.)............................................................................................................................. 12 3.3.2. Health behaviours (ECHI: 3.2.) ..................................................................................................................................... 13 3.3.3. Living and working conditions (ECHI: 3.3.) .............................................................................................................. 13
3.3.3.1. Social and cultural environment (ECHI 3.3.3.)................................................................................................... 14 3.4. Health systems ........................................................................................................................................................................15
3.4.1. Prevention, health protection and health promotion (ECHI: 4.1.)........................................................................... 15 3.4.2. Health care resources (ECHI: 4.2.) ............................................................................................................................... 16 3.4.3. Health care utilisation (ECHI: 4.3.) .............................................................................................................................. 17 3.4.4. Social services and welfare ............................................................................................................................................ 19 3.4.5. Expenditure (ECHI: 4.4.)................................................................................................................................................ 20 3.4.6. Health care quality indicators (ECHI: 4.5.) ................................................................................................................. 20
LIST 2. ...................................................................................................................................................................................................22 1. Demography and Socio-economic situation...................................................................................................................22
1. Demographic and socio-economic factors ......................................................................................................................... 22 1.1. Population......................................................................................................................................................................... 22 1.2. Socio-economic factors.................................................................................................................................................. 22
2. Health Status ..........................................................................................................................................................................23 2.1.3. Cause-specific mortality............................................................................................................................................. 23 2.2.1 Diseases/disorders of large impact: ........................................................................................................................... 23 2.2.2 Selected diseases: incidence or prevalence .............................................................................................................. 23 2.3 Generic health status................................................................................................................................................. 23 2.4 Composite measures of health status ..................................................................................................................... 24
3. Determinants of health ........................................................................................................................................................24 3.2.1. Substance use............................................................................................................................................................... 24
3.3. Living and Working conditions................................................................................................................................... 24 3.3.1 Physical environment.................................................................................................................................................. 24 3.3.2. Working conditions..................................................................................................................................................... 24 3.3.3. Social & cultural environment................................................................................................................................... 24
4. Health systems ............................................................................................................................................................................25 4.1. Prevention, health protection, health promotion .................................................................................................. 25 4.2. Health care resources...................................................................................................................................................... 25 4.3. Health care utilisation..................................................................................................................................................... 25 4.4. Health expenditures and financing............................................................................................................................... 25 4.5. Health care quality indicators ....................................................................................................................................... 26
3
List of abbreviations
ATC = Anatomical Therapeutic Chemical CAGE = 4 items scale to measure dependence on alcohol CIDI = Composite International Diagnostic Interview CIDI-SF = Composite International Diagnostic Interview – Short form COD = Cause of death DALY = Disability adjusted life years DDD = Defined daily doses ECHI = European Community Health Indicator (project) ECHP = European Community Household Panel EMCDDA = European Monitoring Centre for Drugs and Drug Addiction EU = European Union EU-DGV = refers to the organisation currently named as: Directorate General Health and Consumer Protection GAD = Generalised anxiety disorder GHQ = General Health Questionnaire (Measure of psychological distress) HIEMS = Health Indicators Exchange and Monitoring System HIS = Health Interview Survey HMP = Health Monitoring Programme ICD = International Classification of Diseases LTE = List of threatening events LOT-R = Life orientation test - revised MHI-5 = Mental health five item survey scale in the SF-36 ODIN = Outcome of Depression International Network OECD = Organisation for Economic Co-operation and Development PYLL = Potential years of life lost SD = Standard deviation SE = Standard error SES = Socio-economic status SF-36 = Short-form 36 (36 item survey generic health measure) WHO = World Health Organisation
4
1. Preamble A two-year action project to establish the mental health indicators in Europe, coordinated by Stakes, started in the beginning of 1999 under the EC Health Monitoring Programme. The present list is a proposal of a set of mental health indicators to be used in Europe. The project aimed to collect information on existing information systems and indicators and to agree on harmonised definitions of the mental health indicators. These mental health indicators are to be incorporated into a comprehensive European health monitoring system. The European Community Health Indicator project (ECHI) has devised the structure of the future Health Indicators Exchange and Monitoring System (HIEMS). The set of mental health indicators: *Covers different relevant aspects of mental health; *Offers possibilities to follow various activities in the field of mental health; *Relies as much as possible on information already available *Provides measures of variability between the Member States *Has been found reliable and valid for most parts; *Includes both “robust” and “strong” indicators; *Has been grouped according to the future HIEMS system. A comprehensive application of the proposed set of mental health indicators enables the satisfactory follow-up of the mental health situation of the populations within the EU. The activities of the HMP are conducted under three headings, or pillars: Pillar A: Establishment of Community Health Indicators (indicator projects) Pillar B: Development of a Community-wide network for sharing health data (HIEMS) Pillar C: Analyses and reporting (health reports) The analyses of mental health indicators and established trends will provide the content for future European mental health reports. 2. The concept of mental health Mental ill-health is a major public health concern in Europe for two reasons. Epidemiological studies conducted have shown that up to one fifth or one quarter of the general population suffer from some sort of mental disorder at a given time. Secondly, up to half of the population may be at risk of having a mental disorder at some point during their lifetime. Disability due to psychiatric disorder has received increasing attention since the Global Burden of Disease report launched jointly by the World Bank and WHO. A quarter of all morbidity was attributed to psychiatric illnesses and major depression as cause of disability was ranked fifth. The project has conceived the concept of mental health in the following manner. Mental health has two dimensions: Positive mental health is a value in itself. Individuals with positive mental health usually demonstrate positive affect and positive personality traits, which are considered as resources. They have e.g. high levels of self-esteem, sense of mastery, sense of coherence (life experienced as meaningful and manageable) and self-efficacy. It can also

5
be conceptualised as the ability to cope with adversity, and avoid breakdown or diverse health problems when confronted with adverse experiences. Negative mental health is concerned with mental disorders, symptoms and problems. Mental disorders are defined in the current diagnostic classifications by the existence of specific clusters of symptoms. Mental symptoms and problems also exist without the criteria for clinical disorders being met. These subclinical conditions as well as general psychological distress are often a consequence of persistent or temporary adversities. They can be a marked burden and often lead to consultations in e.g. primary health care. Mental health, as an indivisible part of general health, reflects the equilibrium between the individual and the environment. It is influenced by: 1) individual psychological and biological factors; 2) social interactions; 3) societal structures and resources; and 4) cultural values. In this context, mental health is a central part of a process that comprises predisposing, actual precipitating and supporting factors as well as various consequences and outcomes (Figure 1.) Psychological distress is a non-specific syndrome that covers constructs like anxiety, depression, cognitive problems, irritability, anger, obsession-compulsion etc. Depression and anxiety are usually recognised as core distress syndromes that have psychological and somatic components.
Figure 1. The functional model of mental health (from Lahtinen et al 1999)1
SOCIETY & CULTURE
PRECIPITATINGFACTORS
e.g. life events
MENTAL HEALTH
Individual resources
PRESENT SOCIALCONTEXT
e.g. social support
CONSEQUENCESPREDISPOSINGFACTORS
• genetic factors• factors related to pregnancy and birth• early childhood experiences• family environment• social circumstances• physical environment• education• employment• work conditions• housing
• level of wellbeing• physical health• symptoms• knowledge & skills• quality of relationships• sexual satisfaction• use of services• productivity• public safety
SOCIETY & CULTURE
1 Lahtinen, E, Lehtinen, V, Riikonen, E, Ahonen, J. Framework for Promoting Mental Health in Europe. Helsinki: Stakes, 1999
6
Indicator, types and their definitions
Health indicator indicates aspects of the state of health in the community. Proper guidelines are necessary to interpret the trends established. A health indicator could be conceptualised as a bridge between health policy and science, e.g. epidemiology. Furthermore, one needs a conceptual model of health and mental health to facilitate an interpretation of a trend established by an individual or a group of indicators. Health-care indicator reflects aspects of the state of health care in a community. Mental health indicator is a measure on the state of mental health; it is a variable that is related to mental health and indicates a priority or a problem. These may be items in health surveys, statistical data gathered, and are repeated measures. Indicators are even at their best indirect or partial measures of a complex situation. Definitions of the indicators as clear and unambiguous as possible have been aimed at. The aim of the project has been to create a set of indicators to monitor mental health. Monitoring mental health is defined here as systematic, repeated measures of matters related to the mental health of the population. In addition to collecting data, monitoring health implies the follow-up of the measures with the purpose to interpret the evolution of mental health situation according to the established policies and strategies, and to take relevant actions if necessary. The state of mental health, including various levels of ill-health, health and well-being, is the most important domain to be covered by the set of indicators. Furthermore, the aspects of mental health central to its definition are in need of indicators: 1) predisposing factors, 2) precipitating factors, 3) social interaction, 4) individual resources and 5) individual experiences. (These factors are also definable as determinants). Also health-care indicators have been considered valuable. The problem is that indicators for the state of mental health are not in common use in the Member States. The indicators suggested here need further development although the proposed instruments are known to be valid and reliable. The data acquisition necessitates information based on surveys. One requirement has been that the instruments proposed are short and can therefore be easily added to European or national surveys. An appendix is provided listing the relevant survey scales and their items. This paper does not provide the literature references cited as the review, “Measuring Aspects of Mental Health”, including the references is published separately. 3. The mental health indicators by domains The individual mental health indicators proposed are listed in the following according to the division drafted by the ECHI project. The proposed list of mental health indicators comprises 36 individual indicators, some of which are multi-item measures. In the beginning of the presentation of each domain a comment2 by the ECHI project has been added to present a general outline of the domain and its importance.
Table 1. Indicator domains in the future HIEMS and their sub-domains in list 1.
Main categories of health indicators proposed for ECHI 1. Demographic and socio-economic factors 2 Cited from the draft report dated 2.10. 2000

7
2. Health status Cause-specific mortality Morbidity, disease specific Morbidity, generic
3. Determinants of health Personal conditions Social and cultural environment
4. Health systems Prevention, health protection and health promotion Health care resources Health care utilisation
Social services and welfare Expenditure Health care quality indicators
The type of data is mentioned for each individual indicator. A definition and description of the indicator are provided. Each group is commented separately regarding the availability, comparability and source of the data for the indicators. Focus is on mental ill-health and its determinants that have significance for the public health perspective. The project to establish mental health indicators has drafted the current list (list 1.) as a specific list pertaining to mental health, however, another list (list 2.) of relevant other factors for monitoring mental health is included. List 2. includes indicators that have been drafted by the ECHI project and other projects. The survey methods proposed are not available in the Member States with the exception of data on social networks (ECHP based data). Term “inhabitants” refers to whole population, if not otherwise mentioned Population refers to mean population, if not otherwise mentioned In a year = during the last 12 months Name of indicator is in bold italics. The numbers in brackets in the subheadings refer to the number given by the ECHI project (ECHI: 00), the bolded number in brackets after the name of an individual indicator refers to its rank number. 3.1. Demographic and socio-economic factors Comment by ECHI: “These indicators provide a general picture of the situation in a country or region, and a frame of reference for many of the other health indicators. Moreover, the population data provide e.g. the denominator for calculating many other indicators.” However, the set of mental health indicators does not include indicators of the first domain, because they are to be developed and listed by the ECHI project (see list 2. for indicators relevant for mental health in this group).

8
3.2. Health status Comment by ECHI: “This section contains indicators on various aspects of the actual health situation of the population. Indicators may have been selected because of their direct interest of monitoring (e.g. their share of the total burden of ill-health) or, alternatively, because of their reference to known risk factors or to identified activities in prevention and health care (e.g. avoidable mortality).” Many studies have shown that mortality is increased both due to natural and unnatural causes among those suffering from mental ill-health, both among those with psychological distress and psychiatric patients compared to the general population. Additionally, e.g. major depression has been found to increase incidence of and mortality due to coronary heart disease. Adverse life events, e.g. loss of spouse, have been linked to increased mortality. Out of those who commit suicide ca. 90 % have been found in psychological autopsy studies to suffer from a mental disorder. The negative impact of mental ill-health on survival has even been noted in some community samples. The mortality ratio of discharged patients has been found increased compared to the general population. Patients suffering from chronic mental disorders have been found to have relatively high rates of physical illnesses. The term positive mental health refers to the emotional, affective aspects of well-being (affect balance, happiness, certain aspect of life satisfaction) and cognitive aspects (e.g. coping, optimism, certain features of life satisfaction). Affective aspects such as of well-being and satisfaction to life, “mental health wellness” have been shown to predict future health and mental health. “Energy, vitality” from the SF-36 is included here as a measure on affective aspects of positive mental health. Non-specific psychological distress as a dimension of psychopathology can be straightforwardly and cost-effectively measured in the general population. Elevated scores on these scales indicate that something is wrong, but they were not developed to yield specific diagnoses. Furthermore, psychological distress seems to express more accurately the urgency with which treatment was needed, while diagnoses gave information about help eventually needed. As disease specific morbidity is best covered by the use of epidemiological tools, the indicators can only monitor a limited number of disorders in a cost-effective manner. Therefore, the project has narrowed down the number of disorders that will be indicated. The disorders monitored have to be important in terms of public health. A measure to be included should additionally, be very short. This limited further the number of disorders as there are a limited number of short instruments and they usually deal with depression. Psychopathology has a significant link to various forms of disability. Early onset disorders often lead to truncated education. Mental disorders are significantly related to work loss. Patterns of disability vary according to the mental disorders. Recovery from functional limitations may be slower than from symptoms of disorder. Also non-specific levels of mental ill-health and low levels of some aspects of positive mental health have been related to work loss. Mental disorders are among the most important contributors to the global burden of disease and disability. Neuropsychiatric disorders measured by DALYs represent 11,5 % of the global burden of disease. In 1990, five of the leading ten

9
causes of disability were mental disorders (unipolar depression, alcohol dependence, bipolar disorder, schizophrenia and obsessive-compulsive disorder). 3.2.1. Cause-specific mortality (ECHI: 2.1.3.) Suicide (1) Cause of death (COD) in ICD-10 group “Suicide and intentional self-harm”: X60-X84 Number of suicides/100 000 inhabitants in a year (mean population) Source: The European shortlist of 65 causes of death (Eurostat) Mortality due to harmful events, intention unclear (2) COD in ICD-10 group “Harmful events, intention unclear”: Y10-Y34 Number of deaths/100 000 inhabitants in a year (mean population) Source: The European shortlist of 65 causes of death (Eurostat) Drug related deaths (3) COD in ICD-10 groups: X40-X49; Y10-Y19; T36-T50 and F10.0-F19.0 (ICD-9: E850-E858; E980.0-E980.5; 965; 304) Number of deaths/100 000 inhabitants in a year Source: EMCDDA (The Lisbon centre; indicator under development/Eurostat/OECD) PYLL fraction of suicide (4) PYLL cause-specific as fraction of total PYLL: “potential years of life lost”: due to suicide Source: causes of death (COD) –list (Eurostat) All mortality data are based on routine statistics. The data mentioned here are already available. Not all the suicides committed are, however, listed as suicides; in some cases, the cause of death may be listed as e.g. “unknown”. There may be differences depending on culture in the reliability of figures related to suicide between countries. Gender, age group, region and SES should specify the mortality indicators. These should be consistent with groupings made in the demographic indicators. Most indicators can be calculated from standard cause-specific mortality databases. A notable exception is the indicator for mortality differences between SES groups. This requires the link with data on occupation and/or educational level (see list by ECHI-project). Causes of death (COD) are statistical causes not necessarily those mentioned in death certificates. The General Mortality Registers still apply in some European countries the ICD-9 classification although the ICD-10 is increasingly in use. 3.2.2. Morbidity, disease specific (ECHI: 2.2.) Anxiety (GAD) (5) CIDI-SF version on GAD: 2 + ca. 10 items Number of persons with positive answers for anxiety/100 000 in a year Depressive disorders (6) Kessler’s short scale for depression: 13-items (from CIDI-SF) Number of persons exceeding cutpoint for depression/100 000 inhabitants in a year

10
Alcohol dependency (7) Estimate of alcohol dependency as inquired in the CAGE-method: 4 items Cases exceeding the cut-point/100 000 inhabitants in a year C = cut down your drinking (efforts to control drinking) A = annoyed (have the people close to you been annoyed by your drinking)) G = guilty (feelings of guilt due to drinking) E = eye-opener (drinks to control withdrawal symptoms) Suicide attempts (8) Survey item from CIDI: ‘You attempted suicide’ (during the last 12 months) Number of persons with positive answer/100 000 inhabitants in a year If positive answer: “Was this the first time you attempted suicide?” All items in this group depend on survey data (Scales/questions to be added to international surveys; HIS type; need for development) Depression as disorder, alcohol dependency as measured by CAGE, anxiety as state and suicide attempts have been chosen as disease specific morbidity to be indicated due to the fact that these phenomena represent a considerable share of the burden of mental ill health in the population. CIDI-SF (on major depressive episode and generalised anxiety disorder, GAD; may also be self-administered) would indicate a likelihood of 95 % for a diagnosis of depressive disorder and 100 % sensitivity for GAD. Cut-points are used to estimate those with a likelihood of a diagnosis. Depression is the most frequent disorder, which would justify having main focus on depression as a disease specific indicator. Other reasons for choosing major depression: depression constitutes a major public health issue; it is influenced by social changes; changes between nations can be cost-effectively monitored; according to burden of diseases report depression will increase in prevalence and disabilities due to it will be more frequent. Anxiety should also be more closely monitored. For the time being the measure on anxiety will be the screening question from the CIDI on GAD. Possibly this will be replaced and another measure will be included. CAGE is a very cost-effective, but reliable manner to assess dependency on alcohol use including only four items. Comparable data for these indicators are not available and the data can be derived only through surveys*. A survey including these measures would give information on depression in terms of incidence and prevalence, and on anxiety and suicide a 12-month prevalence. The data should be provided by gender, age groups, region and SES. *The ODIN project has, however, collected regional prevalence figures in some of the Member States. Likewise, the latest, WHO-project on psychiatric epidemiology will provide incidence and prevalence figures on depression in six European countries. The SIGMUND database in Montpellier, France, has the data on all European mental health surveys available.
11
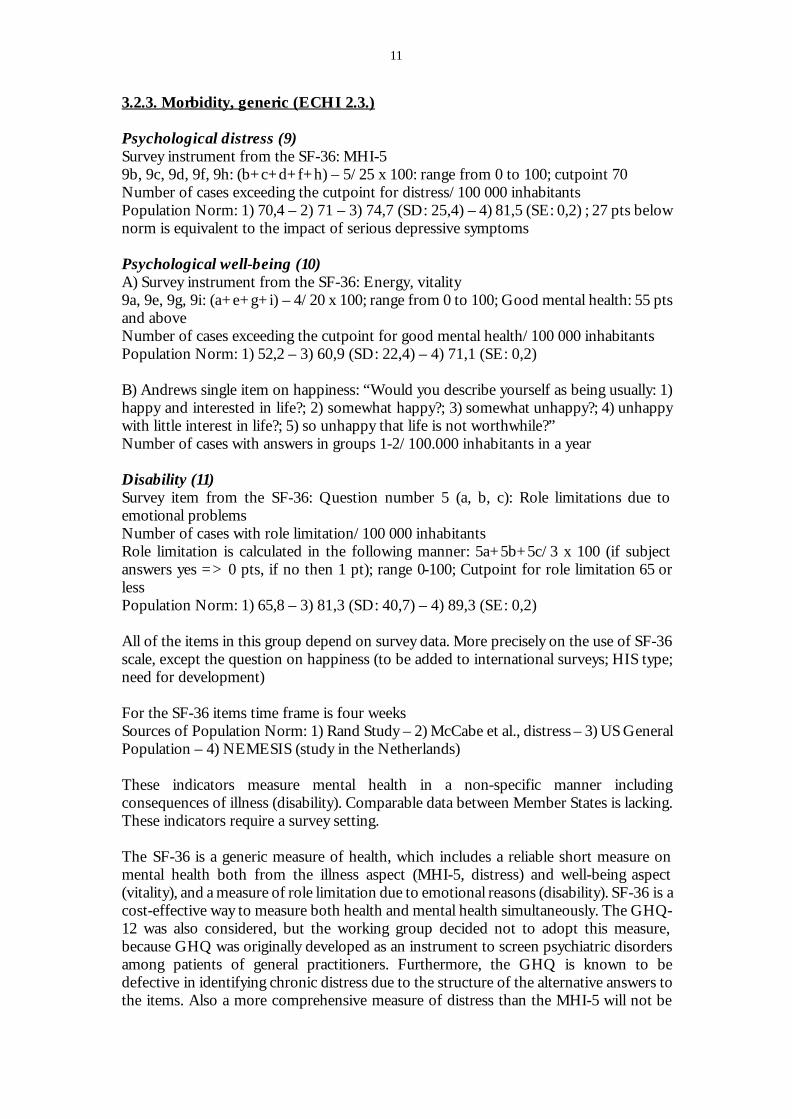
3.2.3. Morbidity, generic (ECHI 2.3.) Psychological distress (9) Survey instrument from the SF-36: MHI-5 9b, 9c, 9d, 9f, 9h: (b+c+d+f+h) – 5/25 x 100: range from 0 to 100; cutpoint 70 Number of cases exceeding the cutpoint for distress/100 000 inhabitants Population Norm: 1) 70,4 – 2) 71 – 3) 74,7 (SD: 25,4) – 4) 81,5 (SE: 0,2) ; 27 pts below norm is equivalent to the impact of serious depressive symptoms Psychological well-being (10) A) Survey instrument from the SF-36: Energy, vitality 9a, 9e, 9g, 9i: (a+e+g+i) – 4/20 x 100; range from 0 to 100; Good mental health: 55 pts and above Number of cases exceeding the cutpoint for good mental health/100 000 inhabitants Population Norm: 1) 52,2 – 3) 60,9 (SD: 22,4) – 4) 71,1 (SE: 0,2) B) Andrews single item on happiness: “Would you describe yourself as being usually: 1) happy and interested in life?; 2) somewhat happy?; 3) somewhat unhappy?; 4) unhappy with little interest in life?; 5) so unhappy that life is not worthwhile?” Number of cases with answers in groups 1-2/100.000 inhabitants in a year Disability (11) Survey item from the SF-36: Question number 5 (a, b, c): Role limitations due to emotional problems Number of cases with role limitation/100 000 inhabitants Role limitation is calculated in the following manner: 5a+5b+5c/3 x 100 (if subject answers yes => 0 pts, if no then 1 pt); range 0-100; Cutpoint for role limitation 65 or less Population Norm: 1) 65,8 – 3) 81,3 (SD: 40,7) – 4) 89,3 (SE: 0,2) All of the items in this group depend on survey data. More precisely on the use of SF-36 scale, except the question on happiness (to be added to international surveys; HIS type; need for development) For the SF-36 items time frame is four weeks Sources of Population Norm: 1) Rand Study – 2) McCabe et al., distress – 3) US General Population – 4) NEMESIS (study in the Netherlands) These indicators measure mental health in a non-specific manner including consequences of illness (disability). Comparable data between Member States is lacking. These indicators require a survey setting. The SF-36 is a generic measure of health, which includes a reliable short measure on mental health both from the illness aspect (MHI-5, distress) and well-being aspect (vitality), and a measure of role limitation due to emotional reasons (disability). SF-36 is a cost-effective way to measure both health and mental health simultaneously. The GHQ-12 was also considered, but the working group decided not to adopt this measure, because GHQ was originally developed as an instrument to screen psychiatric disorders among patients of general practitioners. Furthermore, the GHQ is known to be defective in identifying chronic distress due to the structure of the alternative answers to the items. Also a more comprehensive measure of distress than the MHI-5 will not be

12
necessary as specific morbidity is dealt with in the previous section. The SF-36 has been listed by the ECHI-project as a measure of QOL. Use of one instrument would thus provide synergy between various interests. The data should be provided by gender, age groups, region and SES. See list 2. of other indicators of this group. 3.3. Determinants of health Comment by ECHI: “This group includes all factors determining health, outside the health system. It includes (i) the ‘personal and biological factors’, as covering personal characteristics that may determine degrees of sensitivity for development of disease or ill health, but which are not by themselves a disease; (ii) health behaviours (lifestyle factors), which are generally subject to peoples own choices and (iii) living and working conditions, more to be viewed as the wider environment (physical, chemical, biological, social). For all these categories of determinants selection criteria were their importance in determining a substantial share of (ill) health, the degree to which they can be influenced, and the cost-effectiveness of the interventions involved.” 3.3.1. Personal and biological factors 3.3.1.1. Personal conditions (ECHI 3.1.2.) Comment by ECHI: “This category is not present as such in many other indicator listings. It should cover personal characteristics, either hereditary or acquired in the course of life, that are known as ‘risk factors’ or, conversely, as ‘protecting factors’ for developing a disease or disorder. In other words, these factors may determine degrees of sensitivity for development of disease or ill health, without by themselves being a disease. Examples are: body mass index, blood pressure (although the extreme, hypertension, is considered a disorder), immune status, and in the mental health area: coping ability. These factors can be influenced by disease prevention programmes, including screening and subsequent intervention. Although conceptually one can think of a wide range of factors, only a few remain, for which there is good knowledge of their impact on health and a fair availability of data. This is certainly a development area.” Certain features of temperament and personality are associated with higher levels of emotional well-being and more effective coping strategies. Cognitive skills and traits, “resilience”, enable to avoid breakdown when facing adverse events and can be described as healthy mental abilities that protect against various forms of general and mental ill-health. The protective personal factors are not synonymous to pleasurable experiences rather the protectiveness is determined by the effect of a factor than its hedonic qualities. They may in fact be qualities of a person instead of experiences.

13
Protective factors may not be visible, but in a time of crisis or the presence of a particular stressor. Expectation of future as a resource is emphasised in two concepts close to each other, optimism and personal hopefulness. Optimism has been characterised in general as a stable feature of personality and a prospective predictor of adaptation to stressful encounters. Sense of mastery can be viewed as a form of perceived personal control. Personal control refers to a sense of control over the events in one’s life. Both low levels of optimism and sense of mastery have been linked to mental and general ill-health. Sense of mastery (12) Data type: Survey (Five item scale; original with seven items) Source: Scale to be added to international surveys; HIS type; need for development Number of persons exceeding cutpoint for satisfactory level of sense of mastery within a country (satisfactory level of mastery)/100 000 inhabitants in year Optimism (13) Data type: Survey Source: Scale to be added to international surveys; HIS type; need for development Life Orientation Test-Revised (LOT-R, 10 items) Number of persons exceeding cutpoint (upper quadrant of the population) for being an “optimist” within a country/100 000 inhabitants in year No comparable data is available between Member States. The indicator depends on information acquired through surveys. The data should be provided by gender, age groups, region and SES. See list 2. for other indicators of this group. 3.3.2. Health behaviours (ECHI: 3.2.) Definition by ECHI: “This section, often called ‘lifestyle factors’, should include behavioural factors, which have been proven to be clearly associated with, or causally linked to, specific diseases and health problems. Behavioural factors are to a large extent defined by personal choices, and potentially influenced by health promotion and/or information/education. Most of these choices (e.g. food selection, physical exercise) may have adverse as well as positive effects on health. Intermediary to actual behaviour, attitudes towards health are important in developing policies. Indicators on these may be developed.” See list 2. for indicators belonging to this group 3.3.3. Living and working conditions (ECHI: 3.3.) The link between stress and ill-health has led researchers to focus on the situation of stress (the “stressor” or “objective” stress). Stress can be grouped into three categories: 1) performance demand, 2) loss and 3) “role strain” or “hassles”. “Life event” studies represent a conceptualisation of stress linked to onset of mental ill-health, especially depression.

14
Social support is seen as a protective factor against illnesses when faced with various forms of stress. Evidence shows that social support, especially perceived social support, correlates strongly with measures on mental health, particularly when the individual experiences stress. Negative pressure from or interaction with social networks may, conversely, have negative effects on the health of an individual. Despite the fact that the level of received social support has connections to personality features, coping styles and socio-economic factors, lack of social support is associated with an increased risk for mental ill-health and ill-health in general demonstrating usefulness as an indicator for a mental health monitoring system.
3.3.3.1. Social and cultural environment (ECHI 3.3.3.)
Comment by ECHI: “Under ‘working conditions’ and ‘social conditions’, several items are derived from Eurostat listings and from work done by the European Foundation for the Improvement of Living and Working Conditions in Dublin. They include socio-economic variables such as employment status, social networks, and schooling levels. Again, they are selected as having a clear-cut relation to health.” Life events can be defined as major occurrences in one’s life that require psychological adjustment to some degree. Studies have investigated major life events judged as undesirable, uncontrollable or life threatening as risk factors for mental ill-health. Social support is generally defined as availability of people whom the individual trusts and who make one feel cared for and valued as a person. The key issue in terms of health effects is whether social support is “received” in some form (e.g. having someone to listen to one’s troubles) or “perceived” by the individual to exist (e.g. the belief that in times of trouble support would be expectable). There are three types of attributes of social support: 1) emotional, 2) instrumental, and 3) informational and appraisal. Social support (14) Survey instrument: Oslo 3 item social support scale Source: Scale to be added to international surveys; HIS type; need for development Number of cases with poor, moderate and strong social support/100 000 inhabitants in a year Social isolation (15) Data type: Survey Source: Scale to be added to international surveys; HIS type; need for development Four item scale measuring social isolation (has been used by Statistics Canada) Number of persons exceeding cutpoint/100 000 inhabitants Social networks: As inquired in the ECHP (16) Data type: survey Source: European Community Household Panel (ECHP) Items deal with: Membership in organisations; Talking to neighbours; Meeting friends or relatives; Spoken to another person (not a member of household) even by phone

15
Life events (17) Data type: Survey Source: Scale to be added to international surveys; HIS type; need for development Survey instrument to used: Short list of threatening events: LTE Number of cases with at least one event during the last 6 months/100 000 inhabitants All items in this group depend on survey data (Scales to be added to international surveys; HIS type; need for development). Calculation social support score: total score is calculated by summarizing the scores for each item, ranging from 3 to 14. The total score can been used as a categorical variable. In this case the following code could be used: Poor social support 3-9 25,9% in European sample Moderate social support 10-12 53,1 ” Strong social support 13-14 21,1 ” Comparable data for these indicators are not available. They require survey settings. Uniform measures on “social support”, “social isolation” and “life events” are not in use in the Member States, although some MS use various reliable measures. These indicators have been shown to have a clear relation to mental health (especially to depression, is dealt with in section 2.2. above) and to general health and mortality as well. The data should be provided by gender, age groups, region and SES. The information provided by the indicators should also be linked to measures of mental and various somatic forms of morbidity (both disease specific and generic) and mortality. These indicators are relevant also from the perspective of mental health promotion. See list 2. for other indicators of this group 3.4. Health systems Comment by ECHI: “This group includes indicators on the health services system, as well as on prevention and health promotion. In some areas defining of quantitative indicators will be difficult.” 3.4.1. Prevention, health protection and health promotion (ECHI: 4.1.) Comment by ECHI: “The inclusion of a separate category on prevention and health promotion is to stress its importance from a public health point of view. In other classifications, indicators of this sort are dispersed under other headings. Generally speaking, this section should include measures for the existence and extent of disease- or risk factor-specific prevention programmes and for the frequency and effectiveness of their uptake.” Several concrete initiatives have been taken at the European level in recent years. Agreement is growing that mental health issues need greater visibility in the European context. The DGV of the European Commission has been active by giving mental health higher priority in its recent action plans for public health. Previous European

16
projects in the field of mental health promotion include “The Key Concepts project” supported by the EC and the ”Promotion of Mental health on the European Agenda” project. Prevention projects (18) Suicide prevention projects Promotion projects (19) Projects to support parenting skills See list 2. for other indicators of this group 3.4.2. Health care resources (ECHI: 4.2.) Comment by ECHI: “For this section, the HFA21 and OECD listings have been followed closely. Precise definitions may differ, however.” The proposed indicators in the “resources” section are very “robust” measures of the care system. All the concepts in this section have differing definitions due to the differences in the care systems. However, some countries are closer to each other in these definitions than others. This hampers the definition of “strong” indicators in all cases. Good definitions of the basic concepts, e.g. “bed”, are urgently required. Despite the problems of comparability, these data are mostly available. Psychiatric beds (20) Data type: Routine statistics Source: Eurostat The definition by Eurostat is to be used (presently under revision) Psychiatrists (21) Data type: Routine statistics Source: Eurostat The definition by Eurostat is to be used (presently under revision) Child psychiatrists (22) Data type: Routine statistics Source: Eurostat Other professional than physicians in mental health care (23) Includes: social workers, counsellors, specialised and other nurses, mental health nurses and clinical psychologists (medical, nursing staff and social workers only), reliability? Source: Eurostat/OECD Within this section, OECD collects a multitude of data and indicators (beds, workers, expenditure) that are of interest both from a public health. Likewise, the Eurostat have defined the concepts (these definitions will be applied on beds, psychiatrists and other workforce) and collected data on psychiatric beds and the number of psychiatrists in European countries. There are numerous problems with the comparability of these data (beds & psychiatrists). These problems are most likely to be met also regarding other workforce within mental health care.

17
3.4.3. Health care utilisation (ECHI: 4.3.) Comment by ECHI: “In this section, the WHO/HFA list has been followed (except admissions) with few extensions, derived from OECD: discharges and medicine use. Discharges are taken as the best indicator to cover disease-specific hospital use, rather from the public health point of view than from the health care production point of view. Medicine use (and perhaps feasible: medical devices) is included as a policy-sensitive issue for cost-increase arguments as well as for its possible effect of taking over parts of in-patient health care needs. Also here, WHO and OECD definitions should be closely considered.” Utilisation data cannot be used directly to estimate the prevalence and incidence of the disorders. Use of mental health services may depend upon many other variables than the clinical condition of the patient, for example, the sociodemographic characteristics of the patient and intrinsic characteristics of the services. According to epidemiological studies only a small proportion of the individuals who satisfy the criteria for a mental disorder receive treatment. One should therefore be cautious in drawing too far-reaching conclusions from such data alone. The utilisation data may be of more use in serious disorders as schizophrenia and the more severe cases among this patient population, because a greater proportion of these patients are admitted to hospitals compared to e.g. major depression. National databases have been used to evaluate needs at population level, e.g. the proportion of long-stay inpatient population may indicate need for supported housing. Descriptive analysis and interpretation of service use data, combined with sociodemographic and epidemiological data can be useful for planning intervention strategies. National or regional databases exist in the Member States to provide the necessary information. Data for sale of drugs and disability are available in most countries. The concept of “discharge” includes, however, some pitfalls as “discharge” may indicate discharge from hospital to the community as well as transition to another hospital (“discharge” does not signify “treatment episode”). Number of discharges due to mental health conditions (24) Data type: Routine statistics Source: National/regional database within the Member States Use of beds within specialised psychiatric services Number of all discharges, i.e. episodes (due to ICD-10 group F) of treatment that have ended during a year/100 000 inhabitants in a year Number of discharges due to mental health conditions for minors (under 18 year olds) (25) Data type: Routine statistics Source: National/regional database within the Member States Use of beds within specialised psychiatric services Number of all discharges for those under 18-years of age, i.e. episodes (due to ICD-10 group F) of treatment that have ended during a year/100 000 inhabitants in a year

18
Number of long stay patients (26) Data type: routine statistics Source: National/regional database within the Member States Number of inpatients with a length of stay for 365 days or longer (according to census data at the end of year) within specialised psychiatric services/all census data patients during the year in question Use of outpatients services (27) Source: National/regional database within the Member States Number of visits to psychiatric outpatient care in a year/100 000 inhabitants in a year Outpatient care: outpatient service or unity within specialised psychiatric care (public or private); includes e.g. Community Mental Health Centres, Polyclinics in hospitals etc. Self-reported use of mental health services (28) Data type: Survey Source: Survey items to be added to international surveys; HIS type; need for development Survey items: A) “Did you see a health professional for help due to an emotional problem?” If yes; indicate who: 1) psychiatrist; 2) psychologist; 3) nurse; 4) social worker; 5) general practitioner; 6) other health care professional. B) “Did you seek the advice of someone who is not a health care professional?” C) “Were you admitted to psychiatric hospital due to mental health problems during the last year?” If yes to a question, then inquire: “Was this the first time?” Number of persons who have seen a health professional during a year/100 000 inhabitants in a year Number of persons who have sought other advice during a year/100 000 inhabitants in a year Number of persons who have been admitted to psychiatric hospital during a year/100 000 inhabitants in a year Sale of psychotropic drugs (29) Data type: Routine statistics Source: OECD?/National registers The ATC classification system by WHO is used; Pharmacological agents are divided into five levels, which are divided into 14 subgroups (1. level) and furthermore, into four sublevels. DDD: Defined daily dose; Calculation based on the volume of sales to pharmacies and hospitals by wholesalers and on the assumed average dose per day for each drug; Expressed usually as number of DDDs/1000 inhabitants and per day Sale of psychotropic drugs: DDD/1000 inhabitants per day in each group: 1. Antidepressants: ATC class: N06A Includes the following groups: SSRI`s; Tricyclic and tetracyclic agents; Triazolopyridines; Aminoketones; MAO-inhibitors; and Other new antidepressant agents: mirtazapine; reboxetine; venlafaxine; nefazodone; etc. 2. Antipsychotics: ATC class: N05A
19
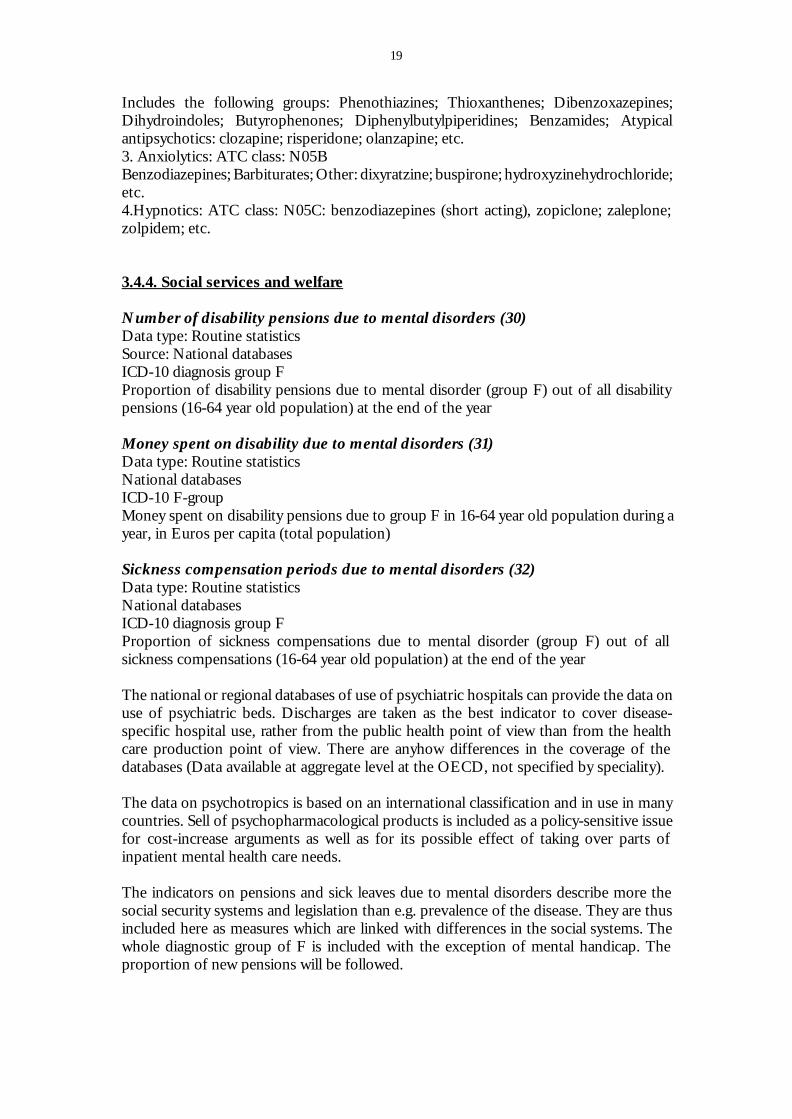
Includes the following groups: Phenothiazines; Thioxanthenes; Dibenzoxazepines; Dihydroindoles; Butyrophenones; Diphenylbutylpiperidines; Benzamides; Atypical antipsychotics: clozapine; risperidone; olanzapine; etc. 3. Anxiolytics: ATC class: N05B Benzodiazepines; Barbiturates; Other: dixyratzine; buspirone; hydroxyzinehydrochloride; etc. 4.Hypnotics: ATC class: N05C: benzodiazepines (short acting), zopiclone; zaleplone; zolpidem; etc. 3.4.4. Social services and welfare Number of disability pensions due to mental disorders (30) Data type: Routine statistics Source: National databases ICD-10 diagnosis group F Proportion of disability pensions due to mental disorder (group F) out of all disability pensions (16-64 year old population) at the end of the year Money spent on disability due to mental disorders (31) Data type: Routine statistics National databases ICD-10 F-group Money spent on disability pensions due to group F in 16-64 year old population during a year, in Euros per capita (total population) Sickness compensation periods due to mental disorders (32) Data type: Routine statistics National databases ICD-10 diagnosis group F Proportion of sickness compensations due to mental disorder (group F) out of all sickness compensations (16-64 year old population) at the end of the year The national or regional databases of use of psychiatric hospitals can provide the data on use of psychiatric beds. Discharges are taken as the best indicator to cover disease-specific hospital use, rather from the public health point of view than from the health care production point of view. There are anyhow differences in the coverage of the databases (Data available at aggregate level at the OECD, not specified by speciality). The data on psychotropics is based on an international classification and in use in many countries. Sell of psychopharmacological products is included as a policy-sensitive issue for cost-increase arguments as well as for its possible effect of taking over parts of inpatient mental health care needs. The indicators on pensions and sick leaves due to mental disorders describe more the social security systems and legislation than e.g. prevalence of the disease. They are thus included here as measures which are linked with differences in the social systems. The whole diagnostic group of F is included with the exception of mental handicap. The proportion of new pensions will be followed.

20
3.4.5. Expenditure (ECHI: 4.4.) Comment by ECHI: “For most of this section, the list of core indicators of OECD is followed (a subset of their total list under this heading). Expectations are that updates are provided by the system of ‘International Classification on Health Account’ under development.” Total national expenditure on psychiatric services (33) Data type: Routine statistics Source: National databases Total expenditure on specialised psychiatric services/total expenditures on the whole health care system Includes expenditure on specialised psychiatric services; either inpatient or outpatient services Proportionate national expenditure on psychiatric services (34) Data type: Routine statistics Source: National databases Total expenditure on specialised psychiatric services per capita (Euros spent/total population) Includes expenditure on specialised psychiatric services; either inpatient or outpatient services Proportionate national expenditure on psychiatric services for minors (35) Data type: Routine statistics Source: National databases National expenditure on psychiatric services for minors (under 18 year olds) per capita (Euros spent/total population) Includes expenditure on specialised psychiatric services; either inpatient or outpatient services 3.4.6. Health care quality indicators (ECHI: 4.5.) Comment by ECHI: “This section should contain indicators that give information on the performance and/or quality of the medical care system. These may be selected items from the health care process (e.g. accessibility), the availability of specific technology, or ‘health outcome’ items, i.e. specific health states which can be related to the adequateness of an intervention.” Availability of national quality accreditation (36) Data type: routine statistics Source: indicator in need of development Does a quality accreditation system exist in a Member State? National and regional systems

21
National systems of quality accreditation may not yet be widely available, but the topic has been frequently discussed and is considered important among the professionals in mental health care. Due to its future importance the indicator is mentioned here.
22
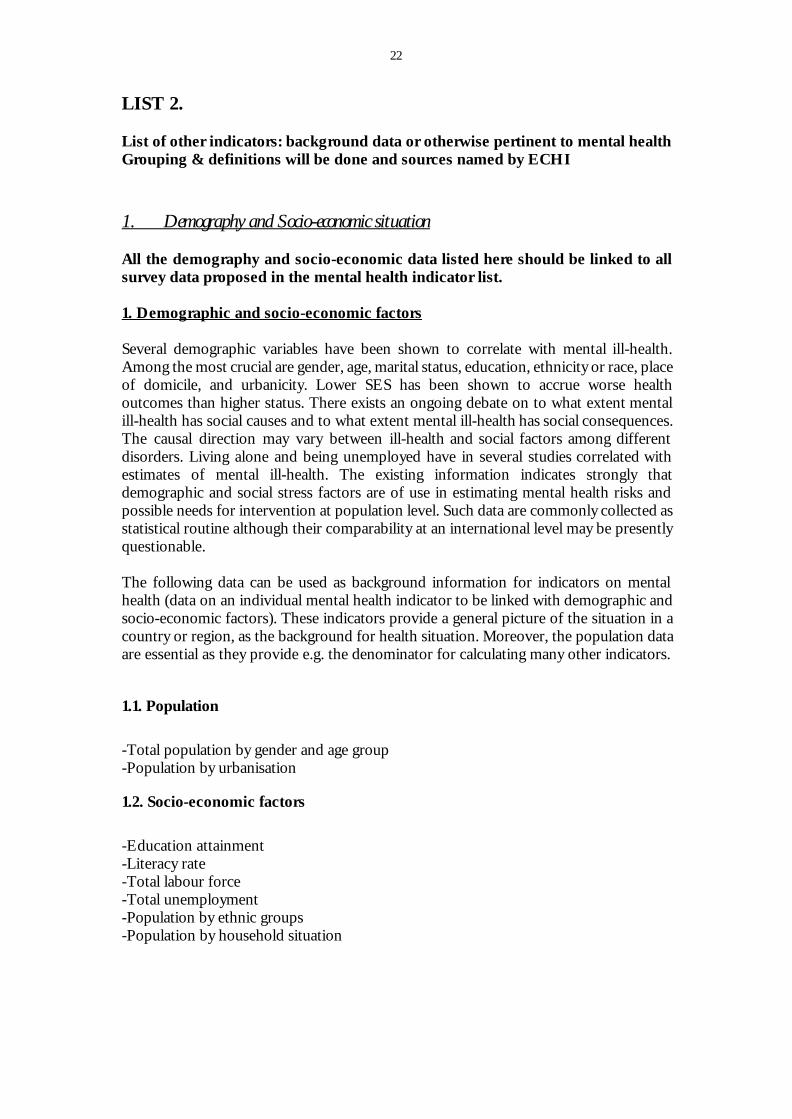
LIST 2. List of other indicators: background data or otherwise pertinent to mental health Grouping & definitions will be done and sources named by ECHI 1. Demography and Socio-economic situation All the demography and socio-economic data listed here should be linked to all survey data proposed in the mental health indicator list. 1. Demographic and socio-economic factors Several demographic variables have been shown to correlate with mental ill-health. Among the most crucial are gender, age, marital status, education, ethnicity or race, place of domicile, and urbanicity. Lower SES has been shown to accrue worse health outcomes than higher status. There exists an ongoing debate on to what extent mental ill-health has social causes and to what extent mental ill-health has social consequences. The causal direction may vary between ill-health and social factors among different disorders. Living alone and being unemployed have in several studies correlated with estimates of mental ill-health. The existing information indicates strongly that demographic and social stress factors are of use in estimating mental health risks and possible needs for intervention at population level. Such data are commonly collected as statistical routine although their comparability at an international level may be presently questionable. The following data can be used as background information for indicators on mental health (data on an individual mental health indicator to be linked with demographic and socio-economic factors). These indicators provide a general picture of the situation in a country or region, as the background for health situation. Moreover, the population data are essential as they provide e.g. the denominator for calculating many other indicators.
1.1. Population
-Total population by gender and age group -Population by urbanisation
1.2. Socio-economic factors
-Education attainment -Literacy rate -Total labour force -Total unemployment -Population by ethnic groups -Population by household situation

23
2. Health Status This section contains indicators on various aspects of the actual health situation of the population. Indicators may have been selected because of their direct interest of monitoring (e.g. their share of the total burden of ill-health) or, alternatively, because of their reference to known risk factors or to identified activities in prevention and health care (e.g. avoidable mortality).
2.1.3. Cause-specific mortality
These following causes of death are also pertinent to mental health. Alcohol related deaths imply addiction problems and smoking has been linked closely to depression. -Alcohol-related deaths -Smoking-related deaths
2.2.1 Diseases/disorders of large impact:
Dementias are classified as mental disorders. It is important to differentiate between dementia and depression in the elderly population. Dementias may predispose to delirious states. Incidence/prevalence of selected diseases/disorders -Alcohol Psychoses -Dementia/Alzheimer; incidence/prevalence
2.2.2 Selected diseases: incidence or prevalence
See comment in health behaviours. -Alcohol-related disease (linked under health behaviours)
2.3 Generic health status
Self perceived health (SPH) has significant links to mental health, especially depression, although the predictive power of SPH regarding mortality is independent. Long standing illnesses may form a threat on mental health of an individual and, likewise, a mental health disorder increases the likelihood of having a chronic somatic illness. The links between somatic and mental are important. There are also important links between general quality of life (QOL) and mental health. Most mental disorders decrease the QOL. Subjective experience of a good level of QOL is a protective factor. -Self assessed health -Prevalence of long-standing illness
-General QOL

24
2.4 Composite measures of health status
These indicators could provide a useful composite picture of mental health situation in a Member State and provide good possibilities for international comparisons. -Disability free life years -Other health expectancies (perceived health; general mental health) 3. Determinants of health High levels of alcohol use and mental health problems are often linked. Likewise, smoking is prevalent among individuals suffering from various forms of depression. Illicit drug use often leads to dependence, which is mental health disorders. Personality problems may predispose to drug abuse. The indicators of substance abuse could be linked to the mental health morbidity indicators. Positive feelings are additionally linked to higher levels of reported exercise compared to e.g. depression.
3.2.1. Substance use
-Smoking prevalence -Alcohol use -Total alcohol consumption -Illicit drug use
- Alcohol-related deaths/disease (Linked to mortality/morbidity) 3.3. Living and Working conditions
3.3.1 Physical environment
This is a selection of environmental indicators, which have a relatively clear and substantial relationship to mental health.
-Housing -Noise
3.3.2. Working conditions
For instance, lack of control and job strain have been linked to depression. -Mental workplace exposures
3.3.3. Social & cultural environment

25
The list drafted by ECHI is much longer than presented here. The most important ones have already been mentioned in the sociodemographic indicators. Together these describe the social and cultural environment. Those previously not mentioned, but that might have some relevance (as depicting aspects of the environment) pertaining to mental health, are listed here. -Violence 4. Health systems The following could have importance to mental health also.
4.1. Prevention, health protection, health promotion
-Campaigns/programmes concerning alcohol use -Campaigns on drugs -Advertising restrictions on tobacco/alcohol
4.2. Health care resources
These could be useful in comparisons between psychiatric care and health care in general or provide otherwise important background information regarding care systems. 4.2.1. Facilities -Primary health care units
-Hospital beds total -Nursing/elderly home care beds
4.2.2. Manpower -Employment -Physicians employed
-Nurses employed
4.3. Health care utilisation
4.3.1 In-patient care utilisation -Discharges (total by disease group (ICD) 4.3.2 Out-patient care utilisation -Out-patient contacts (all)
4.4. Health expenditures and financing

26
4.4.1 . Health care system -Key indicator(s) for the structure of the national health care system
-Insurance coverage (OECD) 4.4.2. National expenditures on health Total expenditure on health:
-Total expenditure on health -Public expenditure on health
4.4.3 Expenditures on medical services
-Expenditure on in-patient care -Expenditure on out-patient care
4.4.6. Direct cost of illness
-Direct cost by ICD category
4.5. Health care quality indicators
4.5.1. Subjective indicators
-Perception of the health system -Complaints