proposed eps-cse graduate course: “matlab applications...
TRANSCRIPT

Proposed EPS-CSE graduate course:
“Matlab Applications in Earth Science” Burkhard Militzer Dino Bellugi Assistant professor Graduate student Earth and Planetary Science, Astronomy, CSE Earth and Planetary Science, CSE 407 McCone Hall 273 McCone Hall Email: [email protected] [email protected] Phone: (510) 643-7414 (510) 643-8335 We are preparing a new semester-long two unit course that illustrates the use of selected Matlab toolboxes to analyze Earth science data, to perform challenging simulations, and to explore selected problems in Earth science and related fields. The course will target an audience composed of graduate students in CSE, Earth and Planetary Science, and Integrative Biology who either want to learn about computational approaches in Earth science, or are unfamiliar with the functionalities of the toolboxes and their applications. The course will emphasize functionalities and applications of the image processing, signal processing, statistical, and mapping toolboxes within the context of Earth science problems. Machine learning and computer vision tools that may be called from a Matlab program, such as LibSVM (a library for Support Vector Machines) and GlobalPb (image segmentation) will also be taught in class. The goal is to give the students exposure to tools and programming techniques to enable them to work individually or in a group on a final project relevant to their research interest. Topics will include efficient Matlab programming techniques, numerical modeling and learning to build a classifier for recognition and measurement, separating and clustering data, graph representation and spectral clustering, and fundamentals of parallel applications. Current Matlab-based research projects will be presented to illustrate algorithmic methods and toolbox functionalities, as well as to help define final projects. Among these we list here two examples: - Automatic river bed grain size measurement from photographs: an image processing and
machine learning procedure to automatically extract grain size measurements from photographic images of gravel-bedded rivers. We apply the state of the art of image segmentation techniques, resulting in boundary probability signal; the signal is treated by a region merging procedure, providing a flexible hierarchical structure which allows us to progressively retain the grains which give us the greatest level of confidence, based on a learned decisional model (figure 1).
- Predicting the size and location of shallow landslides across landscapes: a 3D slope stability model applied to a graph representation of the landscape; using a cost/benefit formulation of the resistive and driving forces involved in landslide mobilization within a spectral clustering technique, we delineate the specific location and size of the least stable areas of the soil mantle (figure 2).
- Furthermore we will discuss image processing in selected examples from fields like the algae growths in figure 3. The goal is attract a wider audience among graduate students on campus.
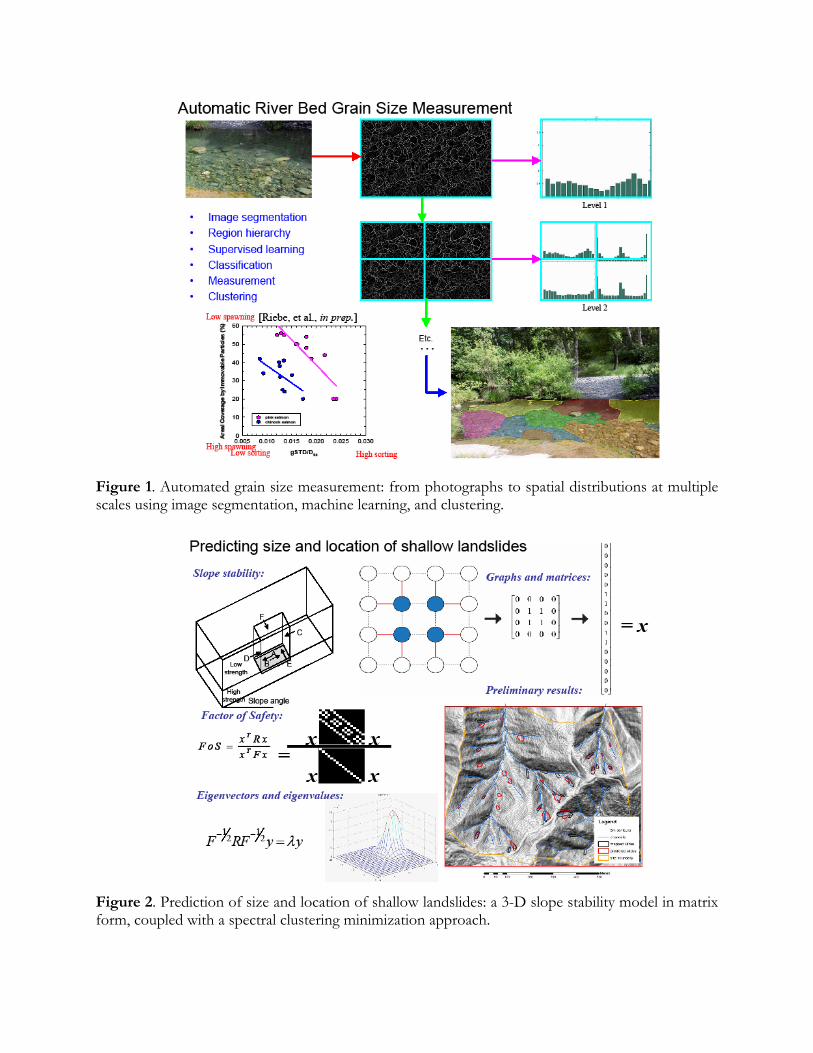
Figure 1. Automated grain size measurement: from photographs to spatial distributions at multiple scales using image segmentation, machine learning, and clustering.
Figure 2. Prediction of size and location of shallow landslides: a 3-D slope stability model in matrix form, coupled with a spectral clustering minimization approach.

Figure 3: A riverbed image with yellow and green algae is shown on the left. What are the best algorithms for detecting and quantifying the growth of both species?
Workload and Grades This course is designed for incoming graduate students in Earth Science, CSE, and related fields. While some have programming experience, others do not and are not prepared for the challenges in Earth Science research, which relies to an increasing extent on data analysis and processing as well as computer simulations. Ideally, students will later in their own research come back to the tools that we taught them in this class.
While this course teaches essential research methods, one needs to realize that graduate students are busy and tend to be overloaded with work. We consequently propose a two-unit course that meets for only two hours every week. Students are encouraged to pick a final project that relates to their main research goals. We do, however, require students to do homework and to read about the background and further applications of the discussed techniques. This will be a two-unit class with an average workload of six hours per week composed of:
1 hour of lecture per week 2 hours of homework per week 1 hour of computer lab per week 2 hour of reading per week
There will be no final exam. The course grade will be determined from 33% computer lab exercises 66% final project There is no textbook for this class.
Syllabus Module 1: Introduction to Class and Matlab Toolboxes
Week 1, Wed Jan 19: lecture Week 2, Wed Jan 26: computer lab o General introduction to Matlab and its toolboxes o Optimizations: vector and matrix operations, memory allocation o Data structures (trees, graphs, etc.) o Recursion, divide and conquer
Module 2: Image Processing I Week 3, Feb 2: lecture Week 4, Feb 9: computer lab

o Image processing toolbox o Image data o Gradients and edge detection o Example: Characterizing river beds
Module 3: Image Processing II
Week 5, Feb 16: lecture Week 6, Feb 23: computer lab o Image processing toolbox continued o Global probability of boundary using GBB library o Identifying regions from boundaries o Example: Analyzing algae growth in rivers
Module 5: Machine Learning Algorithms
Week 9, Mar 16: lecture Week 10, Mar 30: computer lab o Machine learning o Support vector machines o Supervised training algorithms o Unsupervised classification
Module 4: Processing of Geospatial and Seismic Data
Week 7, Mar 2: lecture Week 8, Mar 9: computer lab o Mapping toolbox o Geospatial data o Lidar data o Landscape attributes: slope and area o Signal processing and filtering of seismic data o Time and frequency domain filtering
Module 6: Clustering Techniques
Week 11, Apr 6: lecture Week 12, Apr 13: computer lab o Clustering (statistical toolbox) o K-means clustering o Hierarchical clustering o Graphs and matrices revisited o Spectral clustering
Module 7: Parallel Computing Week 13, Apr 6: lecture o Parallel computing Matlab toolbox o Parallel computation in other languages o Optimization techniques to write efficient codes Week 14, Apr 13: student present final projects