project(on(improvement(of(local(administration(in(cambodia ... ·...
TRANSCRIPT

al Department of Local A
23
Project on Improvement of Local Administration in Cambodia (PILAC) Ministry of Interior and Japan International Cooperation Agency
Manual on Training Needs Assessment
Figure 10: Tips for Conducting an Interview
(Source: Kavita Gupta, 2007, A Practical Guide to Needs Assessment)
In conducting the group discussion, the GDLA Task Force members were
divided into three groups according to target groups (GDLA officials in MOI,
Phnom Penh Municipality and Kampong Cham Province). It took three days
for one target group. The process of the survey was followed as shown in the
above figure “Proto-type of Process of Group Discussion.” As a result, 39
group discussions were conducted and 171 samples of the questionnaires
were collected. The interviewees are shown below.
In the MOI headquarters, all four departments, Departments of Local
Administration, General Administration, Political Affairs and Personnel and
Vocational Training were covered, though not all the offices were covered.
In Phnom Penh Municipality, offices to be covered were: i) Municipality Local
Administration Unit (MLAU) (all offices), and ii) Offices of Cabinet (offices of
administration, international relations, accounting, urbanization &
construction, investment, general administration, inspection, IT, Civil
Registration and Personnel).
Begin with a few rapport-‐building questions.
Obtain permission to record the interview.
Avoid adhering rigidly to the question sequence. Be flexible, but ensure that all
questions have been covered by the end. If they have not been, schedule a
follow-‐up interview, if necessary.
Give all participants an equal amount t of time to respond to each question.
Clarify responses when necessary.
Ask for concrete examples to support statements.
Separate facts from opinions, if possible.
Maintain a neutral attitude.
Avoid discussing results with other interviewees.
Ask whether interviewees have additional questions or comments at the end.
Offer appreciation for participation.
Summarize key points.
Ask whether interviewees can be contacted again if necessary
PILAC

al Department of Local A
24
Project on Improvement of Local Administration in Cambodia (PILAC) Ministry of Interior and Japan International Cooperation Agency
Manual on Training Needs Assessment
In Kampong Cham Province, selected offices relatively concerned with D&D
were surveyed: i) Provincial Local Administration Unit (PLAU) (all offices); ii)
Finance Unit; iii) General Secretariat (land registration); and iv) Offices of
Cabinet (offices of personnel, information, general administration, political
affairs public relationship, administration and document). In addition, only
a group discussion with officials of Kampong Cham District Office covering
all sections was also conducted to deepen a level of understanding of local
administration. No questionnaire survey was done.
PILAC
al Department of Local A
25
Project on Improvement of Local Administration in Cambodia (PILAC) Ministry of Interior and Japan International Cooperation Agency
Manual on Training Needs Assessment
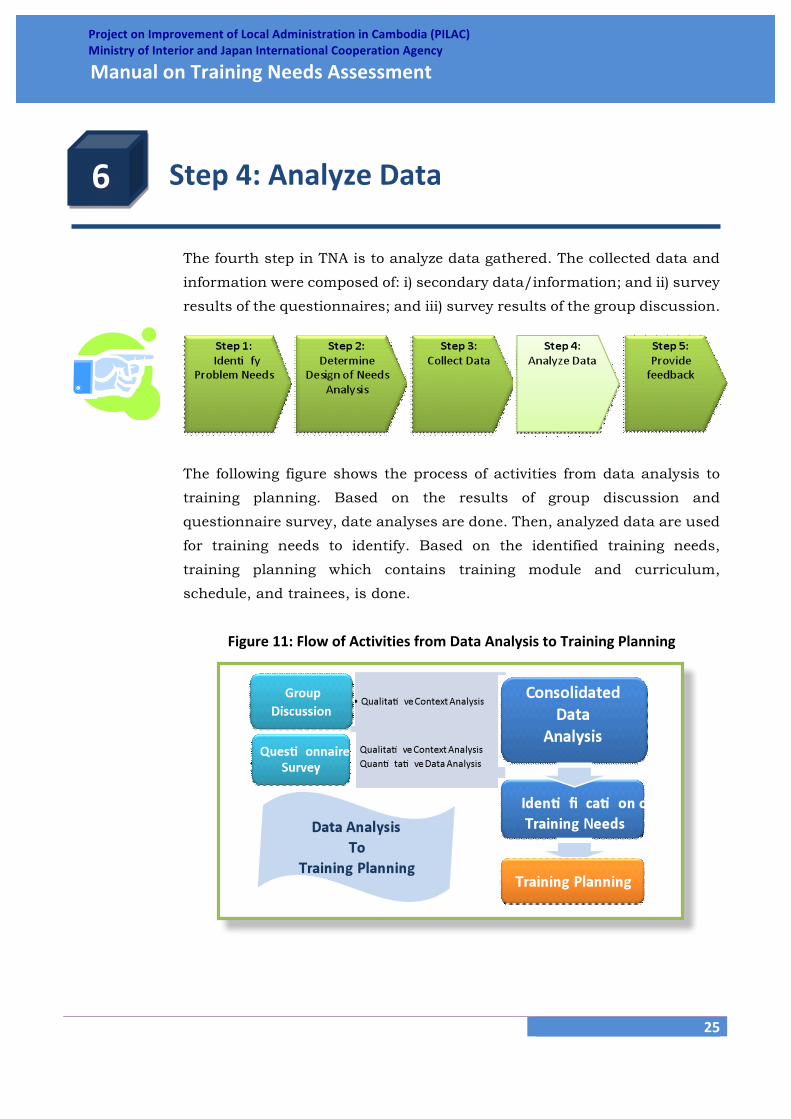
Step 4: Analyze Data
The fourth step in TNA is to analyze data gathered. The collected data and
information were composed of: i) secondary data/information; and ii) survey
results of the questionnaires; and iii) survey results of the group discussion.
The following figure shows the process of activities from data analysis to
training planning. Based on the results of group discussion and
questionnaire survey, date analyses are done. Then, analyzed data are used
for training needs to identify. Based on the identified training needs,
training planning which contains training module and curriculum,
schedule, and trainees, is done.
Figure 11: Flow of Activities from Data Analysis to Training Planning
6
al Department of Local A
26
Project on Improvement of Local Administration in Cambodia (PILAC) Ministry of Interior and Japan International Cooperation Agency
Manual on Training Needs Assessment
There are two kinds of data: quantitative and qualitative. Numerical data
are quantitative. All other kinds of data are qualitative. Quantitative data
include age of the interviewee, and the numbers of training attended.
Qualitative data include words, graphics, and photographs.
Quantitative data can be gathered, scored, and analyzed more easily and
quickly than qualitative data. They may be summarized and presented
using various kinds of tables, charts, and graphs. In contrast, qualitative
data are more difficult and time-consuming to collect and analyze, but they
provide rich and detailed information.
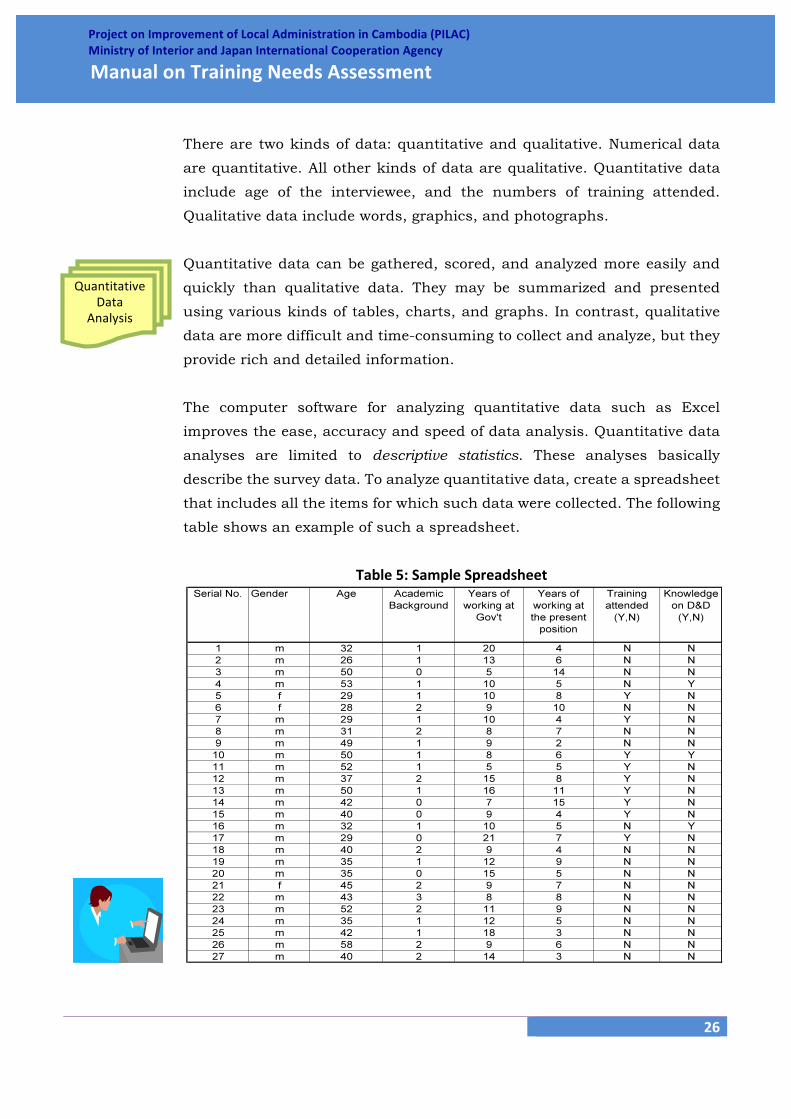
The computer software for analyzing quantitative data such as Excel
improves the ease, accuracy and speed of data analysis. Quantitative data
analyses are limited to descriptive statistics. These analyses basically
describe the survey data. To analyze quantitative data, create a spreadsheet
that includes all the items for which such data were collected. The following
table shows an example of such a spreadsheet.
Table 5: Sample Spreadsheet
Quantitative Data
Analysis

al Department of Local A
27
Project on Improvement of Local Administration in Cambodia (PILAC) Ministry of Interior and Japan International Cooperation Agency
Manual on Training Needs Assessment
The following table shows a sample tally sheet for analyzing the quantitative
data obtained from a survey question. You can create a similar tally sheet
for quantitative data obtained through other methods such as observation
and interview.
Table 6: Sample Frequency and Percentage Calculation
The example shows the response choices for the item, the frequency of each
response, which was obtained by counting the actual responses, and the
percentage of individuals who selected each response. How to calculate
frequencies and percentages is shown below
Figure 12: Frequency and Percentage for Quantitative Analysis
(Source: John H. McConnell, 2003, How to Identify Your Organization’s Training Needs)
In addition to reporting the frequencies and percentages for each category,
you can report a single value that provides information on what is typical for
a question. This value is called a “measure of central tendency.” Here are
the three measures of central tendency: mode; median; and mean or
Frequency: This measure counts the number of times each response choice was selected.
A quick glance at the frequency column in Figure reveals that the greatest number of
interviewees (59) is working at MOI from 0 to 9 years, but only one interviewee is working
at MOI for more than 40 years.
Percentage: This measure is useful for comparing the categories of responses. To
calculate the percentage for a response, divide its frequency by the total frequency. For
example, the percentage for those working at MOI for 20-‐29 years is calculated by its
frequency (46) by the total (171) and then rounding the number (26.9 percent).
Frequency and
Percentage
Other Measures
al Department of Local A
28
Project on Improvement of Local Administration in Cambodia (PILAC) Ministry of Interior and Japan International Cooperation Agency
Manual on Training Needs Assessment
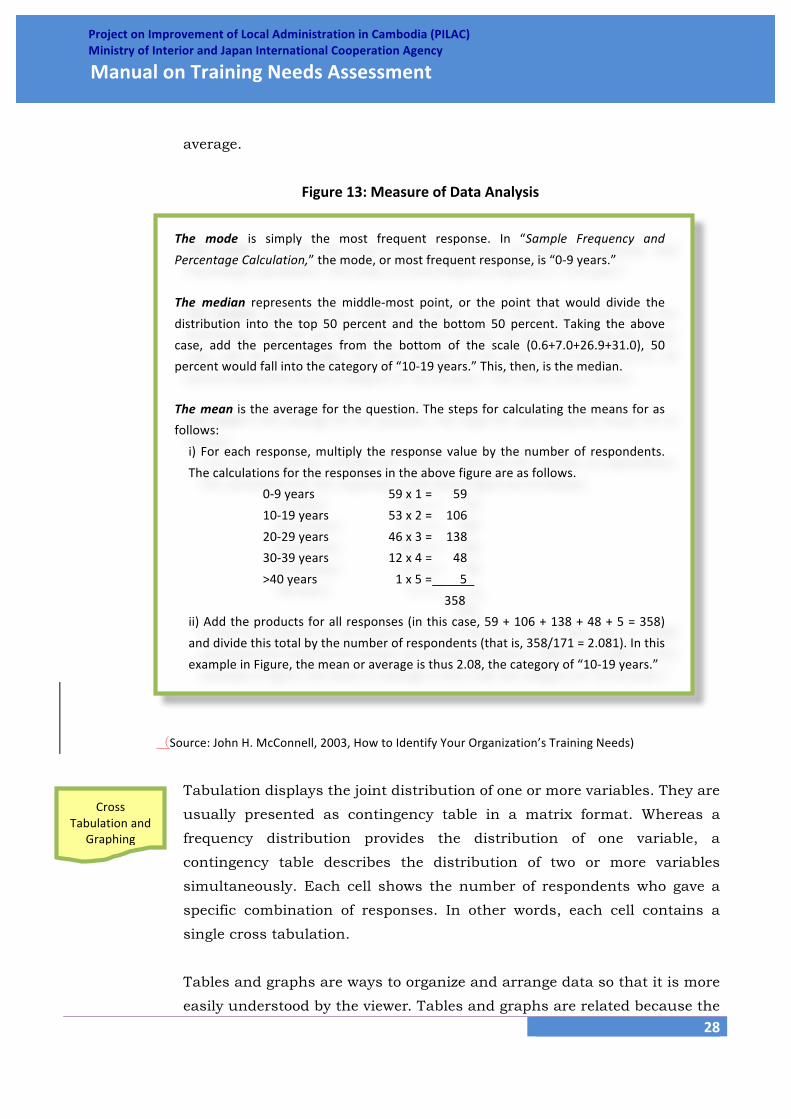
average.
Figure 13: Measure of Data Analysis
(Source: John H. McConnell, 2003, How to Identify Your Organization’s Training Needs)
Tabulation displays the joint distribution of one or more variables. They are
usually presented as contingency table in a matrix format. Whereas a
frequency distribution provides the distribution of one variable, a
contingency table describes the distribution of two or more variables
simultaneously. Each cell shows the number of respondents who gave a
specific combination of responses. In other words, each cell contains a
single cross tabulation.
Tables and graphs are ways to organize and arrange data so that it is more
easily understood by the viewer. Tables and graphs are related because the
The mode is simply the most frequent response. In “Sample Frequency and
Percentage Calculation,” the mode, or most frequent response, is “0-‐9 years.”
The median represents the middle-‐most point, or the point that would divide the
distribution into the top 50 percent and the bottom 50 percent. Taking the above
case, add the percentages from the bottom of the scale (0.6+7.0+26.9+31.0), 50
percent would fall into the category of “10-‐19 years.” This, then, is the median.
The mean is the average for the question. The steps for calculating the means for as
follows:
i) For each response, multiply the response value by the number of respondents.
The calculations for the responses in the above figure are as follows.
0-‐9 years 59 x 1 = 59
10-‐19 years 53 x 2 = 106
20-‐29 years 46 x 3 = 138
30-‐39 years 12 x 4 = 48
>40 years 1 x 5 = 5
358
ii) Add the products for all responses (in this case, 59 + 106 + 138 + 48 + 5 = 358)
and divide this total by the number of respondents (that is, 358/171 = 2.081). In this
example in Figure, the mean or average is thus 2.08, the category of “10-‐19 years.”
Cross Tabulation and
Graphing
al Department of Local A
29
Project on Improvement of Local Administration in Cambodia (PILAC) Ministry of Interior and Japan International Cooperation Agency
Manual on Training Needs Assessment
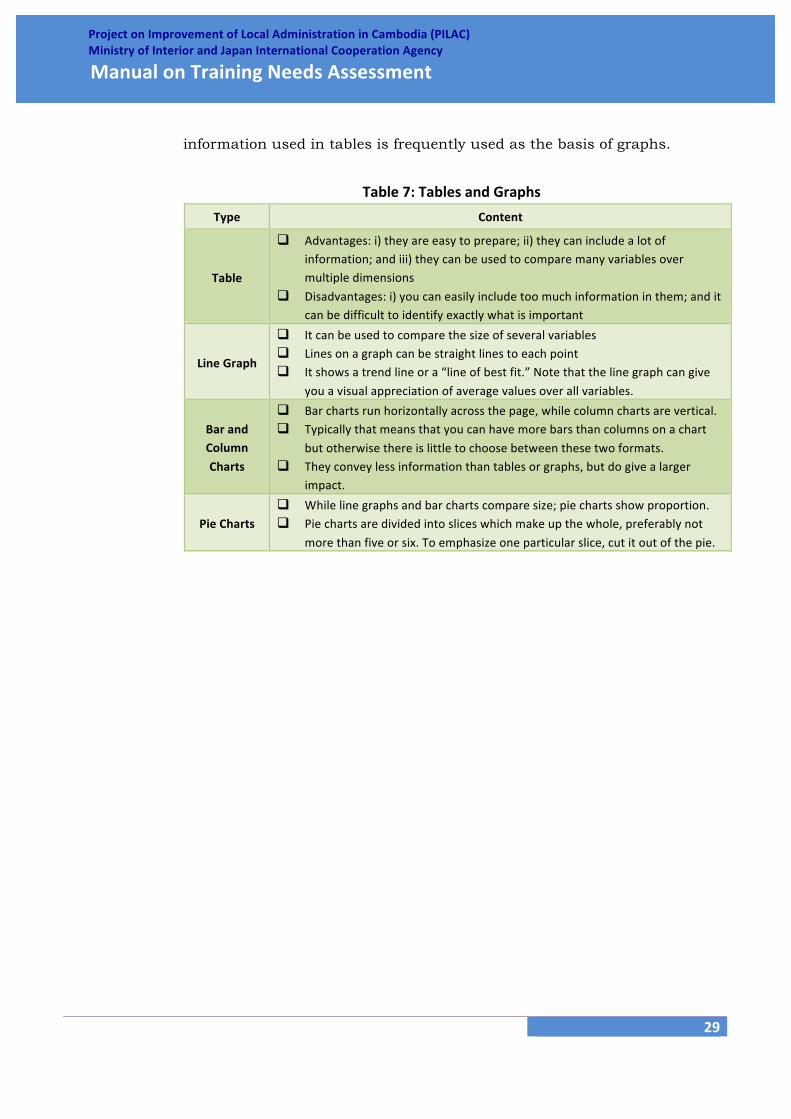
information used in tables is frequently used as the basis of graphs.
Table 7: Tables and Graphs
Type Content
Table
Advantages: i) they are easy to prepare; ii) they can include a lot of information; and iii) they can be used to compare many variables over multiple dimensions
Disadvantages: i) you can easily include too much information in them; and it can be difficult to identify exactly what is important
Line Graph
It can be used to compare the size of several variables Lines on a graph can be straight lines to each point It shows a trend line or a “line of best fit.” Note that the line graph can give
you a visual appreciation of average values over all variables.
Bar and Column
Charts
Bar charts run horizontally across the page, while column charts are vertical. Typically that means that you can have more bars than columns on a chart
but otherwise there is little to choose between these two formats. They convey less information than tables or graphs, but do give a larger
impact.
Pie Charts While line graphs and bar charts compare size; pie charts show proportion. Pie charts are divided into slices which make up the whole, preferably not
more than five or six. To emphasize one particular slice, cut it out of the pie.
al Department of Local A
30
Project on Improvement of Local Administration in Cambodia (PILAC) Ministry of Interior and Japan International Cooperation Agency
Manual on Training Needs Assessment
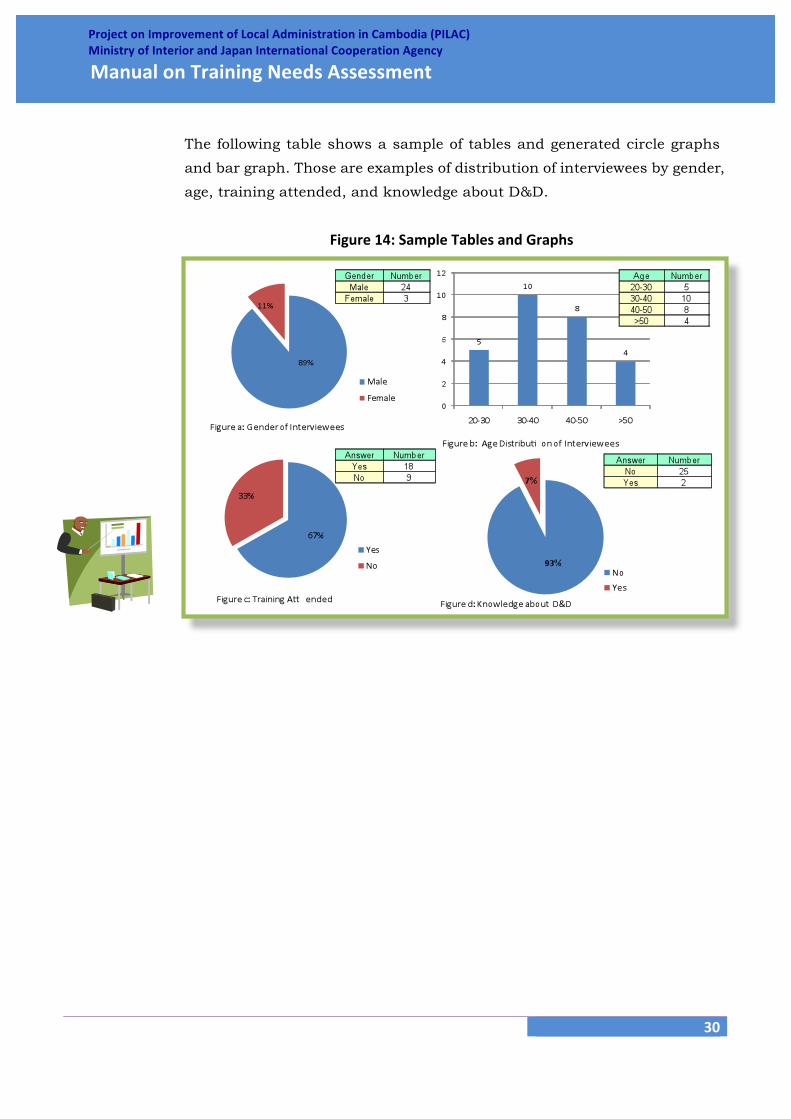
The following table shows a sample of tables and generated circle graphs
and bar graph. Those are examples of distribution of interviewees by gender,
age, training attended, and knowledge about D&D.
Figure 14: Sample Tables and Graphs

al Department of Local A
31
Project on Improvement of Local Administration in Cambodia (PILAC) Ministry of Interior and Japan International Cooperation Agency
Manual on Training Needs Assessment
In PILAC, the quantitative analysis was done as follows.
Figure 15: Steps to Be Taken for Quantitative Analysis
Graphs created are shown in the figure below.
Figure 16: Sample Graphs
PILAC
Figure c: Training Attended Figure d: Means to Gain Knowledge on D&D
Figure a: Academic Degree
dministration Figure b: Major at School
al Department of Local A
32
Project on Improvement of Local Administration in Cambodia (PILAC) Ministry of Interior and Japan International Cooperation Agency
Manual on Training Needs Assessment
Qualitative modes of data analysis provide ways of discerning, examining,
comparing and contrasting, and interpreting meaningful patterns or themes.
Qualitative data analysis is the range of processes and procedures whereby
we move from the qualitative data that have been collected into some form of
explanation, understanding or interpretation of the people and situations
we are investigating. Qualitative data analysis is usually based on an
interpretative philosophy. The idea is to examine the meaningful and
symbolic content of qualitative data.
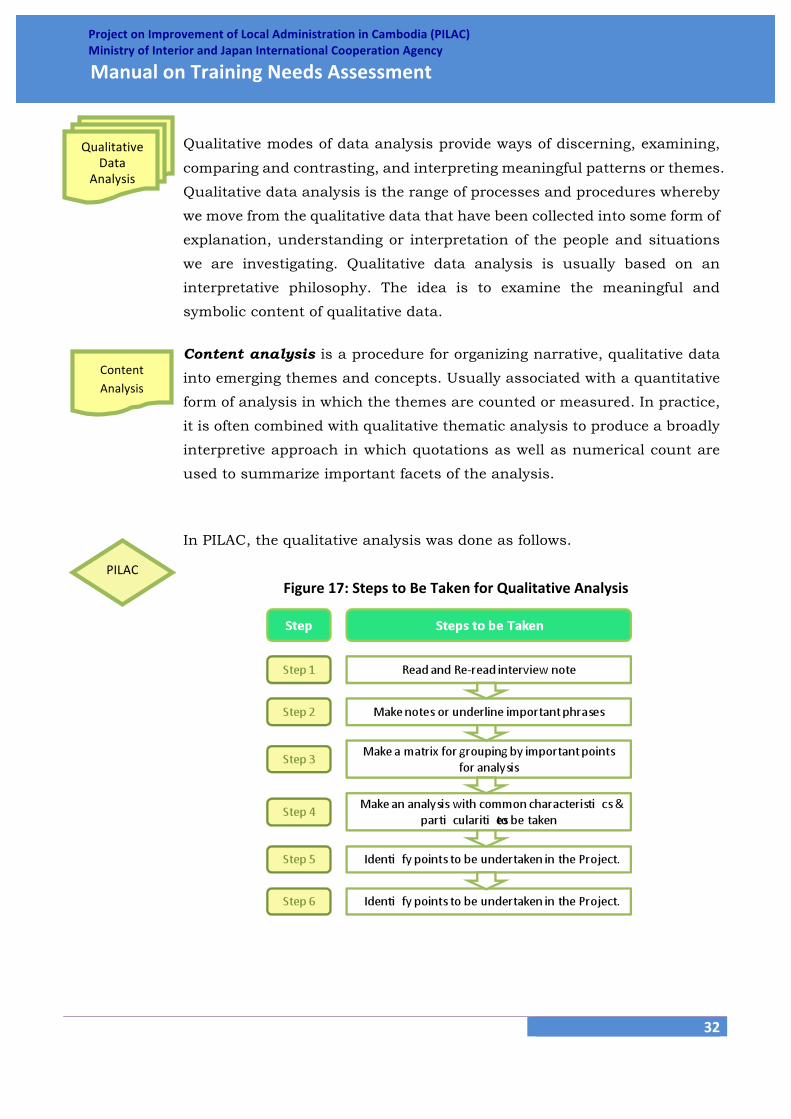
Content analysis is a procedure for organizing narrative, qualitative data
into emerging themes and concepts. Usually associated with a quantitative
form of analysis in which the themes are counted or measured. In practice,
it is often combined with qualitative thematic analysis to produce a broadly
interpretive approach in which quotations as well as numerical count are
used to summarize important facets of the analysis.
In PILAC, the qualitative analysis was done as follows.
Figure 17: Steps to Be Taken for Qualitative Analysis
PILAC
Content Analysis
Qualitative Data
Analysis
al Department of Local A
33
Project on Improvement of Local Administration in Cambodia (PILAC) Ministry of Interior and Japan International Cooperation Agency
Manual on Training Needs Assessment
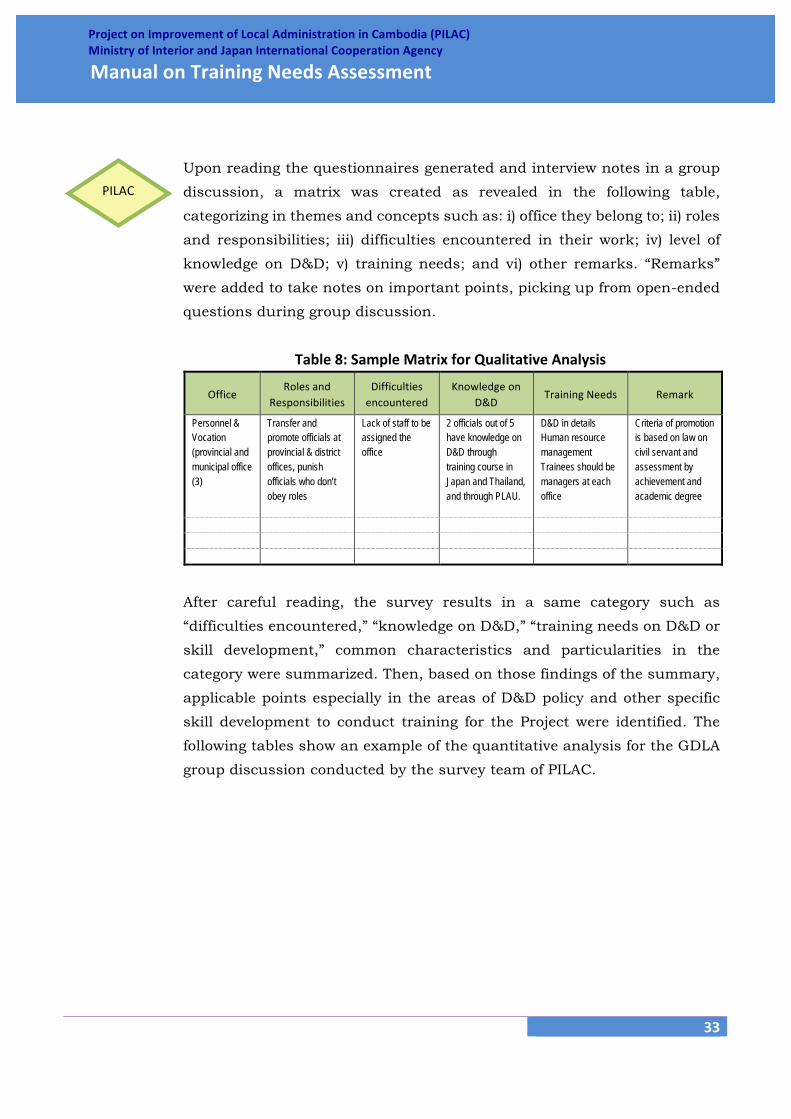
Upon reading the questionnaires generated and interview notes in a group
discussion, a matrix was created as revealed in the following table,
categorizing in themes and concepts such as: i) office they belong to; ii) roles
and responsibilities; iii) difficulties encountered in their work; iv) level of
knowledge on D&D; v) training needs; and vi) other remarks. “Remarks”
were added to take notes on important points, picking up from open-ended
questions during group discussion.
Table 8: Sample Matrix for Qualitative Analysis
Office Roles and
Responsibilities Difficulties encountered
Knowledge on D&D
Training Needs Remark
Personnel & Vocation (provincial and municipal office (3)
Transfer and promote officials at provincial & district offices, punish officials who don’t obey roles
Lack of staff to be assigned the office
2 officials out of 5 have knowledge on D&D through training course in Japan and Thailand, and through PLAU.
D&D in details Human resource management Trainees should be managers at each office
Criteria of promotion is based on law on civil servant and assessment by achievement and academic degree
After careful reading, the survey results in a same category such as
“difficulties encountered,” “knowledge on D&D,” “training needs on D&D or
skill development,” common characteristics and particularities in the
category were summarized. Then, based on those findings of the summary,
applicable points especially in the areas of D&D policy and other specific
skill development to conduct training for the Project were identified. The
following tables show an example of the quantitative analysis for the GDLA
group discussion conducted by the survey team of PILAC.
PILAC

al Department of Local A
34
Project on Improvement of Local Administration in Cambodia (PILAC) Ministry of Interior and Japan International Cooperation Agency
Manual on Training Needs Assessment
Figure 18: Sample Difficulties Encountered in GDLA
Figure 19: Sample Training Needs in GDLA
PILAC
al Department of Local A
35
Project on Improvement of Local Administration in Cambodia (PILAC) Ministry of Interior and Japan International Cooperation Agency
Manual on Training Needs Assessment
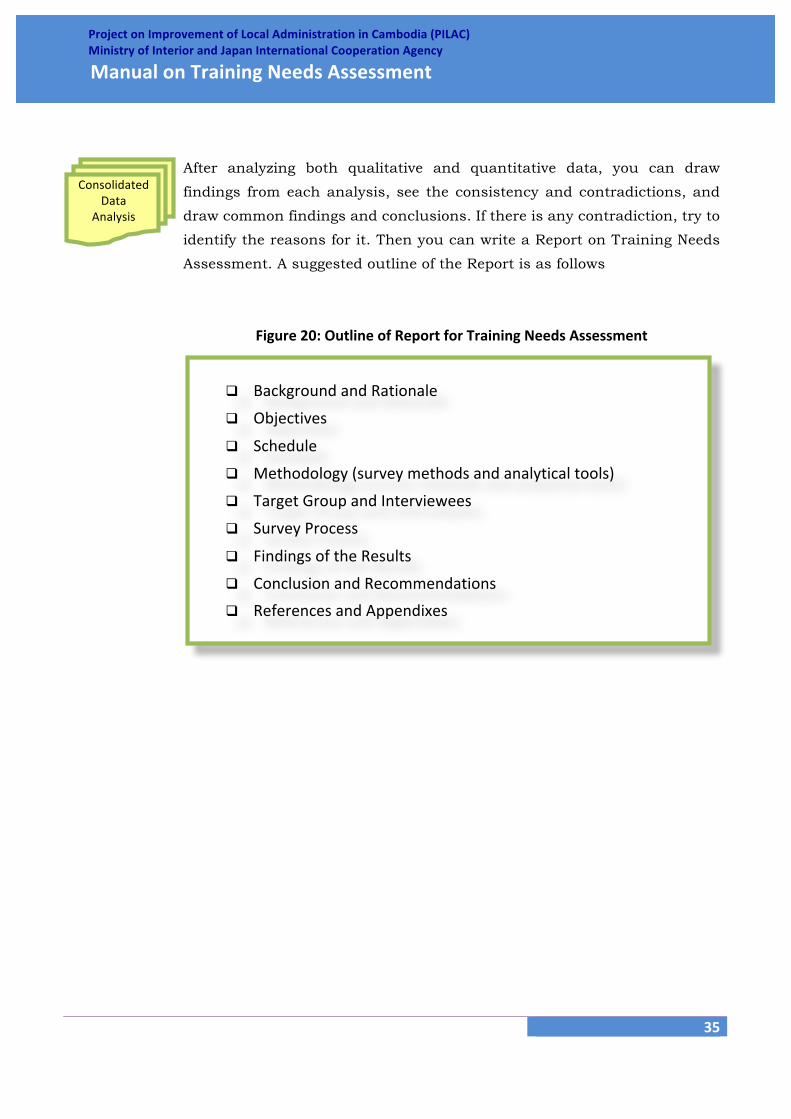
After analyzing both qualitative and quantitative data, you can draw
findings from each analysis, see the consistency and contradictions, and
draw common findings and conclusions. If there is any contradiction, try to
identify the reasons for it. Then you can write a Report on Training Needs
Assessment. A suggested outline of the Report is as follows
Figure 20: Outline of Report for Training Needs Assessment
Background and Rationale
Objectives
Schedule
Methodology (survey methods and analytical tools)
Target Group and Interviewees
Survey Process
Findings of the Results
Conclusion and Recommendations
References and Appendixes
Consolidated Data
Analysis
al Department of Local A
36
Project on Improvement of Local Administration in Cambodia (PILAC) Ministry of Interior and Japan International Cooperation Agency
Manual on Training Needs Assessment
Step 5: Provide Feedback
The fifth and final step of TNA is to provide the GDLA Task Force members
and concerned officials with feedback on the survey results, then to receive
the members’ comments to reflect on the report.
In the group discussion among the GDLA Task Force members, it is
important to clarify the following points.
Are there any other important findings?
What are other suggestions to improve the methodology for the next
TNA?
Is there any recommendation for the training course in such aspects as
participants, methods, module and curriculum, and schedule?
After finalizing the report, the GDLA Task Force members discuss and
determine the next steps for training preparation.
To be continued………………..
“Manual on Training Planning”
7
al Department of Local A
37
Project on Improvement of Local Administration in Cambodia (PILAC) Ministry of Interior and Japan International Cooperation Agency
Manual on Training Needs Assessment
References:
Barbazette, Jean. Training Needs Assessment: Methods, Tools, and Techniques. San
Francisco: Pfeiffer, 2006.
Frank, Darlene. Terrific Training Materials: High Impact Graphic Designs. N.p.: HRD Press,
1996.
Gupta, Kavita. A Practical Guide to Needs Assessment. San Francisco: Pfeiffer, 2007.
Hassell-‐Corbiell, Rives. Developing Training Courses: A Technical Writer’s Guide to
Instructional Design and Development. Tacoma, Washington: Learning Edge Publishing,
2001.
McConnell, John H. How to Identify Your Organization’s Training Needs. New York:
AMACOM, 2003.
Training Needs Assessment. Phnom Penh: MOI/DOLA, 2004.
al Department of Local A
38
Project on Improvement of Local Administration in Cambodia (PILAC) Ministry of Interior and Japan International Cooperation Agency
Manual on Training Needs Assessment
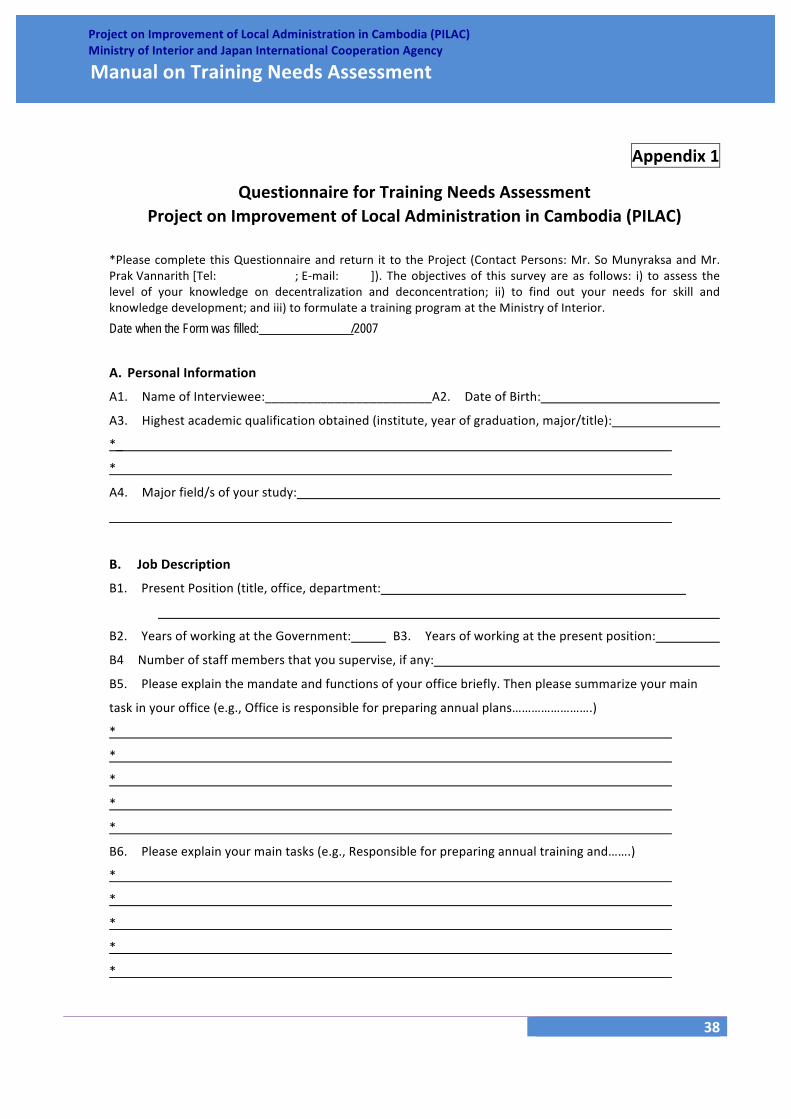
Appendix 1
Questionnaire for Training Needs Assessment Project on Improvement of Local Administration in Cambodia (PILAC)
*Please complete this Questionnaire and return it to the Project (Contact Persons: Mr. So Munyraksa and Mr. Prak Vannarith [Tel: ; E-‐mail: ]). The objectives of this survey are as follows: i) to assess the level of your knowledge on decentralization and deconcentration; ii) to find out your needs for skill and knowledge development; and iii) to formulate a training program at the Ministry of Interior.
Date when the Form was filled: /2007
A. Personal Information
A1. Name of Interviewee:________________________A2. Date of Birth:
A3. Highest academic qualification obtained (institute, year of graduation, major/title):
*_
*
A4. Major field/s of your study:
B. Job Description
B1. Present Position (title, office, department:
B2. Years of working at the Government: B3. Years of working at the present position:
B4 Number of staff members that you supervise, if any:
B5. Please explain the mandate and functions of your office briefly. Then please summarize your main
task in your office (e.g., Office is responsible for preparing annual plans…………………….)
*
*
*
*
*
B6. Please explain your main tasks (e.g., Responsible for preparing annual training and…….)
*
*
*
*
*
al Department of Local A
39
Project on Improvement of Local Administration in Cambodia (PILAC) Ministry of Interior and Japan International Cooperation Agency
Manual on Training Needs Assessment
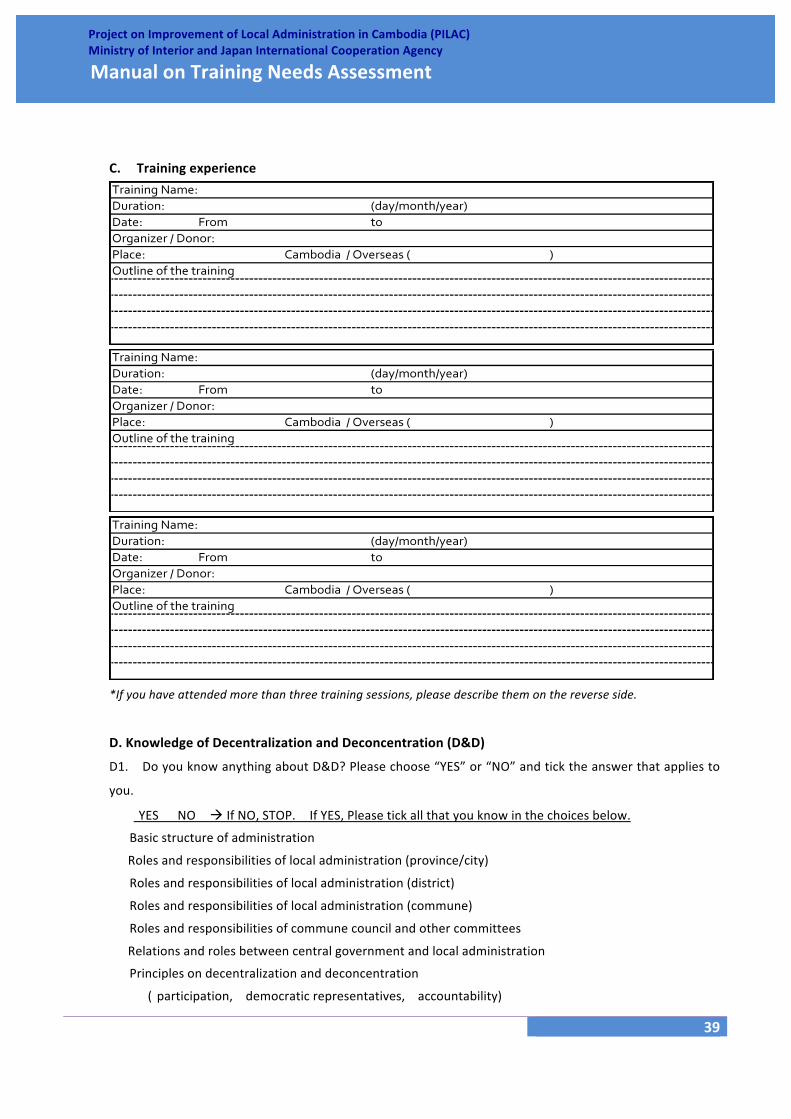
C. Training experience
*If you have attended more than three training sessions, please describe them on the reverse side.
D. Knowledge of Decentralization and Deconcentration (D&D)
D1. Do you know anything about D&D? Please choose “YES” or “NO” and tick the answer that applies to
you.
�YES �NO If NO, STOP. If YES, Please tick all that you know in the choices below.
� Basic structure of administration
� Roles and responsibilities of local administration (province/city)
� Roles and responsibilities of local administration (district)
� Roles and responsibilities of local administration (commune)
� Roles and responsibilities of commune council and other committees
� Relations and roles between central government and local administration
� Principles on decentralization and deconcentration (�participation, � democratic representatives, � accountability)
al Department of Local A
40
Project on Improvement of Local Administration in Cambodia (PILAC) Ministry of Interior and Japan International Cooperation Agency
Manual on Training Needs Assessment
� Public financial system (source of income and budgeting at central and local)
� Taxation System (tax collection at central and local)
� Please explain any other aspect of D&D that you know.
D3. How did you learn what you know about D&D as you indicate above? (e.g., training, seminar, your
own study, briefing or orientation from your office)
D4. Do you know anything about the following PRAKAS and Decree?
�YES �NO If NO, STOP. If YES, please tick all that you know in the choices below.
� Declaration on Roles, Duties and Rights of a Commune/Sangkat Clerk (2001)
� Delegation of Powers to Provincial/Municipal in support of Commune/Sangkat Councils (2002)
� Organization and Functioning of the Provincial/Municipal Local Administration Unit (2004)
� Roles Duties and Structures of the Department of Local Administration (2002)
� Sub-‐decree Commune/Sangkat Financial Management System by NCSC (2002)
� Others related to decentralization and deconcentration, if any
D5. How did you learn the above? (e.g., training, seminar, your own study, briefing or orientation
from your office)
al Department of Local A
41
Project on Improvement of Local Administration in Cambodia (PILAC) Ministry of Interior and Japan International Cooperation Agency
Manual on Training Needs Assessment
D6. Do know anything about the ORGANIC LAW? Please tick the below
�YES �NO If NO, STOP. If YES, please describe what you know and how you have learned it.
E. Needs for Training
E1. Which of the following do you want to learn? Please tick all that apply.
� Basic structure of administration
� Roles and responsibilities of local administration (province/city)
� Roles and responsibilities of local administration (district)
� Roles and responsibilities of local administration (commune)
� Roles and responsibilities of commune council and other committees
� Relations and roles between central government and local administration
� Principles on decentralization and deconcentration (�participation, � democratic representatives, � accountability)
� Public financial system (source of income and budgeting at central and local)
� Taxation System (tax collection at central and local)
� Perspective of the Organic Law � Others: please explain any other knowledge you want to acquire.
E2. Is there any work-‐related skill you want to enhance to perform better at work?
�YES �NO If NO, STOP, If YES, Please tick things you want to learn.
� Computer skills
� Office management (filing system, Information technology)
�Project Management
�Planning and Budgeting �Monitoring and Evaluation
�Human Resource Management

al Department of Local A
42
Project on Improvement of Local Administration in Cambodia (PILAC) Ministry of Interior and Japan International Cooperation Agency
Manual on Training Needs Assessment
� Please specify any other skills you want to acquire.
F. Other your comments and suggestion for the Project
Thank you very much for your cooperation. Your inputs will help the Project Team make the project more effective.
1. Project Objectives
The D&D reform in Cambodia is at the initial stage, and officials who implement the D&D reform need to improve their capacity. The current project will contribute to further advancement of the D&D reform through practical approaches to capacity building of those officials.
2. Overall Goal ・ Human resources involved in local administration will be developed through training
3. Project Purposes * Officials of General Department of Local Administration (GDLA) will improve the capacity of training management; and * Officials in charge of local administration at national and provincial levels will improve the knowledge of local administration.
4. Outputs ・ GDLA has ability to conduct training management based on the progress of D&D and needs ・ GDLA officials acquire the knowledge of D&D policy and local administration; ・ Provincial Governors and Vice Governors understand the D&D policy and the roles of local
administration; and ・ Officials of provincial offices understand the D&D policy and the roles of local administration.
5. Project Duration February 2007 -‐ January 2010 (3 years)

al Department of Local A
43
Project on Improvement of Local Administration in Cambodia (PILAC) Ministry of Interior and Japan International Cooperation Agency
Manual on Training Needs Assessment
Appendix 2
Guide Questions for Training Needs Assessment Project on Improvement of Local Administration in Cambodia (PILAC)
Interviewer:
Accompanied:
Date: / /2007 ( ) Time: -‐ , (Hours)
Place:
B. Interviewees (Name, Title, Office, Department)
Name Title, Office, Department
1
2
3
4
5
6
C. Introduction ・ Explain to interviewees the PILAC, objectives of the Survey, and the Survey Process.
・ For Province, inform them that they are selected as model sites.
C. Job Description
Please explain the mandate and function of your office briefly. Then please summarize your main
task in your office (e.g., Office is responsible for preparing of annual plans…………………….)
*
*
*
*
*

al Department of Local A
44
Project on Improvement of Local Administration in Cambodia (PILAC) Ministry of Interior and Japan International Cooperation Agency
Manual on Training Needs Assessment
D. Training
D1: Training experience
D2. How were the trainees selected?
D3. Are you applying in your work the knowledge and skills that you have acquired in training?
D4: Did you learn anything about D&D? If YES, what? Where?
D5: Did you learn anything about the Organic Law? If YES, what? Where?
D6: Which areas of D&D policy do you want to know more about (please provide examples in
questionnaires)?
D7. Are there any knowledge and skills you want to acquire to perform better in your work? If YES, what?
D8. Have you encountered any difficulties in your work? If YES, how have you solved them?
D9. Any comments and suggestions for our project?