projective testing of diurnal collective emotion · such test, often portrayed in popular culture,...
TRANSCRIPT
Projective Testing of Diurnal Collective Emotion Jorge Goncalves, Pratyush Pandab, Denzil Ferreira,
Mohammad Ghahramani, Guoying Zhao, Vassilis Kostakos Department of Computer Science and Engineering, University of Oulu
Erkki Koiso-Kanttilan katu 3, FI-90014 Oulu, Finland [email protected]
ABSTRACT Projective tests are personality tests that reveal individuals’ emotions (e.g., Rorschach inkblot test). Unlike direct question-based tests, projective tests rely on ambiguous stimuli to evoke responses from individuals. In this paper we develop one such test, designed to be delivered automatically, anonymously and to a large community through public displays. Our work makes a number of contributions. First, we develop and validate in controlled conditions a quantitative projective test that can reveal emotions. Second, we demonstrate that this test can be deployed on a large scale longitudinally: we present a four-week deployment in our university’s public spaces where 1431 tests were completed anonymously by passers-by. Third, our results reveal strong diurnal rhythms of emotion consistent with results we obtained independently using the Day Reconstruction Method (DRM), literature on affect, well-being, and our understanding of our university’s daily routine.
Author Keywords Emotion detection; projective tests; crowdsourcing; public displays; diurnal rhythms of emotion.
ACM Classification Keywords H.5.m. Information interfaces and presentation (e.g., HCI): Miscellaneous.
INTRODUCTION In this paper we describe a projective test to study a community’s diurnal emotion fluctuation. Specifically, we describe a test that involves tagging the emotion of walking silhouettes on public displays (Figure 1), and we show how the analysis of the collected tags reveals how the emotion of the community varies during the day.
Prior research has pointed out the potential benefits of understanding how the collective emotion in a community fluctuates [13]. Specifically, community emotion may
fluctuate in response to various environmental, mental, and physiological factors [38]. Understanding these may provide insights to improving happiness and well-being, for example by improving workplace and study environments, or lifestyle recommendations [12]. A traditional approach to studying emotion relies on disseminating questionnaires on a large scale, for example via online surveys. However, question-based approaches can suffer from an important limitation of stated bias and unreliability. Furthermore, individuals in a community are only likely to respond to a survey once, therefore making it hard to map a community’s emotion over time.
Due to these shortcomings, researchers have turned to indirect ways of inferring the emotional state of a community, for example by mining social network posts and conducting sentiment analysis. This approach has proved rather successful in detecting sentiment, and even in using such sentiment analysis to predict the stock market [4] or the success of films in the box office [34]. While this approach can indeed capture data on a global, national, or even city scale, it can be hard to geographically scope more precisely the analysis, for example to focus on a particular workplace. A large portion of social network data lacks geographic tags, and many times researchers attempt to infer location through the use of hash-tags (e.g. hashtag during a concert) or social affiliations [34].
For these reasons, we investigate public displays as an alternative – passive – approach to studying a community’s emotion over time while maintaining a rigorous geographic scope over the collected data. For our purposes, the use of public displays is methodologically appropriate: it reaches a large number of people in a particular geographic area, the context remains controlled, and the data collection mechanism is reliable [15,16]. In this paper we describe our projective testing to capture a community’s diurnal collective emotion and compare it to the results obtained
Permission to make digital or hard copies of all or part of this work for personal or classroom use is granted without fee provided that copies are not made or distributed for profit or commercial advantage and that copies bear this notice and the full citation on the first page. Copyrights for components of this work owned by others than the author(s) must be honored. Abstracting with credit is permitted. To copy otherwise, or republish, to post on servers or to redistribute to lists, requires prior specific permission and/or a fee. Request permissions from [email protected]. Ubicomp '14, September 13 - 17 2014, Seattle, WA, USA Copyright is held by the owner/author(s). Publication rights licensed to ACM. ACM 978-1-4503-2968-2/14/09…$15.00. http://dx.doi.org/10.1145/2632048.2636067
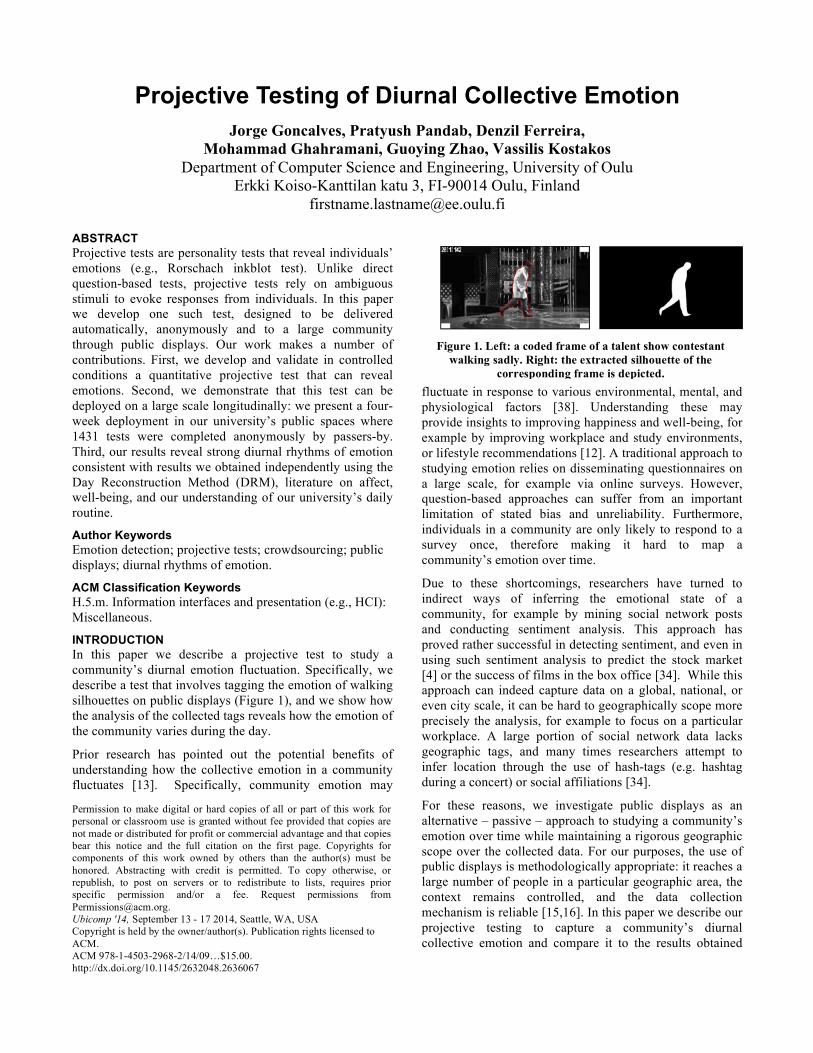
Figure 1. Left: a coded frame of a talent show contestant walking sadly. Right: the extracted silhouette of the
corresponding frame is depicted.
independently from the same community using the Day Reconstruction Method (DRM). Finally, we discuss its potential applications, benefits and drawbacks, and the use of public displays for studying communities.
RELATED WORK
Emotion in Every Day Life Making reliable judgements about other people’s feelings is a crucial skill in everyday life [31]. One of the most important emotional signalling channels is facial expression: humans are able to express at least six different emotional states – anger, happiness, sadness, fear, surprise and disgust [9,22]. It has been shown, for example, that smiles guide us in whom we choose to cooperate with [36], and emotion-recognition aptitude predicts the success in negotiation situations [10].
Human observers can also readily recognize emotions expressed in body movement [2]. This perceptual judgment is based on simple movement features, such as overall speed, but also on more intricate posture and dynamic cues [33]. For instance, emotions drastically affect an individual’s gait [13]. Intuitively, people can identify several emotions in gait information like sadness, anger, happiness and pride [30,33].
The community’s emotion is also an integral part of human rational behaviour and has been shown to influence people’s thinking [3]: negative emotions make people avoid the task that produces negative emotions and impairs the processing efficiency in a cognitive task. Similarly, Ashby et al. [1] report that positive affect is associated with flexibility in reasoning, greater creativity in problem solving and seeking out variety. Aula & Surakka [3] showed that synthetic positive feedback improved the speed with which people completed simple arithmetic tasks over either neutral or negative feedback.
Research has also shown that individual and collective emotion has diurnal rhythms. These rhythms have been linked to health outcomes such as high blood pressure [40] and suicides [38]. Researchers have used a number of methodologies to capture granular changes in emotion during the day and over time with relative success. Invasive physiological sensing has been used in controlled settings, for example to capture changes in emotion during gameplay [28]. A drawback of this approach is that it does not scale to large cohorts. Sentiment analysis has been used on public emails [32] and Twitter [14] to demonstrate both seasonal and diurnal rhythms of collective emotion. While this approach scales to large cohorts, it is challenging to scope it well: for instance it is hard to study a particular community in relation to a workplace or place of study.
Most similar to our own work is a study that used the Day Reconstruction Method (DRM) to investigate the diurnal rhythms of emotion [38], albeit potentially with recollection and response bias. Nonetheless, they report bimodal patterns with peaks at noon and evenings for positive
emotions, and peaks at mid-morning and mid-afternoon for negative emotions. These results are reflected in our own findings.
Reaching Out To Communities In our study we focus in reaching out to a relatively large number of participants directly, and not through proxy services such as Facebook or Twitter. While a lot of work has shown that posts in these services can reflect sentiment, they do not provide granularity in terms of the geographic scope and context of the community being studied.
One approach for reaching a community directly is through their mobile phones. Their portability and communication capability makes them attractive platforms for reaching out to a large number of users and collect a variety of information. However, using them for any type of pushed task requires individuals’ implicit deployment, configuration and use of the device [15]. For example, SMS participants need to explicitly sign up for the service (potentially at the cost of a text message exchange) and normally they cannot really control when they receive requests on their phones unless the system allows them to specify when they wish to not be disturbed [7].
An alternative approach that has recently been proposed is through the use of interactive public displays. This approach advocates the embedding of public interactive displays into a physical space and leveraging individuals’ serendipitous availability. Contrary to using mobile devices, public displays do not require any deployment effort from an individual to participate [15,16]. Recently, researchers have also explored the use of other situated technologies for the deployment of a situated crowdsourcing market [21].
Despite the various benefits of public displays, there are certain drawbacks. For instance, the maintenance of public displays is more challenging than an online server, and can incur higher initial costs. Another drawback is that the walk-up-and-use nature of public displays can result in limited usability and accessibility of tasks, with less rich interface controls than a standard desktop environment. This means that not all types of tasks can be completed on a public display, especially text entry tasks [17].
However, the key benefit of public displays is their strong geographic nature, which in our case translates to geographic scoping of the community we study. Using physical displays we can ensure that people in a particular community take part in our experiment, without initial effort on their part. For instance, Hernandez et al. [19] developed Mood Meter that encouraged, recognized and counted smiles within a community using public displays. At the same time, we can be more certain about the context within which the data is collected because the displays remain in the same place. This is in sharp contrast to the use of mobile phones or Twitter, which can be used anywhere and anytime. For these reasons, we decided to rely on public displays as the technology to study our community.
Projective Testing to Reveal Emotions Projective tests offer indirect personality assessment through their use of ambiguous stimuli. Projective tests have a number of advantages and disadvantages in relation to direct personality tests [11]. Their advantage is that they reduce one’s temptation to fake their response, they do not depend as much on individuals’ verbal skills, and they reveal both conscious and unconscious traits. A typical drawback of this method is that individuals are not aware of what they actually reveal about themselves, many (but not all) projective tests have no standardized criteria to which results may be compared, and therefore the statistical analysis of the results can be challenging.
A variety of projective tests has been proposed [8]. One such test, often portrayed in popular culture, is the Rorschach test, which asks individuals to describe what they see when shown irregular yet symmetrical inkblots. Other examples include the sentence completion test were individuals are given half-written sentences and must complete them in any way they want. The picture arrangement test requires individuals to arrange a set of given photographs in any way they see fit. Finally, word association tests require individuals to respond to a given word with another word that they feel is somehow relevant.
Deploying a projective test on our technology of choice – public interactive displays – can be challenging due to the limitations of the technology. For example, a series of previous studies has indicated that typing text on a public display can be problematic [17] and in unsupervised deployments this can lead to lack of seriousness and high appropriation [20]. Furthermore, prior work suggests that tasks completed on public displays should be quick because an increase in task duration leads to a sharp decrease in performance [15].
Taking into consideration these technological limitations of public displays, we argue that projective tests that require typing text, sentences, or words, would not be appropriate. Furthermore, a projective test that takes a substantial amount of time to complete would also be inappropriate given the affordances of the technology. Thus, our literature review suggests that we should use a projective test that is not completely open-ended, but rather allows individuals to choose one from a set of answers. This would enable a quick interaction and avoid the problems introduced by typing on a public display. Finally, due to the anonymous nature of the technology, we require a test with ground truth in order to reliably interpret the results.
For these reasons, we developed a projective test that strongly resembles the Rorschach test, but uses stimuli that are not as ambiguous as inkblots. Instead, we used stimuli that ultimately have a “correct” answer, but at the same time can be ambiguous enough to allow individuals to project positive and negative emotions. Based on the literature on emotion, we decided to use as stimuli the silhouette of a walking person. Humans have an innate
ability to understand emotions expressed through posture and gait [2], but this capability is greatly diminished as the quality of the video drops and details are replaced by a bland silhouette of a walking person.
Therefore, we hypothesized that the silhouette of a walking person would be an ambiguous yet rich stimulus to use in our study. However, we required a way to generate silhouettes in such a way so that we can know the “ground truth”: we needed silhouettes of happy and sad people. We describe how we obtained these next.
METHOD We collected emotional gait data from popular talent shows broadcast on Television. Typically in these shows contestants present their talent, audition or compete against each other for attractive prizes. The contestants are then given a positive or negative judgement, and then they walk off the stage. In our work we analysed video sequences that were recorded immediately after the judges’ results are announced and the winner/loser leaves the stage. We argue that during these moments the contestants are genuinely emotional, and so we believe that their gait during those moments reflects their emotional state.
Figure 1 shows an original frame from one of the TV shows, depicting a person walking sadly after receiving a negative judgement (Figure 1 left). From such footage we manually extracted, frame-by-frame, a moving silhouette as shown in Figure 1 right. Our footage and extracted silhouettes contain people in one of two emotional states: Happy or Sad. We further added to our database samples with no emotional state (Neutral) from publicly available databases for gait identification such as CASIA [43] and CMU [18]. In total we compiled a set 120 distinct silhouette videos where the ground truth of that person’s emotion was known to us (sad, neutral, happy).
The happy and sad footage we extracted comes from real-world settings where subjects express their emotions genuinely, and contain variations that do not occur in experimental settings. Prior research has attempted to establish similar footage databases, however these suffer from a number of limitations: they use sensors/markers which can be intrusive and affect movement; they rely on role-playing emotion expression which biases their reliability [42]; and lack viewpoint changes due to their strict experimental setup. In contrast to databases in the literature, the database we compiled includes genuinely emotional people in realistic settings. In the study we describe next we seek to validate whether the silhouettes in our database can be used in a projective test to reveal emotions.
STUDY 1: CONTROLLED VALIDATION OF THE PROJECTIVE TEST In this study we sought to validate our projective test. Our hypothesis is that experimental participants exposed to positive emotional priming are more likely to project

positive emotions when labelling video silhouettes of walking people. Conversely, we also expected that participants exposed to negative emotional priming would project negative emotions when viewing the video silhouettes.
Furthermore, it is not clear how ambiguous the videos would be in a real-world deployment, especially in a public setting using a public technology that is well known for its playful and non-serious use. Therefore, we were interested in analysing how many videos participants get right or wrong in a controlled and serious setting. To achieve the desired emotional priming we used a standardized procedure described next. At the same time we used the collected data to establish a baseline assessment of stimuli ambiguity.
International Affective Picture System (IAPS) A standardised mechanism to prime participants’ emotional state is the International Affective Picture System (IAPS) [26]. This is a database of images that have been validated for inducing different levels of affect. Each image has a standardised score between 1 (negative valence) and 9 (positive valence), with 5 indicating neither positive nor negative valence.
We selected positive valence images from the IAPS database to induce positive affect (i.e., happiness) and negative valence images to induce negative affect (i.e., sadness). We avoided using images of extreme positive or negative valence: they can be somewhat disturbing because they contain images of mutilation, injuries, people in distress, and erotic content. Furthermore, because the IAPS is separately scored for men and women we systematically selected images that had similar affective valence for both genders.
Finally, to verify the affect of each picture on participants we used a 9-point (same scale as IAPS) Self-Assessment Manikin (SAM) [5]. Thus, we created 4 sets of 24 images each: positive valence images for male and female participants, and negative valence images for male and female participants.
Participants and Procedure We recruited 24 participants for this study (12 male, 12 female). The participants’ average age was 29.08 years old (SD=5.92, min=20, max=40). We adopted a between-subjects design to avoid learning effects. 12 participants (6 male, 6 female) were only shown negative valence images (one image set for males, another for females), while the remaining 12 participants (6 male, 6 female) were only shown positive valence images (one image set for males, another for females). We expected these pictures to emotionally prime participants in a negative or positive manner.
Each participant was welcomed to our usability lab and was informed that the experiment’s goal was to study how people respond to pictures that represent various events that
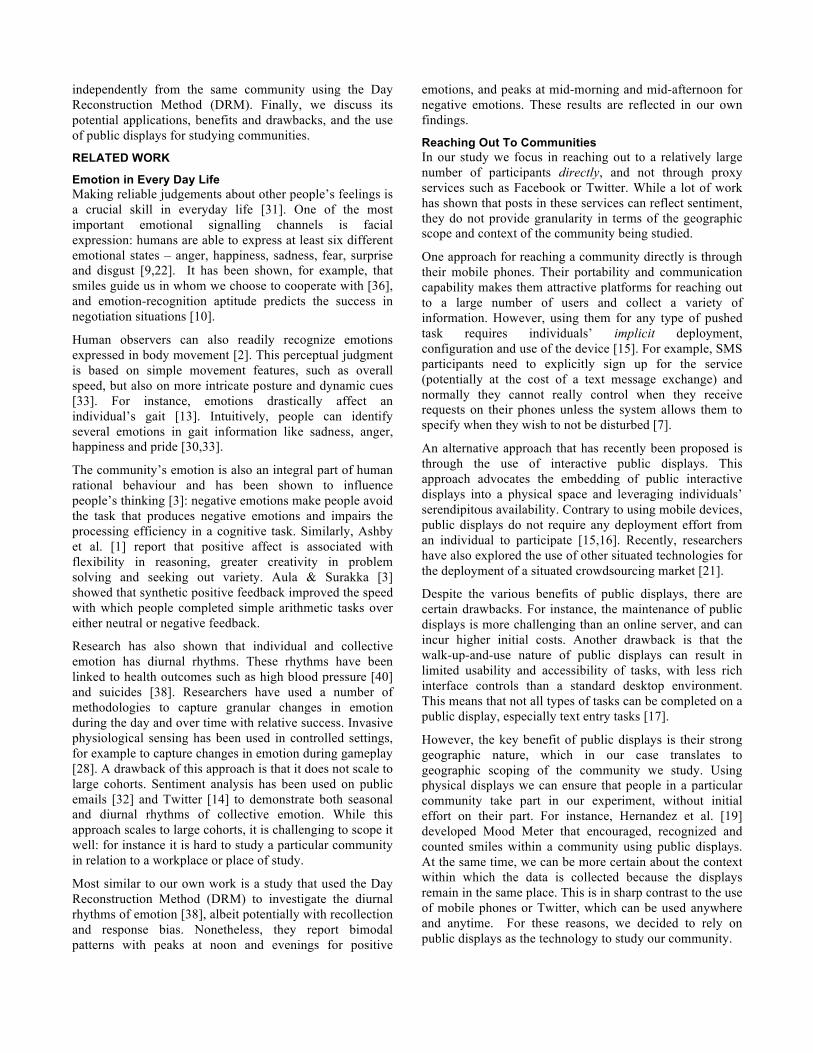
occur in real life, and to identify emotion in people’s walking pattern. They were also briefed on the use of the SAM scale as described in [26] and given a chance to rate some trial images. After the briefing and training, participants sat in front of a laptop to view the 24 IAPS images at their own pace. They were asked to rate each image using the SAM scale as they went along. After reviewing all 24 images, they proceeded to view and rate the silhouettes. This took place on a large 46” Full-HD display with a touch overlay (Figure 2 top), which is the same hardware we eventually used in our main deployment.
Figure 2. Top: a participant conducting the video rating in Study 1. Bottom: screenshot of the used rating interface.
We used a random sample of our silhouette videos (N=30), which included 10 videos per category (sad, neutral, happy). Participants were shown an initial screen that provided instructions on how to label each video. Then, they were presented with the silhouette videos in a randomized order. For each video they were asked to label the person’s gait as sad, neutral or happy (Figure 2 bottom). Upon rating all videos they were shown a thank-you screen, and the researcher thanked them and ended the session.
Results
Projective Test Validation There were two priming conditions: negative priming and positive priming. For each of the 24 participants we collected 24 photograph ratings on a 9-point SAM scale (288 in each condition, 576 in total), and 30 video ratings on the scale sad-neutral-happy (360 in each condition, 720 in total). A Mann-Whitney U test showed that participants in the positive priming condition gave significantly higher
SAM ratings (M = 7.01, SD = 1.71) than those in the negative priming condition (M = 3.02, SD = 1.48), U = 4238, p < 0.001. This confirms that the IAPS photographs had the expected priming effect.
To subsequently analyse the ratings of the silhouette videos, we considered whether each rating was correct, wrong in a positive direction, or wrong in a negative direction, as shown in Table 1.
Participants’ rating
Ground Truth
Sad Neutral Happy
Sad Correct Negative error
Negative error
Neutral Positive error Correct Negative
error
Happy Positive error
Positive error Correct
Table 1. Classification of participants video ratings based on the ground truth.
Participants in the negative priming condition answered 194 videos correctly (54%) while those in the positive priming condition answered 209 videos correctly (58%). An independent-samples t-test showed that negatively primed participants had significantly more negative errors (M=9.58, SD=3.68) than positively primed participants (M=4.33, SD=2.71), (t(22)=3.88, p<0.001). Similarly, an independent-samples t-test showed that positively primed participants had significantly more positive errors (M=7.92, SD=1.73) than negatively primed participants (M=3.92, SD=3.34), (t(22)=3.68, p=0.001). Figure 3 shows the proportion of correct ratings as well as negative and positive errors in both conditions.
Figure 3. Breakdown of how participants in each condition,
rated the silhouette videos. Ground truth is on the x-axis, and rating correctness is indicated by colour.
Baseline Assessment of Stimuli Ambiguity The data showed that the respondents’ accuracy was 56%. We note that if participants answered completely randomly they would be expected to get 33% correct. Further analysis (Figure 4) indicates that respondents were slightly more accurate in identifying neutral silhouette videos, and the sad/happy videos both had around 50% correctness. These
results act as a baseline for our main deployment in Study 2: we would expect that if they substantially differ in Study 2, then the technology is adversely affecting our findings due to extensive non-serious use.
Figure 4. Overall breakdown of the video rating responses by
ground truth (x-axis) and actual vote (colour) in Study 1.
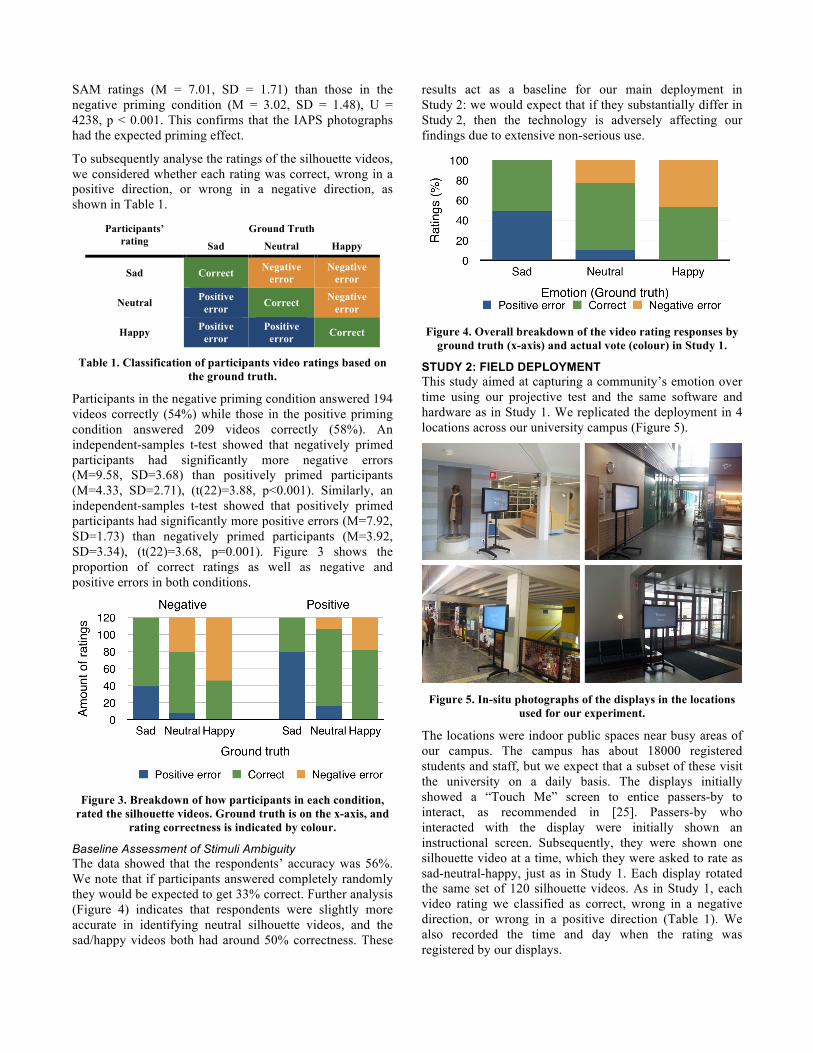
STUDY 2: FIELD DEPLOYMENT This study aimed at capturing a community’s emotion over time using our projective test and the same software and hardware as in Study 1. We replicated the deployment in 4 locations across our university campus (Figure 5).
Figure 5. In-situ photographs of the displays in the locations
used for our experiment.
The locations were indoor public spaces near busy areas of our campus. The campus has about 18000 registered students and staff, but we expect that a subset of these visit the university on a daily basis. The displays initially showed a “Touch Me” screen to entice passers-by to interact, as recommended in [25]. Passers-by who interacted with the display were initially shown an instructional screen. Subsequently, they were shown one silhouette video at a time, which they were asked to rate as sad-neutral-happy, just as in Study 1. Each display rotated the same set of 120 silhouette videos. As in Study 1, each video rating we classified as correct, wrong in a negative direction, or wrong in a positive direction (Table 1). We also recorded the time and day when the rating was registered by our displays.
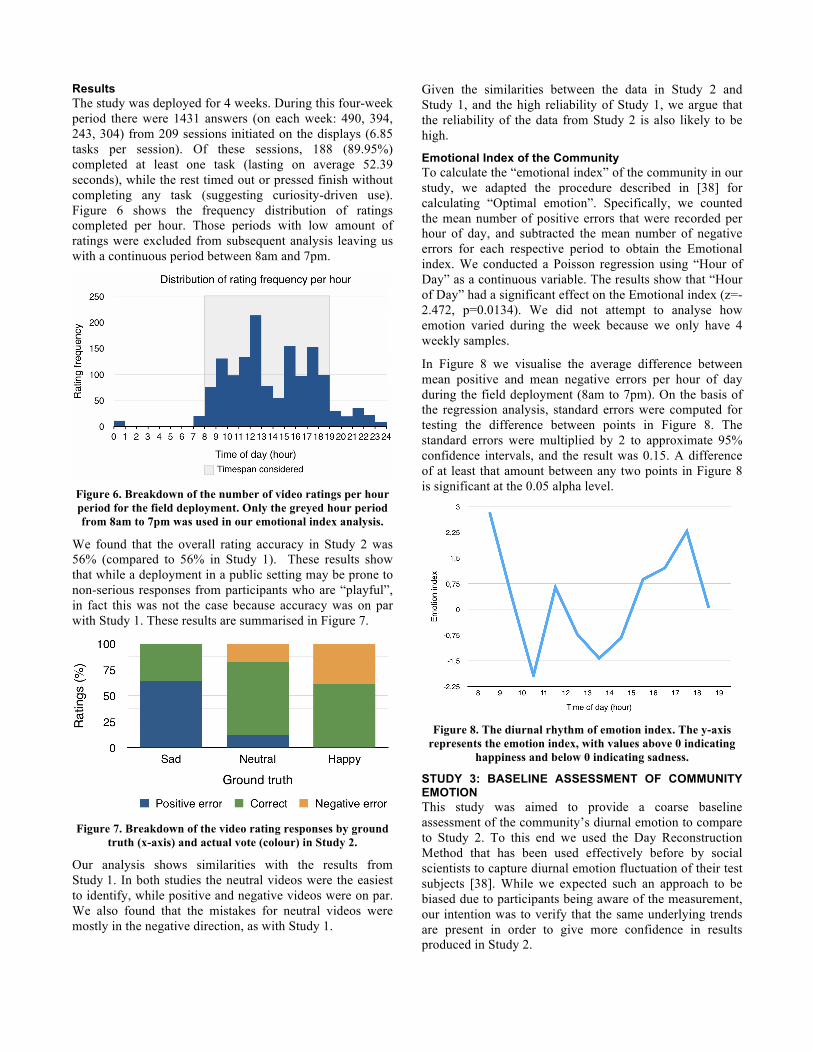
Results The study was deployed for 4 weeks. During this four-week period there were 1431 answers (on each week: 490, 394, 243, 304) from 209 sessions initiated on the displays (6.85 tasks per session). Of these sessions, 188 (89.95%) completed at least one task (lasting on average 52.39 seconds), while the rest timed out or pressed finish without completing any task (suggesting curiosity-driven use). Figure 6 shows the frequency distribution of ratings completed per hour. Those periods with low amount of ratings were excluded from subsequent analysis leaving us with a continuous period between 8am and 7pm.
Figure 6. Breakdown of the number of video ratings per hour period for the field deployment. Only the greyed hour period from 8am to 7pm was used in our emotional index analysis.
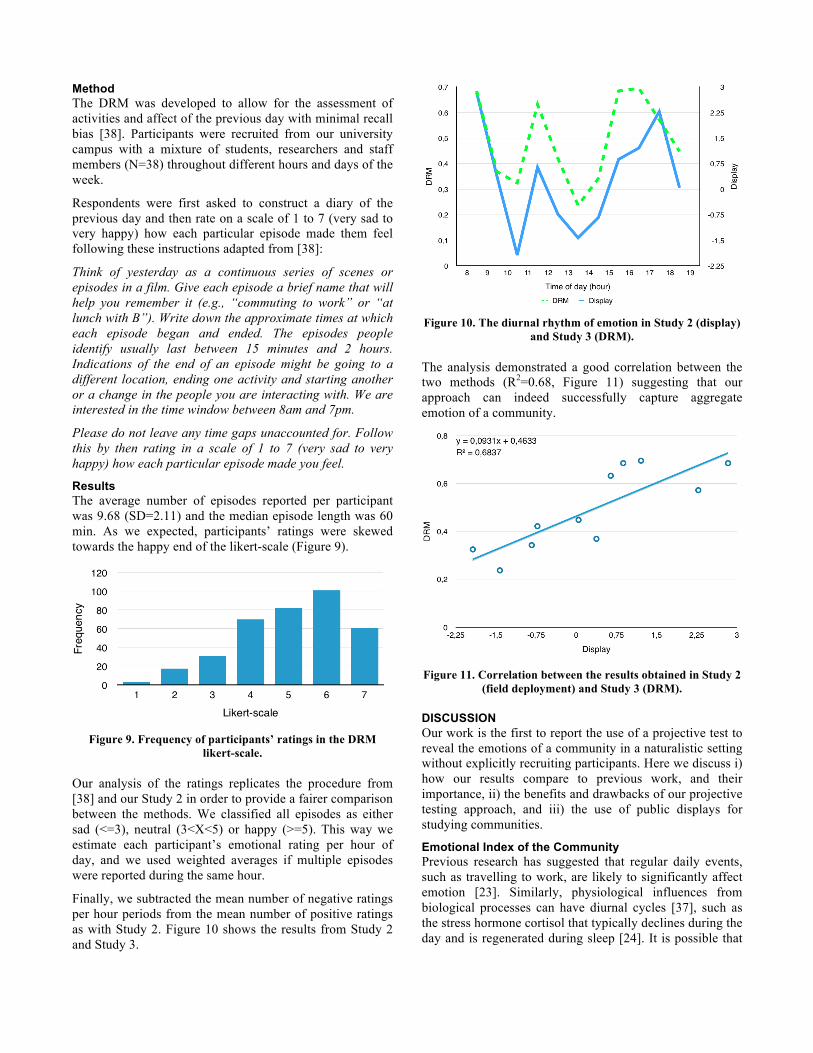
We found that the overall rating accuracy in Study 2 was 56% (compared to 56% in Study 1). These results show that while a deployment in a public setting may be prone to non-serious responses from participants who are “playful”, in fact this was not the case because accuracy was on par with Study 1. These results are summarised in Figure 7.
Figure 7. Breakdown of the video rating responses by ground
truth (x-axis) and actual vote (colour) in Study 2.
Our analysis shows similarities with the results from Study 1. In both studies the neutral videos were the easiest to identify, while positive and negative videos were on par. We also found that the mistakes for neutral videos were mostly in the negative direction, as with Study 1.
Given the similarities between the data in Study 2 and Study 1, and the high reliability of Study 1, we argue that the reliability of the data from Study 2 is also likely to be high.
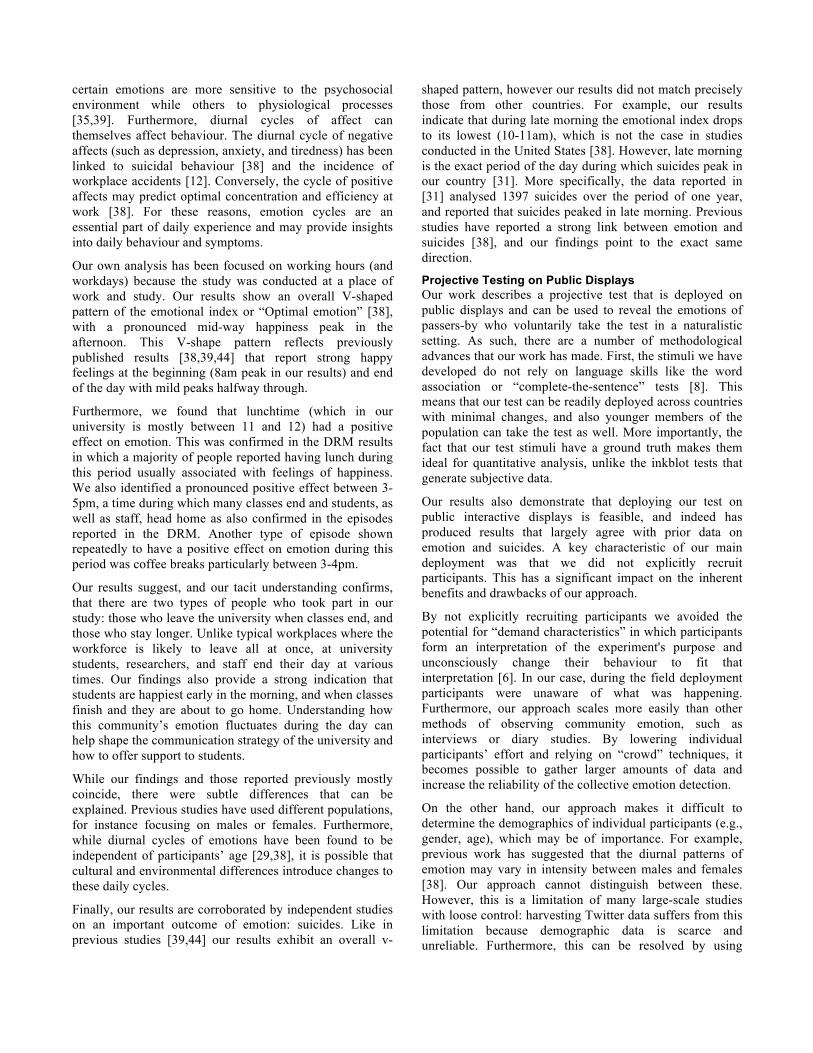
Emotional Index of the Community To calculate the “emotional index” of the community in our study, we adapted the procedure described in [38] for calculating “Optimal emotion”. Specifically, we counted the mean number of positive errors that were recorded per hour of day, and subtracted the mean number of negative errors for each respective period to obtain the Emotional index. We conducted a Poisson regression using “Hour of Day” as a continuous variable. The results show that “Hour of Day” had a significant effect on the Emotional index (z=-2.472, p=0.0134). We did not attempt to analyse how emotion varied during the week because we only have 4 weekly samples.
In Figure 8 we visualise the average difference between mean positive and mean negative errors per hour of day during the field deployment (8am to 7pm). On the basis of the regression analysis, standard errors were computed for testing the difference between points in Figure 8. The standard errors were multiplied by 2 to approximate 95% confidence intervals, and the result was 0.15. A difference of at least that amount between any two points in Figure 8 is significant at the 0.05 alpha level.
Figure 8. The diurnal rhythm of emotion index. The y-axis
represents the emotion index, with values above 0 indicating happiness and below 0 indicating sadness.
STUDY 3: BASELINE ASSESSMENT OF COMMUNITY EMOTION This study was aimed to provide a coarse baseline assessment of the community’s diurnal emotion to compare to Study 2. To this end we used the Day Reconstruction Method that has been used effectively before by social scientists to capture diurnal emotion fluctuation of their test subjects [38]. While we expected such an approach to be biased due to participants being aware of the measurement, our intention was to verify that the same underlying trends are present in order to give more confidence in results produced in Study 2.
Method The DRM was developed to allow for the assessment of activities and affect of the previous day with minimal recall bias [38]. Participants were recruited from our university campus with a mixture of students, researchers and staff members (N=38) throughout different hours and days of the week.
Respondents were first asked to construct a diary of the previous day and then rate on a scale of 1 to 7 (very sad to very happy) how each particular episode made them feel following these instructions adapted from [38]:
Think of yesterday as a continuous series of scenes or episodes in a film. Give each episode a brief name that will help you remember it (e.g., “commuting to work” or “at lunch with B”). Write down the approximate times at which each episode began and ended. The episodes people identify usually last between 15 minutes and 2 hours. Indications of the end of an episode might be going to a different location, ending one activity and starting another or a change in the people you are interacting with. We are interested in the time window between 8am and 7pm.
Please do not leave any time gaps unaccounted for. Follow this by then rating in a scale of 1 to 7 (very sad to very happy) how each particular episode made you feel.
Results The average number of episodes reported per participant was 9.68 (SD=2.11) and the median episode length was 60 min. As we expected, participants’ ratings were skewed towards the happy end of the likert-scale (Figure 9).
Figure 9. Frequency of participants’ ratings in the DRM
likert-scale.
Our analysis of the ratings replicates the procedure from [38] and our Study 2 in order to provide a fairer comparison between the methods. We classified all episodes as either sad (<=3), neutral (3<X<5) or happy (>=5). This way we estimate each participant’s emotional rating per hour of day, and we used weighted averages if multiple episodes were reported during the same hour.
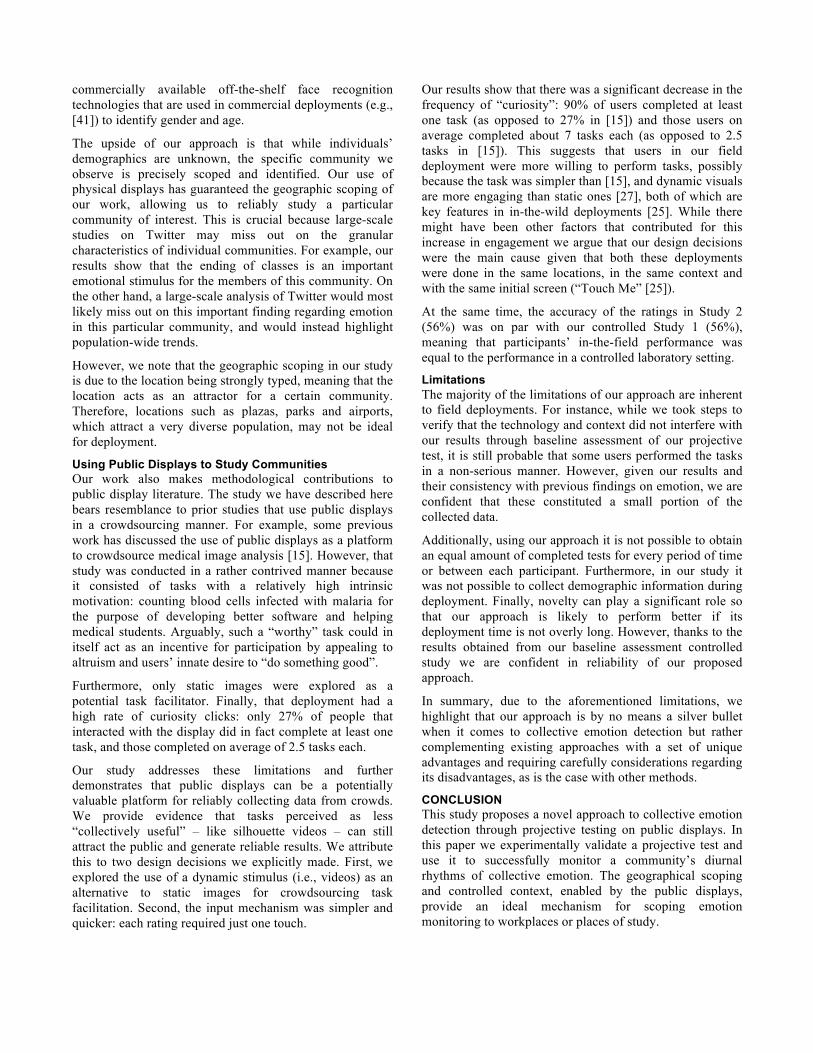
Finally, we subtracted the mean number of negative ratings per hour periods from the mean number of positive ratings as with Study 2. Figure 10 shows the results from Study 2 and Study 3.
Figure 10. The diurnal rhythm of emotion in Study 2 (display)
and Study 3 (DRM).
The analysis demonstrated a good correlation between the two methods (R2=0.68, Figure 11) suggesting that our approach can indeed successfully capture aggregate emotion of a community.
Figure 11. Correlation between the results obtained in Study 2
(field deployment) and Study 3 (DRM).
DISCUSSION Our work is the first to report the use of a projective test to reveal the emotions of a community in a naturalistic setting without explicitly recruiting participants. Here we discuss i) how our results compare to previous work, and their importance, ii) the benefits and drawbacks of our projective testing approach, and iii) the use of public displays for studying communities.
Emotional Index of the Community Previous research has suggested that regular daily events, such as travelling to work, are likely to significantly affect emotion [23]. Similarly, physiological influences from biological processes can have diurnal cycles [37], such as the stress hormone cortisol that typically declines during the day and is regenerated during sleep [24]. It is possible that
certain emotions are more sensitive to the psychosocial environment while others to physiological processes [35,39]. Furthermore, diurnal cycles of affect can themselves affect behaviour. The diurnal cycle of negative affects (such as depression, anxiety, and tiredness) has been linked to suicidal behaviour [38] and the incidence of workplace accidents [12]. Conversely, the cycle of positive affects may predict optimal concentration and efficiency at work [38]. For these reasons, emotion cycles are an essential part of daily experience and may provide insights into daily behaviour and symptoms.
Our own analysis has been focused on working hours (and workdays) because the study was conducted at a place of work and study. Our results show an overall V-shaped pattern of the emotional index or “Optimal emotion” [38], with a pronounced mid-way happiness peak in the afternoon. This V-shape pattern reflects previously published results [38,39,44] that report strong happy feelings at the beginning (8am peak in our results) and end of the day with mild peaks halfway through.
Furthermore, we found that lunchtime (which in our university is mostly between 11 and 12) had a positive effect on emotion. This was confirmed in the DRM results in which a majority of people reported having lunch during this period usually associated with feelings of happiness. We also identified a pronounced positive effect between 3-5pm, a time during which many classes end and students, as well as staff, head home as also confirmed in the episodes reported in the DRM. Another type of episode shown repeatedly to have a positive effect on emotion during this period was coffee breaks particularly between 3-4pm.
Our results suggest, and our tacit understanding confirms, that there are two types of people who took part in our study: those who leave the university when classes end, and those who stay longer. Unlike typical workplaces where the workforce is likely to leave all at once, at university students, researchers, and staff end their day at various times. Our findings also provide a strong indication that students are happiest early in the morning, and when classes finish and they are about to go home. Understanding how this community’s emotion fluctuates during the day can help shape the communication strategy of the university and how to offer support to students.
While our findings and those reported previously mostly coincide, there were subtle differences that can be explained. Previous studies have used different populations, for instance focusing on males or females. Furthermore, while diurnal cycles of emotions have been found to be independent of participants’ age [29,38], it is possible that cultural and environmental differences introduce changes to these daily cycles.
Finally, our results are corroborated by independent studies on an important outcome of emotion: suicides. Like in previous studies [39,44] our results exhibit an overall v-
shaped pattern, however our results did not match precisely those from other countries. For example, our results indicate that during late morning the emotional index drops to its lowest (10-11am), which is not the case in studies conducted in the United States [38]. However, late morning is the exact period of the day during which suicides peak in our country [31]. More specifically, the data reported in [31] analysed 1397 suicides over the period of one year, and reported that suicides peaked in late morning. Previous studies have reported a strong link between emotion and suicides [38], and our findings point to the exact same direction.
Projective Testing on Public Displays Our work describes a projective test that is deployed on public displays and can be used to reveal the emotions of passers-by who voluntarily take the test in a naturalistic setting. As such, there are a number of methodological advances that our work has made. First, the stimuli we have developed do not rely on language skills like the word association or “complete-the-sentence” tests [8]. This means that our test can be readily deployed across countries with minimal changes, and also younger members of the population can take the test as well. More importantly, the fact that our test stimuli have a ground truth makes them ideal for quantitative analysis, unlike the inkblot tests that generate subjective data.
Our results also demonstrate that deploying our test on public interactive displays is feasible, and indeed has produced results that largely agree with prior data on emotion and suicides. A key characteristic of our main deployment was that we did not explicitly recruit participants. This has a significant impact on the inherent benefits and drawbacks of our approach.
By not explicitly recruiting participants we avoided the potential for “demand characteristics” in which participants form an interpretation of the experiment's purpose and unconsciously change their behaviour to fit that interpretation [6]. In our case, during the field deployment participants were unaware of what was happening. Furthermore, our approach scales more easily than other methods of observing community emotion, such as interviews or diary studies. By lowering individual participants’ effort and relying on “crowd” techniques, it becomes possible to gather larger amounts of data and increase the reliability of the collective emotion detection.
On the other hand, our approach makes it difficult to determine the demographics of individual participants (e.g., gender, age), which may be of importance. For example, previous work has suggested that the diurnal patterns of emotion may vary in intensity between males and females [38]. Our approach cannot distinguish between these. However, this is a limitation of many large-scale studies with loose control: harvesting Twitter data suffers from this limitation because demographic data is scarce and unreliable. Furthermore, this can be resolved by using
commercially available off-the-shelf face recognition technologies that are used in commercial deployments (e.g., [41]) to identify gender and age.
The upside of our approach is that while individuals’ demographics are unknown, the specific community we observe is precisely scoped and identified. Our use of physical displays has guaranteed the geographic scoping of our work, allowing us to reliably study a particular community of interest. This is crucial because large-scale studies on Twitter may miss out on the granular characteristics of individual communities. For example, our results show that the ending of classes is an important emotional stimulus for the members of this community. On the other hand, a large-scale analysis of Twitter would most likely miss out on this important finding regarding emotion in this particular community, and would instead highlight population-wide trends.
However, we note that the geographic scoping in our study is due to the location being strongly typed, meaning that the location acts as an attractor for a certain community. Therefore, locations such as plazas, parks and airports, which attract a very diverse population, may not be ideal for deployment.
Using Public Displays to Study Communities Our work also makes methodological contributions to public display literature. The study we have described here bears resemblance to prior studies that use public displays in a crowdsourcing manner. For example, some previous work has discussed the use of public displays as a platform to crowdsource medical image analysis [15]. However, that study was conducted in a rather contrived manner because it consisted of tasks with a relatively high intrinsic motivation: counting blood cells infected with malaria for the purpose of developing better software and helping medical students. Arguably, such a “worthy” task could in itself act as an incentive for participation by appealing to altruism and users’ innate desire to “do something good”.
Furthermore, only static images were explored as a potential task facilitator. Finally, that deployment had a high rate of curiosity clicks: only 27% of people that interacted with the display did in fact complete at least one task, and those completed on average of 2.5 tasks each.
Our study addresses these limitations and further demonstrates that public displays can be a potentially valuable platform for reliably collecting data from crowds. We provide evidence that tasks perceived as less “collectively useful” – like silhouette videos – can still attract the public and generate reliable results. We attribute this to two design decisions we explicitly made. First, we explored the use of a dynamic stimulus (i.e., videos) as an alternative to static images for crowdsourcing task facilitation. Second, the input mechanism was simpler and quicker: each rating required just one touch.
Our results show that there was a significant decrease in the frequency of “curiosity”: 90% of users completed at least one task (as opposed to 27% in [15]) and those users on average completed about 7 tasks each (as opposed to 2.5 tasks in [15]). This suggests that users in our field deployment were more willing to perform tasks, possibly because the task was simpler than [15], and dynamic visuals are more engaging than static ones [27], both of which are key features in in-the-wild deployments [25]. While there might have been other factors that contributed for this increase in engagement we argue that our design decisions were the main cause given that both these deployments were done in the same locations, in the same context and with the same initial screen (“Touch Me” [25]).
At the same time, the accuracy of the ratings in Study 2 (56%) was on par with our controlled Study 1 (56%), meaning that participants’ in-the-field performance was equal to the performance in a controlled laboratory setting.
Limitations The majority of the limitations of our approach are inherent to field deployments. For instance, while we took steps to verify that the technology and context did not interfere with our results through baseline assessment of our projective test, it is still probable that some users performed the tasks in a non-serious manner. However, given our results and their consistency with previous findings on emotion, we are confident that these constituted a small portion of the collected data.
Additionally, using our approach it is not possible to obtain an equal amount of completed tests for every period of time or between each participant. Furthermore, in our study it was not possible to collect demographic information during deployment. Finally, novelty can play a significant role so that our approach is likely to perform better if its deployment time is not overly long. However, thanks to the results obtained from our baseline assessment controlled study we are confident in reliability of our proposed approach.
In summary, due to the aforementioned limitations, we highlight that our approach is by no means a silver bullet when it comes to collective emotion detection but rather complementing existing approaches with a set of unique advantages and requiring carefully considerations regarding its disadvantages, as is the case with other methods.
CONCLUSION This study proposes a novel approach to collective emotion detection through projective testing on public displays. In this paper we experimentally validate a projective test and use it to successfully monitor a community’s diurnal rhythms of collective emotion. The geographical scoping and controlled context, enabled by the public displays, provide an ideal mechanism for scoping emotion monitoring to workplaces or places of study.

In addition, results from our approach demonstrate that emotion has strong diurnal patterns, consistent with results obtained from the same community using the Day Reconstruction Method (DRM), literature on affect, well-being, suicide behaviour, and our understanding of our university’s daily routine. This has important implications in terms of understanding a community’s happiness, providing support to members of that community, and improving well-being.
Finally, we discuss the appropriateness of using public displays to study communities by contrasting our design decisions and results against previous work on public display crowdsourcing. We demonstrate that by simplifying the tasks and making them more visually enticing it is possible to reduce the likelihood of “curiosity clicks” and increase the volume of tasks completed and time spent on a public display.
ACKNOWLEDGEMENTS Funded by the Academy of Finland project 137736, TEKES project 2932/31/2009 and Infotech Oulu.
REFERENCES 1. Ashby, F.G., Isen, A.M. and Turken, A.U. A
neuropsychological theory of positive affect and its influence on cognition. Psychological Review 106, 3 (1999), 529.
2. Atkinson, A.P., Tunstall, M.L. and Dittrich, W.H. Evidence for distinct contributions of form and motion information to the recognition of emotions from body gestures. Cognition 104, 1 (2007), 59-72.
3. Aula, A. and Surakka, V. Auditory Emotional Feedback Facilitates Human-Computer Interaction. In People and Computers XVI - Memorable Yet Invisible, Springer (2002), 337-349.
4. Bollen, J., Mao, H. and Zeng, X. Twitter mood predicts the stock market. Journal of Computational Science 2, 1 (2011), 1-8.
5. Bradley, M.M. and Lang, P.J. Measuring emotion: the self-assessment manikin and the semantic differential. Journal of Behavior Therapy and Experimental Psychiatry 25, 1 (1994), 49-59.
6. Brown, B., Reeves, S. and Sherwood, S. Into the wild: challenges and opportunities for field trial methods. Proc. CHI'11, ACM (2011), 1657-1666.
7. Church, K., Cherubini, M. and Oliver, N. A Large-scale Study of Daily Information Needs Captured in Situ. ACM Transactions on Computer-Human Interaction 21, 2 (2014), 10:1-10:46.
8. Cordón, L.A. Popular psychology : an encyclopedia. Greenwood Press, Westport, Conn., 2005.
9. Ekman, P. and Friesen, W.V. Constants across cultures in the face and emotion. Journal of Personality and Social Psychology 17, 2 (1971), 124.
10. Elfenbein, H.A., Foo, M.D., White, J., Tan, H.H. and Aik, V.C. Reading your Counterpart: The Benefit of Emotion Recognition Accuracy for Effectiveness in Negotiation. Journal of Nonverbal Behavior 31, 4 (2007), 205-223.
11. Exner Jr, J.E., Erdberg, P., Weiner, I.B., Lichtenberger, E.O., et al. The Rorschach, A Comprehensive System, Volume 1, Basic Foundations and Principles of Interpretation (2003).
12. Fortson, K.N. Diurnal Pattern of On-the-Job Injuries, The. Monthly Lab. Rev 127 (2004), 18.
13. de Gelder, B. Towards the neurobiology of emotional body language. Nature Reviews Neuroscience 7, 3 (2006), 242-249.
14. Golder, S.A. and Macy, M.W. Diurnal and Seasonal Mood Vary with Work, Sleep, and Daylength Across Diverse Cultures. Science 333, 6051 (2011), 1878-1881.
15. Goncalves, J., Ferreira, D., Hosio, S., Liu, Y., Rogstadius, J., Kukka, H., Kostakos, V. Crowdsourcing on the spot: altruistic use of public displays, feasibility, performance, and behaviours. Proc. Ubicomp'13, ACM (2013), 753-762.
16. Goncalves, J., Hosio, S., Ferreira, D. and Kostakos, V. Game of Words: Tagging Places through Crowdsourcing on Public Displays. Proc. DIS'14, ACM (2014), 705-714.
17. Goncalves, J., Hosio, S., Liu, Y. and Kostakos, V. Eliciting Situated Feedback: A Comparison of Paper, Web Forms and Public Displays. Displays 35, 1 (2014), 27-37.
18. Gross, R. and Shi, J. The CMU Motion of Body (MoBo) Database. (2001).
19. Hernandez, J., Hoque, M., Drevo, W. and Picard, R.W. Mood Meter: Counting Smiles in the Wild. Proc. Ubicomp'12, ACM (2012), 301-310.
20. Hosio, S., Goncalves, J., Kostakos, V. and Riekki, J. Exploring Civic Engagement on Public Displays. In S. Saeed (Ed.), User-Centric Technology Design for Nonprofit and Civic Engagements. Springer International Publishing (2014), 91-111.
21. Hosio, S., Goncalves, J., Lehdonvirta, V., Ferreira, D. and Kostakos, V. Situated Crowdsourcing Using a Market Model. Proc. UIST'14, ACM (2014).
22. Izard, C.E. Human emotions. New York: Plenum Press, 1977.

23. Kahneman, D., Krueger, A.B., Schkade, D.A., Schwarz, N. and Stone, A.A. A survey method for characterizing daily life experience: the day reconstruction method. Science 306, 5702 (2004), 1776-1780.
24. Kirschbaum, C. and Hellhammer, D.H. Salivary cortisol in psychobiological research: an overview. Neuropsychobiology 22, 3 (1989), 150-169.
25. Kukka, H., Oja, H., Kostakos, V., Goncalves, J. and Ojala, T. What makes you click: exploring visual signals to entice interaction on public displays. Proc. CHI'13, ACM (2013), 1699-1708.
26. Lang, P.J., Bradley, M.M. and Cuthbert, B.N. International affective picture system (IAPS): Affective ratings of pictures and instruction manual. Technical Report A-8. 2008.
27. Lewalter, D. Cognitive strategies for learning from static and dynamic visuals. Learning and Instruction 13, 2 (2003), 177-189.
28. Mandryk, R.L. and Atkins, M.S. A fuzzy physiological approach for continuously modeling emotion during interaction with play technologies. International Journal of Human-Computer Studies 65, 4 (2007), 329-347.
29. McNeil, J.K., Stones, M.J., Kozma, A., Andres, D. Age Differences in Mood: Structure, Mean Level, and Diurnal Variation. Canadian Journal on Aging / La Revue Canadienne du Vieillissement 13, 02 (1994), 201-220.
30. Montepare, J.M., Goldstein, S.B. and Clausen, A. The identification of emotions from gait information. Journal of Nonverbal Behavior 11, 1 (1987), 33-42.
31. Partonen, T., Haukka, J., Pirkola, S., Isometsä, E. and Lönnqvist, J. Time patterns and seasonal mismatch in suicide. Acta Psychiatrica Scandinavica 109, 2 (2004), 110-115.
32. Pepe, A. and Bollen, J. Between conjecture and memento: shaping a collective emotional perception of the future. eprint arXiv:0801.3864, 2008.
33. Roether, C.L., Omlor, L., Christensen, A. and Giese, M.A. Critical features for the perception of emotion from gait. Journal of Vision 9, 6 (2009), 15.
34. Rui, H., Liu, Y. and Whinston, A. Whose and what chatter matters? The effect of tweets on movie sales. Decision Support Systems 55, 4 (2013), 863 - 870.
35. Scherer, K.R., Wranik, T., Sangsue, J., Tran, V. and Scherer, U. Emotions in everyday life: Probability of occurrence, risk factors, appraisal and reaction patterns. Social Science Information 43, 4 (2004), 499-570.
36. Schmidt, K.L. and Cohn, J.F. Human facial expressions as adaptations: Evolutionary questions in facial expression research. American Journal of Physical Anthropology 116, S33 (2001), 3-24.
37. Smolensky, M.H. and D'alonzo, G.E. Medical chronobiology: concepts and applications. American Review of Respiratory Disease 147, (1993), S2-S2.
38. Stone, A.A., Schwartz, J.E., Schkade, D., Schwarz, N., Krueger, A., Kahneman, D. A population approach to the study of emotion: diurnal rhythms of a working day examined with the Day Reconstruction Method. Emotion 6, 1 (2006), 139-49.
39. Stone, A.A., Smyth, J.M., Pickering, T. and Schwartz, J. Daily Mood Variability: Form of Diurnal Patterns and Determinants of Diurnal Patterns. Journal of Applied Social Psychology 26, 14 (1996), 1286-1305.
40. Theorell, T., Ahlberg-Hulten, G., Jodko, M., Sigala, F. and De La Torre, B. Influence of job strain and emotion on blood pressure in female hospital personnel during workhours. Scandinavian Journal of Work, Environment & Health 19, 5 (1993), 313-318.
41. Visidon • Home. http://visidon.fi/en/Home, retrieved 14/05/2014.
42. Wallbott, H.G. Bodily expression of emotion. European journal of Social Psychology 28, 6 (1998), 879-896.
43. Wang, L., Tan, T., Ning, H. and Hu, W. Silhouette analysis-based gait recognition for human identification. Pattern Analysis and Machine Intelligence, IEEE Transactions on 25, 12 (2003), 1505-1518.
44. Wood, C. and Magnello, M.E. Diurnal Changes in Perceptions of Energy and Mood. Journal of the Royal Society of Medicine 85, 4 (1992), 191-194.