projecting sample misstatements to audit … 09, 2014 · projecting sample misstatements to audit...
TRANSCRIPT

Decision Sciences Volume 28 Number 2 Spring 1997 Printed in the U.S.A.
Projecting Sample Misstatements to Audit Populations: Theoretical, Professional, and Empirical Considerations* Stephen Wheeler Eberhardt School of Business, University of the Paci$c, Stockton, CA 95211
Richard Dusenbury and Jane Reimers College of Business, Florida State University, Tallahassee FL 32306-1042, e-mail: [email protected], [email protected]
ABSTRACT
This paper examines the auditing decision to isolate or project errors found in sampling an audit population. The topic is interesting from both practical and theoretical viewpoints because prior research suggests that theory and practice are juxtaposed. Prior research has suggested a stringent theoretical norm in which few errors should be isolated and also suggests that, in practice, auditors commonly isolate errors that they perceive to be confined to a well-defined subpopulation. We extend this research by using the professional auditing standards as a backdrop for the study of both theoretical and practical aspects of the projection-isolation decision. As to theory, we show that a biased estimator (i.e., one that excludes errors known not to recur) may be more precise than an unbiased estimator under certain assump- tions about sample sizes and the frequencies of errors in accounting populations. Using simulation, we specify conditions under which a biased estimator is more precise than an unbiased one. As to practice, we show that auditors rely on containment information when choosing to project, and we use verbal reports to develop a description of auditors’ strategies for using containment information. Considering both the theoretical and practical aspects in light of professional standards, we conclude that, under specific conditions, isolation of sample misstatements is appropriate. Further investigation of the topic appears warranted.
Subject Areas: Accounting/Audiling and Statistics.
*All authors contributed equally to this project. The nonalphabetical order reflects a systematic rotation across multiple projects. We gratefully acknowledge the comments of participants at workshops at Arizona State University and at the Price Waterhouse Accounting Research Colloquium at the University of Utah.
26 1

262 Projecting Sample Misstatements
THEORETICAL BACKGROUND
Burgstahler and Jiambalvo (1986b) used a ball-and-urn analogy to evaluate the projection-isolation judgment. They pictured black balls to be error-free items in an account and red objects to be items in error. The red objects consisted of red balls, which were like each other, and other red shapes, each of which were unique (e.g., a red cube, cone, cylinder, etc.). A red ball, if it existed, carried some positive probability that other red balls existed. However, a red cube, if discovered, carried a zero probability that any other red cubes were in the urn. The issue was what to infer about the proportions of red shapes in the urn when a red cube is in the sample.
Burgstahler and Jiambalvo (1986b) concluded that a red cube (or red cone, etc.) should be included in the estimator of the proportion of red shapes in the population, stating, “Auditors are seldom faced with situations where it is reasonable to rule out the possibility that a population contains other unique red shapes (e.g., cones, discs, etc.)” (p. 236). Even if an error were representative of no other errors, they argued, it was representative of the class of unique errors.
The ball-and-urn model may somewhat oversimplify the task of error estimation and may need clarification as to its correspondence to auditing. For example, the red/black dichotomy is well suited to an amibute sampling plan, while the projection- isolation decisions examined in prior research (Burgstahler & Jiambalvo, 1986b; Dusenbury, Reimers, & Wheeler, 1994; Elder & Allen, 1995) deal with substantive testing of accounts receivable. Furthermore, the use of sampling in substantive testing of accounts receivable might involve dollar unit sampling (DUS) or mean- per-unit (MPU) sampling or MPU’s variations, ratio and difference estimation.
The impact of isolating a given sample misstatement also differs by the context of the decision. In attribute sampling, if the isolated error is a “threshold” error that prevents the upper deviation limit from exceeding the tolerable deviation rate, the result is a decision to rely on controls for a given assertion, the consequence being less substantive testing.
In MPU sampling, projection simply increases the range about the estimated population value after expansion by the estimated population standard deviation. Again, the isolation of a “threshold” error can determine whether the auditor con- siders the account balance to be materially accurate.
In DUS, the consequences of projecting errors are even more severe since the tainting found in a sampling unit (dollar) is assumed to recur proportionally in all dollars in the sampling interval. Again, a given error may or may not be a “threshold” error that causes the auditor to reject the hypothesis that an account balance is fairly stated. Also, at the time of the decision, the auditor may not know whether the item is a “threshold.” In summary, regardless of the decision context, the auditor makes the fundamental judgment to project or isolate the misstatement. Only the conse- quences differ.
In estimation through sampling, the estimator must be selected (e.g., a sample proportion). Auditors’ projection-isolation judgments implicitly define the estimators they use. That is, to project (or isolate) a sample error is to judge that the error is to be included in, or excluded from, the estimator. The estimator is used to produce a statistic (e.g., the proportion of red items in the sample). The statistic is then projected to the population to estimate the population parameter. Clearly, the statistic

Wheeler, Dusenbury, and Reimers 263
should be projected, as directed in SAS No. 39. However, normative criteria for the selection of the estimator, which determines the statistic, are not as clear cut.
A perfect point estimator would be one giving an estimate exactly equal to the population parameter every time. However, in practice, estimators give estimates that vary from one sample to another. For example, estimates of the average age of students in a class based on the average age of several students will vary from one random sample to another. The estimates will be dispersed, and given the dispersion, the best estimator is the one that gives estimates closest to the population parameter more of the time. The precision of an estimator refers to the closeness of the estimates to the target parameter.
Tho characteristics of estimators relevant to precision are bias and dispersion. An unbiased estimator is one that, on average, equals the population parameter (i.e., the expected value of the estimator equals the population parameter). An unbiased estimator is aimed at the right target.
In the task studied here, auditors wish to estimate via sampling the error in a population, in which the population is typically a homogeneous group of items (a strata) from a financial statement account, such as accounts receivables or items of inventory. The population parameter of interest is the population (i.e., a strata of items from an account) error. Burgstahler and Jiambalvo (1986b) suggested that an estimator in which no sample errors are isolated from the estimator (project all sample errors) is normative per standards of statistical inference. Further, they sug- gested that an estimator biased by the isolation of nonrecurring errors violates those standards.’This characterizes the auditors’ inference problem as one of choosing an unbiased estimator (isolate no errors) or a biased estimator (isolate nonrecurring errors, which is common practice).
A focus on bias ignores the dispersion of estimates. The variance of an estimator is one measure of dispersion of the estimates. Given two unbiased estimators, the one with the smallest variance would be more precise; it would provide estimates closer to the population parameter more often. In fact, the variance of an unbiased estimator is a measure of the precision of the estimator. The dispersion of estimates from an unbiased estimator around its expected value and around the target popu- lation parameter are the same.
Now consider two estimators that differ in bias. Specifically, suppose a biased (Lee, one for which the expected value of the estimator does not equal the population parameter) estimator has a smaller variance than an unbiased one. It is theoretically possible that the precision of a biased estimator (closeness of the estimates to the target parameter) may be greater than the precision of an unbiased estimator. Using the model proposed by Burgstahler and Jiambalvo (1 986b) to characterize auditors’ inference problem, we investigate the possibility that the auditors’ practice of isolating nonrecurring sample errors from the estimator may be an instance of using a more precise, biased estimator instead of a less precise, unbiased estimator.
While the precision of an unbiased estimator can be measured by its variance, this is untrue of a biased estimator. The variance of a biased estimator is distributed around the expected value of the estimator, which, due to the bias, is not the population parameter of interest. The mean square error (MSE) of the sampling distribution measures the dispersion of an estimator around the population parameter of interest. The mean square error is a measure of precision that takes into account both the bias and variance of estimators.

264 Projecting Sample Misstatements
For example, let P, P,,, and P, represent the population proportion of round red items, nonround red items, and all red items, respectively. Let S,,., S,,, and S, represent the sample proportion of round red items, nonround red items, and all red items, respectively. Then,
and
S,=S,+S,,,. (2)
Sample proportions in a random sample are unbiased estimators of the population proportions and, hence, the expected value (EV) of the sample proportion equals the population proportion, or
and
EV(S,) = P , . ( 5 )
The bias introduced by estimating P, using S,, is given by:
B, = EV(S,,) - P , . (6)
The mean square error of estimators measures the relative precision of estimators (Mendenahll, Scheaffer, & Wackerly, 198 1, p. 295). MSE=VAR(estimator)+(Bias)*. Therefore,
MSE(S,,) = VAR(S,) + €($, (7)
and
MSE(S,) = VAR(S,) + 0. (8)
Considering S, and S, as alternative estimators of P, the biased estimator, S, will yield more precise estimates of P, than will S, when MSE(S,,)<MSE(S,), or equiva- lently, when:
VAR(S,) + B;, < VAR(S,). (9)
As an arithmetic example, suppose an account balance with 10,OOO items in total is composed of 9,977 correct items (black balls), 20 items with errors which, when

Wheeler, Dusenbury, and Reimers 265
occurring in one account, may also occur in another (red balls), and 3 errors, each one of which is different, and each of which exists in only one account. Suppose the sampling program is a 1% random sample, or 100 items. From (3) and ( 5 ) we have:
EV(S,) = 23/10,000,
and
EV(S,,) = 20/ 10,000.
From (6) the bias from using S,, to estimate P , is:
B,, = ,002 - .0023 = -.0003.
The variance for a proportion is given by p ( 1-p)/n. Therefore,
VAR(S,,) = .002 x .998/100 = .oooO1996.
VAR(S,) = .0023 X .9977/100 = .oooO22947.
From (7) and (8), respectively,
MSE(S,,) = .oooO1996 + .00032 = .oooO2005. (14)
MSE(S,) = .oooO22947 + 0 = .oooO22947. (15)
In this arithmetic example, equation (14) is smaller than (15), so the biased estimator is a more precise estimator of P , than is the unbiased estimator. In general, the biased estimator is more precise than the unbiased estimator when MSE(S,) c MSE(S,). From (7) and (8). this occurs when:
Substituting ( P , - P,,) for P,, , and P i , for ( P , - P,)2, expanding and combining terms yields:
[Pn,(2P, - 1 + nP,, - P,,)] /n c 0.
The only situations of interest in this task require some unique errors (P,,, > 0) and a positive sample size (n > 0). Therefore, the term in the parentheses in (17) must be negative for the biased estimator to be more precise than the unbiased one. This occurs when:
Pnr c (1 - 2P, ) / (n - l ) , (18)

266
or equivalently,
Projecting Sample Misstatements
Pnrc (1 - 2P,,)/(n + 1).
Equations (18) and (19) show that there are two general conditions necessary for the biased estimator to be more precise than the unbiased one. First, the recumng- error rate (P,,) and the total error rate (P,) must each be less than 50%. Second, the unique-error rate (Pn> must be small when sample sizes (n) are large. What consti- tutes small is simulated for various sample sizes and recumng-error rates. Table 1 gives upper bounds for the allowable unique-error rates for which the biased esti- mator is more precise than the unbiased estimator.
As seen in Table 1, when the sample size is 50 and the recumng-error rate is 5%, the upper bound for the population unique-error rate is 1.8%. Thus, if the unique-error rate is less than 1.8%. then the biased estimator (the one excluding unique errors) will be more precise than the unbiased estimator. Table 1 also shows that the upper bound converges to zero at an error rate of approximately 40% when the sample size is 500.
Sample proportions converge to normality at relatively small sample sizes (i.e., the binomial converges to the n o d distribution). Sufficient numbers and convergence would allow the unique-error rate to be estimated separately from the recurring-error rate with the total error rate being the sum of the two, as Burgstahler and Jiambalvo (1986b) suggested. A common standard for assuming convergence of a proportion to normality is a proportion @) and sample size (n) that satisfy the following inequality (Mendenhall et al., 1981, p. 84):
O c p + 2 x [ @ ( l - p ) / n ) . 5 ] < 1.
Applying this standard, convergence does not occur for any of the upper bound unique-error rates and sample sizes shown in Table 1.
Interpreting this simulation, the practical sample size and error-rate conditions necessary for the biased estimator to be theoretically justified, using a precision criterion, are sample sizes smaller than several hundred and error rates less than 20%. Considering the error-rate condition, prior research suggests that the frequency of errors in accounting populations, particularly in the accounts of the clients of large CPA firms, are typically small (Ham, Losell, & Smieliauskus, 1985; Johnson, hitch, & Neter, 1981; Kreutzfeldt & Wallace, 1986; Ramage, Krieger, & Spero, 1979).
Concerning sample sizes, our discussions with practicing auditors at two different Big Six CPA firms indicate that sample sizes exceeding several hundred are unusual. Two exceptions were noted in these discussions in which sample sizes as large as several hundred are sometimes encountered in practice. These two exceptions were: (1) dollar unit sampling or variables sampling plans in which high error rates are encountered, and (2) account balances consisting of large numbers of accounts that cannot be effectively stratified. An example provided of the latter is a population of small bank accounts to be sampled, normally using negative confirmation requests.
Therefore, the two general conditions allowing for greater precision of an estimator that excludes unique items may very well apply within the usual audit context of error estimation. There may be other features of audit populations and

Wheeler, Dusenbury, and Reimers 267
’bble 1: Upper bounds of population uniqueerror rate for which the estimator excluding unique errors is more precise than the unbiased estimator [MSE(S,,) c MSE(S,)].
Recumng-Error Rates
Sample Sizes .01 .05 .10 .20 .40
25 50 75
100 250 500
.038 ,035 .03 1 .023 .008 ,019 .018 .016 .012 .004 .013 .012 .011 .008 .003 .010 .009 .008 .006 .002 .004 .004 .003 .002 .00 1 .002 .002 .002 .001 .Ooo
auditors’ sampling procedures that affect normative statistical inference in auditors’ estimation through sampling. For example, auditors know the causal processes gen- erating the population items, they discover the causes of errors in sampled items, and they require correction of discovered material errors. The effect of these features is beyond the scope of this paper, but none of the features would seem a basis for arguing that normative inference requires use of the unbiased estimator.
In summary, a biased estimator may be more precise than an unbiased one. The estimator biased by the isolation of nonrecurring errors is more precise than one including such errors when the unique-error rates (given recumng-error rates and sample sizes) are lower than the upper bounds shown in Table 1.
It is important to qualify this conclusion somewhat by noting that an estimate based on isolating unique errors may be inferior if, as suggested by Burgstahler and Jiambalvo (1986b), there is a tendency for auditors to find ex-post rationalizations to classify sample errors as unique to avoid expanding sampling procedures. Ironically, if such a strategy is abused, the number of unique errors may become large enough to justify projection using the guidelines in Table 1.
PROFESSIONAL STANDARDS
Statement on Auditing Standards (SAS) No. 39 (AICPA, 1994, AU 350.27), which justifies the use of sampling, defines audit sampling to be the “application of an audit procedure to less than 100% of the items within an account balance or class of transactions.” It does not rule out the isolation of errors perceived to be unique. As it stands, SAS No. 39 is quite general in providing a clear norm for the projection- isolation judgment, although a task force is currently revising the audit guide for implementing SAS No. 39 to provide more practical guidance to auditors (Holstrum, 199 1). However, parts of the statement, when considered together, hint at providing justification for auditors’ observed tendencies to isolate sample errors when SUE- cient containment information is gathered to induce perceptions of uniqueness. For instance, SAS No. 39 does not explicitly discuss the process for selection of an estimator, but does state that “consideration should be given to the qualitative aspects of the misstatements” (AICPA, AU 350.27) when making estimates through sampling.

268 Projecting Sample Misstatements
SAS No. 39 allows for the stratification of items subject to sampling into homogeneous subgroups (AICPA, 1994, AU 350.22). SAS No. 39 further prescribes that auditors “should add that projection (of sample misstatements) to the misstate- ments discovered in any items examined 100%” (AICPA, AU 350.26).
In addition, SAS No. 39 does not specifically discuss (or rule out) the possibility for a restratification strategy based on the evidence obtained during sampling. For example, when the auditor has gathered certain qualitative information about a sample error (e.g., the examination of all temporary-clerk transactions pursuant to discovery of a processing error by a temporary clerk), it may be argued that the auditor can effectively restratify the population into temporary- and permanent- clerk-transactionstrata. Hence, the contained error becomes a member of an ex-post stratum examined 100%, which is unique with respect to its chances of tainting the other strata. Then, as SAS No. 39 dictates, any uncorrected errors in the 100% examined temporary-clerk stratum are added to the projected errors (excluding the contained error) from the sampled permanent-clerk stratum. Arens and Loebbecke (1981, p. 268) discussed postsampling stratification in the application of variable sampling plans, noting that this strategy is acceptable as long as all of the normal requirements for stratification (clearly defined stratum boundaries, known population sizes for each stratum, and strata determination based upon recorded, rather than audited, values) are met. Restratification also is discussed in mathematical statistics texts (Thompson, 19!92), pointing out the acceptability and desirability of, for example, stratifying survey samples by gender, age, etc., after sample items are selected. However, since the strata sizes are random variables in such an analysis, an additional term is added to the calculation of the sample variance. While the correspondence of these approaches to auditing needs further study, the presentation of postsampling restratification as a valid statistical approach provides a groundwork for justifying the isolation of unique sample misstatements. This practice also does not indisputably violate professional standards, at least in substantive testing applications.
Under restratification, replacement of the isolated error with another permanent- clerk transaction would seem proper, just as auditors routinely replace voided checks in sampling plans for tests of controls over client disbursement cycles. Absent replacement, recalibration of the precision of the sample estimates using n-1 as the sample size (and a population of N-1 items in the subpopulation) would seem appropriate. In our discussions of this issue with the executive in charge of audit sampling for one of the Big Six CPA firms, he confirmed that, while restratification was a common justification used to isolate sample errors, replacement and recali- bration were uncommon. In justifying the restratification approach, he stated that, “It seems unreasonable to dictate that an auditor cannot learn from his or her audit procedures and adjust accordingly” (i.e., stratifying the population in the way he or she would have done, had the strata been known at the time of sample selection).
In sum, neither professional standards nor standards of statistical inference are conclusive in fixing a norm for the projection-isolation judgment. SAS No. 39 dictates auditor judgment based on qualitative characteristics of errors, while standards of statistical inference do not necessarily require the projection of unique errors. Therefore, the handling of unique errors in the audit task of error estimation should be considered a professional audit judgment subject to empirical research.

Wheeler, Dusenbury, and Reimers 269
On a related note, Wurst, Neter, and Godfrey (199 1) addressed the effectiveness of rectification (i.e., correction and exclusion) of sample errors prior to the estima- tion of population error. Rectification would be a viable option whether the auditor chose to use an unbiased or a biased estimator to estimate the population error rate.
THE CONTAINMENT STRATEGY: EMPIRICAL TESTS FOR EFFECTS OF PARTIAL CONTAINMENT
Prior research and our discussions of the projection-isolation judgment with practicing auditors indicated that auditors use an investigation strategy with the aim of isolating sample errors. In Dusenbury et al. (1994), subjects were asked in debriefing to indicate any information that they would have liked to have had in order to make the projection-isolation decision. The responses indicated overwhelmingly that the subjects wanted containment information (i.e., information on the representativeness of the error). For example, in one experimental case, a clerical employee had delib- erately misfooted sales invoices and forged the superior’s signature. Subjects who had no containment information wanted additional information about the possible subpopulation to which the error might be contained and about the potential for additional errors. Some of the comments included:
Can transactions handled by this clerk be identified and thus isolated? Does the clerk have responsibility for footing all invoices? Could we isolate this clerk’s receivable posted? If so, we could examine separately. Would like to try to isolate these unusual invoices . . . Could we segregate the population to those invoices prepared by that clerk? Can I isolate population to remove from my total population? Would need to extensively test all invoices footed by same clerical employee for fraud. Would not project error if it could be isolated. How much activity is this person responsible for? Can we isolate the error to the clerical employee . . .? Remove error-prone conditions from the population thereby avoiding extrapolation.
From these subjects’ comments and requests for additional information, it is clear that containment information and its dimensions are of real practical concern to auditors, indicating that a containment strategy arises from auditors’ questioning the representativeness of the sample. Also, archival evidence (Elder & Allen, 1995) shows containment to be an often-used strategy for isolation.
Based on these verbal responses and previous research, two aspects of the containment strategy emerge: (1) auditors identify a subpopulation to which the sample error is (can be) contained, and (2) auditors investigate the subpopulation for additional errors. Prior research supports this description. In Burgstahler and Jiambalvo (1986b) and Dusenbury et al. (1994), containment information always indicated, perhaps somewhat unrealistically, that the error was confined to a sub- population and that, upon being examined 10070, no additional errors were uncovered. Both results showed that information indicating that these two conditions were met
270 Projecting Sample Misstatements
had an effect on the projection of both errors and irregularities regardless of the perceived frequency or causal similarity of the error to other potential errors. Also, the projection of sample errors was associated with the absence of such information.
Given that all prior research used complete containment of the subpopulation and the discovery of no additional errors, a question unanswerable from this research is whether partial containment affects this judgment. If not, the implication is that containment is categorical. If, on the other hand, containment has dimensions, then the isolation of errors should increase with the extent of containment.
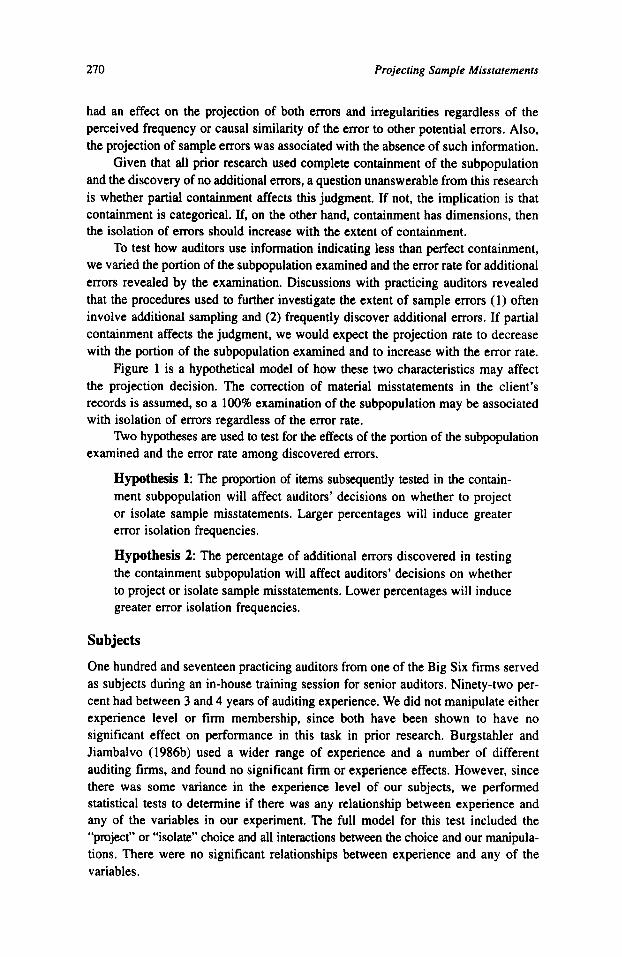
To test how auditors use information indicating less than perfect containment, we varied the portion of the subpopulation examined and the error rate for additional errors revealed by the examination. Discussions with practicing auditors revealed that the procedures used to further investigate the extent of sample errors (1) often involve additional sampling and (2) frequently discover additional errors. If partial containment affects the judgment, we would expect the projection rate to decrease with the portion of the subpopulation examined and to increase with the error rate.
Figure 1 is a hypothetical model of how these two characteristics may affect the projection decision. The correction of material misstatements in the client’s records is assumed, so a 100% examination of the subpopulation may be associated with isolation of errors regardless of the error rate.
lbo hypotheses are used to test for the effects of the portion of the subpopulation examined and the error rate among discovered errors.
Hypothesis 1: The proportion of items subsequently tested in the contain- ment subpopulation will affect auditors’ decisions on whether to project or isolate sample misstatements. Larger percentages will induce greater error isolation frequencies.
Hypothesis 2: The percentage of additional errors discovered in testing the containment subpopulation will affect auditors’ decisions on whether to project or isolate sample misstatements. Lower percentages will induce greater error isolation frequencies.
Subjects
One hundred and seventeen practicing auditors from one of the Big Six firms served as subjects during an in-house training session for senior auditors. Ninety-two per- cent had between 3 and 4 years of auditing experience. We did not manipulate either experience level or firm membership, since both have been shown to have no significant effect on performance in this task in prior research. Burgstahler and Jiambalvo (1986b) used a wider range of experience and a number of different auditing firms, and found no significant firm or experience effects. However, since there was some variance in the experience level of our subjects, we performed statistical tests to determine if there was any relationship between experience and any of the variables in our experiment. The full model for this test included the “project” or “isolate” choice and all interactions between the choice and our manipula- tions. There were no significant relationships between experience and any of the variables.
Wheeler, Dusenbury, and Reimers 27 1
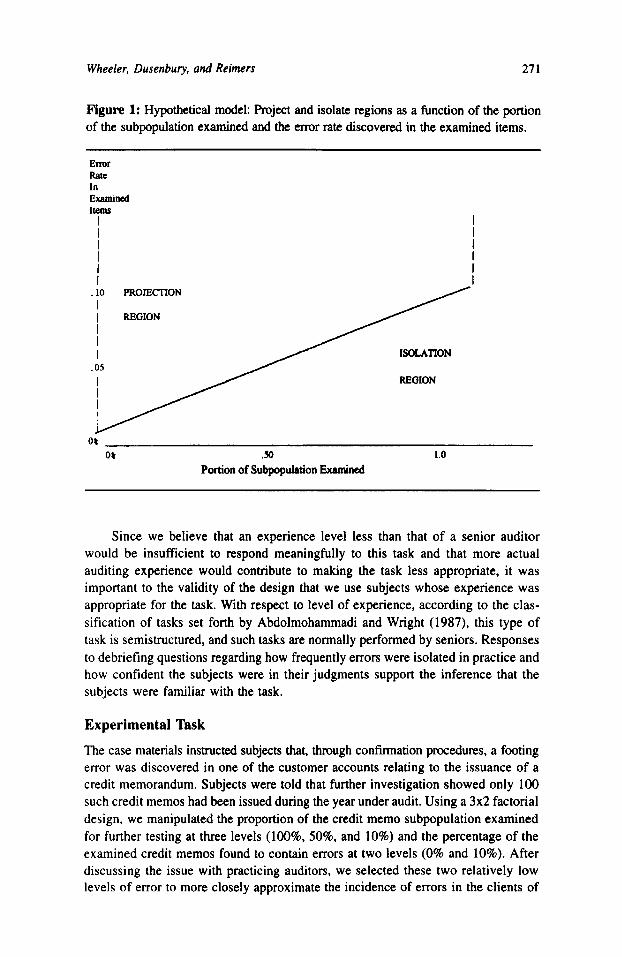
Figure 1: Hypothetical model: Project and isolate ngions as a function of the portion of the subpopulation examined and the error rate discovered in the examined items.
Enor RiuC In Examinsd Items
I I I I I I
~~
Or .so 1.0
Portion of Subpopulation
Since we believe that an experience level less than that of a senior auditor would be insufficient to respond meaningfully to this task and that more actual auditing experience would contribute to making the task less appropriate, it was important to the validity of the design that we use subjects whose experience was appropriate for the task. With respect to level of experience, according to the clas- sification of tasks set forth by Abdolmohammadi and Wright (1987), this type of task is semistructured, and such tasks are normally performed by seniors. Responses to debriefing questions regarding how frequently errors were isolated in practice and how confident the subjects were in their judgments support the inference that the subjects were familiar with the task.
Experimental 'IBsk
The case materials instructed subjects that, through confirmation procedures, a footing error was discovered in one of the customer accounts relating to the issuance of a credit memorandum. Subjects were told that further investigation showed only 100 such credit memos had been issued during the year under audit. Using a 3x2 factorial design, we manipulated the proportion of the credit memo subpopulation examined for further testing at three levels (1008, 50%, and 10%) and the percentage of the examined credit memos found to contain errors at two levels (0% and 10%). After discussing the issue with practicing auditors, we selected these two relatively low levels of error to more closely approximate the incidence of errors in the clients of

272 Projecting Sample Misstatements
Big Six auditors. In this sense, the weak error percentage manipulation works against finding significant results.
Both variables were manipulated between subjects. For comparison purposes, the treatment in which the subpopulation examined is 100% with no new errors replicates Burgstahler and Jiambalvo (1986b) and Dusenbury et al. (1994). An example of the sample instrument is provided in the Appendix.
Results
Table 2 presents the experimental results, showing subjects’ projection-isolation decisions by treatment. The results in the treatment in which the subpopulation examined is 100% with no new errors successfully replicates prior studies (Burgstahler & Jiambalvo, 1986a; Dusenbury et al., 1994). reflecting the strong influence of containment information. Under conditions of complete containment of the sample misstatements with no additional errors discovered, subjects projected 30% (and, hence, isolated 70%) of the sample errors.
Table 3 presents the tests for the statistical signifkance of the effects. To test the first hypothesis, that the proportion of items tested in the subpopulation will affect auditors’ projection-isolation decisions, we used a chi-square test. The results in Table 3a indicate overall support for the hypothesis (~~=15.70,pS.001). That is, the tendency to isolate the original sample error varies when the proportions of the subpopulation examined changes. Paired comparisons further describe this effect. The isolation of sample errors between the 10% and the 50% levels of the variable is significantly different (x2=1 1.26, p<.001), while the difference between the 50% and the 100% levels is not significant ( ~ ~ 4 . 5 4 , pS.464).
We also compared the 100% group (complete containment) to the 50% and 10% p u p s combined (less than complete containment). The results were significant ( ~ ~ 4 . 3 4 , pS.037) despite the relatively smaller cell sizes in the 100% sample treat- ment. The 100% sample treatment was primarily included as a partial replication of prior studies (Burgstahler & Jiambalvo, 1986b; Dusenbury et al., 1994) to confirm the effect of complete containment. In this paper, the comparison of auditors’ projection- isolation decisions in the two partial containment conditions was the major focus of the analysis and, hence, more subjects were assigned to these cells.
The results shown in Table 3b support the second hypothesis concerning the effect of the percentage of additional errors detected in the auditor’s procedures. The overall test of significance for the percentage of additional errors discovered (0% versus 10%) was significant (x2=5.34,p<.O21). For the first two levels of subpopulation examined, 10% and 5096, the percentage of errors projected was greater in the 10% additional-errors condition than in the no additional-errors con- dition b1.012 and .059, respectively, as shown in Table 3). However, the projection percentages were not significantly different when the proportion of examined sub- population was 100% (pS.610). Consistent with Dusenbury et al.3 (1994) observations, the gathering of complete containment information was associated with isolation of the sample emrs, even when additional errors were found in the subsequent inves- tigation. Only without complete containment did the extent of additional errors found in conducting containment-seeking procedures significantly affect auditors’ decisions on whether to project or isolate the original sample error.

Wheeler, Dusenbury, and Reimers 273
lbble 2: Number (9%) of projection and isolation choices.
Additional Errors Discovered
10% Total Portion of Subpopulation None
Examined Projected Isolated Projected Isolated Projected Isolated
10% 13 (52) 12 (48) 19 (86) 03 (14) 32 (68) 15 (32) 50% 05 (21) 19 (79) 12 (46) 14 (54) 17 (34) 33 (66) 100% 03 (30) 07 (70) 02 (20) 08 (80) 05 (25) 15 (75)
Total Projected 21 (36) 38 (64) 33 (57) 25 (43) 54(46) 63 (54) and Isolated
a b l e 3: Chi-square statistics: Effects of the portion of subpopulation examined and additional errors discovered on the projection-isolation decisions.
df Chi-square P Value
a. Portion of Subpopulation Examined (10%,50%, or 100%)
Overall test of significance
10% versus 50% 10% versus 100% 50% versus 100% 10% + 50% versus 100%
Paired comparisons: 2 15.70 .001
1 11.26 .00 1 1 10.53 .00 1 1 00.54 .464 1 04.34 .037
b. Additional Ermrrr Discovered (0 % vs. 10 % )
Test by level of subpopulation examined: Overall test of significance 1 5.34 .02 1
10% examined 1 6.36 ,012 50% examined 1 3.57 .059 100% examined 1 0.27 .610
SUMMARY AND DISCUSSION In this paper, we adopt a statistical estimation framework and a professional standards framework to address issues affecting the auditor’s decision to project or isolate sample misstatements when estimating population error rates. Prior research (Burgstahler & Jiambalvo, 1986a, 1986b) advocated a norm of projecting essentially all sample misstatements, even those perceived to be unique based on the auditor’s further investigation. We extended the application of statistical estimation frame- work to this judgment by considering the precision of the estimator. We provided evidence that the exclusion of unique errors in developing a sample estimator can increase the accuracy of the estimation process. Further, using analytical simulation, we show that conditions (error rates and sample sizes) consistent with the superior

274 Projecting Sample Misstatements
accuracy of an estimator that excludes unique errors arc descriptive of the audit environment. In addition, we provide arguments that isolation of perceived unique errors does not indisputably violate current professional standards.
Recent critiques of auditors’ estimation procedures (Edwards, 1995; Johnstone, 1995) asserted that the classical hypothesis testing framework underlying audit sampling is not well suited and is biased toward excess conservatism. They sug- gested that a Bayesian framework (Slovic & Lichtenstein, 1971), which allows for updated probability assessments based on new information, more closely aligns with audit practice. In fact, some firms currently use a Bayesian pre-sample or initial stop-or-go approach to sampling. The restratification process discussed in this paper seems to fit with this critique quite well. However, Loebbecke (1995) pointed out that auditors’ error estimation through sampling is much more complex than the Bayesian critiques suggest. The theoretical, simulation, and empirical results pre- sented in this paper also support Loebbecke’s observations.
This paper also extends the work of Dusenbury et al. (1994) addressing, empirically, the notion of partial containment strategies. That is, when the auditor believes a sample error to be a member of a well-defined subpopulation of transactions (e.g., processed by a temporary clerk) large in number, the adoption of a second-order sam- pling plan to investigate the original sample error is common. All prior research in this area used only complete examination of the subpopulation. Further, no prior research allowed for the identification of additional misstatements as a result of the second-order sampling procedures.
Using an experiment with practicing auditors as subjects, we provide evidence that both the proportion of the subpopulation examined and the percentage of addi- tional misstatements noted, significantly affect the auditor’s judgment about whether to project or isolate the original sample misstatement.
The primary implication of this research lies in legitimizing a common audit practice that was previously suggested to be nonnormative. Together, the theoretical, professional, and empirical results of this paper suggest that the auditor’s projection- isolation judgment when applying audit sampling is much more complex than sug- gested in prior research. While more research is needed, the evidence provided here supports the notion that auditors do not necessarily violate either norms of statistical inference or professional standards, and the proper judgment to project or isolate an error depends upon the conditions of the audit.
Future research directed at this important audit decision might look at what types of information and cognitive processes trigger the auditor’s decision to seek containment of a sample error. The characteristics of subpopulations used to contain errors is another unexplored topic. Also, further refinement of the ways in which auditors apply second-order sampling strategies to provide containment information may be helpful in understanding this complex decision. Norms on whether, and how, to replace isolated sample errors with other representative transactions or balances need to be further investigated.
Regarding the error rate and sample size conditions that support the inclusion or exclusion of unique errors in sample estimators, an archival investigation of the incidence of errors isolated in actual audits because of uniqueness would provide useful information for establishing norms. Finally, as suggested by prior research (Dusenbury et al., 1994). further investigation of how frequency perceptions affect

Wheeler, Dusenbury, and Reimers 275
auditors’ projection-isolation judgments, in cases where irregularities are not an issue, is needed. Related to this, the notion of whether a compensating client-control procedure was in place, but which failed to discover the sample error, was suggested by several of our subjects as a factor that may have affected their judgments.
Certain factors limit the generalizability of the empirical results presented here. First, only one of the Big Six audit firms provided subjects for the experiment. While this is a limitation of the research, it is a common practice in auditing research to use a single firm due to the difficulty of getting professional participants for experi- mental research. This limitation, however, is minimized in our research due to the specific task used in our research. That task is quite uniform across firms and should not be affected by firm characteristics. The decisions made before the point of the decision required by our experimental task, such as stratification of the population and the actual sample selection, are tasks in which f m differences would be expected. The limitation of a single firm is also minimized by our use of a case that previous researchers (Burgstahler & Jiambalvo, 1986b) used with a number of different firms, and the differences between firms were not significant.
Second, our analysis included only three treatment levels for the proportions of the subpopulation examined and two (quite small) percentages of emrS discovered in the second-order sampling procedures. While significant effects were noted, per- haps a larger noted error percentage would produce more precise information about when the auditor decides to abandon second-order sampling in favor of a 100% testing approach. Third, additional information about whether an error is a threshold misstatement, which would cause the auditor to reject the hypothesis concerning an account’s fairness, may have affected the findings and should be investigated in future research. [Received: April 12. 1995. Accepted: August 23, 1996.1
REFERENCES Abdolmohammadi, M., & Wright, A. (1987). An examination of the effects of
experience and task complexity on audit judgments. The Accounting Review,
American Institute of Certified Public Accountants (AICPA). (1994). Professional standards, Volume 1: U.S. auditing standards. Chicago, IL: Commerce Clearing House, Inc.
Arens. A., & Loebbecke, J. (1981). Applications of statistical sampling to auditing. Englewood Cliffs, NJ: Prentice Hall.
Burgstahler, D., & Jiambalvo, J. (1986a). Isolation of errors in audit sampling. CPA Journal, 56( 11). 66-71.
Burgstahler, D., & Jiambalvo, J. (1986b). Sample error characteristics and projection of error to audit populations. The Accounting Review, 61, 233-248.
Dusenbury, R., Reimers, J., & Wheeler, S. (1994). The effect of containment infor- mation and error frequency on projection of sample errors to audit populations. The Accounting Review, 69, 257-264.
Edwards, W. (1995). Number magic, auditing acid, and materiality-A challenge for auditing research. Auditing: A Journal of Practice and Theory, 14, 176-187.
Elder, R., & Allen, R. (1995). An empirical investigation of the auditor’s decision ro isolate errors. Working Paper, Syracuse University.
62, 1-13.

276 Projecting Sample Misstatements
Ham, J., Losell, D., & Smieliauskus, W. (1985). An empirical study of error char-
Holstrum, G. (1991). ASB update. Florida CPA Today, 7 , 28-33. Johnson, J., Leitch, R., & Neter, J. (1981). Characteristics of errors in accounts
receivable and inventory audits. The Accounting Review, 56, 270-293. Johnstone, D. J. (1995). Statistically incoherent hypothesis tests in auditing. Audit-
ing: A Journal of Practice and Theory, 14, 156-175. Kreutzfeldt, R., & Wallace, W. (1986). Error characteristics in audit populations:
Their profile and relationship to environmental factors. Auditing: A Journal of Practice and Theory, 6, 20-43.
Loebbecke, J. K. (1995). On the use of Bayesian statistics in the audit process. Auditing: A Journal of Practice and Theory, 14, 188-192.
Mendenhall, W., Scheaffer, R., & Wackerly, D. (198 1). Mathematical statistics with applications. Boston: PWS Publishers.
Ramage, J., Krieger, R., & Spero, L. (1979). An empirical study of error charac- teristics in audit populations. Journal of Accounting Research, (Supplement
Slovic, P., & Lichtenstein, S. (1971). Comparison of Bayesian and regression approaches to the study of information processing in judgment. Organizational Behavior and Human Performance, 6, 649-144.
acteristics in accounting populations. The Accounting Review, 60, 387-406.
1979). 72-102.
Thompson, S . (1992). Sampling. New York: John Wiley & Sons. Wurst, J., Neter, J., & Godfrey, J. (1991). Effectiveness of rectification in audit
sampling. The Accounting Review, 66, 333-346.
APPENDIX: SAMPLE INSTRUMENT
Error Estimation Case
THE PROBLEM: Assume you are performing the accounts receivable confirmation at year end. You have decided to examine a random sample of 150 receivables from a population of 3,000 accounts. Assume that the error identified in the following case has been discovered in the sample of 150 accounts. Also assume that the population error will be estimated by multiplying the total sample error by 20 (3OOO/150=20).
Among other things, you will be asked to decide whether to include or exclude the error in the estimation of the sample error. If you include the error, the implica- tion is that the population error will be estimated to be an amount 20 times the sample error. Assume this amount will exceed the tolerable error for the account. If you decide to exclude an error, then the implication is that the amount of the error is corrected and the amount is not considered in estimating the population error.
Assume that all material errors are comcted by the client with adjusting entries. Please turn the page and complete the case at your own pace. During the confirmation of receivables, an error was discovered in Account
No. 593, which was overstated by $1,687.37. It was apparently due to an error on a credit memorandum. Your audit client apparently misfooted the invoices related to the credit by $1,687.37.

Wheeler, Dusenbury, and Reimers 211
Your preliminary investigation reveals that, in total, only 100 credit memos were issued during the year. To evaluate the extent of the error uncovered, you have decided to examine a random sample of 50% of the remaining credit memos and check the amounts by footing the totals on supporting documents.
Your investigation has uncovered 5 additional errors.
Suppose the audit plan allows no further investigation. Would you include the discovered error in Account No. 593 in your sample estimate of the population error?
- YES, I would include the error. ~ NO, I would NOT include the error.
How confident are you in that decision?
]---2---3---4--- 5 - - - 6 - - - 7 Not at all confident Very confident
~~ ~~ ~ ~~
In your opinion, how similar is the cause of this error to the causes of other potential errors found during an audit?
]---2---3---4---5---6--- 7 Not at all similar Very similar
Please rate the strength of the planned investigation procedures by marking the scale below.
1---2---3---4--- 5 - - - 6 - - - 7 Very weak Very strong
Stephen Wheeler is an associate professor in the School of Business and Public Administration at the University of the Pacific in Stockton, California. He has published research papers dealing with auditing and financial accounting issues in The Accounting Review, The Journal of Accounting Research, Auditing: A Journal of Practice and Theory, Accounting Horizons, and The Journal of Economic and Social Measurement. He currently serves on the editorial boards of Advances in Accounting and The Accounting Educators’ Journal and serves as ad hoc reviewer for several other academic journals.
Richard Dusenbury is an assistant professor of accounting at the College of Business at Florida State University. He has published articles dealing with auditing, behavioral, and tax issues in The Accounting Review Auditing: A Journal of Practice and Theory, and the Journal of the American Taxation Association.

278 Projecting Sample Misstatements
He currently is on the editorial board for the Journal of the American Taxation Association and serves as ad hoc reviewer for several other academic journals.
Jane Reimers is an associate professor of accounting at the College of Business at Florida State University. She has published research papers dealing with auditing and behavioral issues in The Accounting Review, The Journal of Accounting Research, Auditing: A Journal of Practice and Theory, Accounting Horizons, and Accounting, Organizations and Society, and serves as ad hoc reviewer for several academic journals.