projecting hospitals’ profit margins under several ... · projecting hospitals’ profit margins...
TRANSCRIPT
Working Paper Series Congressional Budget Office
Washington, DC
Projecting Hospitals’ Profit Margins Under Several Illustrative Scenarios
Tamara Hayford Congressional Budget Office ([email protected])
Lyle Nelson Congressional Budget Office
Alexia Diorio (formerly of CBO)
September 2016
Working Paper 2016-04
To enhance the transparency of the work of the Congressional Budget Office and to encourage external review of it, CBO’s working paper series includes both papers that provide technical descriptions of official CBO analyses and papers that represent original, independent research by CBO analysts. Papers in this series are available at http://go.usa.gov/ULE. The information in this paper is preliminary and is being circulated to stimulate discussion and critical comment as developmental work for analysis for the Congress.
The authors thank the following staff of the Congressional Budget Office: Jessica Banthin, Linda Bilheimer, Tom Bradley, Noelia Duchovny, Philip Ellis, Katherine Fritzsche, Holly Harvey, Daniel Hoople, Lori Housman, Jeffrey Kling, Jamease Kowalczyk, Paul Masi, Sarah Masi, Kevin McNellis, Allison Percy, Lisa Ramirez-Branum, Michael Simpson, and Robert Stewart for their technical assistance and advice; Justin Lee and Kyle Redfield for fact-checking; and Christine Bogusz for editing. The authors would also like to thank Melinda Buntin, Stephanie Cameron, Gordon Mermin, Erica Socker, and Sam Trachtman, all formerly of CBO, for their technical assistance and helpful comments. The authors also appreciate helpful comments and suggestions from Kimberly Andrews, Mary Kate Catlin, Stephen Heffler, and Anne Martin, all of the Centers for Medicare & Medicaid Services’ Office of the Actuary; Martin Gaynor of Carnegie Mellon University; Joseph Newhouse of Harvard University; John Romley and Dana Goldman, both of the University of Southern California; and Jeffrey Stensland of the Medicare Payment Advisory Commission.
Abstract Changes stemming largely from implementation of the Affordable Care Act (ACA) could affect hospitals’ finances significantly. Although the ACA reduces Medicare’s payment updates for hospitals, it also expands insurance coverage, which should reduce hospitals’ costs for uncompensated care. To examine the effects of those and other provisions of federal law, this paper calculates hospitals’ profit margins and the share of hospitals that might lose money in 2025 under several illustrative scenarios. The analysis focuses on about 3,000 hospitals that provide acute care and are subject to Medicare’s cuts in payment updates, and it thus excludes most rural hospitals. Before the ACA’s main changes took effect, about one-quarter of the hospitals covered by this analysis reported negative profit margins in a given year, on average—but most of those unprofitable hospitals have been able to continue operating.
Those hospitals may face significant pressure in the future, but the extent of that pressure and their profit margins will depend crucially on their productivity growth. If they achieve the same productivity growth as the economy as a whole—and if they use those gains in productivity to limit the growth of their costs and do not respond to financial pressures in other ways—then the share of those hospitals with negative margins would rise to 41 percent in 2025. But if those hospitals do not improve their productivity at all, or do not use any of their productivity gains to limit their costs, then that share would rise to 60 percent in 2025. A key limitation of this analysis, however, is that we cannot account for hospitals’ responses to those financial pressures. Therefore, the calculations are illustrative and are not a projection of what will happen under current law, and we cannot estimate whether access to care or quality of care would suffer as a result. The hospitals we examined would have to increase the growth of total revenues or reduce the growth of total costs by an additional 0.2 percent to 0.5 percent per year to achieve the same level of average profitability in 2025 as they obtained in 2011; whether that would be easy or difficult is unclear.

Contents
1. Summary ..................................................................................................................................... 1
2. Background on Hospitals’ Financial Performance and Productivity .......................................... 3 Historical Trends in Hospitals’ Margins .................................................................................... 4 Components of Hospitals’ Revenues .......................................................................................... 4 Components of Hospitals’ Costs ................................................................................................ 8 Hospitals’ Productivity Growth .................................................................................................. 9
3. Data and Methods ...................................................................................................................... 13 Hospitals’ Cost Reports ............................................................................................................ 13 Hospitals Included in the Analysis ........................................................................................... 13 Hospitals’ Margins in 2011 ...................................................................................................... 16 Projection Methods ................................................................................................................... 18
4. Projections of Hospitals’ Margins Under Four Illustrative Scenarios ....................................... 19 Factors Included in the Illustrative Scenarios ........................................................................... 19 Comparison With Recent CMS Analyses ................................................................................ 23 Scenario 0: Projecting Margins Using Pre-ACA Update Rules ............................................... 26 Scenario 1: Projecting the Effects of the Reductions in Payment Updates
Specified in the ACA ........................................................................................................... 30 Scenario 2: Factoring in the Insurance Coverage Expansion ................................................... 31 Scenario 3: Factoring in the ACA’s DSH Cuts and Penalties Related to Quality of Care ....... 34 Scenario 4: Incorporating Other Reductions in Hospital Payments ......................................... 35
5. Potential Responses by Hospitals .............................................................................................. 36 Reducing Costs ......................................................................................................................... 37 Increasing Revenues ................................................................................................................. 38 Addressing Both Costs and Revenues via New Payment Models ............................................ 39 Merging or Closing ................................................................................................................... 39
6. Conclusion ................................................................................................................................. 40
Appendix A. Critical Access Hospitals ......................................................................................... 42
Appendix B. The Persistence of Negative Margins ...................................................................... 45
Appendix C. Hospital Margins Over Multiple Years .................................................................... 47
Appendix D. Projections of the Share of Revenues in Hospitals With a Negative Margin .......... 48
Tables
Table 1. Variation in Revenues and Costs Across Hospitals, 2011 ................................................. 6
Table 2. Sample Selection ............................................................................................................. 14
Table 3. Share of Hospitals With Selected Characteristics, 2011 ................................................. 15
Table 4. Hospitals’ Margins, by Selected Characteristics of Hospitals, 2011 ............................... 17
Table 5. Scenarios That CBO Analyzed to Evaluate Hospitals’ Financial Sustainability ............ 20
Table 6. Share of Hospitals With a Negative Margin and Hospitals’ Aggregate Margins, by Scenario and Rate of Productivity Growth, 2025 ................................................................... 29
Table A-1. Characteristics and Financial Performance of Critical Access Hospitals and Acute Care Hospitals Paid Under the Prospective Payment System, 2011 ....................................... 43
Table A-2. Aggregate Margins for Hospitals That Converted to Critical Access Hospitals, 2002 to 2009 ........................................................................................................................... 44
Table D-1. Share of Revenue in Hospitals With a Negative Margin and Hospitals’ Aggregate Margins, by Scenario and Rate of Productivity Growth, 2025 ............................................... 49
Figures
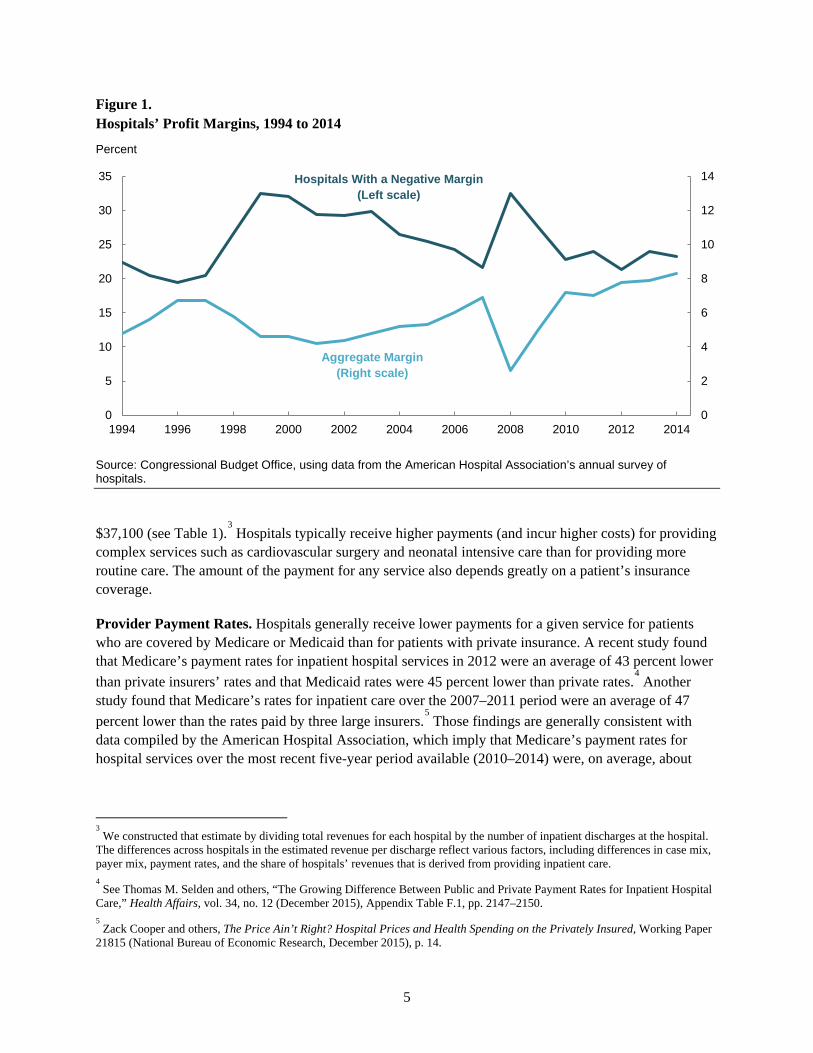
Figure 1. Hospitals’ Profit Margins, 1994 to 2014 .......................................................................... 5
Figure B-1. Distribution of Hospitals, by Number of Years With a Negative Margin, 2000 to 2007 ........................................................................................................................... 46
1
1. Summary Hospitals play a central role in the delivery of health care but face conflicting pressures on their finances that may intensify in the future. In particular, the Affordable Care Act (ACA) specifies that the annual increases in Medicare’s payment rates for most hospitals will be smaller than they would have been under prior law. At the same time, the ACA is projected to substantially increase the number of people who have health insurance, which should improve hospitals’ financial health by reducing the amount of care they provide to uninsured patients—many of whom pay little or nothing for their care.
The net impact of those financial pressures and other developments on hospitals’ profitability is an important consideration for the Congressional Budget Office’s projections of federal spending and analyses of policy proposals. For example, some people have expressed concern that hospitals will face such severe financial pressure that many will be forced to close or merge with other institutions and that patients’ access to care and quality of care will diminish. Alternatively, some analysts believe that greater financial pressure will force hospitals to control their costs more effectively than they may have done in the past. A better understanding of the degree of financial pressure facing hospitals and the potential implications for their financial health and patient care will be important both for policymakers considering changes to the Medicare program and for analysts evaluating those changes.
To understand better the financial pressures facing hospitals, we projected hospitals’ profit margins over the next decade under several illustrative scenarios that incorporate key provisions of the ACA and other factors. The analysis focused on about 3,000 hospitals that provide acute care to the general population and are subject to Medicare’s cuts in payment updates. The excluded hospitals collectively account for only about 10 percent of all spending in acute care hospitals, and the majority of acute care hospitals located in rural areas were excluded from the analysis.
As a starting point for the analysis, we estimated that the average profit margin across those hospitals was 6.0 percent in 2011 and that about 27 percent of them had negative profit margins (in other words, they lost money) in that year. That share may be surprisingly high but is similar to the shares of hospitals with negative annual profit margins over the past two decades and thus may represent a sustainable situation. A key feature of the hospital industry that affects margins is that nearly 60 percent of hospitals are nonprofit organizations and about 20 percent are publicly owned. Both types of hospitals tend to generate lower margins than for-profit hospitals, both because they do not have shareholders seeking a financial return on their investment and because they are required to reinvest any surpluses they generate in the hospital’s operations.
The illustrative scenarios examined in this paper took into account the scheduled cuts in Medicare’s payment updates, the insurance expansion, other types of payment cuts under Medicare, and the aging of the population. The scenarios did not, however, seek to account for various ways in which hospitals might respond to those financial pressures—so the resulting calculations are not a projection of what will happen under current law but instead are a measure of the financial challenges facing hospitals in the future.
The main implication of our analysis is that the magnitude of those challenges depends crucially on whether and to what extent hospitals can improve their productivity over time—that is, whether they can produce the same output (treatments and procedures) at the same quality with fewer inputs. In general, hospitals could use improvements in their productivity to increase the quality of care they provide (and
2
some evidence suggests that they have done so in the past). For this analysis, however, we assumed that increases in hospitals’ productivity would be used instead to limit the growth of their costs. Using that approach, the scenarios that we examined ultimately yielded the following results for hospitals that are subject to the rate reductions:
• If they were able to improve their productivity in line with productivity growth in the economy as a whole—by about 0.8 percent per year, on average, through 2025, according to CBO’s estimates—then the share of those hospitals with negative profit margins would increase to 41 percent in 2025, and the average profit margin would fall to 3.3 percent. That assumption regarding hospitals’ productivity growth is supported by some recent evidence.
• If, instead, those hospitals were able to improve their productivity by 0.4 percent per year, an assumption that some research supports, the share of them with negative profit margins would increase to 51 percent in 2025, and the average profit margin would fall to 1.6 percent.
• If those hospitals were unable to increase their productivity (or reduce cost growth in some other way), then the share of them with negative profit margins would increase to 60 percent in 2025, and the average profit margin would fall to negative 0.2 percent.
To hold their aggregate profit margins in 2025 at about the 2011 level of 6.0 percent, the hospitals that we examined would have to increase total revenues or reduce total costs by an additional 0.2 percent per year (if they can increase productivity at the economywide rate) or by an additional 0.5 percent per year (if they are unable to reduce costs through higher productivity). In those calculations, hospitals would have to increase revenues without increasing costs, reduce costs without reducing revenues, or achieve a combination of revenue increases and cost reductions. Contrary to what our calculations would indicate, hospitals’ margins continued to increase between 2011 and 2014. However, we cannot account for hospitals’ responses to the financial pressures they will face, so we cannot know how easy or difficult it will be for hospitals to maintain their margins in the future.
The finding that hospitals’ profitability depends centrally on their productivity growth reflects the fact that Medicare’s payment updates for hospitals now depend on the overall rate of productivity growth in the economy. The ACA generally specified that the payment update each year equal the estimated percentage change in the average price of hospitals’ inputs minus the estimated growth in productivity in the economy overall. (The ACA imposed additional reductions through 2019 that vary by year but are, on average, smaller than the productivity-related reductions; subsequent legislation has reduced those payments further.) Consequently, if hospitals were not able to increase their productivity by enough to fully offset those reductions in payment updates—or did not use those productivity gains to reduce the growth of their costs—then Medicare’s payments would not keep pace with the costs of treating those patients, and hospitals’ profit margins would decline (holding all other factors equal). For this analysis, we assumed that commercial payment rates would grow in parallel with hospitals’ costs but that Medicaid rates could grow more slowly because they may be constrained by the growth in Medicare’s rates, depending on the scenario.
In addition to scheduled cuts in Medicare’s payment updates, other factors will affect hospitals’ finances in competing ways. On the one hand, the aging of the population tends to reduce hospitals’ profit margins because people typically shift from private insurance to Medicare as their primary source of coverage at age 65, and Medicare’s payment rates for hospitals are generally lower than the rates that private health
3
insurance plans pay. On the other hand, the expansion of insurance coverage tends to improve hospitals’ finances, because of the increase in paying customers. However, CBO projects that the effect of the expansion on insurance coverage rates will be fully realized by 2025, and in that case it would not further improve hospitals’ finances in subsequent years.
Although those calculations may raise substantial concerns, we are not able to draw any conclusions in this paper about their likely implications for spending on, access to, or quality of care. Evaluating those effects would require projecting how hospitals will respond to the increased financial pressure and how those responses will affect access and quality, but in our judgment there is insufficient evidence from the research literature or other sources from which to develop such estimates. To the extent that hospitals face declining profit margins, they could try to improve those margins by increasing their revenues or by reducing their costs—perhaps by taking new steps to boost their productivity or by cutting costs in ways that might reduce the quality of care they provide. (Because the quality of health care is hard to measure properly, determining whether particular steps that hospitals take to control their costs have adverse effects on quality will be difficult.) If those strategies to cut costs or boost revenues proved unsuccessful, however, unprofitable hospitals could be forced to close or merge with another hospital. We conclude this paper by discussing those possible responses in general terms, but a full analysis of them and their implications for hospitals’ profit margins and spending on health care would be difficult and is beyond the scope of this paper.
2. Background on Hospitals’ Financial Performance and Productivity
Under the approach to setting Medicare payment updates specified in the ACA, the financial performance of hospitals will depend crucially on how their productivity growth compares with that of the economy as a whole, because that will help determine whether hospitals’ costs grow faster than or in line with Medicare’s payments. Measuring productivity growth in the hospital industry—and the health care sector in general—is challenging, however, and there is considerable uncertainty about the extent to which hospitals have increased their productivity in the past. This section examines hospitals’ financial performance over the past two decades, the limited evidence available on their productivity growth, and the challenges in measuring that growth.
We begin by examining historical data on hospitals’ profit margins and exploring the major components of hospitals’ revenues and costs. Throughout this paper, we focus on the total all-payer margin of hospitals, which for a given hospital is defined as its total revenues from all sources minus its total costs, divided by its total revenues. We focus on the total all-payer margin because our objective is to project the effects of the ACA’s reduction in Medicare payment updates, coverage expansions, and other factors on the overall financial performance of hospitals.
Some studies examine other measures of hospitals’ financial performance, such as the margin from serving Medicare patients and the margin from hospital operations, but those measures provide a less complete assessment of hospitals’ financial performance than the total all-payer margin. Those other measures are also subject to greater error and may reflect somewhat arbitrary accounting conventions. Estimating a hospital’s Medicare margin, for example, requires allocating the hospital’s costs across patients classified by type of insurance, which introduces considerable potential for misclassification.
4
Those allocations may also reflect accounting practices adopted when Medicare paid hospitals on the basis of their own reported costs, which provided an incentive to attribute costs to Medicare patients.
Historical Trends in Hospitals’ Margins According to data compiled by the American Hospital Association (AHA) from its annual survey of hospitals, the aggregate profit margin of “community” hospitals in the United States has averaged 5.8 percent over a recent 20 year period.
1 The AHA defines community hospitals as nonfederal short-term
general and specialty hospitals whose services are available to the general public. In 2013, there were about 5,700 hospitals of all types in the United States, about 5,000 of which were community hospitals.
2
The aggregate margin of community hospitals fluctuated over the past two decades but remained between 4 percent and 6 percent in most years (see Figure 1). The aggregate margin fell to a low of 2.6 percent in 2008 and reached a high of 8.3 percent in 2014 (the last year for which data are available). The decline in hospital margins in 2008 reflected the effects of the severe recession from 2007 to 2009 and was due both to a decline in hospitals’ operating revenues and substantial losses on hospitals’ financial holdings. Aside from the period surrounding the most recent recession, the aggregate margin of hospitals has generally been on an upward trajectory since 2001.
The share of hospitals with a negative profit margin has varied over the past 20 years, averaging about 25 percent (see Figure 1). Even in 2014, when hospitals had the highest aggregate margins at any time in the 20-year period, nearly one-quarter of them had a negative margin.
Many factors affect the financial performance of hospitals, but one important consideration is their form of ownership. Nearly 60 percent of the hospitals included in the AHA’s analysis are nonprofit hospitals, and about 20 percent each are for-profit and public hospitals. Unlike for-profit hospitals, nonprofit hospitals and public hospitals do not have shareholders and may not distribute any profits or “surpluses” that they generate to managers or members of the governing board. Instead, surpluses generated by nonprofit and public hospitals are expected to be reinvested in the hospitals’ operations. Thus, the managers of nonprofit and public hospitals have weaker incentives to control their costs than do the managers of for-profit hospitals and thus may be less likely to generate surpluses.
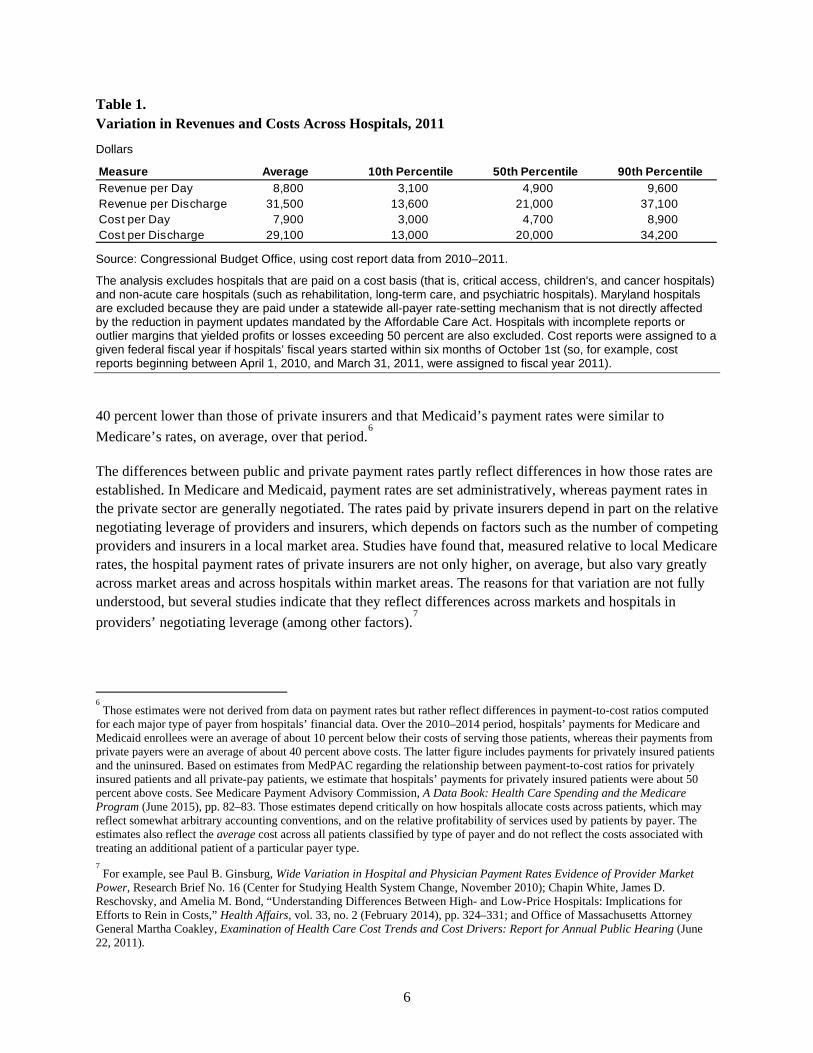
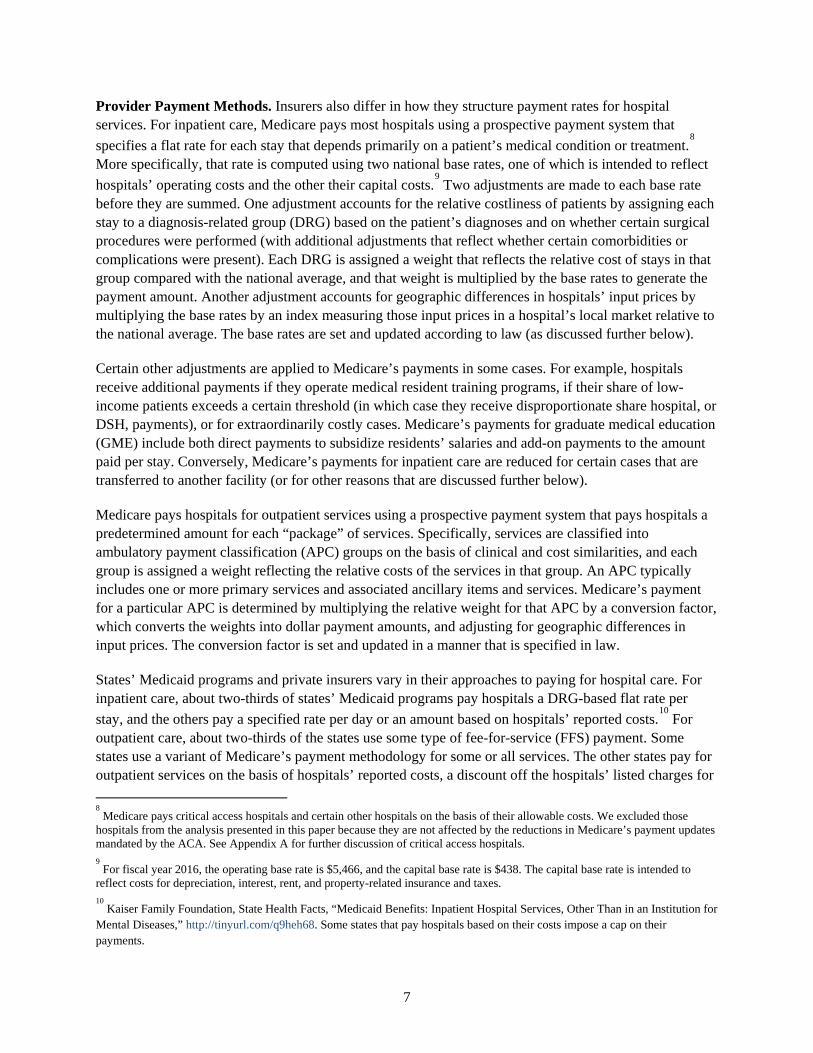
Components of Hospitals’ Revenues Payments for providing health care services are the main source of revenue for hospitals. Total revenue and average revenue per patient both vary greatly across hospitals and depend on the number and type of services provided and on the prices that hospitals are paid for those services. In 2011, the average revenue per discharge had a median value of $21,000. For hospitals at the 10th percentile of the revenue distribution, the average revenue per discharge was $13,600; for those at the 90th percentile, it was
1 American Hospital Association, Trendwatch Chartbook 2016. The estimates discussed in this section include hospital margins
over the 1994–2014 period. The aggregate margin of hospitals in a particular year is equal to the sum of total revenues of all hospitals minus the sum of total costs of all hospitals, expressed as a percentage of total revenues. It is equivalent to the weighted average margin, with each hospital weighted by its total revenues. 2 American Hospital Association, “Fast Facts on U.S. Hospitals” (January 2015). Hospitals that are excluded from the definition
of community hospitals are federal hospitals, psychiatric hospitals, long-term care hospitals, and hospital units of institutions (such as prison hospitals and college infirmaries). Federal hospitals primarily serve specific populations, such as active members of the armed forces, veterans, and Native Americans.
5
Figure 1. Hospitals’ Profit Margins, 1994 to 2014
Percent
Source: Congressional Budget Office, using data from the American Hospital Association’s annual survey of hospitals.
$37,100 (see Table 1).3 Hospitals typically receive higher payments (and incur higher costs) for providing
complex services such as cardiovascular surgery and neonatal intensive care than for providing more routine care. The amount of the payment for any service also depends greatly on a patient’s insurance coverage.
Provider Payment Rates. Hospitals generally receive lower payments for a given service for patients who are covered by Medicare or Medicaid than for patients with private insurance. A recent study found that Medicare’s payment rates for inpatient hospital services in 2012 were an average of 43 percent lower than private insurers’ rates and that Medicaid rates were 45 percent lower than private rates.
4 Another
study found that Medicare’s rates for inpatient care over the 2007–2011 period were an average of 47 percent lower than the rates paid by three large insurers.
5 Those findings are generally consistent with
data compiled by the American Hospital Association, which imply that Medicare’s payment rates for hospital services over the most recent five-year period available (2010–2014) were, on average, about
3 We constructed that estimate by dividing total revenues for each hospital by the number of inpatient discharges at the hospital.
The differences across hospitals in the estimated revenue per discharge reflect various factors, including differences in case mix, payer mix, payment rates, and the share of hospitals’ revenues that is derived from providing inpatient care. 4 See Thomas M. Selden and others, “The Growing Difference Between Public and Private Payment Rates for Inpatient Hospital
Care,” Health Affairs, vol. 34, no. 12 (December 2015), Appendix Table F.1, pp. 2147–2150. 5 Zack Cooper and others, The Price Ain’t Right? Hospital Prices and Health Spending on the Privately Insured, Working Paper
21815 (National Bureau of Economic Research, December 2015), p. 14.
0
2
4
6
8
10
12
14
0
5
10
15
20
25
30
35
1994 1996 1998 2000 2002 2004 2006 2008 2010 2012 2014
Hospitals With a Negative Margin (Left scale)
Aggregate Margin (Right scale)
6
Table 1. Variation in Revenues and Costs Across Hospitals, 2011
Dollars
Source: Congressional Budget Office, using cost report data from 2010–2011.
The analysis excludes hospitals that are paid on a cost basis (that is, critical access, children's, and cancer hospitals) and non-acute care hospitals (such as rehabilitation, long-term care, and psychiatric hospitals). Maryland hospitals are excluded because they are paid under a statewide all-payer rate-setting mechanism that is not directly affected by the reduction in payment updates mandated by the Affordable Care Act. Hospitals with incomplete reports or outlier margins that yielded profits or losses exceeding 50 percent are also excluded. Cost reports were assigned to a given federal fiscal year if hospitals’ fiscal years started within six months of October 1st (so, for example, cost reports beginning between April 1, 2010, and March 31, 2011, were assigned to fiscal year 2011).
40 percent lower than those of private insurers and that Medicaid’s payment rates were similar to Medicare’s rates, on average, over that period.
6
The differences between public and private payment rates partly reflect differences in how those rates are established. In Medicare and Medicaid, payment rates are set administratively, whereas payment rates in the private sector are generally negotiated. The rates paid by private insurers depend in part on the relative negotiating leverage of providers and insurers, which depends on factors such as the number of competing providers and insurers in a local market area. Studies have found that, measured relative to local Medicare rates, the hospital payment rates of private insurers are not only higher, on average, but also vary greatly across market areas and across hospitals within market areas. The reasons for that variation are not fully understood, but several studies indicate that they reflect differences across markets and hospitals in providers’ negotiating leverage (among other factors).
7
6 Those estimates were not derived from data on payment rates but rather reflect differences in payment-to-cost ratios computed
for each major type of payer from hospitals’ financial data. Over the 2010–2014 period, hospitals’ payments for Medicare and Medicaid enrollees were an average of about 10 percent below their costs of serving those patients, whereas their payments from private payers were an average of about 40 percent above costs. The latter figure includes payments for privately insured patients and the uninsured. Based on estimates from MedPAC regarding the relationship between payment-to-cost ratios for privately insured patients and all private-pay patients, we estimate that hospitals’ payments for privately insured patients were about 50 percent above costs. See Medicare Payment Advisory Commission, A Data Book: Health Care Spending and the Medicare Program (June 2015), pp. 82–83. Those estimates depend critically on how hospitals allocate costs across patients, which may reflect somewhat arbitrary accounting conventions, and on the relative profitability of services used by patients by payer. The estimates also reflect the average cost across all patients classified by type of payer and do not reflect the costs associated with treating an additional patient of a particular payer type. 7 For example, see Paul B. Ginsburg, Wide Variation in Hospital and Physician Payment Rates Evidence of Provider Market
Power, Research Brief No. 16 (Center for Studying Health System Change, November 2010); Chapin White, James D. Reschovsky, and Amelia M. Bond, “Understanding Differences Between High- and Low-Price Hospitals: Implications for Efforts to Rein in Costs,” Health Affairs, vol. 33, no. 2 (February 2014), pp. 324–331; and Office of Massachusetts Attorney General Martha Coakley, Examination of Health Care Cost Trends and Cost Drivers: Report for Annual Public Hearing (June 22, 2011).
MeasureRevenue per Day 8,800 3,100 4,900 9,600Revenue per Discharge 31,500 13,600 21,000 37,100Cost per Day 7,900 3,000 4,700 8,900Cost per Discharge 29,100 13,000 20,000 34,200
Average 10th Percentile 50th Percentile 90th Percentile
7
Provider Payment Methods. Insurers also differ in how they structure payment rates for hospital services. For inpatient care, Medicare pays most hospitals using a prospective payment system that specifies a flat rate for each stay that depends primarily on a patient’s medical condition or treatment.
8
More specifically, that rate is computed using two national base rates, one of which is intended to reflect hospitals’ operating costs and the other their capital costs.
9 Two adjustments are made to each base rate
before they are summed. One adjustment accounts for the relative costliness of patients by assigning each stay to a diagnosis-related group (DRG) based on the patient’s diagnoses and on whether certain surgical procedures were performed (with additional adjustments that reflect whether certain comorbidities or complications were present). Each DRG is assigned a weight that reflects the relative cost of stays in that group compared with the national average, and that weight is multiplied by the base rates to generate the payment amount. Another adjustment accounts for geographic differences in hospitals’ input prices by multiplying the base rates by an index measuring those input prices in a hospital’s local market relative to the national average. The base rates are set and updated according to law (as discussed further below).
Certain other adjustments are applied to Medicare’s payments in some cases. For example, hospitals receive additional payments if they operate medical resident training programs, if their share of low-income patients exceeds a certain threshold (in which case they receive disproportionate share hospital, or DSH, payments), or for extraordinarily costly cases. Medicare’s payments for graduate medical education (GME) include both direct payments to subsidize residents’ salaries and add-on payments to the amount paid per stay. Conversely, Medicare’s payments for inpatient care are reduced for certain cases that are transferred to another facility (or for other reasons that are discussed further below).
Medicare pays hospitals for outpatient services using a prospective payment system that pays hospitals a predetermined amount for each “package” of services. Specifically, services are classified into ambulatory payment classification (APC) groups on the basis of clinical and cost similarities, and each group is assigned a weight reflecting the relative costs of the services in that group. An APC typically includes one or more primary services and associated ancillary items and services. Medicare’s payment for a particular APC is determined by multiplying the relative weight for that APC by a conversion factor, which converts the weights into dollar payment amounts, and adjusting for geographic differences in input prices. The conversion factor is set and updated in a manner that is specified in law.
States’ Medicaid programs and private insurers vary in their approaches to paying for hospital care. For inpatient care, about two-thirds of states’ Medicaid programs pay hospitals a DRG-based flat rate per stay, and the others pay a specified rate per day or an amount based on hospitals’ reported costs.
10 For
outpatient care, about two-thirds of the states use some type of fee-for-service (FFS) payment. Some states use a variant of Medicare’s payment methodology for some or all services. The other states pay for outpatient services on the basis of hospitals’ reported costs, a discount off the hospitals’ listed charges for 8 Medicare pays critical access hospitals and certain other hospitals on the basis of their allowable costs. We excluded those
hospitals from the analysis presented in this paper because they are not affected by the reductions in Medicare’s payment updates mandated by the ACA. See Appendix A for further discussion of critical access hospitals. 9 For fiscal year 2016, the operating base rate is $5,466, and the capital base rate is $438. The capital base rate is intended to
reflect costs for depreciation, interest, rent, and property-related insurance and taxes. 10
Kaiser Family Foundation, State Health Facts, “Medicaid Benefits: Inpatient Hospital Services, Other Than in an Institution for Mental Diseases,” http://tinyurl.com/q9heh68. Some states that pay hospitals based on their costs impose a cap on their payments.
8
each service, or a combination of methods.11
The methods that private insurers use to pay for inpatient care vary by insurer and by market area and include a DRG-based flat rate per stay, a specified rate per day, and a discount off the hospitals’ listed charges for the services provided.
12 Less is known about how
private insurers pay for hospital outpatient care.
Composition of Hospital Revenues by Service Type. The main source of revenue for most hospitals is payment from insurers and patients for providing inpatient care. Over time, however, hospitals’ outpatient departments have accounted for an increasing share of the care that hospitals deliver and the revenues they receive. Over the past two decades, the share of hospitals’ patient-care revenues received for outpatient care has increased gradually from about 28 percent in 1994 to about 46 percent in 2014.
13
The trend toward hospitals providing a greater share of their patient services in an outpatient setting is occurring for several reasons. One is that medical technology has improved over time, and some tests and procedures that used to require an overnight stay are now less invasive, allowing patients to be treated on an outpatient basis. Another factor is hospitals’ acquisition of physicians’ practices: When that occurs, some services that are delivered in a physician’s office are counted as hospital outpatient services because the physician’s practice is owned by the hospital.
Other revenues come from various sources. Some hospitals operate other types of health care facilities, such as skilled nursing facilities and home health agencies, and receive patient care revenues from those services. In addition, hospitals receive revenues from operations other than patient care (such as cafeterias, gift shops, and parking) and from other sources, such as investment income and charitable contributions. On average, revenues from activities other than patient care accounted for about 6 percent of total hospital revenues in 2011.
Components of Hospitals’ Costs Total costs and average costs per patient vary greatly across hospitals. They depend on factors such as the size and composition of the staff, the size of the physical structure, the types of equipment that the hospital owns or leases, the supplies that are used, the prices that are paid for those and other inputs, and the complexity of both the patients treated and the care provided to them. In 2011, the median cost per hospital discharge was $20,000; hospitals at the 10th percentile of the cost distribution had a cost per discharge of $13,000, and those at the 90th percentile had a cost per discharge of $34,200 (see Table 1).
14
According to estimates from the Centers for Medicare & Medicaid Services (CMS), labor accounts for about two-thirds of hospitals’ total costs. Those labor costs include compensation for hospital employees and payment for services furnished by firms or individuals under contract to hospitals. Hospital
11
Kaiser Family Foundation, State Health Facts, “Medicaid Benefits: Outpatient Hospital Services,” http://tinyurl.com/qcjmdu7. 12
Paul B. Ginsburg, Wide Variation in Hospital and Physician Payment Rates Evidence of Provider Market Power, Research Brief No. 16 (Center for Studying Health System Change, November 2010). 13
American Hospital Association, Trendwatch Chartbook 2016. 14
We computed the average cost per discharge in an analogous manner as described above for the average revenue per discharge—namely, we divided each hospital’s total costs by the number of inpatient discharges at the hospital. Differences across hospitals in the average cost per discharge reflect differences in various factors, including differences in case mix, input prices, and the share of the hospital’s patient care that is provided on an inpatient basis.
9
employees include those in nursing and other health professions, administration, building maintenance, and food service. Hospitals employ some physicians—such as hospitalists, physicians employed in hospitals’ outpatient clinics, and physicians whose practices are owned by hospitals—and their salaries and other costs of practice are included in hospitals’ costs. (Payments to surgeons and anesthesiologists are typically made separately and are not counted as hospitals’ costs or revenues.)
In characterizing hospitals’ cost structure, analysts commonly separate out the portion of costs that represents uncompensated care, which consists of charity care and bad debt. Reflecting that accounting convention, the costs of uncompensated care are included in the measure of total costs used in this paper; they differ from other costs in that they represent activities for which hospitals receive no revenue. Charity care is care that is given for free with no expectation of payment, generally to uninsured or low-income patients who may not be able to pay for needed services. Nonprofit hospitals are required to provide community benefits in exchange for their tax exemptions, and those community benefits can include (but are not limited to) charity care. Hospitals incur bad debt when they receive no payment (or partial payment) after submitting bills for services they provided. Bad debt is typically incurred when insured or uninsured patients who were expected to pay all or part of their bill do not do so. A previous CBO report found that nonprofit hospitals provide somewhat more uncompensated care than for-profit hospitals, but far less than public hospitals.
15 That analysis also found that hospitals vary greatly in the
proportion of their total costs that represent uncompensated care. On average, uncompensated care represents less than 5 percent of hospitals’ costs.
Hospitals’ Productivity Growth The financial performance of hospitals in the future will depend crucially on their productivity growth—in particular, how their productivity growth compares with that of the economy as a whole. The ACA specified that the annual updates to Medicare’s payment rates for hospitals equal the estimated percentage change in the average prices of their inputs, such as labor and supplies, minus the 10-year moving average of growth in productivity in the economy overall. Under prior law, the update formula was based only on growth in input prices (though in the past, legislation had often reduced those updates by specified percentage points).
In general, productivity is a measure of the efficiency of an organization; it is defined as the output produced per unit of combined inputs (such as labor, capital, and materials).
16 Productivity growth
measures the extent to which a given amount of output of a given quality is produced using fewer inputs or a less costly mix of inputs over time. Measuring both the quantity and quality of output produced is essential for measuring changes in productivity, because productivity growth can be achieved by using the same or fewer inputs to increase the quantity produced, to improve the quality of the output, or to do both.
Considerable uncertainty surrounds the extent to which hospitals have increased their productivity in the past, largely because of the challenges of measuring productivity for the hospital industry—and for the
15
Congressional Budget Office, Nonprofit Hospitals and the Provision of Community Benefits (December 2006), www.cbo.gov/publication/18256. 16
That measure of productivity is known as multifactor productivity. A narrower measure of productivity is labor productivity, which measures output per hour of labor. We focus on the growth in hospitals’ multifactor productivity in this paper because it is a more comprehensive measure and is used in determining the updates to Medicare’s payment rates.
10
health care system more broadly. In particular, there are conceptual challenges in measuring output in health care as well as challenges in defining, measuring, and accounting for improvements in the quality of outputs and certain inputs.
17 As a result, the amount of productivity growth that hospitals are likely to
achieve in the future is highly uncertain. Moreover, the financial performance of hospitals will depend on the extent to which any increases in their productivity are achieved through reductions in the growth of their input costs (rather than through improvements in quality), because that will determine how their costs grow relative to their payments from Medicare.
Recent Studies. Studies that have estimated productivity growth in the hospital sector have found that it has been relatively low in the past. However, many analysts believe that those estimates understate the amount of productivity growth by hospitals because the measures of output that have been used generally do not account for improvements in the quality of care.
One study used two methods to measure hospitals’ productivity growth; they differed in the data sources and approaches they used to estimate hospitals’ inputs.
18 Estimates from both methods indicate that
hospitals’ productivity growth was negative during much of the period examined (1981–2005) but increased over that period. For the most recent 10-year period analyzed (1996–2005), the study estimated that hospitals’ average annual productivity growth was 0.3 percent under one method and 0.6 percent under the other method. The second method has the advantage of using more direct measures of hospital inputs, but in both cases the estimate was substantially lower than economywide growth in productivity during that period (approximately 1.5 percent).
Another study estimated that the productivity of hospitals and nursing and residential care facilities fell by an average annual rate of 0.9 percent from 1987 to 2006; however, the average annual decline in productivity was substantially smaller (0.1 percent) between 2000 and 2006.
19 Because the second study
combined hospitals with nursing and residential care facilities—which would be expected to have lower productivity growth than hospitals because of their lower reliance on technological innovation—we expect that those estimates understate the productivity growth of hospitals.
A more recent study estimated hospitals’ productivity growth for inpatient treatment of heart attacks, heart failure, and pneumonia and found that the results depended greatly on whether adjustments were made to account for trends in the quality of patients’ care.
20 Before making such adjustments, the authors
found that productivity growth for treatment of all three conditions was negative during the 2002–2011
17
For a discussion of the data and methodological issues that cast doubt on estimates of productivity growth in the health care sector, see Jack E. Triplett, “Health System Productivity,” in Sherry Glied and Peter Smith, eds., Oxford Handbook of Health Economics, Ch. 31 (April 2011); and Joseph P. Newhouse and Anna D. Sinaiko, “Productivity Adjustment in the Medicare Physician Fee Schedule Update” and “Estimates of Physician Productivity: An Evaluation,” both in Health Care Financing Review, vol. 29, no. 2 (Winter 2007–2008), pp. 5–14 and pp. 33–39. 18
See Jonathan D. Cylus and Bridgett A. Dickensheets, “Hospital Multifactor Productivity: A Presentation and Analysis of Two Methodologies,” Health Care Financing Review, vol. 29, no. 2 (Winter 2007–2008), pp. 49–64. 19
See Michael J. Harper and others, “Nonmanufacturing Industry Contributions to Multifactor Productivity,” Monthly Labor Review, vol. 133, no. 6 (June 2010), pp. 16–31. As that article notes, “a negative productivity trend may be an indication that something is amiss in the measurement process.” 20
John A. Romley, Dana P. Goldman, and Neeraj Sood, “U.S. Hospitals Experienced Substantial Productivity Growth During 2002–11,” Health Affairs, vol. 34, no. 3 (February 2015), pp. 511–518.
11
period; estimated annual productivity growth during that period ranged from negative 0.4 percent for treatment of pneumonia to negative 0.9 percent for treatment of heart failure. However, the authors then sought to account for trends in the severity of illness and in outcomes in order to measure the gains that had occurred over time in the quality of care. (Specifically, they measured changes in the rates of mortality and unplanned readmissions within 30 days of discharge to capture the degree to which patients’ health improved as a result of their treatment.) After making those adjustments, the authors found that the estimated annual rate of productivity growth for treatment of all three conditions became positive—with estimates ranging from 0.6 percent for heart failure to 1.9 percent for pneumonia.
Although those estimates were limited to an analysis of inpatient care for three prevalent conditions, they suggest that productivity growth in hospitals might be faster than that implied by the previous studies mentioned above. At the same time, the finding that measured productivity growth became positive only after adjusting for trends in patients’ outcomes suggests that hospitals would have to improve their future productivity in a different manner than they have in the past—that is, by reducing treatment costs per admission rather than by improving the quality of care. If that happens, patient outcomes and health may improve more slowly in the future than they have in the past.
The estimates of hospitals’ productivity growth from those studies—and the other sources of evidence discussed below—reflect the experience of hospitals in light of the financial pressures they have faced and their responses to those pressures. In the past, those pressures have included the incentives to contain costs created under Medicare’s prospective payment systems for hospital inpatient and outpatient care, similar payment systems adopted by private insurers, and actions by policymakers to hold the updates in Medicare’s payment rates in some years below the projected increase in the prices of hospitals’ inputs.
Other Sources of Evidence. Other evidence also suggests that hospitals may have achieved greater productivity gains in the past than some of the estimates from the earlier studies imply (or that hospitals may have restrained the growth of their costs in some other way). Whether those pressures were greater or less than the ones that hospitals are likely to face in the future is difficult to determine, but examining that evidence is useful nevertheless.
For example, policymakers have periodically enacted legislation reducing Medicare’s payment update for hospitals (and other providers) to an amount lower than the estimated percentage increase in their input prices. Moreover, CMS has used its regulatory authority to reduce payment updates for various reasons. Between 1991 and 2011, Medicare’s payment update for hospitals (and other Part A providers) grew at roughly the same rate as general inflation, on average, whereas providers’ input prices grew about 1 percentage point faster than general inflation.
21 Over the same period, data compiled by the American
Hospital Association indicate that private-sector payment rates grew at about the same rate as Medicare’s rates, on average, and that average profit margins for hospitals were higher in 2011 (at about 7 percent) than in the early 1990s (when margins were between 4 percent and 5 percent).
22 Taken together, those
findings suggest that, on average, hospitals have been able to keep growth in costs in line with overall
21
Technical Review Panel on the Medicare Trustees Reports, Review of Assumptions and Methods of the Medicare Trustees Financial Projections (December 2012), pp. 60–61, http://tinyurl.com/krz6qne. For an earlier discussion of this evidence, see Congressional Budget Office, The 2015 Long-Term Budget Outlook (June 2015), pp. 38–40, www.cbo.gov/publication/50250. 22
American Hospital Association, Trendwatch Chartbook 2014.
12
inflation over the past two decades—and thus seem to have been able to accommodate payment updates substantially lower than the growth of their input prices.
At a more conceptual level, there is debate about whether hospitals can reasonably be expected to improve their productivity. Some analysts believe that the hospital industry is likely to achieve lower productivity growth than the economy as a whole because it is a labor-intensive industry. Those analysts point to the observation that labor-intensive industries are likely to have low measured rates of productivity growth—a phenomenon often called “Baumol’s cost disease” after the economist who first identified the issue. However, other experts have argued that “the health care sector is too technologically dynamic to fit the model underlying Baumol’s cost disease hypothesis.”
23 Perhaps supporting that view,
the share of hospitals’ costs that go to labor compensation is similar to the share observed in the economy as a whole—between 60 percent and 65 percent—so it is not obvious that the hospital sector is particularly labor-intensive. Seen in that light, it may be more reasonable to expect that hospitals’ productivity will grow in line with the economywide average (which depends strongly on the rate of productivity growth in the service sectors). But whether hospitals can actually achieve such productivity growth remains uncertain.
Additional evidence that hospitals might be able to absorb the ACA’s reductions in Medicare’s payment updates comes from international comparisons, which show that prices for hospital services are generally much higher in the United States than in other developed countries.
24 The technical review panel for the
Medicare trustees recently noted that, even after 75 years of reduced payment updates under the ACA, Medicare’s payment rates to hospitals paid under the prospective payment system would be similar to those in some other developed countries.
25 However, the implications of such a development for access to
care and quality of care in the United States are highly uncertain.
Constraints Regarding Quality of Care. To keep their costs in line with scheduled payment updates, hospitals do not have to improve their productivity—instead, they could simply cut their costs and allow the quality of care, patient experience, and outcomes to decline correspondingly (which would not represent an increase in productivity or efficiency). Because the quality of health care can be very hard to define, let alone measure correctly, distinguishing steps that eliminate waste from steps that reduce quality can be difficult in practice.
Even so, hospitals may be constrained in their efforts to cut costs by new requirements regarding the quality of care. The ACA established several new programs (discussed below) that impose penalties on hospitals that do not meet certain targets for the quality of care. In response to those programs, as well as quality initiatives by other payers, hospitals may need to devote additional resources to improve quality on the dimensions that are monitored by Medicare and other payers. Those efforts may also constrain the ways in which hospitals can improve their productivity through reductions in the growth of their costs
23
Technical Review Panel on the Medicare Trustees Reports, Review of Assumptions and Methods of the Medicare Trustees Financial Projections (December 2012), p. 47; http://tinyurl.com/krz6qne. 24
See International Federation of Health Plans, 2013 Comparative Price Report, www.ifhp.com/1404121; and Francette Koechlin and others, “Comparing Price Levels of Hospital Services Across Countries: Results of a Pilot Study,” OECD Health Working Paper No. 53 (Organisation for Economic Co-operation and Development, July 8, 2010). 25
Technical Review Panel on the Medicare Trustees Reports, Review of Assumptions and Methods of the Medicare Trustees Financial Projections (December 2012), p. 84, http://tinyurl.com/krz6qne.
13
rather than increases in care quality. How binding those constraints prove to be for a given hospital will depend in part on what quality measures are used and in part on how other hospitals respond, because some measures rate hospital quality relative to other hospitals.
3. Data and Methods In this section, we discuss the data used in this study, examine the characteristics of the hospitals included in the analysis, and present estimates of those hospitals’ financial performance in 2011 (the base year for the projections). We conclude by discussing our approach to the projections.
Hospitals’ Cost Reports The analysis relies primarily on data from cost reports that hospitals are required to submit annually to the Centers for Medicare & Medicaid Services. The cost reports contain information on hospital characteristics, utilization, expenses, and revenues. They are long and complex, and only certain fields—those related to CMS payments to hospitals—are audited. As a result, although the reports are the most complete and thorough source of data on hospital characteristics and financial information that is available, some data are probably reported inaccurately. Moreover, we were not able to determine whether certain data are more likely to be accurately reported than others, or whether the accuracy and completeness of the data vary by type of hospital ownership or along other dimensions.
26
Hospitals Included in the Analysis We restricted the analysis to acute care hospitals that are paid under Medicare’s inpatient and outpatient prospective payment systems, because those hospitals are directly affected by the ACA’s reduction in payment updates. Specifically, we began with the 5,831 hospitals that participated in Medicare in 2011 (and thus filed Medicare cost reports for that year), and we narrowed the sample as follows (see Table 2):
• We excluded 1,265 “critical access hospitals” and a total of 77 cancer hospitals and children’s hospitals, because they are paid by Medicare on the basis of their allowable costs and are not affected by the reduction in payment updates. (Hospitals must be small and meet certain other criteria to be designated as critical access hospitals under Medicare. They are discussed further in Appendix A.)
• We also excluded a total of 1,135 other types of hospitals (such as rehabilitation, long-term, and psychiatric hospitals), because this study focuses on acute care hospitals.
27
• We excluded an additional 45 hospitals in Maryland, because they are paid under a statewide all-payer rate-setting mechanism that is affected by the reduction in payment updates mandated by the ACA in an indirect way (through constraints on that mechanism’s effects on the federal budget).
26
For example, although hospitals are instructed to report all contributions and government transfers, some of those revenues may go unreported. 27
Rehabilitation, long-term, and psychiatric hospitals are paid under separate prospective payment systems; even though their payment updates were reduced under the ACA, they are outside the scope of this study. The 1,135 hospitals excluded in this step also include 16 religious nonmedical hospitals, at which Medicare only covers certain services, and 10 “other” hospitals that do not fall into any of the aforementioned categories.

14
Table 2. Sample Selection
Number of Hospitals
Source: Congressional Budget Office, using cost report data from 2010–2011.
Critical access hospitals, cancer hospitals, and children’s hospitals are excluded because they are paid on a cost basis. Other non-acute care hospitals include religious nonmedical hospitals, substance abuse hospitals, and "other" hospitals that do not fall into any of the aforementioned categories. Maryland hospitals are excluded because they are paid under a statewide all-payer rate-setting mechanism that is not directly affected by the reduction in payment updates mandated by the Affordable Care Act. The data limitations that led us to exclude some hospitals from the sample include: incomplete reports, cost reports covering only a portion of a year, or extreme values that we did not regard as credible (yielding profits or losses exceeding 50 percent).
• After imposing those restrictions on the sample, we excluded 250 other hospitals because of data limitations, such as missing or incomplete information on revenues and expenses, extreme values that we did not regard as credible (yielding profits or losses exceeding 50 percent), and cost reports covering only a portion of a year.
Imposing those restrictions yielded a final sample of 3,059 hospitals. Those hospitals represent about 90 percent of the total revenues, costs, and patient days for all acute care hospitals.
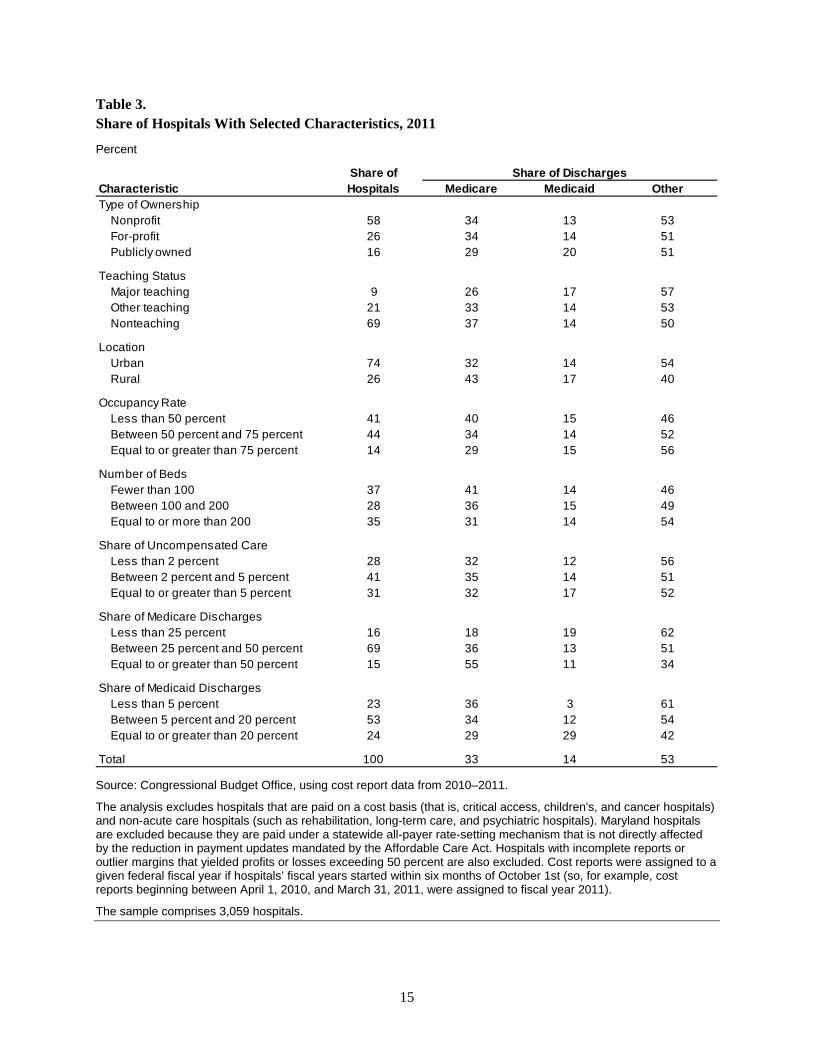
Of the hospitals in the final sample, 58 percent are nonprofit hospitals, 26 percent are for-profit hospitals, and 16 percent are publicly owned (see Table 3). The public hospitals are owned by states, counties, cities, and other government entities. Nonprofit hospitals tend to be larger than other hospitals; although they constitute 58 percent of hospitals in our sample, they account for 72 percent of total hospital revenues. For-profit hospitals account for 13 percent of total revenues and public hospitals, 15 percent. Nine percent of the hospitals in the sample are major teaching hospitals, 21 percent are other teaching hospitals, and 69 percent are nonteaching hospitals.
28
The hospitals in our sample differ along other dimensions as well. About three-quarters of the hospitals are located in urban areas. The great majority of hospitals had an occupancy rate of less than 75 percent, and those hospitals were split about equally between those with an occupancy rate of less than 50 percent
28
We defined major teaching hospitals as those in which the ratio of interns and residents to beds is at least 0.25, and we defined other teaching hospitals as those in which that ratio is less than 0.25 but greater than zero. Those are the thresholds used by MedPAC in its analyses; for example, see Medicare Payment Advisory Commission, A Data Book: Health Care Spending and the Medicare Program (June 2014). Thus, a 400-bed hospital would be considered a major teaching hospital if it had 100 or more interns and residents on staff.
Hospitals in the 2011 Cost Reports 5,831
Excluded CategoriesCritical Access Hospitals 1,265Cancer hospitals and children's hospitals 77Rehabilitation, long-term, psychiatric, and other non-acute care hospitals 1,135Acute care hospitals in Maryland 45Remaining hospitals with data limitations 250_____
Excluded Hospitals 2,772
Hospitals in This Analysis 3,059
15
Table 3. Share of Hospitals With Selected Characteristics, 2011
Percent
Source: Congressional Budget Office, using cost report data from 2010–2011.
The analysis excludes hospitals that are paid on a cost basis (that is, critical access, children's, and cancer hospitals) and non-acute care hospitals (such as rehabilitation, long-term care, and psychiatric hospitals). Maryland hospitals are excluded because they are paid under a statewide all-payer rate-setting mechanism that is not directly affected by the reduction in payment updates mandated by the Affordable Care Act. Hospitals with incomplete reports or outlier margins that yielded profits or losses exceeding 50 percent are also excluded. Cost reports were assigned to a given federal fiscal year if hospitals’ fiscal years started within six months of October 1st (so, for example, cost reports beginning between April 1, 2010, and March 31, 2011, were assigned to fiscal year 2011).
The sample comprises 3,059 hospitals.
Characteristic Medicare Medicaid OtherType of Ownership
Nonprofit 58 34 13 53For-profit 26 34 14 51Publicly owned 16 29 20 51
Teaching StatusMajor teaching 9 26 17 57Other teaching 21 33 14 53Nonteaching 69 37 14 50
LocationUrban 74 32 14 54Rural 26 43 17 40
Occupancy RateLess than 50 percent 41 40 15 46Between 50 percent and 75 percent 44 34 14 52Equal to or greater than 75 percent 14 29 15 56
Number of BedsFewer than 100 37 41 14 46Between 100 and 200 28 36 15 49Equal to or more than 200 35 31 14 54
Share of Uncompensated CareLess than 2 percent 28 32 12 56Between 2 percent and 5 percent 41 35 14 51Equal to or greater than 5 percent 31 32 17 52
Share of Medicare DischargesLess than 25 percent 16 18 19 62Between 25 percent and 50 percent 69 36 13 51Equal to or greater than 50 percent 15 55 11 34
Share of Medicaid DischargesLess than 5 percent 23 36 3 61Between 5 percent and 20 percent 53 34 12 54Equal to or greater than 20 percent 24 29 29 42
Total 100 33 14 53
Share of DischargesShare of Hospitals
16
and those with an occupancy rate of between 50 percent and 75 percent.29
The hospitals in the sample reflect a range of sizes: 37 percent have fewer than 100 beds, and 35 percent have more than 200 beds. The hospitals also vary in the share of their costs that are for uncompensated care: 28 percent report that uncompensated care accounts for less than 2 percent of their costs, and 31 percent report that uncompensated care accounts for more than 5 percent of their costs. In the cost reports, each hospital’s cost of delivering uncompensated care is calculated by multiplying the reported charges for that care by the hospital’s overall cost-to-charge ratio. Uncompensated care is thus measured using hospitals’ average costs rather than charges (which are often substantially higher than costs).
Fee-for-service Medicare patients accounted for a third of all discharges in the sample of hospitals in 2011, Medicaid patients accounted for 14 percent, and other patients—most of whom were privately insured and some of whom were enrolled in Medicare Advantage (MA)—accounted for 53 percent. (The Medicare data on discharges and revenues in the cost reports capture information on FFS enrollees only, whereas the corresponding Medicaid data capture information on both FFS and managed care enrollees.) The share of discharges accounted for by FFS Medicare and Medicaid patients varied greatly across hospitals. The FFS Medicare share of discharges is below 25 percent for 16 percent of hospitals and above 50 percent for an additional 15 percent of hospitals, whereas the Medicaid share of discharges is below 5 percent for 23 percent of hospitals and above 20 percent for an additional 24 percent of hospitals. The hospitals in which FFS Medicare patients constituted the highest share of discharges in 2011 were rural, small, and had low occupancy rates. Public hospitals had the highest share of Medicaid discharges.
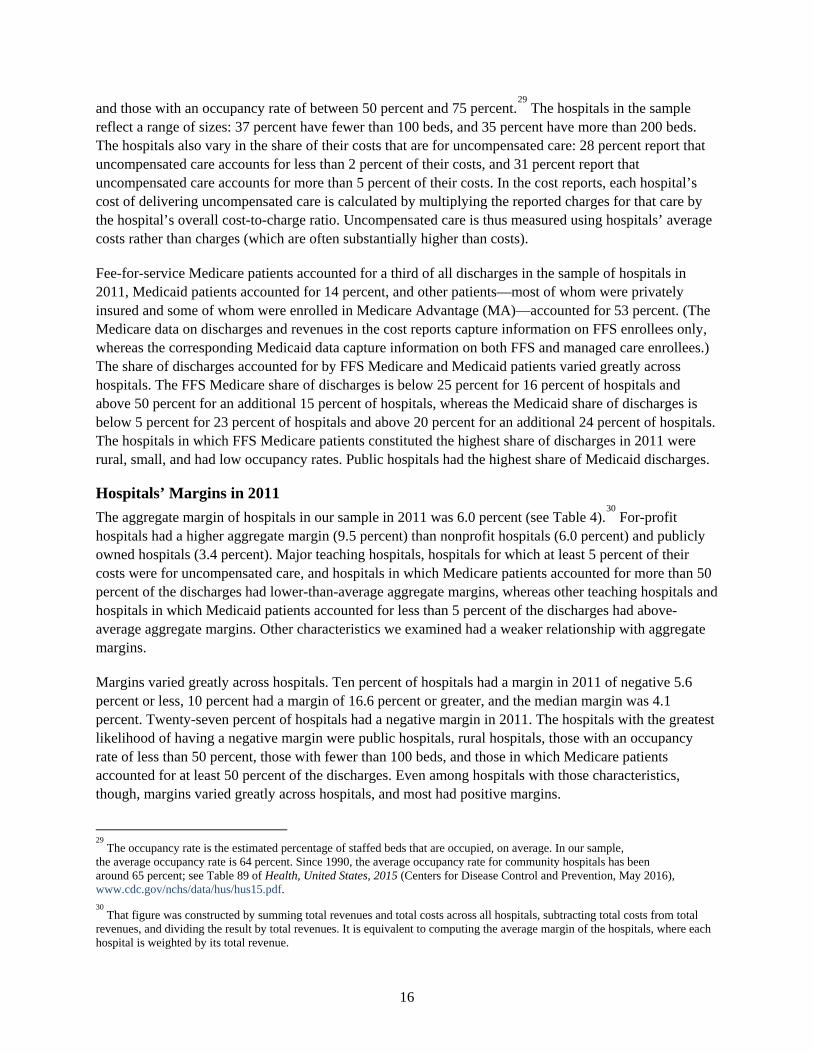
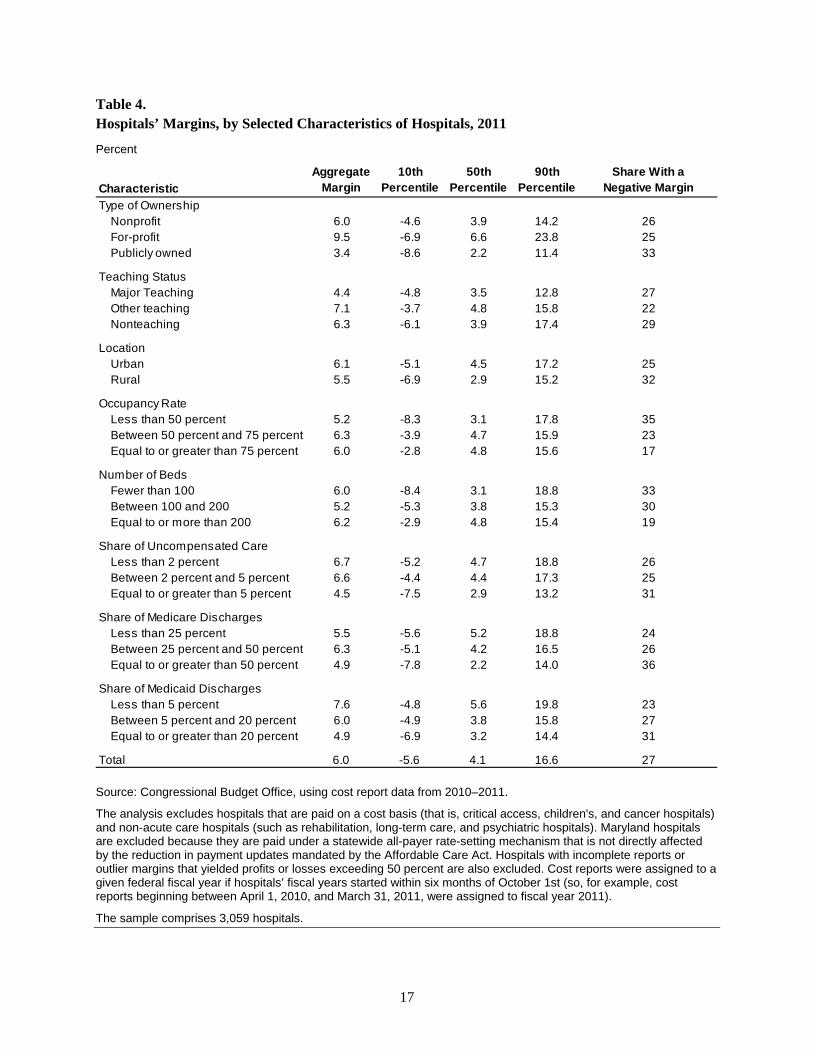
Hospitals’ Margins in 2011 The aggregate margin of hospitals in our sample in 2011 was 6.0 percent (see Table 4).
30 For-profit
hospitals had a higher aggregate margin (9.5 percent) than nonprofit hospitals (6.0 percent) and publicly owned hospitals (3.4 percent). Major teaching hospitals, hospitals for which at least 5 percent of their costs were for uncompensated care, and hospitals in which Medicare patients accounted for more than 50 percent of the discharges had lower-than-average aggregate margins, whereas other teaching hospitals and hospitals in which Medicaid patients accounted for less than 5 percent of the discharges had above-average aggregate margins. Other characteristics we examined had a weaker relationship with aggregate margins.
Margins varied greatly across hospitals. Ten percent of hospitals had a margin in 2011 of negative 5.6 percent or less, 10 percent had a margin of 16.6 percent or greater, and the median margin was 4.1 percent. Twenty-seven percent of hospitals had a negative margin in 2011. The hospitals with the greatest likelihood of having a negative margin were public hospitals, rural hospitals, those with an occupancy rate of less than 50 percent, those with fewer than 100 beds, and those in which Medicare patients accounted for at least 50 percent of the discharges. Even among hospitals with those characteristics, though, margins varied greatly across hospitals, and most had positive margins.
29
The occupancy rate is the estimated percentage of staffed beds that are occupied, on average. In our sample, the average occupancy rate is 64 percent. Since 1990, the average occupancy rate for community hospitals has been around 65 percent; see Table 89 of Health, United States, 2015 (Centers for Disease Control and Prevention, May 2016), www.cdc.gov/nchs/data/hus/hus15.pdf. 30
That figure was constructed by summing total revenues and total costs across all hospitals, subtracting total costs from total revenues, and dividing the result by total revenues. It is equivalent to computing the average margin of the hospitals, where each hospital is weighted by its total revenue.
17
Table 4. Hospitals’ Margins, by Selected Characteristics of Hospitals, 2011
Percent
Source: Congressional Budget Office, using cost report data from 2010–2011.
The analysis excludes hospitals that are paid on a cost basis (that is, critical access, children's, and cancer hospitals) and non-acute care hospitals (such as rehabilitation, long-term care, and psychiatric hospitals). Maryland hospitals are excluded because they are paid under a statewide all-payer rate-setting mechanism that is not directly affected by the reduction in payment updates mandated by the Affordable Care Act. Hospitals with incomplete reports or outlier margins that yielded profits or losses exceeding 50 percent are also excluded. Cost reports were assigned to a given federal fiscal year if hospitals’ fiscal years started within six months of October 1st (so, for example, cost reports beginning between April 1, 2010, and March 31, 2011, were assigned to fiscal year 2011).
The sample comprises 3,059 hospitals.
Aggregate Margin
10th Percentile
50th Percentile
90th Percentile
Share With aNegative Margin
Type of Ownership Nonprofit 6.0 -4.6 3.9 14.2 26For-profit 9.5 -6.9 6.6 23.8 25Publicly owned 3.4 -8.6 2.2 11.4 33
Teaching StatusMajor Teaching 4.4 -4.8 3.5 12.8 27Other teaching 7.1 -3.7 4.8 15.8 22Nonteaching 6.3 -6.1 3.9 17.4 29
LocationUrban 6.1 -5.1 4.5 17.2 25Rural 5.5 -6.9 2.9 15.2 32
Occupancy RateLess than 50 percent 5.2 -8.3 3.1 17.8 35Between 50 percent and 75 percent 6.3 -3.9 4.7 15.9 23Equal to or greater than 75 percent 6.0 -2.8 4.8 15.6 17
Number of BedsFewer than 100 6.0 -8.4 3.1 18.8 33Between 100 and 200 5.2 -5.3 3.8 15.3 30Equal to or more than 200 6.2 -2.9 4.8 15.4 19
Share of Uncompensated CareLess than 2 percent 6.7 -5.2 4.7 18.8 26Between 2 percent and 5 percent 6.6 -4.4 4.4 17.3 25Equal to or greater than 5 percent 4.5 -7.5 2.9 13.2 31
Share of Medicare DischargesLess than 25 percent 5.5 -5.6 5.2 18.8 24Between 25 percent and 50 percent 6.3 -5.1 4.2 16.5 26Equal to or greater than 50 percent 4.9 -7.8 2.2 14.0 36
Share of Medicaid DischargesLess than 5 percent 7.6 -4.8 5.6 19.8 23Between 5 percent and 20 percent 6.0 -4.9 3.8 15.8 27Equal to or greater than 20 percent 4.9 -6.9 3.2 14.4 31
Total 6.0 -5.6 4.1 16.6 27
Characteristic
18
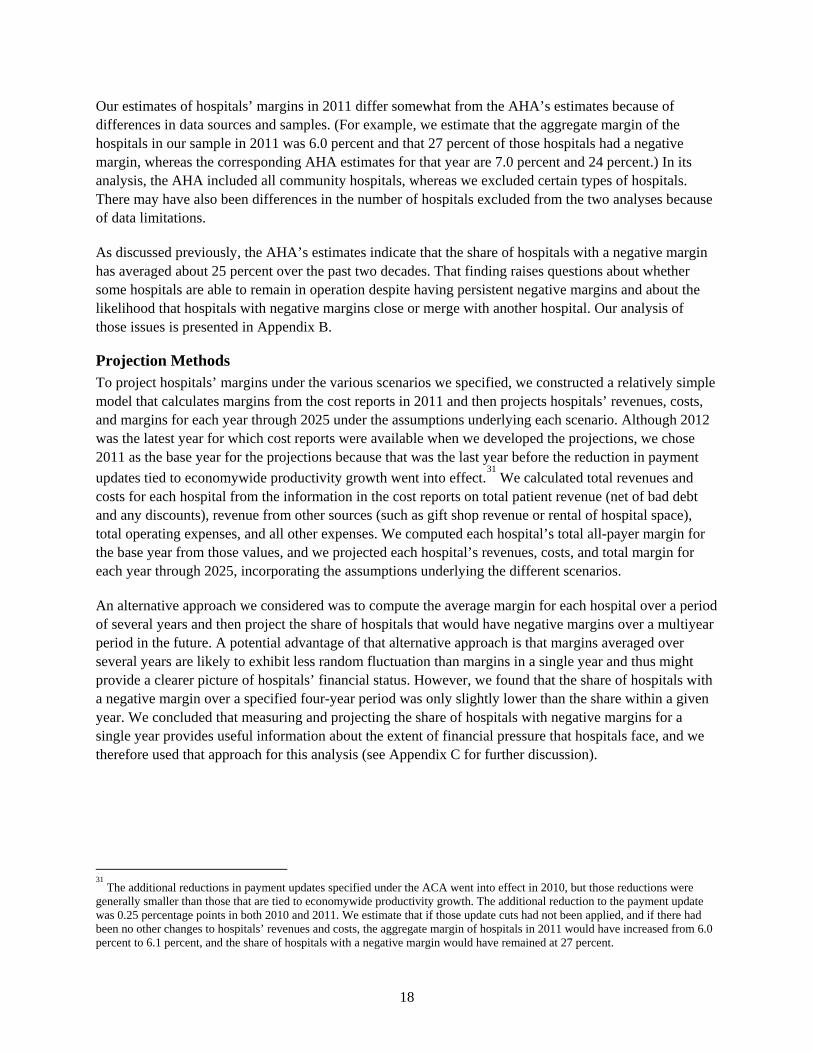
Our estimates of hospitals’ margins in 2011 differ somewhat from the AHA’s estimates because of differences in data sources and samples. (For example, we estimate that the aggregate margin of the hospitals in our sample in 2011 was 6.0 percent and that 27 percent of those hospitals had a negative margin, whereas the corresponding AHA estimates for that year are 7.0 percent and 24 percent.) In its analysis, the AHA included all community hospitals, whereas we excluded certain types of hospitals. There may have also been differences in the number of hospitals excluded from the two analyses because of data limitations.
As discussed previously, the AHA’s estimates indicate that the share of hospitals with a negative margin has averaged about 25 percent over the past two decades. That finding raises questions about whether some hospitals are able to remain in operation despite having persistent negative margins and about the likelihood that hospitals with negative margins close or merge with another hospital. Our analysis of those issues is presented in Appendix B.
Projection Methods To project hospitals’ margins under the various scenarios we specified, we constructed a relatively simple model that calculates margins from the cost reports in 2011 and then projects hospitals’ revenues, costs, and margins for each year through 2025 under the assumptions underlying each scenario. Although 2012 was the latest year for which cost reports were available when we developed the projections, we chose 2011 as the base year for the projections because that was the last year before the reduction in payment updates tied to economywide productivity growth went into effect.
31 We calculated total revenues and
costs for each hospital from the information in the cost reports on total patient revenue (net of bad debt and any discounts), revenue from other sources (such as gift shop revenue or rental of hospital space), total operating expenses, and all other expenses. We computed each hospital’s total all-payer margin for the base year from those values, and we projected each hospital’s revenues, costs, and total margin for each year through 2025, incorporating the assumptions underlying the different scenarios.
An alternative approach we considered was to compute the average margin for each hospital over a period of several years and then project the share of hospitals that would have negative margins over a multiyear period in the future. A potential advantage of that alternative approach is that margins averaged over several years are likely to exhibit less random fluctuation than margins in a single year and thus might provide a clearer picture of hospitals’ financial status. However, we found that the share of hospitals with a negative margin over a specified four-year period was only slightly lower than the share within a given year. We concluded that measuring and projecting the share of hospitals with negative margins for a single year provides useful information about the extent of financial pressure that hospitals face, and we therefore used that approach for this analysis (see Appendix C for further discussion).
31
The additional reductions in payment updates specified under the ACA went into effect in 2010, but those reductions were generally smaller than those that are tied to economywide productivity growth. The additional reduction to the payment update was 0.25 percentage points in both 2010 and 2011. We estimate that if those update cuts had not been applied, and if there had been no other changes to hospitals’ revenues and costs, the aggregate margin of hospitals in 2011 would have increased from 6.0 percent to 6.1 percent, and the share of hospitals with a negative margin would have remained at 27 percent.
19
4. Projections of Hospitals’ Margins Under Four Illustrative Scenarios
In this section, we present projections of hospitals’ margins over the next decade under various scenarios that incorporate the effects of different federal policies and reflect different assumptions about the growth of hospitals’ revenues and costs. The scenarios generally build on each other, so each scenario maintains all of the assumptions underlying the previous scenario except for one or more key changes that are highlighted.
Scenario 1 projects the effect of the reduction in Medicare’s payment updates on hospitals’ margins, holding constant other key factors, such as the share of the population that is uninsured (see Table 5). Additional scenarios incorporate other provisions of the ACA and other policy changes that have affected payments to hospitals. For each scenario, we project hospitals’ margins under different assumptions about their productivity growth that reflect a range of plausible outcomes. We begin with a discussion of factors that underlie the scenarios.
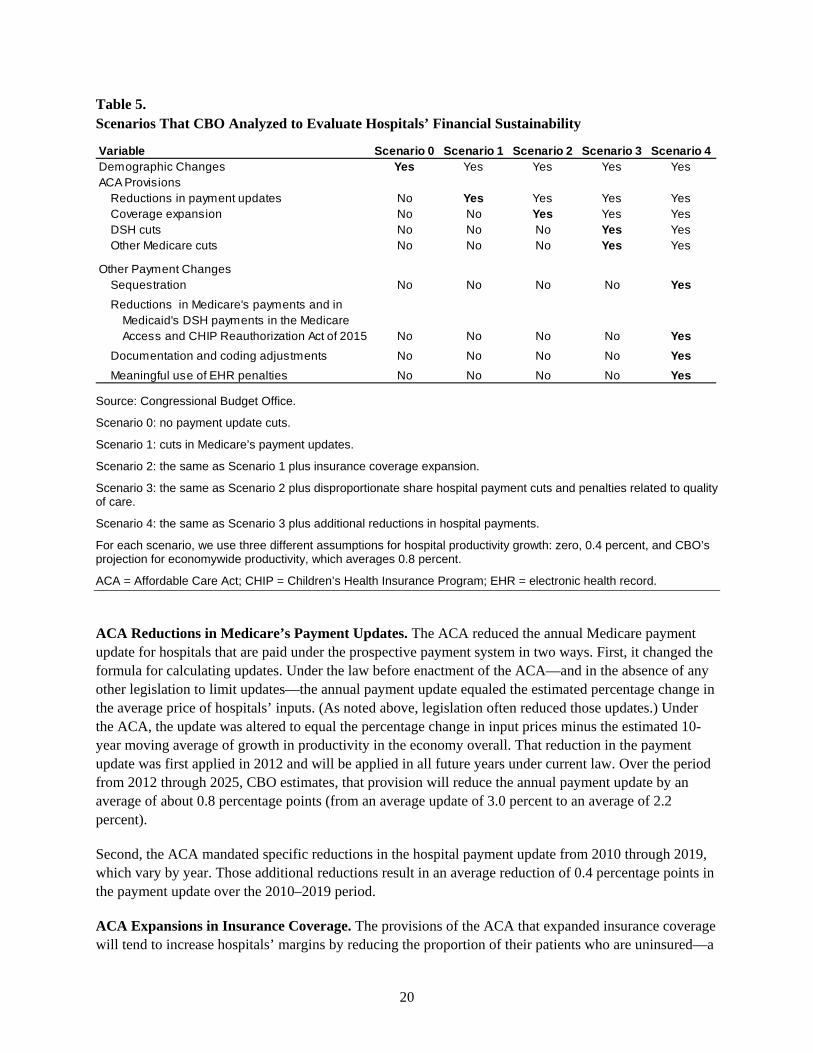
Factors Included in the Illustrative Scenarios Each scenario analyzed in this paper incorporates the effects of demographic changes—primarily the aging of the population, which affects the share of patients covered by Medicare or by private insurance. The scenarios specified for this paper also incorporate (in a stepwise manner) CBO’s projections about the effects of the following provisions of the ACA:
• Reductions in Medicare’s payment updates;
• The insurance coverage expansion;
• Reductions in DSH payments, which are additional payments under Medicare and Medicaid for hospitals whose share of low-income patients exceeds a specified threshold; and
• Other ACA provisions—specifically, the penalties for hospitals that do not meet certain targets for quality of care.
After projecting the effects of those ACA provisions on hospitals’ financial performance, we analyzed a final scenario that incorporates certain reductions in Medicare’s hospital payments and additional reductions in Medicaid’s DSH payments that were not part of the ACA. The projections for that scenario reflect the combined effect on hospitals’ margins of all the policies examined in this paper.
Demographic Changes. The projections for all of the scenarios presented in this paper incorporate the effects of the projected growth and aging of the population. The major demographic change that will occur over the projection period is the aging of the baby-boom generation, which will affect hospitals’ finances through two mechanisms: First, the number of people covered by Medicare will increase substantially; and second, the use of hospital services is expected to increase, because people tend to use more of those services as they age. On balance, we expect that those developments will reduce hospitals’ margins, because the share of hospital patients covered by Medicare will rise, and Medicare’s payment rates for hospitals tend to be substantially lower than those of private insurers.
20
Table 5. Scenarios That CBO Analyzed to Evaluate Hospitals’ Financial Sustainability
Source: Congressional Budget Office.
Scenario 0: no payment update cuts.
Scenario 1: cuts in Medicare’s payment updates.
Scenario 2: the same as Scenario 1 plus insurance coverage expansion.
Scenario 3: the same as Scenario 2 plus disproportionate share hospital payment cuts and penalties related to quality of care.
Scenario 4: the same as Scenario 3 plus additional reductions in hospital payments.
For each scenario, we use three different assumptions for hospital productivity growth: zero, 0.4 percent, and CBO’s projection for economywide productivity, which averages 0.8 percent.
ACA = Affordable Care Act; CHIP = Children’s Health Insurance Program; EHR = electronic health record.
ACA Reductions in Medicare’s Payment Updates. The ACA reduced the annual Medicare payment update for hospitals that are paid under the prospective payment system in two ways. First, it changed the formula for calculating updates. Under the law before enactment of the ACA—and in the absence of any other legislation to limit updates—the annual payment update equaled the estimated percentage change in the average price of hospitals’ inputs. (As noted above, legislation often reduced those updates.) Under the ACA, the update was altered to equal the percentage change in input prices minus the estimated 10-year moving average of growth in productivity in the economy overall. That reduction in the payment update was first applied in 2012 and will be applied in all future years under current law. Over the period from 2012 through 2025, CBO estimates, that provision will reduce the annual payment update by an average of about 0.8 percentage points (from an average update of 3.0 percent to an average of 2.2 percent).
Second, the ACA mandated specific reductions in the hospital payment update from 2010 through 2019, which vary by year. Those additional reductions result in an average reduction of 0.4 percentage points in the payment update over the 2010–2019 period.
ACA Expansions in Insurance Coverage. The provisions of the ACA that expanded insurance coverage will tend to increase hospitals’ margins by reducing the proportion of their patients who are uninsured—a
Variable Scenario 0 Scenario 1 Scenario 2 Scenario 3 Scenario 4Demographic Changes Yes Yes Yes Yes YesACA Provisions
Reductions in payment updates No Yes Yes Yes YesCoverage expansion No No Yes Yes YesDSH cuts No No No Yes YesOther Medicare cuts No No No Yes Yes
Other Payment ChangesSequestration No No No No YesReductions in Medicare's payments and in
Medicaid's DSH payments in the MedicareAccess and CHIP Reauthorization Act of 2015 No No No No Yes
Documentation and coding adjustments No No No No YesMeaningful use of EHR penalties No No No No Yes
21
group for whom hospitals often receive no payment or less payment than they receive for insured patients. CBO and staff of the Joint Committee on Taxation (JCT) estimate that the insurance coverage provisions of the ACA have markedly increased the number of people younger than 65 who have health insurance and will continue to do so—by about 22 million in 2016 and by 24 million in 2022 and in each of the subsequent years through 2026.
32 Even so, about 28 million nonelderly residents of the United States are
likely to be without health insurance in 2026, according to estimates by CBO and JCT, which is roughly one out of every 10 such residents.
ACA Reductions in DSH Payments. The ACA also decreased Medicare’s and Medicaid’s DSH payments, beginning in 2014. Although views differ about the underlying purpose of DSH payments, one rationale for those payments is to offset costs for uncompensated care provided to low-income patients—so an argument made for reducing those payments is that hospitals are expected to provide less uncompensated care as a result of the coverage expansions. Regardless of the rationale, CBO estimated in 2010 that the reductions in Medicare’s DSH payments through 2019 would amount to $22 billion, and the reduction in Medicaid’s DSH payments over that period would amount to $14 billion.
33
ACA Penalties Related to Hospital Quality. The scenarios specified for this paper incorporated two provisions of the ACA that penalize hospitals for not meeting certain quality thresholds:
• The readmission reduction program, which reduces Medicare’s payments for hospitals whose readmission rates for selected conditions exceed the national average for the prior three-year period; and
• The penalty for hospitals with relatively high rates of hospital-acquired conditions (such as surgical site infections following particular procedures and certain types of urinary tract infections).
Those two programs will reduce the level of Medicare payments to certain hospitals but, unlike the reductions in Medicare’s payment updates discussed above, their effects do not compound over time. The maximum penalty under the readmission reduction program was 1 percent of a hospital’s base Medicare payments for inpatient care in fiscal year 2013 (the program’s first year of operation) and rose to 2 percent in 2014 and 3 percent in 2015 and thereafter. In the first three years of the program, a large number of hospitals had their Medicare payments reduced, but the reductions for most hospitals were far below the maximum penalty allowed. In fiscal year 2015, readmission penalties were imposed on nearly 80 percent of hospitals, and the average penalty was 0.6 percent.
34 The penalty for having high rates of
hospital-acquired conditions began in fiscal year 2015. Starting in that year, Medicare reduced payments by 1 percent for hospitals with the highest rates of hospital-acquired conditions (specifically, for hospitals that rank in the lowest quartile of performance for those conditions).
32
Congressional Budget Office, Effects of the Affordable Care Act on Health Insurance Coverage—Baseline Projections (March 2016), www.cbo.gov/publication/43900. 33
Congressional Budget Office, letter to the Honorable Nancy Pelosi providing an estimate for an amendment to H.R. 4872, the Reconciliation Act of 2010 (March 20, 2010), www.cbo.gov/publication/21351. Those estimates were made relative to the agency’s projection of federal spending at that time. 34
Cristina Boccuti and Giselle Casillas, Aiming for Fewer Hospital U-Turns: The Medicare Hospital Readmission Reduction Program, Issue Brief (The Henry J. Kaiser Family Foundation, January 2015), http://tinyurl.com/otavwmd.
22
Because we were not able to predict which hospitals will be required to pay those penalties or how the penalties will vary by hospital, we used CBO’s projection of the total penalties relative to total Medicare spending on hospital care each year and applied that percentage reduction equally to all hospitals. In the early years of both programs, major teaching hospitals, large hospitals, and hospitals that serve a large share of low-income patients have been more likely to be penalized than their counterparts.
35 We did not
use such relationships to try to model how the penalties will vary with hospital characteristics over the next decade, however, because hospitals are likely to vary in their responses to the two programs and the programs are likely to evolve in ways that will have varying effects on different types of hospitals.
36
The ACA also established a “value-based purchasing” program that withholds a small percentage of Medicare payments and redistributes those withholdings differentially to reflect hospitals’ performance on certain measures of quality and value.
37 During 2013 (the program’s first year), the amount withheld
and redistributed was 1 percent of Medicare payments. We did not account for the value-based purchasing program in the projections developed for this paper for two reasons: First, the program is designed to be budget-neutral, in that overall Medicare payments to the hospitals that perform well will equal the total amount of funds withheld. As a result, the program may not affect the overall average of profit margins. Hospitals that perform better on the included quality measures will receive slightly higher payments, and hospitals that perform worse will receive slightly lower payments, than they would have otherwise. However, we were not able to model how the payments of the withheld amounts will vary across specific hospitals, and that is the second reason we did not account for the program’s effects on the distribution of profit margins.
38
Other Reductions in Hospital Payments. The last scenario specified for this analysis incorporates several other reductions in Medicare’s payments to hospitals and in Medicaid’s DSH payments that went into effect after enactment of the ACA. The sequestration provision of the Budget Control Act of 2011, as subsequently amended, is projected to reduce Medicare’s payment rates by 2 percent between 2014 and the first half of fiscal year 2025 and by 4 percent in the second half of fiscal year 2025.
39 Sequestration
35
See Charles N. Kahn III and others, “Assessing Medicare’s Hospital Pay-for-Performance Programs and Whether They Are Achieving Their Goals,” Health Affairs, vol. 34, no. 8 (August 2015), pp. 1281–1288. 36
For example, CMS is likely to continue refining its risk-adjustment methods for both programs. A key area of debate has been whether the risk-adjustment mechanism for the hospital readmission reduction program should be expanded to include socioeconomic status. The Medicare Payment Advisory Commission has recommended that the system be modified so that readmission rates are compared within groups of hospitals with similar shares of low-income Medicare patients. See Medicare Payment Advisory Commission, Report to the Congress: Medicare and the Health Care Delivery System (June 2013), pp. 106–110. Such a change could significantly alter the relationship between hospital characteristics and penalties. 37
In 2015, CMS modified the program so that hospitals are evaluated not only on the basis of quality of care but also on a measure of average Medicare spending per beneficiary over a defined period before and after a hospital stay. That spending measure contributes 25 percent to a hospital’s total score under the program. See Medicare Payment Advisory Commission, Report to the Congress: Medicare Payment Policy (March 2016), pp. 65–66. 38
We did not use the relationships that have been observed between hospital characteristics and bonuses and penalties in the initial years of the program to try to model such relationships over the next decade because those relationships seem likely to change as hospitals respond to the program and the program evolves. For example, the quality measures included in the program have changed, and CMS added a spending measure in 2015. For a discussion of the effects of that change, see Anup Das and others, “Adding a Spending Metric to Medicare’s Value-Based Purchasing Program Rewarded Low-Quality Hospitals,” Health Affairs, vol. 35, no. 5 (May 2016), pp. 898–906. 39
In our analysis, we modeled sequestration as resulting in a 3 percent reduction in Medicare’s payment rates in fiscal year 2025.
23
will reduce the level of Medicare’s payments to hospitals but does not have an effect that compounds over time.
Also included in this scenario are reductions in Medicare’s payments that CMS made through regulation to adjust for changes in the documentation and coding of diagnoses by hospitals. Hospitals changed their documentation and coding practices for inpatient care when CMS implemented a more refined DRG system in 2008 and 2009, and the result was an unexpected increase in Medicare’s payments.
40 To adjust
for that increase, Medicare’s base payment rate for inpatient care was reduced by 2.0 percent in 2012 and by 1.9 percent in 2013. Those downward adjustments resulted in the base payment rates being lower in all subsequent years than would have otherwise been the case.
This scenario also incorporated two provisions of the Medicare Access and CHIP Reauthorization Act of 2015. One provision reduced Medicare’s hospital inpatient payment rates for the 2018–2025 period, yielding projected Medicare savings of $15.1 billion over that eight-year period and projected savings of $0.4 billion in 2025 (the year for which we present projections of hospitals’ margins).
41 The second
provision increased allotments for Medicaid’s DSH payments over the 2017–2020 period and reduced those allotments over the 2021–2025 period, resulting in projected federal savings of $4.1 billion over the entire period and projected savings of the same amount ($4.1 billion) in 2025.
42
The final set of changes to hospital payments incorporated in this scenario are those mandated by the Medicare Electronic Health Record (EHR) Incentive Program. That program provides additional payments during the 2011–2016 period to hospitals that are “meaningful users” of EHRs and imposes penalties beginning in 2015 on hospitals that are not.
43 The program will increase Medicare payments to
hospitals in the initial years of our projection period and reduce payments thereafter. However, we were not able to predict which hospitals would receive bonuses or penalties under this program and therefore applied CBO’s projection of the percentage change in payments resulting from the program equally across all hospitals.
Comparison With Recent CMS Analyses Our approach to the projections presented below builds on the approach adopted in recent analyses by the CMS actuaries. However, our analysis differs from that of the CMS actuaries in part because we use a
40
For a discussion, see Medicare Payment Advisory Commission, Report to the Congress: Medicare Payment Policy (March 2010), Chapter 2A Online Appendix A, http://go.usa.gov/xZZTk. 41
Congressional Budget Office, Cost Estimate and Supplemental Analyses for H.R. 2, the Medicare Access and CHIP Reauthorization Act of 2015 (March 25, 2015), www.cbo.gov/publication/50053. The projected federal savings from the reduction in Medicare’s payment rates for inpatient care stem primarily from lower payments to hospitals under Medicare’s fee-for-service program but also include certain effects of those reductions on other components of Medicare spending. The largest such interaction effect is a reduction in federal payments to Medicare Advantage plans (which would occur because federal payments to those plans are tied to average spending in the fee-for-service program). 42
Ibid. 43
The additional payments are determined from a formula that includes the total number of discharges at the hospital, Medicare’s share of discharges, and the year in which the hospital first achieved meaningful use of an EHR. The penalty for not achieving meaningful use of an EHR is a percentage reduction in the Medicare payment update. The penalty is 25 percent of that update in 2015, 50 percent in 2016, and 75 percent in 2017 and subsequent years.
24
broader range of assumptions about productivity growth and in part because our methodologies differ in other ways.
In their most recent analysis on this topic, the CMS actuaries estimated that the reductions in Medicare’s payment updates would increase the share of hospitals that have a negative margin from 27 percent in 2013 to as much as 30 percent in 2019 and as much as 50 percent in 2040.
44 That analysis reflects
particular assumptions about hospitals’ productivity growth (discussed below) and incorporates the effects of many of the factors accounted for in this paper.
45 A previous analysis by the CMS actuaries
estimated the effects of the reductions in payment updates on hospitals’ margins while holding all other factors constant. That analysis projected that the share of hospitals with a negative margin could reach 34 percent in 2019 and 53 percent in 2040.
46 Earlier analyses by the CMS actuaries estimated the effect of
the reductions in payment updates on the combined margins of hospitals, skilled nursing facilities, and home health agencies. Those analyses projected that the update cuts would increase the share of those providers with a negative margin by 15 percentage points in 2019 and by 40 percentage points in 2050.
47
Assumptions about Productivity Growth. Projections of hospitals’ margins depend crucially on assumptions regarding hospitals’ productivity growth and how that growth affects hospitals’ costs. As discussed above, measuring productivity growth in the hospital industry is very challenging, and there is considerable uncertainty about whether and to what extent hospitals have increased their productivity in the past. The two most recent analyses of the CMS actuaries projected hospital margins under two alternative assumptions: First, that hospitals’ productivity would increase by 0.4 percent per year; and second, that hospitals’ productivity would not change. (In their previous analyses, the CMS actuaries had used a single assumption about hospitals’ productivity growth—namely, that it would grow at an annual rate of 0.4 percent.)
In our analysis, we projected hospitals’ margins under three different assumptions about productivity growth: first, that hospitals’ productivity would not improve; second, that it would increase by 0.4 percent per year; and third, that hospitals would improve their productivity at the same annual rate as the economy as a whole (an average of 0.8 percent per year over the 2011–2025 period, according to CBO’s projections). As in the CMS analysis, we assumed that any increases in hospitals’ productivity would be used to limit the growth of their costs—rather than being used to enhance the quality of their care.
44
Stephen Heffler and others, Centers for Medicare & Medicaid Services, Office of the Actuary, “Simulations of Affordable Care Act Medicare Payment Update Provisions on Part A Provider Financial Margins” (July 22, 2015). 45
The most recent analysis on this topic by the CMS actuaries accounted for all of the factors included in this paper except for the quality-related penalties, the bonuses and penalties in the Medicare EHR Incentive Program, and demographic changes (personal communication from Stephen Heffler, CMS Office of the Actuary, March 4, 2016). 46
Stephen Heffler and others, Centers for Medicare & Medicaid Services, Office of the Actuary, “Simulations of Affordable Care Act Medicare Payment Update Provisions on Part A Provider Financial Margins” (July 8, 2014). 47
For example, see Boards of Trustees, Federal Hospital Insurance and Federal Supplementary Medical Insurance Trust Funds, 2013 Annual Report of the Boards of Trustees of the Federal Hospital Insurance and Federal Supplementary Medical Insurance Trust Funds (May 2013), pp. 205–206; and John D. Shatto and M. Kent Clemens, Centers for Medicare & Medicaid Services, Office of the Actuary, “Projected Medicare Expenditures Under Illustrative Scenarios With Alternative Payment Updates to Medicare Providers” (May 18, 2012).
25
We also followed the approach of the CMS actuaries and adopted the simplifying assumption that all hospitals will achieve the same productivity growth over the projection period. Although evidence suggests that productivity growth varies across hospitals—and hospitals might be expected to vary in their responses to the financial pressures created by the reduction in Medicare’s payment updates—we concluded that we did not have a sufficiently strong basis for assuming different rates of productivity growth among hospitals in the future.
48 The results thus illustrate the average effects on the hospital sector
as a whole but may not fully capture variation across different types of hospitals (depending on which characteristics of hospitals are correlated with productivity growth). If hospitals with below-average margins in the base period achieve lower productivity growth in the future than other hospitals, our analysis will understate the share of hospitals that will have negative margins. Conversely, if hospitals with below-average margins in the base period achieve higher productivity growth than other hospitals, our analysis will overstate the share of hospitals with negative margins.
Other Differences in Methodology. Our approach to the projections differs from that of the CMS actuaries’ most recent projections in five other ways. First, we specified the base year as 2011, whereas the CMS actuaries used 2013. We chose 2011 as the base year because that is the last year before the ACA’s reductions in payment updates related to economywide productivity growth went into effect, whereas the CMS actuaries chose 2013 as the base year because that was the most recent year for which data were available.
The second difference is that our analyses use CBO’s projections in place of CMS’s projections of two components of the Medicare hospital payment updates: the market basket index, which reflects the increase in prices that hospitals pay for inputs, and the projection of the 10-year moving average of economywide productivity growth, which determines the reduction in the payment update required under the ACA. Third, the CMS actuaries projected the effects of the ACA’s reductions in payment updates and other policy changes on hospitals’ margins through 2040, but we instead chose 2025. In our view, making detailed projections farther into the future becomes increasingly difficult because of the growing uncertainties about how the health care system and insurance coverage patterns will evolve over the longer term. Fourth, our projections incorporate the effects of the projected growth and aging of the population, which increases the share of patients covered by Medicare and thus reduces average payment rates to hospitals.
The fifth difference is that we estimated hospitals’ revenues from Medicare Advantage (MA) plans and projected them separately from remaining private-pay revenues. In the cost reports, revenues from MA plans are combined with all private-pay revenues and not recorded separately. However, we were able to derive an estimate of the overall share of Medicare’s payments to hospitals in 2011 that came from MA plans, which was about 20 percent. In that year, MA plans accounted for about 25 percent of all Medicare enrollees. We then used those figures to estimate the amount of revenues for each hospital in our sample that came from MA plans. Specifically, we used data on Medicare FFS payments to each hospital (from the cost reports) and on the share of Medicare enrollees in those plans in each county (from CMS data)—and we assumed that the amount of revenues for a given hospital that were from MA plans was proportional to that share of enrollment in MA plans in the hospital’s county.
48
For evidence that hospitals vary in their productivity growth for treating acute myocardial infarction, see Jonathan Skinner and Douglas Staiger, Technology Diffusion and Productivity Growth in Health Care, Working Paper 14865 (National Bureau of Economic Research, April 2009).
26
We then projected revenues for each hospital from MA plans by increasing the payment rates of those plans at the same rate as Medicare’s FFS rates are projected to grow. We based that assumption on evidence that MA plans currently pay rates to hospitals that are similar to Medicare’s FFS rates, rather than the much higher rates paid by commercial plans, owing at least in part to constraints on MA rates that are expected to persist.
49 In contrast, in the analyses of the CMS actuaries, hospitals’ MA revenues
were included with total private-pay revenues and therefore were projected to grow at the same rate as private-pay revenues. Consequently, hospitals’ revenues from MA plans were assumed to grow more rapidly in the analyses of the CMS actuaries than in our analysis—and that would have led to higher projected profit margins in the CMS analysis, holding other factors equal.
Scenario 0: Projecting Margins Using Pre-ACA Update Rules We began the analysis by projecting hospitals’ margins under a “base case” scenario in which hospitals’ revenues and costs were projected on the basis of the relevant federal laws and policies as they applied in 2011—and ignoring any changes in federal policies that were scheduled to occur in future years or were enacted subsequently. In particular, this scenario does not incorporate the reductions in Medicare’s payment updates specified in the ACA that were scheduled to be implemented, the coverage expansions, or other reductions in hospital payments that are incorporated in subsequent scenarios. However, the effects of demographic changes are incorporated in this scenario—and in all other scenarios analyzed in this paper. The projections under this initial scenario provide a basis for estimating the effects of the policy changes incorporated in the subsequent scenarios.
Approach to Projecting Hospitals’ Revenues and Costs. Before accounting for the effects of demographic changes, we projected hospitals’ revenues and costs under this scenario as follows:
• We projected hospitals’ costs using the projected annual increases in the hospital market basket index, which measures the prices of hospitals’ inputs, and factored in the effect of the assumed annual growth in hospitals’ productivity (using the three different assumptions specified above).
50
• Those calculations yielded a 51 percent cumulative increase in hospitals’ average input prices from 2011 to 2025; if hospitals did not reduce costs through productivity growth, then their costs would also grow by 51 percent. Alternatively, factoring in the assumption of 0.4 percent annual productivity growth yielded a 43 percent cumulative increase in hospitals’ costs over that period, and assuming instead that hospitals achieved the same productivity growth as the economy as a whole brought the cumulative increase in costs down to 36 percent.
• We projected hospitals’ revenues from Medicare’s FFS program by updating Medicare’s payment rates by the amount of the projected annual increases in the hospital market basket index, which
49
See Robert A. Berenson and others, “Why Medicare Advantage Plans Pay Hospitals Traditional Medicare Prices,” Health Affairs, vol. 34, no. 8 (August 2015), pp. 1289–1295. 50
More specifically, for a given year, costs from the base year are multiplied by the cumulative growth in input prices and the cumulative effect of productivity growth.
27
was the formula in effect just before enactment of the ACA. Those calculations yielded a 51 percent cumulative increase in hospitals’ average Medicare payment rates from 2011 to 2025.
51
• We projected hospitals’ revenues from MA plans by assuming that the hospital payment rates of those plans would grow at the same rate as Medicare’s FFS rates (for reasons discussed above).
• We assumed that hospitals’ revenues from all other sources—which come mostly from private insurance plans—would grow at the same rate as their costs.
Hospitals’ revenues from all sources other than Medicare include payments for privately insured patients, Medicaid patients, and self-pay patients. For this scenario, we assumed that hospitals’ revenues from those other sources would grow at the same rate as their costs over the long run—an assumption supported by some evidence. Specifically, data compiled by the AHA indicates that hospitals’ payments from private payers have grown relative to their costs since the early 2000s, but those payments fell relative to hospitals’ costs in the 1990s.
52 Predicting which trend might predominate in the future is
difficult and depends in part on responses to the financial pressures facing the health care system, which we are not in a position to model. If recent trends continue, however, our analysis would understate the growth in hospitals’ revenues from private payers.
The AHA data also indicate that hospitals’ payments relative to their costs have fluctuated much less for Medicaid patients than for private-pay patients over the past two decades and that the ratio of payments to costs for Medicaid patients was the same at the end of that 20-year period as it was at the beginning. Those data provide some support for the assumption that hospitals’ revenues from Medicaid will grow at the same rate as their costs over the long run.
In making our illustrative projections of hospitals’ total revenues and costs for each major type of payer, we effectively assumed that changes in patient case mix and in the mix of services delivered by hospitals would not affect their margins on net. For example, the share of hospitals’ revenues derived from outpatient care has increased over time and might continue increasing in the future, and the profitability of such services might differ from that of inpatient services, but we did not adjust our illustrative projections to account for such differences—so in effect, we assumed they would not affect hospitals’ profits on net.
Accounting for Demographic Changes. For each scenario, we adjusted the projections of hospitals’ revenues and costs to account for the projected growth and aging of the population. We made those adjustments by applying CBO’s projections of the growth of the population—both overall and for Medicare enrollment—and estimates of how changing age profiles of the population will affect spending by payer. The effects of those demographic changes are driven mainly by the projected increase in the 51
In making those calculations, we did not vary the market basket index when we applied different assumptions about overall productivity growth for hospitals. Changes in the aggregate productivity of hospitals would probably change their demand for inputs and thus could affect the prices of those inputs. However, we lacked evidence on the likely magnitude of such effects. Moreover, changes in the market basket index would alter the growth of both revenues and costs in our analysis—so using a moderately different value for the index would not have substantial effects on the projections of hospitals’ margins or the share of hospitals with a negative margin. 52
See American Hospital Association, Trendwatch Chartbook 2015 and Trendwatch Chartbook 2005. The payment-to-cost ratios observed for private payers in 2012 and 2013 exceeded 140 percent, whereas the ratios observed between 1991 and 1993 were between 130 percent and 132 percent.
28
share of the population that will be covered by Medicare. As discussed previously, that development is expected to reduce hospitals’ margins because the share of hospital patients covered by Medicare will rise, and Medicare’s payment rates for hospitals (and the rates of MA plans) tend to be substantially lower than those of commercial plans.
We also accounted for the fact that the aging of the population will increase Medicare’s direct GME payments to teaching hospitals, because the formula for determining those payments depends partly on the share of a hospital’s inpatient days that are covered by Medicare.
53 (Population aging will also
increase indirect payments for GME, which are a percentage add-on to Medicare’s base payment amount for inpatient stays.)
Results for This Scenario. We made the following projections for this scenario:
• If hospitals achieved the same productivity growth as the economy as a whole, the share of hospitals with a negative margin would fall from 27 percent in 2011 to 15 percent in 2025, and the aggregate margin of hospitals would increase from 6.0 percent to 8.2 percent during that period (see Table 6, column 1 and column 2, top panel).
• If, instead, the annual productivity growth of hospitals was 0.4 percent, 22 percent of hospitals would have a negative margin in 2025, and the aggregate margin of hospitals in that year would be 6.6 percent (see Table 6, column 2, middle panel).
• Alternatively, if hospitals achieved no productivity growth, the share of hospitals with a negative margin in 2025 would increase to 32 percent, and the aggregate margin of hospitals would fall to 4.8 percent (see Table 6, column 2, bottom panel).
Under this scenario, the financial performance of hospitals is projected to improve over the projection period under the first two assumptions about hospitals’ productivity growth. In those cases, hospitals’ revenues from the Medicare program are projected to grow faster than their costs, whereas their revenues from all other sources are assumed to grow at the same rate as their costs. The result regarding Medicare revenues stems from the assumption that Medicare’s payment rates would grow at the same rate as hospitals’ input prices, whereas hospitals’ costs are assumed to grow more slowly (because of productivity growth). Profits would have been even higher in this scenario because of productivity growth alone, but we also took into account population aging, which reduces profit margins somewhat.
In contrast, the financial performance of hospitals is projected to decline over the projection period under the assumption of no productivity growth by hospitals. Under that assumption, costs and revenues generally grow in parallel—which would tend to leave profit margins unchanged. However, population aging reduces profit margins, and in this case that effect is not offset by growth in productivity. Additionally, Medicare DSH and direct GME payments are projected to grow more slowly than Medicare’s payment rates and thus more slowly than hospitals’ costs. As a result, profit margins would decline gradually under this scenario.
53
We identified direct GME payments from the cost reports and projected those separately from other Medicare revenues using CBO’s baseline projection of those payments. Projecting direct GME payments separately from other Medicare payments had very little effect on our estimates of hospitals’ margins because direct GME payments account for only about 2 percent of total Medicare payments to hospitals.
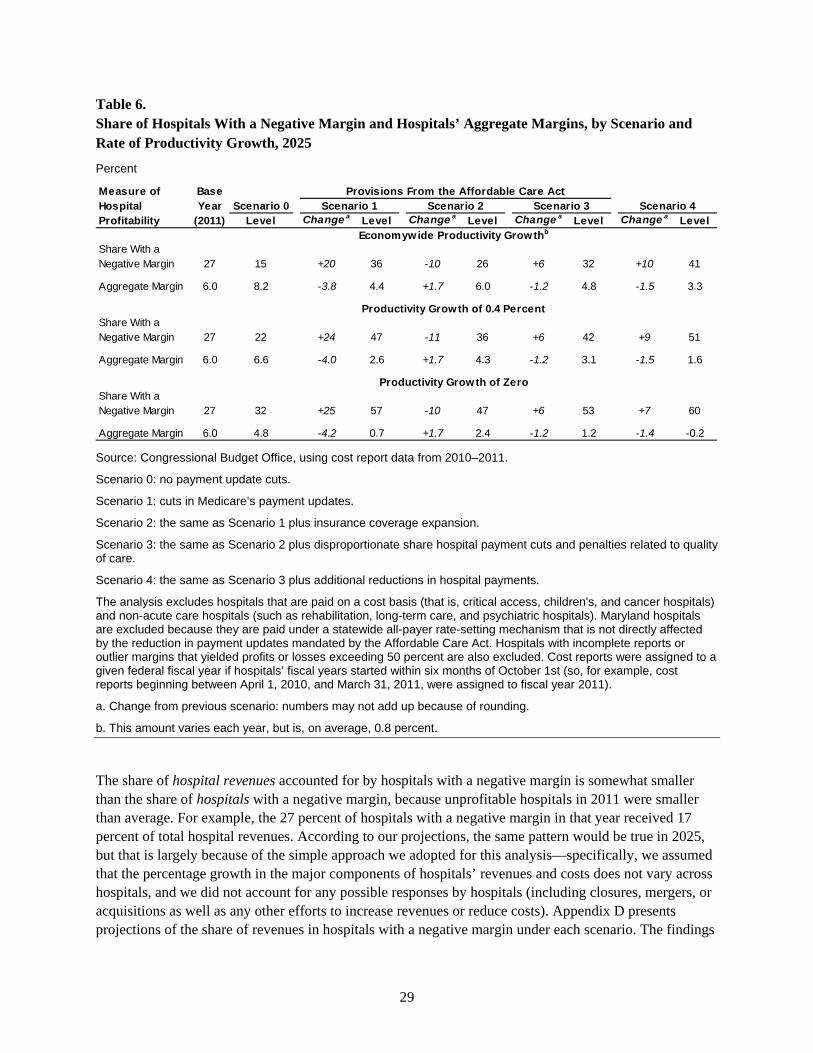
29
Table 6. Share of Hospitals With a Negative Margin and Hospitals’ Aggregate Margins, by Scenario and Rate of Productivity Growth, 2025
Percent
Source: Congressional Budget Office, using cost report data from 2010–2011.
Scenario 0: no payment update cuts.
Scenario 1: cuts in Medicare’s payment updates.
Scenario 2: the same as Scenario 1 plus insurance coverage expansion.
Scenario 3: the same as Scenario 2 plus disproportionate share hospital payment cuts and penalties related to quality of care.
Scenario 4: the same as Scenario 3 plus additional reductions in hospital payments.
The analysis excludes hospitals that are paid on a cost basis (that is, critical access, children's, and cancer hospitals) and non-acute care hospitals (such as rehabilitation, long-term care, and psychiatric hospitals). Maryland hospitals are excluded because they are paid under a statewide all-payer rate-setting mechanism that is not directly affected by the reduction in payment updates mandated by the Affordable Care Act. Hospitals with incomplete reports or outlier margins that yielded profits or losses exceeding 50 percent are also excluded. Cost reports were assigned to a given federal fiscal year if hospitals’ fiscal years started within six months of October 1st (so, for example, cost reports beginning between April 1, 2010, and March 31, 2011, were assigned to fiscal year 2011).
a. Change from previous scenario: numbers may not add up because of rounding.
b. This amount varies each year, but is, on average, 0.8 percent.
The share of hospital revenues accounted for by hospitals with a negative margin is somewhat smaller than the share of hospitals with a negative margin, because unprofitable hospitals in 2011 were smaller than average. For example, the 27 percent of hospitals with a negative margin in that year received 17 percent of total hospital revenues. According to our projections, the same pattern would be true in 2025, but that is largely because of the simple approach we adopted for this analysis—specifically, we assumed that the percentage growth in the major components of hospitals’ revenues and costs does not vary across hospitals, and we did not account for any possible responses by hospitals (including closures, mergers, or acquisitions as well as any other efforts to increase revenues or reduce costs). Appendix D presents projections of the share of revenues in hospitals with a negative margin under each scenario. The findings
Scenario 0Level Change a Level Change a Level Change a Level Change a Level
Share With a Negative Margin 27 15 +20 36 -10 26 +6 32 +10 41
Aggregate Margin 6.0 8.2 -3.8 4.4 +1.7 6.0 -1.2 4.8 -1.5 3.3
Share With a Negative Margin 27 22 +24 47 -11 36 +6 42 +9 51
Aggregate Margin 6.0 6.6 -4.0 2.6 +1.7 4.3 -1.2 3.1 -1.5 1.6
Share With a Negative Margin 27 32 +25 57 -10 47 +6 53 +7 60
Aggregate Margin 6.0 4.8 -4.2 0.7 +1.7 2.4 -1.2 1.2 -1.4 -0.2
Economywide Productivity Growthb
Productivity Growth of 0.4 Percent
Productivity Growth of Zero
Provisions From the Affordable Care ActScenario 1 Scenario 2 Scenario 3 Scenario 4
Measure of Hospital Profitability
Base Year
(2011)
30
follow the same general pattern across scenarios as the projections of the share of hospitals with a negative margin.
Scenario 1: Projecting the Effects of the Reductions in Payment Updates Specified in the ACA To project the effects on hospitals’ margins of the reductions in Medicare’s payment updates specified in the ACA while holding other key factors constant, we modified the approach we used to project hospitals’ revenues and costs in Scenario 0 in the following ways:
• We projected hospitals’ revenues from Medicare’s FFS program using the formula for updates in payment rates specified in the ACA. In particular, we specified the annual updates as the projected annual increase in the hospital market basket index, minus two amounts: the projected growth in economywide multifactor productivity (which CBO projects will average 0.8 percent per year through 2025) and additional reductions through 2019 that were specified in the ACA.
54
The net effect of those calculations is a 32 percent cumulative increase in Medicare revenues from 2011 through 2025, rather than the 51 percent increase in the previous scenario.
• We assumed that hospitals’ revenues from Medicaid would grow at a rate midway between the growth in their Medicare revenues and the growth in their costs, due to constraints on Medicaid’s payment rates that are discussed below.
As in Scenario 0, we projected hospital’s revenues from MA plans by assuming that the hospital payment rates of those plans would grow at the same rate as Medicare’s FFS rates. Furthermore, we adopted the same approach as in Scenario 0 to project hospitals’ costs and hospitals’ revenues from all sources other than the Medicare FFS program, MA plans, and Medicaid, and we used the same approach to account for demographic changes.
Medicaid. Medicaid revenues may be constrained by Medicaid’s upper payment limit (UPL) rules, but the extent of the effect is difficult to predict. By law, the UPL constrains total Medicaid FFS payments to hospitals in each state each year to not exceed the total amount that Medicare would have paid for the same services. There is considerable uncertainty, however, about the extent to which hospitals’ Medicaid revenues would be constrained under the UPL by the reductions in Medicare’s payment updates specified in the ACA. Information is not readily available on how many states have set their Medicaid hospital payment rates at the maximum amount allowed under the UPL, so it is not known how many states would be able to increase their Medicaid FFS rates more rapidly than the Medicare FFS rates over the next decade. Moreover, the UPL applies only to Medicaid’s FFS payments, so payment rates set by Medicaid managed care plans might grow faster than the FFS rates. In addition, many states make supplemental payments to hospitals under their Medicaid programs, and in some states those payments are not constrained by the UPL.
55
54
This scenario does not incorporate changes in Medicare’s payment rates for hospitals that were not part of the ACA. Those changes are incorporated in Scenario 4 (below). 55
Supplemental payments are additional payments (beyond those determined under Medicaid’s FFS payment rates) that hospitals and other providers receive in many states. Supplemental payments accounted for nearly a quarter of total Medicaid payments to hospitals in 2013. In general, supplemental payments are included in the definition of total Medicaid payments to hospitals for purposes of applying the UPL. However, some states that have shifted a substantial share of their Medicaid population into
31
For those reasons, we assumed under this scenario that hospitals’ Medicaid revenues would grow at a rate midway between the following rates: first, the growth of their Medicare revenues (the rate we assumed would apply if Medicaid’s payments to hospitals were fully constrained by the UPL to grow no faster than Medicare’s FFS rates); and second, the growth of their costs (an approximation of the growth rate that would apply if the growth in Medicaid’s payments to hospitals was unaffected by the UPL and thus unaffected by the reductions in Medicare’s payment updates specified in the ACA). Those assumptions have the largest effect on the projections if hospital productivity does not grow—because the UPL constraints are most likely to be binding in that case.
Our projections of revenues from Medicaid include revenues for both managed care and FFS enrollees, so the same assumption applies to both revenue streams. The data on revenues from Medicaid in the cost reports upon which we based our analysis include revenues for both types of enrollees.
Results for This Scenario. Here we account for the reductions in Medicare’s payment updates specified in the ACA, while holding other key factors constant and excluding any potential responses by hospitals to financial pressures. Relative to Scenario 0, the share of hospitals with a negative margin in 2025 increases by 20 to 25 percentage points (depending on the assumption about hospitals’ productivity growth), and the aggregate margin of hospitals declines by about 4 percentage points (see Table 6, column 3). Those projected changes resulted in the following projections for 2025:
• If hospitals achieved the same productivity growth as the economy as a whole, the share of hospitals with a negative margin in 2025 would increase from 15 percent in Scenario 0 to 36 percent here, and the aggregate margin of hospitals would fall from 8.2 percent to 4.4 percent (see Table 6, column 4, top panel).
• If, instead, the annual productivity growth of hospitals was 0.4 percent, the share of hospitals with a negative margin in 2025 would increase to 47 percent, and the aggregate margin of hospitals in that year would fall to 2.6 percent (see Table 6, column 4, middle panel).
• Alternatively, if hospitals achieved no cost reductions through productivity growth, the share of hospitals with a negative margin in 2025 would increase to 57 percent, and the aggregate margin of hospitals would fall to 0.7 percent (see Table 6, column 4, bottom panel).
Scenario 2: Factoring in the Insurance Coverage Expansion For this scenario, we modified the assumptions underlying the previous scenario in order to account for the increased revenue that hospitals are expected to receive as a result of the expansions in insurance coverage. To do so, we started with hospitals’ reported costs of uncompensated care in the base year (2011) and estimated the portion of those costs that are incurred for treating uninsured patients. In particular, we excluded bad debt for Medicare that was not reimbursed as well as underpayments (relative to cost) for Medicaid and other government programs, because those costs are not related to the uninsured population. We were not able to exclude bad debt for the privately insured population because that amount is not reported; as a result, our estimates may overstate the costs of uncompensated care for the uninsured population.
managed care plans have received waivers from CMS allowing them to make supplemental payments to providers that are not constrained by the UPL but rather are contingent upon other requirements. For a discussion, see Medicaid and CHIP Payment Assessment Commission, March 2014 Report to the Congress on Medicaid and CHIP, Chapter 6.
32
In applying our approach, we accounted for the fact that hospitals received some payments from uninsured patients before the coverage expansion.
56 Those payments were included in hospitals’ non-
Medicare, non-Medicaid revenues, which we assumed would grow at the same rate as hospitals’ costs. The additional revenues estimated in this scenario for newly insured patients are payments for the portion of hospitals’ costs that would have otherwise been uncompensated.
To construct our estimates, we assumed that the amount of uncompensated care associated with treating uninsured patients will decrease in direct proportion to the increase in the share of the previously uninsured population that gains coverage. We used CBO’s projections of those increases in coverage to project the reduction in uncompensated care for all hospitals, taking into account which states have chosen to expand Medicaid already and the share of the population potentially eligible for Medicaid that is projected to be covered by Medicaid in the future. We calculated the reduction in uncompensated care for a given hospital by starting with county-level estimates of uninsured rates before the ACA’s implementation, allocating CBO’s projected declines in the uninsured rate proportionally across states and counties, and then assuming that the decline in costs for uncompensated care would occur in proportion to the decline in the uninsured rate for the hospital’s county.
Overall, CBO projects that about 47 percent of the population that would have otherwise been uninsured in 2026 will gain coverage as a result of the ACA, reflecting a projection that about 80 percent of the population that is potentially eligible for coverage under the ACA’s Medicaid expansion will live in a state that chose to expand its Medicaid coverage.
57 Correspondingly, we projected that hospitals will
receive payment for about 47 percent of the costs that would have otherwise been uncompensated, on average. If the people gaining insurance coverage would otherwise have received a larger share of uncompensated care (perhaps because they have more serious health conditions), that approach would understate the increase in hospitals’ revenues. Alternatively, if costs for uncompensated care do not decline in proportion to the reduction in the uninsured population, that approach would overstate the increase in hospitals’ revenues.
To estimate the revenues that hospitals would receive for the newly insured population, we used CBO’s projections of the share of that population that would be covered by Medicaid and the share that would be enrolled in private plans through the exchanges. Medicaid’s payment rates are below hospitals’ average costs, and we assumed that the payment rates of plans in the exchanges are above hospitals’ average costs. We therefore assumed that, on net, hospitals would initially receive revenues for the newly insured population that are equal to their costs of treating them. For the portion attributable to Medicaid, however, we estimated that those revenues would grow more slowly than costs over time on account of the UPL constraints on Medicaid’s payment rates (using the same assumptions for Medicaid discussed above). We also estimated that the use of hospitals’ services among the newly insured will increase by about 40 percent as a result of having insurance, which translates into an overall increase of about 2 percent or 3
56
For evidence on the amount that uninsured people paid for their care before the coverage expansion, see Congressional Budget Office, Key Issues in Analyzing Major Health Insurance Proposals (December 2008), pp. 13–15, www.cbo.gov/publication/41746. 57
Congressional Budget Office, Effects of the Affordable Care Act on Health Insurance Coverage—Baseline Projections (March 2016), www.cbo.gov/publication/43900.
33
percent in hospital use.58
In our projections, that greater use was reflected in an increase in hospitals’ costs for treating the previously uninsured and a roughly equal increase in revenues—and thus did not affect our projections of hospitals’ profit margins appreciably.
Results for This Scenario. Incorporating the effects of the coverage expansions only partially offsets the negative effects on hospitals’ finances of the reductions in Medicare’s payment updates. As described above, the reductions in the payment updates increase the share of hospitals with a negative margin in 2025 by 20 to 25 percentage points. The coverage expansions subsequently reduce that share by about 10 percentage points (see Table 6, column 5). The net effect of those two policies thus increases the share of hospitals with a negative margin in 2025 by 11 to 15 percentage points relative to Scenario 0. Similarly, the net effect of the two policies reduces the aggregate margin of hospitals in 2025 by about 2 percentage points, again not incorporating any potential responses by hospitals to financial pressures and holding other factors constant.
Our projections for this scenario are as follows:
• If hospitals achieved the same productivity growth as the economy as a whole, the share of hospitals with a negative margin in 2025 would fall from 36 percent in Scenario 1 to 26 percent here; the aggregate margin of hospitals would increase from 4.4 percent to 6.0 percent during that period (see Table 6, column 6, top panel).
• If, instead, the annual productivity growth of hospitals was 0.4 percent, 36 percent of hospitals would have a negative margin in 2025, and the aggregate margin of hospitals in that year would be 4.3 percent (see Table 6, column 6, middle panel).
• Alternatively, if hospitals achieved no cost reductions through productivity growth, 47 percent of hospitals would have a negative margin in 2025, and the aggregate margin of hospitals in that year would be 2.4 percent (see Table 6, column 6, bottom panel).
Those results highlight the key role of productivity growth in projecting the financial pressures facing hospitals. Under this scenario, if hospitals achieved the same productivity growth as the economy as a whole, their finances would not decline compared with their status in 2011. Alternatively, under the other two assumptions about hospitals’ productivity growth, our illustrative projections indicate that hospitals would be under more financial pressure in 2025 than they were in 2011.
Sensitivity Analysis. We developed those projections using CBO’s baseline projections of the number of people who will become newly insured as a result of the coverage expansions. The projections depend partly on the number of states that expand Medicaid coverage under provisions of the ACA. As of July 2016, 31 states and the District of Columbia have expanded their Medicaid coverage, and those states contain about 50 percent of the potential newly eligible population. CBO anticipates that additional states will expand coverage over the next few years so that by 2025 nearly 80 percent of the eligible population will reside in states that have expanded coverage.
58
Ibid., pp. 71–76. Varying the assumption about the extent to which hospital use will increase among the newly insured had little effect on projected hospital margins.
34
To test the sensitivity of our results, we projected hospitals’ margins under two alternative assumptions: First, that no additional states will expand Medicaid coverage, and second, that all states will expand Medicaid coverage by 2025. Those changes in assumptions had modest effects on our projections. Under the assumptions that hospitals achieve 0.4 percent annual productivity growth and that no additional states expand Medicaid coverage, the share of hospitals with a negative margin in 2025 under this scenario would increase from 36 percent to 37 percent, and the aggregate margin would fall from 4.3 percent to 4.2 percent during that period (those estimates are not shown in Table 6). If instead annual productivity growth was 0.4 percent and all states expanded their Medicaid coverage, the share of hospitals with a negative margin in 2025 would fall to 35 percent, and the aggregate margin in that year would be 4.4 percent.
Those differing assumptions about the number of states that expand Medicaid coverage have a small effect on our projections of aggregate hospitals’ margins. That is in part because the hospitals that would receive the greatest benefit from the expansion of Medicaid coverage in additional states are more likely to have negative margins, and because in most cases the additional revenue from the Medicaid expansion is not sufficient to change those hospitals’ margins from negative to positive. Moreover, the total additional revenue that hospitals as a group would receive from the newly covered Medicaid beneficiaries—including revenues for hospitals in states that have already expanded Medicaid, which would not differ in these sensitivity tests—is not large enough relative to their revenues from other sources to substantially alter the projected aggregate margins. Even so, expansions of Medicaid would benefit hospitals in those states financially.
Scenario 3: Factoring in the ACA’s DSH Cuts and Penalties Related to Quality of Care In this scenario, we modified the assumptions underlying the previous scenario by incorporating the reductions to DSH payments specified in the ACA and the ACA’s penalties for hospitals that exceed certain thresholds for hospital readmissions and hospital-acquired conditions. We incorporated the effects of the DSH cuts by first isolating DSH payments in the cost reports from the rest of hospitals’ Medicare and Medicaid revenues and then projecting the payments separately according to projected growth rates under the ACA.
59 Because we were not able to model which hospitals will be assessed the penalties for
readmissions and hospital-acquired conditions over time, we applied CBO’s projection of the average effect of those penalties equally to all hospitals. Consequently, the projections may understate the increase in the share of hospitals with a negative margin if the penalized hospitals are more likely to have a margin just above zero before the penalties, and the projections may overstate that effect if penalized hospitals are more likely to have margins that are already negative or are more strongly positive.
Our projections indicate that incorporating the ACA’s DSH cuts and quality-related penalties increases the share of hospitals with a negative margin in 2025 by about 6 percentage points, relative to Scenario 2, and reduces the aggregate margin of hospitals by about 1 percentage point (see Table 6, column 7). That projected change in hospitals’ financial performance between the previous scenario and this scenario stems primarily from the cuts in DSH payments; the penalties had very little effect on projected margins.
59
For the previous scenarios, we projected DSH payments separately on the basis of the projected growth in DSH payments under the law before enactment of the ACA.
35
The projections for this scenario capture the combined effects of the major provisions of the ACA that will affect hospitals’ financial performance—again, without incorporating any potential responses by hospitals to financial pressures and holding other factors constant.
• Under this scenario, if hospitals achieved the same productivity growth as the economy as a whole, the share of hospitals with a negative margin in 2025 would increase from 26 percent in Scenario 2 to 32 percent here, and the aggregate margin of hospitals would fall from 6.0 percent to 4.8 percent (see Table 6, column 8, top panel).
• If, instead, hospitals’ productivity grew by 0.4 percent per year, 42 percent of hospitals would have a negative margin in 2025, and the aggregate margin of hospitals in that year would be 3.1 percent.
• Alternatively, if hospitals achieved no productivity growth, 53 percent of hospitals would have a negative margin in 2025, and the aggregate margin of hospitals would be 1.2 percent.
Scenario 4: Incorporating Other Reductions in Hospital Payments The final scenario incorporates the effect of several other reductions in hospital payments that were not part of the ACA—namely, the reductions in Medicare’s payment rates required under sequestration; the reductions in Medicare’s payment rates for inpatient care in 2012 and 2013 to adjust for prior changes in the documentation and coding of diagnoses by hospitals; the reduction in Medicare’s hospital inpatient payment rates and Medicaid’s DSH payments specified in the Medicare Access and CHIP Reauthorization Act of 2015; and the penalties for hospitals mandated by the Medicare EHR Incentive Program.
Our projections indicate that incorporating those additional reductions in hospital payments increases the share of hospitals with a negative margin in 2025 by between 7 and 10 percentage points, relative to Scenario 3, and reduces the aggregate margin of hospitals by about 1.5 percentage points (see Table 6, column 9). The projections for this scenario are as follows (again not incorporating any potential responses by hospitals to financial pressures and holding other factors constant):
• Assuming that hospitals achieved the same productivity growth as the economy as a whole, the share of hospitals with a negative margin in 2025 would grow from 32 percent in Scenario 3 to 41 percent here, and the aggregate margin of hospitals would fall from 4.8 percent to 3.3 percent (see Table 6, column 10, top panel).
• If, instead, hospitals’ productivity grew by 0.4 percent annually, the share of hospitals with a negative margin would rise to 51 percent in 2025, and the aggregate margin of hospitals in that year would fall to 1.6 percent.
• Alternatively, if hospitals achieved no productivity growth, the share of hospitals with a negative margin would rise to 60 percent in 2025, and the aggregate margin of hospitals in that year would fall to negative 0.2 percent.
Thus, even under the most optimistic assumption about hospitals’ productivity growth, the combined effect of all the factors considered in this analysis would reduce hospitals’ margins considerably—again, ignoring potential responses by hospitals to those financial pressures. By comparison, according to AHA
36
data for the 1994–2014 period, the share of all community hospitals with negative margins has exceeded 30 percent only in 1999, 2000, and 2008.
According to our calculations, hospitals would have to achieve greater revenue growth or slower cost growth—or some combination of the two—than we have assumed in this paper if they were to achieve the same aggregate profit margins in 2025 as in 2011. For example, if their productivity growth matched that in the overall economy, hospitals would have to increase their total revenues or reduce their total costs by an additional 0.2 percent per year to achieve the 2011 level of aggregate profits. Alternatively, if they were not able to reduce costs at all through higher productivity, they would have to increase total revenues or reduce total costs through other means by about 0.5 percent per year to maintain the same profit levels in 2025 that they achieved in 2011. Although our analysis indicates that hospitals could maintain their aggregate profit margins in 2025 at about their level in 2011 with some modest reductions in costs or increases in revenues, it could prove challenging for hospitals to achieve those results year after year.
Those estimates are smaller (and differ by less) than the variation in hospitals’ productivity growth examined in this paper—which ranged from zero to 0.8 percent per year. That disparity reflects differences in the methods involved in the calculations. The estimates in the paragraph above capture the effect of additional reductions in hospitals’ costs while holding their revenues constant, or the effect of additional increases in their revenues while holding their costs constant. And those increases and decreases would apply to all patients, regardless of their source of insurance. By contrast, all of the other estimates presented in this paper were generated from a model in which revenues for private payers are assumed to grow in parallel with costs and revenues for Medicaid patients are assumed to grow partly with costs. Consequently, any productivity improvements by hospitals incorporated in the model do not improve profitability for private patients and only partly improve profitability for Medicaid patients—so a larger difference in productivity growth rates is needed to have the same overall effect on hospitals’ profits.
5. Potential Responses by Hospitals The projections presented above indicate that hospitals will face financial challenges over the next decade, but the magnitude of those challenges is uncertain. In addition to the federal policies we examined, many other external factors may also affect hospitals’ finances. Those factors include changes in the health of the population, changes in physicians’ treatment methods and practice patterns, changes in insurance plan designs and other actions by insurers, and responses and actions by enrollees and patients. Some of those additional factors may improve hospitals’ finances and others may worsen them, but the net effect is difficult to predict.
The implications of those challenges for hospitals’ financial performance, the quality of care they deliver, and beneficiaries’ access to care all depend importantly on how hospitals respond to those pressures. Hospitals might respond by reducing their costs, increasing their revenues, or doing both. Participation in new payment models that emphasize greater coordination and integration of care—such as accountable care organizations (ACOs) and bundled payments—could enable hospitals to capture more of the financial rewards from increased efficiency in the health sector overall, but the effects of those new payment models on hospitals’ finances remain uncertain and will depend on their design. Hospitals that are not able to adjust to the financial challenges might merge with more profitable hospitals or close.
37
Estimating the extent to which those developments might occur, however, or the effects on spending, quality of care, and access to care if they did, is very difficult and is beyond the scope of this paper. As a result, this paper represents only a partial and limited analysis and should be interpreted accordingly.
Reducing Costs Hospitals could reduce their costs in various ways, some of which might increase their productivity. However, some efforts by hospitals to reduce costs might not increase productivity and might instead reduce the amount and the quality of care delivered to Medicare beneficiaries or other patients—or might not increase quality as much as they would have if hospitals were not focusing on restraining cost growth. Some previous studies have found that hospitals reduced their costs in response to reductions in Medicare’s payment rates, although those studies generally did not investigate whether the cost reductions led to improvements in productivity.
60
Possible approaches that hospitals could take to reduce their costs in response to the reductions in Medicare’s payment updates include these:
• Reducing the number or intensity of services provided during a typical admission;
• Decreasing the number of days patients stay in the hospital;
• Using fewer employees or using a less expensive mix of personnel (for example, employing nurses and technicians with less experience and training or substituting contract workers for hospital employees);
• Reducing amenities; and
• Delaying or eliminating capital improvements.
However, hospitals have some incentives to take such steps already—particularly for-profit hospitals or nonprofit and public hospitals that are marginally profitable or losing money—and it is not known whether hospitals could reduce their costs sufficiently through those approaches to enable them to maintain profit margins comparable to their current margins without adversely affecting the quality of care. Hospitals might also reduce or eliminate unprofitable services (such as trauma centers, psychiatric care, and substance abuse treatment), which could lessen access to those services.
Hospitals might also respond to financial pressures by reducing the growth of their input prices, such as the compensation of nurses and other employees, or by making prescription drug formularies stricter. Changes in staffing mix or overall compensation would be reflected in the hospital market basket index, and thus only price reductions for nonlabor inputs—which constitute approximately 40 percent of hospitals’ costs—would improve their margins on Medicare patients. Reducing the growth of either type of input prices could improve hospitals’ total all-payer margins, however, because payment updates from private payers are not directly linked to hospitals’ input prices.
60
For example, see Chapin White and Vivian Yaling Wu, “How Do Hospitals Cope With Sustained Slow Growth in Medicare Prices?” Health Services Research, vol. 49, no. 1 (February 2014), pp. 11–31; and G.J. Bazzoli and others, “The Balanced Budget Act of 1997 and U.S. Hospital Operations,” Inquiry, vol. 41, no. 4 (2004/2005), pp. 401–417.
38
Increasing Revenues Hospitals might try to increase their revenues to offset the effects of the reductions in Medicare’s payment updates. Some policymakers, health industry sources, and analysts have expressed concerns that hospitals will compensate for the reduction in Medicare’s payment updates by charging private payers higher prices through a phenomenon known as cost shifting.
61 Cost shifting occurs if reductions in payment rates for
Medicare or Medicaid result in increases in private payment rates (or vice versa). The fact that private insurers pay hospitals higher rates than public insurers is often cited as evidence for cost shifting, but those price differences can occur for other reasons.
62 A recent review of the research literature on cost
shifting concluded that the evidence is mixed and that, at most, a small fraction of Medicare’s payment cuts is shifted to private payers.
63 More recently, two studies found that—contrary to the cost-shifting
hypothesis—reductions in Medicare’s payment rates have led to lower rates for private payers.64
In that light, it may be difficult for hospitals to offset a substantial portion of the reductions in Medicare’s payment updates by raising their private payment rates.
Hospitals could also try to increase revenues in other ways, but they would face various constraints. For example, hospitals could boost revenues and perhaps profits by expanding the volume and intensity of services they provide to privately and publicly insured patients. Some studies have found that physicians have increased the volume and intensity of the services they provide in response to reductions in payment rates, but there is little evidence on whether hospitals are able to offset reductions in payment rates in that manner. It may be difficult for hospitals to significantly expand the volume and intensity of services they provide to privately insured patients—relative to what would have occurred otherwise—given the efforts of private insurers to hold down cost growth. Hospitals would have weaker incentives to try to expand the volume and intensity of their services for Medicare patients given the lower payment rates, and federal efforts to monitor the appropriateness of hospital services provided to Medicare beneficiaries (through initiatives such as audits) would tend to deter such efforts. However, individual hospitals might alter the mix of services they provide, shifting toward those that are most profitable.
Some hospitals might respond to the reductions in Medicare’s payment updates by engaging in “upcoding”—that is, inappropriately coding some patients into higher cost DRGs to boost their payment from Medicare. Although some upcoding has occurred in the past, CMS has closely monitored providers’ coding practices and used its authority to reduce payment updates to offset the effects of upcoding. Hospitals may find it difficult, therefore, to significantly increase their revenues through additional upcoding—but the effects depend in part on how CMS regulates such efforts in the future.
61
For example, see Boards of Trustees, Federal Hospital Insurance and Federal Supplementary Medical Insurance Trust Funds, 2014 Annual Report of the Boards of Trustees of the Federal Hospital Insurance and Federal Supplementary Medical Insurance Trust Funds (July 2014), pp. 208–209. 62
See Congressional Budget Office, Key Issues in Analyzing Major Health Insurance Proposals (December 2008), pp. 112–116, www.cbo.gov/publication/41746. 63
Austin Frakt, “How Much Do Hospitals Cost Shift? A Review of the Evidence,” The Milbank Quarterly, vol. 89, no. 1 (2011), pp. 90–130. 64
Chapin White, “Contrary to Cost-Shift Theory, Lower Medicare Hospital Payment Rates for Inpatient Care Lead to Lower Private Payment Rates,” Health Affairs, vol. 32, no. 5 (May 2013), pp. 935–943; and Chapin White and Vivian Yaling Wu, “ How Do Hospitals Cope with Sustained Slow Growth in Medicare Prices?” Health Services Research, vol. 49, no. 1 (February 2014), pp. 11–31.
39
Another way in which some hospitals might try to increase their revenues is by reducing their share of patients who are enrolled in the Medicare program and increasing their share of patients who are enrolled in private insurance plans. For example, some hospitals might try to expand services that are used more heavily by privately insured patients and reduce services that are used more heavily by Medicare patients. Whether or not hospitals would have an incentive to try to increase the share of their Medicare patients who are enrolled in MA plans would depend on how the hospital payment rates of those plans compare with Medicare’s FFS rates over time. The available evidence indicates that MA plans currently pay hospital rates that are similar to Medicare’s FFS rates, rather than the substantially higher rates that commercial plans pay. We assumed that the hospital rates paid by MA plans would grow at the same pace as Medicare’s FFS rates. Under those conditions, hospitals are less likely to find that MA enrollees are more profitable to treat than FFS enrollees than if MA payment rates were higher than FFS rates.
Addressing Both Costs and Revenues via New Payment Models The financial performance of hospitals will depend in part on the extent to which they participate in new payment models and on the success of those models in promoting high-quality, cost-effective care. Two such payment models that have gained considerable attention are accountable care organizations and bundled payment arrangements. In an ACO, doctors, hospitals, and other providers have an incentive to work together to coordinate care for and reduce spending on Medicare beneficiaries. They share in the savings if the spending for their Medicare patients is below a target and they meet certain standards for quality. (In some ACO models, providers also share in the losses if the spending for their patients exceeds the target.) In bundled payment arrangements, single payments are made for broadly related groups of services that constitute an episode of care for a given patient—which may be furnished by different providers, such as hospitals, providers of postacute care, and physicians.
65 The goal is to improve the
efficiency and quality of care by aligning the financial incentives of different providers.
Medicare recently started experimenting with payment models such as ACOs and bundled payments, and their ultimate effects on cost, quality of care, and the financial performance of hospitals and other providers are uncertain. An important feature of such models is that they give hospitals an incentive to coordinate with other providers or take other steps to reduce the total cost of care while enabling hospitals to share in the savings. Thus, if the new models work as intended, hospitals’ costs could fall by more than their revenues, partially offsetting the effects of the reductions in payment updates. Recent research suggests that Medicare ACOs have had varying levels of success with reducing spending, but it is unknown how successful the new payment models will be over time.
66 In addition, other providers
participating in such models could also seek to generate savings by avoiding or limiting hospital admissions, which could affect hospitals’ finances adversely.
Merging or Closing Some hospitals might respond to the financial pressures by consolidating with another hospital or hospital system. Consolidation may allow hospitals to make larger changes—such as combining departments, reducing excess capacity, or restructuring contracts with staff or suppliers—that allow them to provide
65
See Congressional Budget Office, Options for Reducing the Deficit: 2014 to 2023 (November 2013), pp. 224–233, www.cbo.gov/publication/44715. 66
See J. Michael McWilliams and others, “Early Performance of Accountable Care Organizations in Medicare,” The New England Journal of Medicine (April 13, 2016).
40
services more efficiently.67
As a result of increased bargaining power, consolidation may also allow hospitals to increase the prices they charge private payers.
68 There is little direct evidence on the effect of
hospital mergers on the quality of care. Two studies found no evidence that mergers have a significant effect on quality, while another study found that mergers are associated with higher inpatient mortality rates among heart disease patients.
69
Unprofitable hospitals may also decide to close. If the hospitals that do so are less efficient, the sector as a whole may become more efficient, on average, as a result.
70 However, hospital closures have also been
shown to increase prices for private payers at nearby remaining hospitals.71
Evidence on the effects of hospital closures on patient outcomes is mixed. For example, one study found that hospital closures in a large metropolitan area increased deaths for certain conditions for which prompt medical care is crucial (such as heart attacks) but had no effect on deaths for conditions for which prompt medical care is less important.
72 A recent national study found that hospital closures over the 2003–2011 period had no effect
on local mortality rates or hospital admission rates.73
Hospital mergers and closures have occurred often in the past. To the extent that mergers or closures occur in the future, it may be difficult to determine what caused them and whether or to what extent they might have occurred in the absence of changes to Medicare’s payments or other federal policies.
6. Conclusion The effects of the federal policies examined in this paper on hospitals’ financial performance are highly uncertain and will depend largely on the responses of hospitals. They will also be influenced by the
67
According to one study, the merger of two or more hospitals typically results in substantial savings, but the consolidation of hospitals into “systems,” which involves less integration between hospitals than occurs in mergers, generally does not result in cost savings. See David Dranove and Richard Lindrooth, “Hospital Consolidation and Costs: Another Look at the Evidence,” Journal of Health Economics, vol. 22, no. 6 (November 2003), pp. 983–997. 68
See Martin Gaynor and Robert Town, The Impact of Hospital Consolidation: Update, The Synthesis Project, Policy Brief No. 9 (Robert Wood Johnson Foundation, June 2012); and William B. Vogt and Robert Town, How Has Hospital Consolidation Affected the Price and Quality of Hospital Care? The Synthesis Project, Research Synthesis Report No. 9 (Robert Wood Johnson Foundation, February 2006). 69
See Tamara B. Hayford, “The Impact of Hospital Mergers on Treatment Intensity and Health Outcomes,” Health Services Research, vol. 47, no. 3 (June 2012), pp. 1008–1029, http://tinyurl.com/nbs2voa; Cory Stephen Capps, The Quality Effects of Hospital Mergers, Economic Analysis Group Discussion Paper 05-6 (Department of Justice, 2005); and Vivian Ho and Barton Hamilton, “Hospital Mergers and Acquisitions: Does Market Consolidation Harm Patients?” Journal of Health Economics, vol. 19, no. 5 (September 2000), pp. 767–791. 70
See Richard C. Lindrooth, Anthony T. Lo Sasso, and Gloria J. Bazzoli, ”The Effect of Urban Hospital Closure on Markets,” Journal of Health Economics, vol. 22, no. 5 (September 2003), pp. 691–712, www.sciencedirect.com/science/article/pii/S0167629603000602. 71
See Vivian Y. Wu, “The Price Effect of Hospital Closures,” Inquiry, vol. 45, no. 3 (August 2008), pp. 280–292, http://inq.sagepub.com/content/45/3/280.short. 72
Thomas C. Buchmueller and others, “How Far to the Hospital? The Effect of Hospital Closures on Access to Care,” Journal of Health Economics, vol. 25, no. 4 (July 2006), pp. 740–761, http://tinyurl.com/qynuvnr. 73
Karen E. Joynt and others, “Hospital Closures Had No Measureable Impact on Local Hospitalization Rates or Mortality Rates, 2003–11,” Health Affairs, vol. 34, no. 5 (May 2015), pp. 765–772.
41
effectiveness of new payment models that are being tested as well as variants of those models and other models that are likely to be tested in the future—or by other innovations that are difficult to foresee.
According to AHA data, the financial health of hospitals has generally improved in recent years. For example, aggregate hospital margins rose from 7.0 percent in 2011 to 8.3 percent in 2014, and the share of hospitals with a negative margin slipped from 24 percent to 23 percent during that period. That recent trend does not necessarily provide a good indicator of hospitals’ financial health in the longer term, however, because the reduction in Medicare’s payment rate updates has been in effect for only a few years, and hospitals benefited from the beginning of the coverage expansion. In addition, the AHA data indicate that hospitals’ payments from private payers grew relative to their costs of serving those patients during that period, but it is not clear whether that trend will persist.
It is also unclear whether the quality of care delivered by hospitals will continue to improve as it has in the past or whether improvements in quality will be slowed—or even reversed. Given those uncertainties and the importance of the hospital industry to the health care system and the U.S. economy, it will be important for policymakers and analysts to closely monitor hospitals’ financial performance, the quality of care they deliver, and patients’ access to hospital services in Medicare and more broadly.
42
Appendix A. Critical Access Hospitals
The Balanced Budget Act of 1997 authorized states to create a “Medicare Rural Hospital Flexibility Program,” which allows certain hospitals to be designated as critical access hospitals (CAHs). In order to attain CAH status, hospitals must be located more than a 35-mile drive from the closest hospital (15 miles in mountainous terrain). Before 2006, a hospital could convert to CAH status without meeting the distance requirement if it was certified by a state as a “necessary provider” for residents in the area. Starting in 2006, hospitals were required to meet the distance requirement to be classified as a CAH, although hospitals that had already attained CAH status without meeting the distance requirement were allowed to remain CAHs. As a result of that change in law, the number of CAHs in the United States has remained roughly constant since 2006—at about 1,200—after growing rapidly in previous years.
CAHs must have no more than 25 inpatient beds, with up to 10 additional beds in a separate rehabilitation or psychiatric unit, and operate an emergency department at all times. In addition, patients at CAHs must have an average length of stay of no more than 96 hours.
74 For the purposes of this paper, the primary
difference between CAHs and other acute care hospitals is that they are not paid under the inpatient and outpatient prospective payment systems that the Centers for Medicare & Medicaid Services (CMS) uses to pay most acute care hospitals. Instead, CMS pays those hospitals at 101 percent of reasonable costs for inpatient and outpatient services. As such, the reductions in payment updates in the Affordable Care Act are not applicable to CAHs. In 2011, there were a total of 1,265 CAHs in the cost report data, but they accounted for only 2 percent of Medicare discharges.
In general, CAHs are much more likely to be publicly owned than the average hospital (see Table A-1). More than 40 percent of CAHs are publicly owned (compared with 16 percent of hospitals in the main analysis). Likewise, CAHs are much less likely to have for-profit ownership (6 percent for CAHs versus 26 percent for hospitals in the main analysis). Virtually no CAHs are teaching hospitals, and nearly 90 percent of them are in rural areas.
75 CAHs are also more likely to treat Medicare patients: Those patients
account for more than 50 percent of discharges in 66 percent of CAHs, and they account for 25 percent to 50 percent of discharges in an additional 31 percent of CAHs. Despite Medicare’s higher payment rates, CAHs are also, on average, in somewhat worse financial shape than other acute care hospitals: Aggregate margins among CAHs were 4.0 percent in 2012, and 35 percent of CAHs had negative margins.
76
74
Centers for Medicare & Medicaid Services, Medicare Learning Network, Critical Access Hospital (September 2014), http://go.usa.gov/3GdvR. 75
CAHs are required to be located in a rural area—that is, outside a metropolitan statistical area, or MSA, as defined by the Office of Management and Budget—or to meet certain other criteria that qualify them as rural (such as being in an area designated as rural by state law). A small percentage of CAHs are classified as urban in Table A-1 because we based our estimates on whether or not areas are inside MSAs (that is, we did not account for the additional criteria that can be used to qualify a CAH as having a rural service area). 76
To construct those estimates of the financial performance of CAHs, we applied the same restrictions that we applied in constructing the tables in the main report. In particular, we excluded CAHs that had missing or incomplete information on revenues and expenses, extreme values for margins that we did not regard as credible, and cost reports covering only a portion of a year.
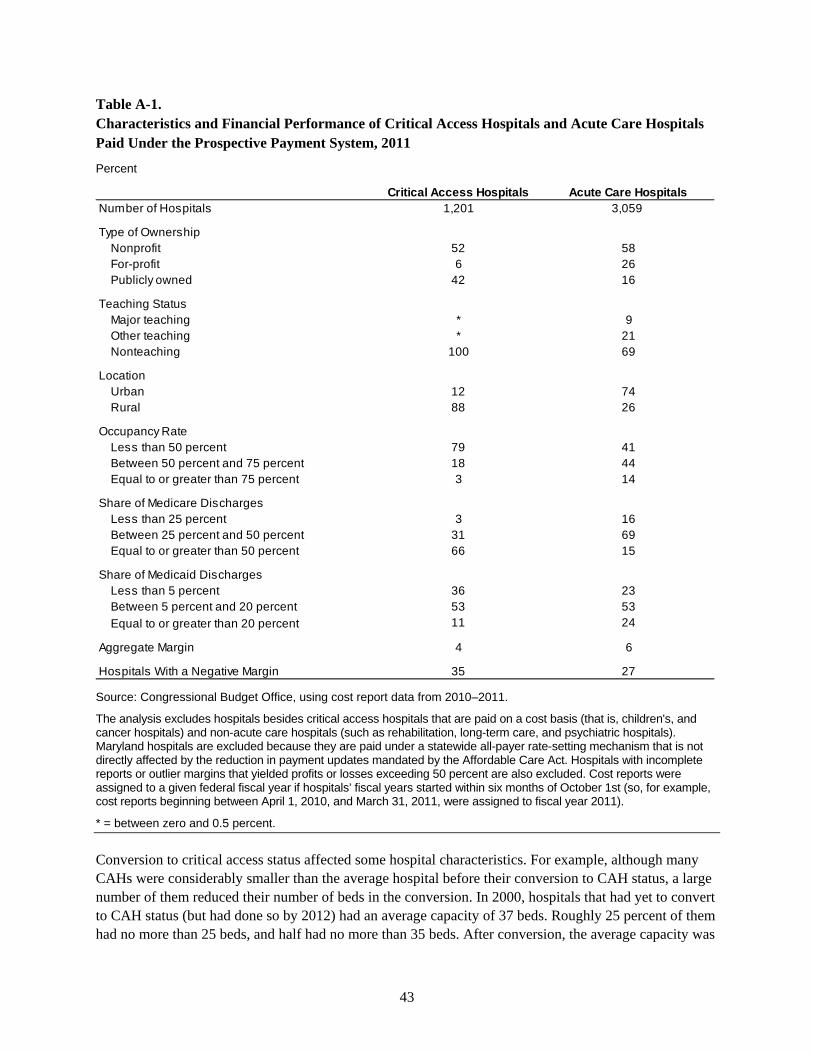
43
Table A-1. Characteristics and Financial Performance of Critical Access Hospitals and Acute Care Hospitals Paid Under the Prospective Payment System, 2011
Percent
Source: Congressional Budget Office, using cost report data from 2010–2011.
The analysis excludes hospitals besides critical access hospitals that are paid on a cost basis (that is, children's, and cancer hospitals) and non-acute care hospitals (such as rehabilitation, long-term care, and psychiatric hospitals). Maryland hospitals are excluded because they are paid under a statewide all-payer rate-setting mechanism that is not directly affected by the reduction in payment updates mandated by the Affordable Care Act. Hospitals with incomplete reports or outlier margins that yielded profits or losses exceeding 50 percent are also excluded. Cost reports were assigned to a given federal fiscal year if hospitals’ fiscal years started within six months of October 1st (so, for example, cost reports beginning between April 1, 2010, and March 31, 2011, were assigned to fiscal year 2011).
* = between zero and 0.5 percent.
Conversion to critical access status affected some hospital characteristics. For example, although many CAHs were considerably smaller than the average hospital before their conversion to CAH status, a large number of them reduced their number of beds in the conversion. In 2000, hospitals that had yet to convert to CAH status (but had done so by 2012) had an average capacity of 37 beds. Roughly 25 percent of them had no more than 25 beds, and half had no more than 35 beds. After conversion, the average capacity was
Critical Access Hospitals Acute Care HospitalsNumber of Hospitals 1,201 3,059
Type of OwnershipNonprofit 52 58For-profit 6 26Publicly owned 42 16
Teaching Status Major teaching * 9Other teaching * 21Nonteaching 100 69
LocationUrban 12 74Rural 88 26
Occupancy RateLess than 50 percent 79 41Between 50 percent and 75 percent 18 44Equal to or greater than 75 percent 3 14
Share of Medicare DischargesLess than 25 percent 3 16Between 25 percent and 50 percent 31 69Equal to or greater than 50 percent 66 15
Share of Medicaid DischargesLess than 5 percent 36 23Between 5 percent and 20 percent 53 53Equal to or greater than 20 percent 11 24
Aggregate Margin 4 6
Hospitals With a Negative Margin 35 27
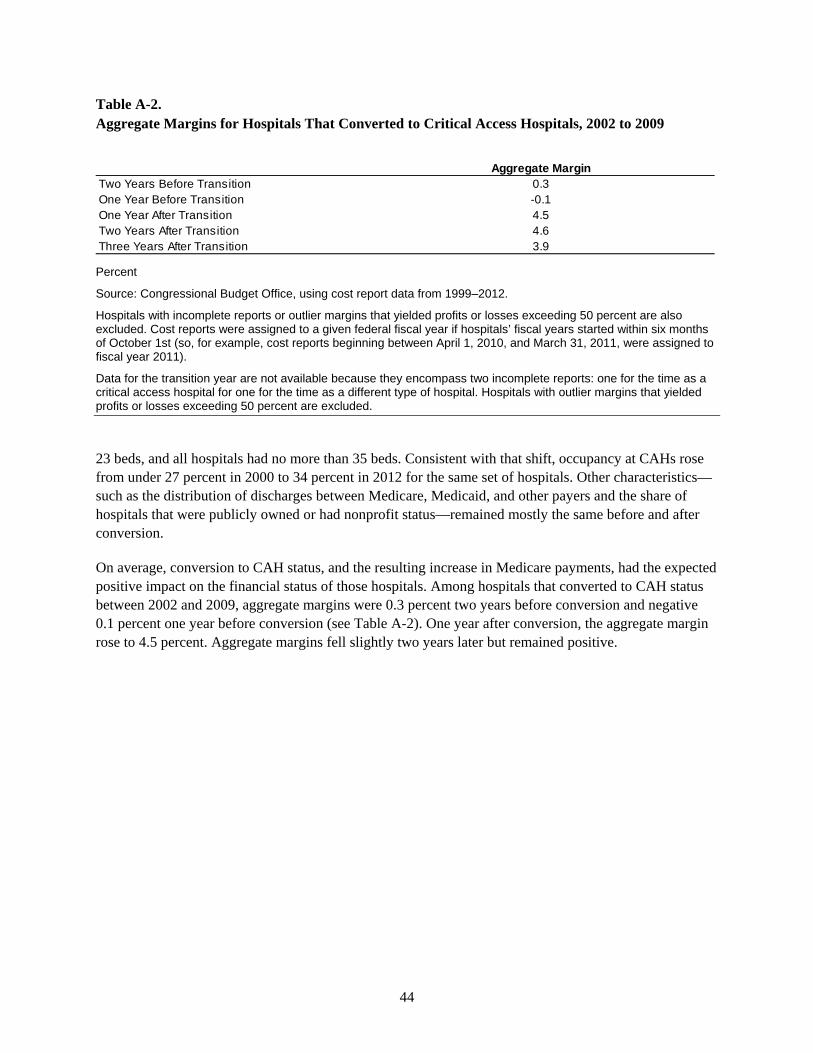
44
Table A-2. Aggregate Margins for Hospitals That Converted to Critical Access Hospitals, 2002 to 2009
Percent
Source: Congressional Budget Office, using cost report data from 1999–2012.
Hospitals with incomplete reports or outlier margins that yielded profits or losses exceeding 50 percent are also excluded. Cost reports were assigned to a given federal fiscal year if hospitals’ fiscal years started within six months of October 1st (so, for example, cost reports beginning between April 1, 2010, and March 31, 2011, were assigned to fiscal year 2011).
Data for the transition year are not available because they encompass two incomplete reports: one for the time as a critical access hospital for one for the time as a different type of hospital. Hospitals with outlier margins that yielded profits or losses exceeding 50 percent are excluded.
23 beds, and all hospitals had no more than 35 beds. Consistent with that shift, occupancy at CAHs rose from under 27 percent in 2000 to 34 percent in 2012 for the same set of hospitals. Other characteristics—such as the distribution of discharges between Medicare, Medicaid, and other payers and the share of hospitals that were publicly owned or had nonprofit status—remained mostly the same before and after conversion.
On average, conversion to CAH status, and the resulting increase in Medicare payments, had the expected positive impact on the financial status of those hospitals. Among hospitals that converted to CAH status between 2002 and 2009, aggregate margins were 0.3 percent two years before conversion and negative 0.1 percent one year before conversion (see Table A-2). One year after conversion, the aggregate margin rose to 4.5 percent. Aggregate margins fell slightly two years later but remained positive.
Aggregate MarginTwo Years Before Transition 0.3One Year Before Transition -0.1One Year After Transition 4.5Two Years After Transition 4.6Three Years After Transition 3.9
45
Appendix B. The Persistence of Negative Margins
More than one-quarter of hospitals had a negative margin in 2011, according to this analysis. That estimate is generally in line with estimates from the American Hospital Association, which indicate that the share of hospitals with a negative margin has averaged about one-quarter over the past 20 years. Those findings raise interesting questions about how persistent negative margins tend to be, what happens when hospitals have negative margins in multiple years, and whether hospitals with a negative margin in a given year are less likely than other hospitals to remain in operation.
To answer those questions, we examined the percentage of hospitals with negative margins in each year during the 2000–2007 period. (We chose that period to have a considerable length of time largely unaffected by the severe recession that began in December 2007.) Among hospitals that remained in operation during that eight-year period, 22 percent had negative margins for at least four years, and 14 percent had negative margins for at least five years (see Figure B-1). Only 35 percent of hospitals never had a year with a negative margin during that time. Changing the analysis to examine hospitals with margins below negative 1 percent yields a similar pattern: Nearly 17 percent of hospitals had margins below negative 1 percent for at least four years, and 10 percent of hospitals had margins below that threshold for at least five years. We also obtained a very similar pattern for hospitals classified by ownership status (nonprofit, for-profit, or publicly owned). Thus, the findings regarding the persistence of negative margins for the entire sample are not driven by the experiences of hospitals under a particular type of ownership or by limitations in the data that vary by type of ownership. We excluded from the analysis hospitals that converted to critical access hospitals and those that closed or were acquired by another hospital between 2000 and 2007. Hospitals that closed or were acquired by another hospital during that period were more likely to have had at least one year with a negative margin, but persistent negative margins do not necessarily lead to a hospital’s closure or acquisition.
We next examined whether and to what extent hospitals that had a negative margin in 2000 were less likely to have still been in operation in 2007 than hospitals that had a positive margin in 2000. We found that 29 percent of hospitals had a negative margin in 2000 and that 78 percent of those hospitals were still in operation in 2007 (that is, they had neither closed nor been acquired by another hospital). By comparison, 93 percent of the hospitals that had a positive margin in 2000 were still in operation in 2007. Thus, although it is not uncommon for hospitals to operate while experiencing negative margins—even for several years—negative margins are slightly predictive of closing or being acquired by another hospital.
For-profit hospitals are less likely to remain in operation than nonprofit and public hospitals, regardless of whether they have positive or negative margins. Among hospitals that experienced a negative margin in 2000, 64 percent of for-profit hospitals were still in operation in 2007, compared with 86 percent of public hospitals and 80 percent of nonprofit hospitals. Among hospitals that experienced a positive margin in 2000, 85 percent of for-profit hospitals were still in operation in 2007, compared with 94 percent of both nonprofit and public hospitals.
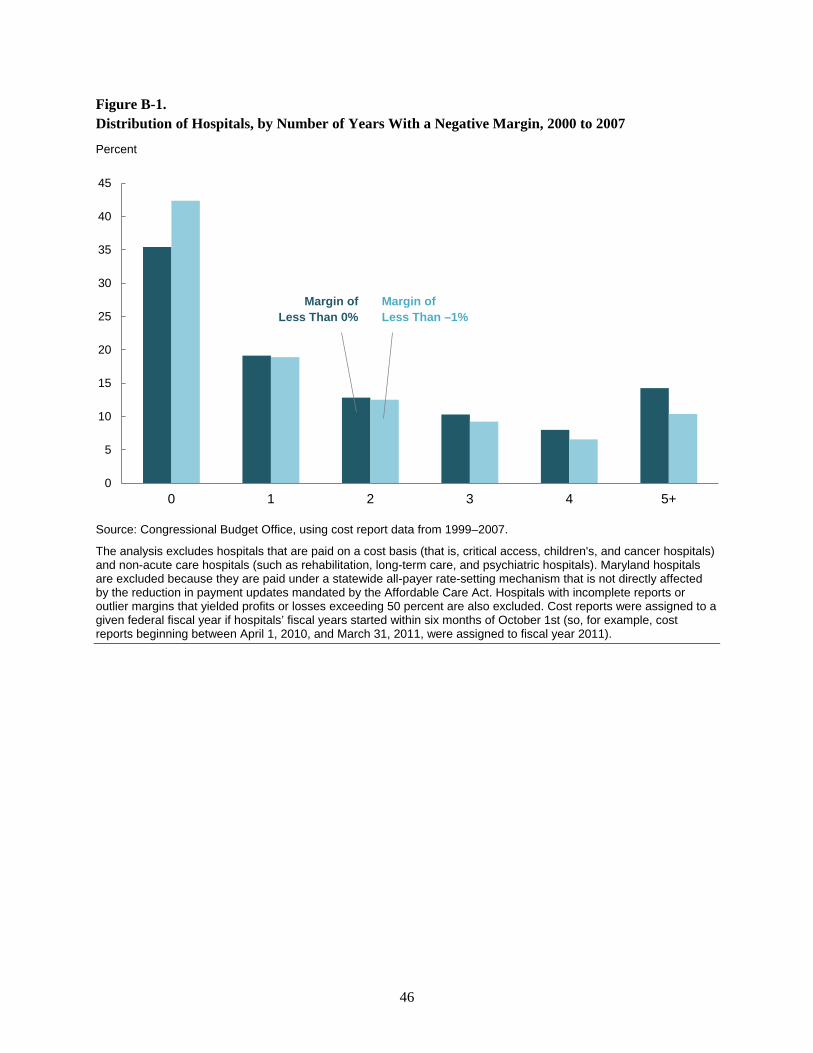
46
Figure B-1. Distribution of Hospitals, by Number of Years With a Negative Margin, 2000 to 2007
Percent
Source: Congressional Budget Office, using cost report data from 1999–2007.
The analysis excludes hospitals that are paid on a cost basis (that is, critical access, children's, and cancer hospitals) and non-acute care hospitals (such as rehabilitation, long-term care, and psychiatric hospitals). Maryland hospitals are excluded because they are paid under a statewide all-payer rate-setting mechanism that is not directly affected by the reduction in payment updates mandated by the Affordable Care Act. Hospitals with incomplete reports or outlier margins that yielded profits or losses exceeding 50 percent are also excluded. Cost reports were assigned to a given federal fiscal year if hospitals’ fiscal years started within six months of October 1st (so, for example, cost reports beginning between April 1, 2010, and March 31, 2011, were assigned to fiscal year 2011).
0
5
10
15
20
25
30
35
40
45
0 1 2 3 4 5+
Margin of Less Than 0%
Margin of Less Than –1%
47
Appendix C. Hospital Margins Over Multiple Years
For the projections presented in this paper, we used 2011 as the base year and calculated the share of hospitals that would have negative profit margins in each year of the projection period (2012 to 2025) under the various scenarios. An alternative approach we considered was to compute the average margin for each hospital over a period of several years and then project the share of hospitals that would have negative margins over a multiyear period in the future. A potential advantage of that alternative approach is that margins averaged over several years are likely to exhibit less random fluctuation than margins in a single year and thus might provide a clearer picture of hospitals’ financial status. A hospital that lost money in one year but was profitable, on average, over a longer period would face less financial stress than a hospital that lost money year after year.
To investigate that issue, we computed average margins over the 2004–2007 period. We chose that period to have several years of data that were unaffected by the recent severe recession. We found that the share of hospitals with negative margins over that period—22 percent—was only slightly lower than the share in a given year. When we weighted the averages by revenues (thus constructing hospitals’ margins on the basis of overall revenues and costs for the time period), the share with negative margins slipped to 21 percent. For comparison, the unweighted share of hospitals with negative margins in a single year within that period was only slightly higher, ranging from 22 percent (in 2005) to 25 percent (in 2004).
That finding suggests that measuring and projecting the share of hospitals with negative margins for a single year provides useful information about the extent of financial pressures that hospitals face. Single-year margins offer several other advantages, too. Unlike multiyear margins, single-year margins are directly comparable to the projections made by the actuaries at the Centers for Medicare & Medicaid Services. In addition, they are less complicated to calculate. Developing a model to project the margins of a given hospital over a multiyear period would be a complex task, because it would have to take into account quantitatively the correlations of hospitals’ margins across years (that is, how the probability of having a negative margin in one year depended on the path of margins in previous years). Those historical correlations would reflect both the pressures that hospitals face and their responses to those pressures, whereas our projections are designed to isolate the pressures only and not hospitals’ responses.
48
Appendix D. Projections of the Share of Revenues in Hospitals With a Negative Margin
Projections of the share of total revenue in hospitals with a negative margin are useful because they provide information on the relative size of such hospitals. In the base year (2011), hospitals with a negative margin were smaller than average; in particular, the 27 percent of hospitals with a negative margin in 2011 received 17 percent of total hospital revenue. That same pattern holds for the projections in 2025, but that largely reflects the simple approach we adopted for this analysis. Specifically, we did not account for any possible responses by hospitals (such as closures, mergers, or acquisitions) or changes in services offered that might alter the distribution of patient revenue across hospitals.
Under Scenario 1 analyzed in this paper (which incorporates the effects of the reductions in Medicare’s payment updates while holding all other factors constant) and assuming that hospitals achieved the same productivity growth as the economy as a whole through 2025, we project that the share of revenue in hospitals with a negative margin would increase from 17 percent in 2011 to 25 percent in 2025 (see Table D-1, column 4, top panel). If hospitals’ productivity grew at 0.4 percent annually during that period, we project that the share of revenue in hospitals with a negative margin would rise to 38 percent in 2025. However, if hospitals’ productivity remained constant during that period, we project that the share of revenue in hospitals with a negative margin would rise to 50 percent in 2025. The percentage-point changes in the share of revenue in hospitals with a negative margin are similar to the changes in the share of hospitals with a negative margin—and that similarity holds for all of the scenarios analyzed in this paper.
Scenarios 2 and 3 build on the previous scenarios by incorporating the effects of the coverage expansions, the Affordable Care Act’s cuts in disproportionate share hospital payments, and quality-related penalties. Under scenario 3, if hospitals achieved the same productivity growth as the economy as a whole through 2025, we project that the share of revenue in hospitals with a negative margin would rise from 17 percent in 2011 to 23 percent in 2025 (see Table D-1, column 8, top panel). If hospitals’ productivity grew at 0.4 percent annually, we project that the share of revenue in hospitals with a negative margin would rise to 35 percent in 2025. However, if hospitals’ productivity remained constant, we project that the share of revenue in hospitals with a negative margin would rise to 46 percent.
The final scenario builds on the previous scenarios by incorporating various reductions in hospitals’ payments that were not part of the Affordable Care Act. It thus reflects the net effect of all factors included in this paper. If hospitals achieved the same productivity growth as the economy as a whole 2025, we project that the share of revenue in hospitals with a negative margin under that scenario would rise from 17 percent in 2011 to 33 percent in 2025 (see Table D-1, column 10, top panel). If hospitals’ productivity grew at 0.4 percent annually, we project that the share of revenue in hospitals with a negative margin would rise to 44 percent in 2025. However, if hospitals’ productivity remained constant, we project that the share of revenue in hospitals with a negative margin would rise to 54 percent in 2025.
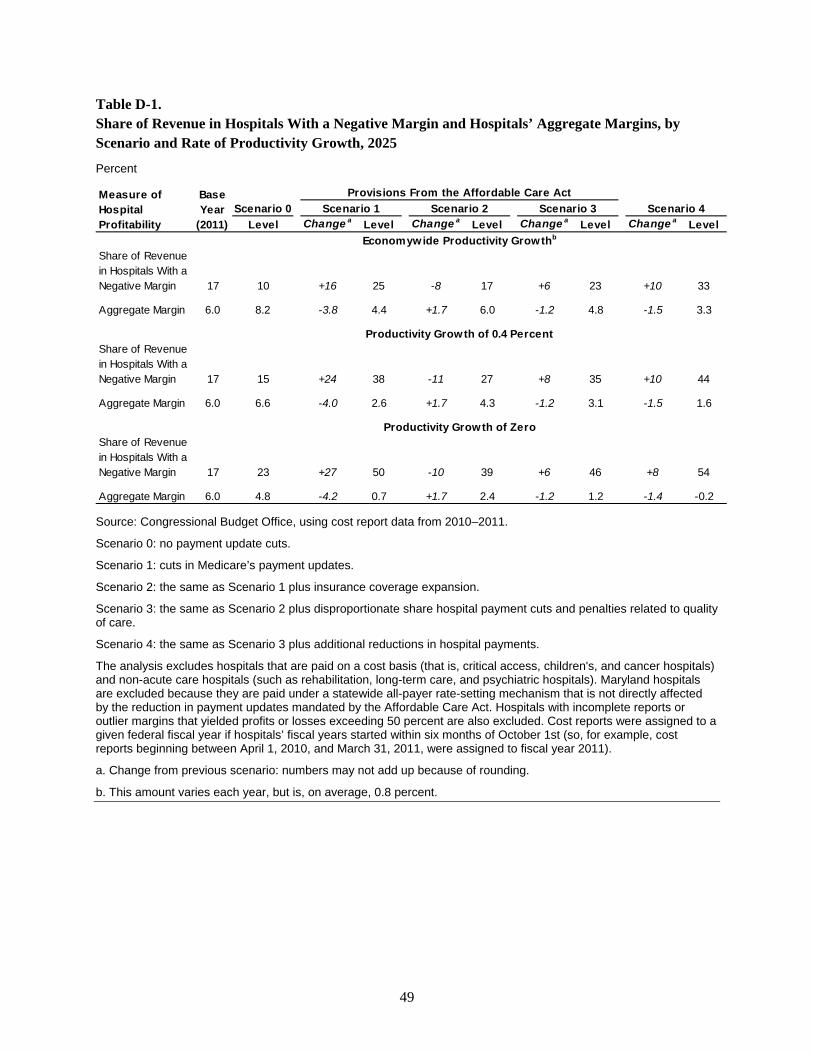
49
Table D-1. Share of Revenue in Hospitals With a Negative Margin and Hospitals’ Aggregate Margins, by Scenario and Rate of Productivity Growth, 2025
Percent
Source: Congressional Budget Office, using cost report data from 2010–2011.
Scenario 0: no payment update cuts.
Scenario 1: cuts in Medicare’s payment updates.
Scenario 2: the same as Scenario 1 plus insurance coverage expansion.
Scenario 3: the same as Scenario 2 plus disproportionate share hospital payment cuts and penalties related to quality of care.
Scenario 4: the same as Scenario 3 plus additional reductions in hospital payments.
The analysis excludes hospitals that are paid on a cost basis (that is, critical access, children's, and cancer hospitals) and non-acute care hospitals (such as rehabilitation, long-term care, and psychiatric hospitals). Maryland hospitals are excluded because they are paid under a statewide all-payer rate-setting mechanism that is not directly affected by the reduction in payment updates mandated by the Affordable Care Act. Hospitals with incomplete reports or outlier margins that yielded profits or losses exceeding 50 percent are also excluded. Cost reports were assigned to a given federal fiscal year if hospitals’ fiscal years started within six months of October 1st (so, for example, cost reports beginning between April 1, 2010, and March 31, 2011, were assigned to fiscal year 2011).
a. Change from previous scenario: numbers may not add up because of rounding.
b. This amount varies each year, but is, on average, 0.8 percent.
Scenario 0Level Change a Level Change a Level Change a Level Change a Level
Share of Revenue in Hospitals With a Negative Margin 17 10 +16 25 -8 17 +6 23 +10 33
Aggregate Margin 6.0 8.2 -3.8 4.4 +1.7 6.0 -1.2 4.8 -1.5 3.3
Share of Revenue in Hospitals With a Negative Margin 17 15 +24 38 -11 27 +8 35 +10 44
Aggregate Margin 6.0 6.6 -4.0 2.6 +1.7 4.3 -1.2 3.1 -1.5 1.6
Share of Revenue in Hospitals With a Negative Margin 17 23 +27 50 -10 39 +6 46 +8 54
Aggregate Margin 6.0 4.8 -4.2 0.7 +1.7 2.4 -1.2 1.2 -1.4 -0.2
Productivity Growth of Zero
Productivity Growth of 0.4 Percent
Economywide Productivity Growthb
Provisions From the Affordable Care ActScenario 1 Scenario 2 Scenario 3 Scenario 4
Base Year
(2011)
Measure of Hospital Profitability