project financial appraisal skills- finance for non financial managers course
TRANSCRIPT

www.businessservicessupport.com
PROJECT FINANCIAL APPRAISAL
TECHNIQUES- PART OF OUR ADVANCED
FINANCE FOR NON FINANCIAL MANAGERS
COURSE PROGRAMME
COPYRIGHT© TO BUSINESS SERVICES SUPPORT LIMITED 2011
KEY OBJECTIVES
What is financial evaluation
Why project financial evaluation techniques
Project financial risks assessment
Practice illustration of financial plan
2
COPYRIGHT© TO BUSINESS SERVICES SUPPORT LIMITED 2011
DEFINITION OF FINANCIAL EVALUATION
Concern with the assessment of financial viability of projects
Assessment of risk profile and financial efficiency
3
COPYRIGHT© TO BUSINESS SERVICES SUPPORT LIMITED 2011
WHY PROJECT FINANCIAL EVALUATION
Does the project create financial wealth
How quickly can we recover project investment
How risky is the project vis a viv it returns potentials
How much capital do we need to invest
4
COPYRIGHT© TO BUSINESS SERVICES SUPPORT LIMITED 2011
Demand Risk
Competition Risk
Financial Risk
Operational Risk
Interest Rate Risk
FINANCIAL RISKS FACING PROJECTS
5
COPYRIGHT© TO BUSINESS SERVICES SUPPORT LIMITED 2011
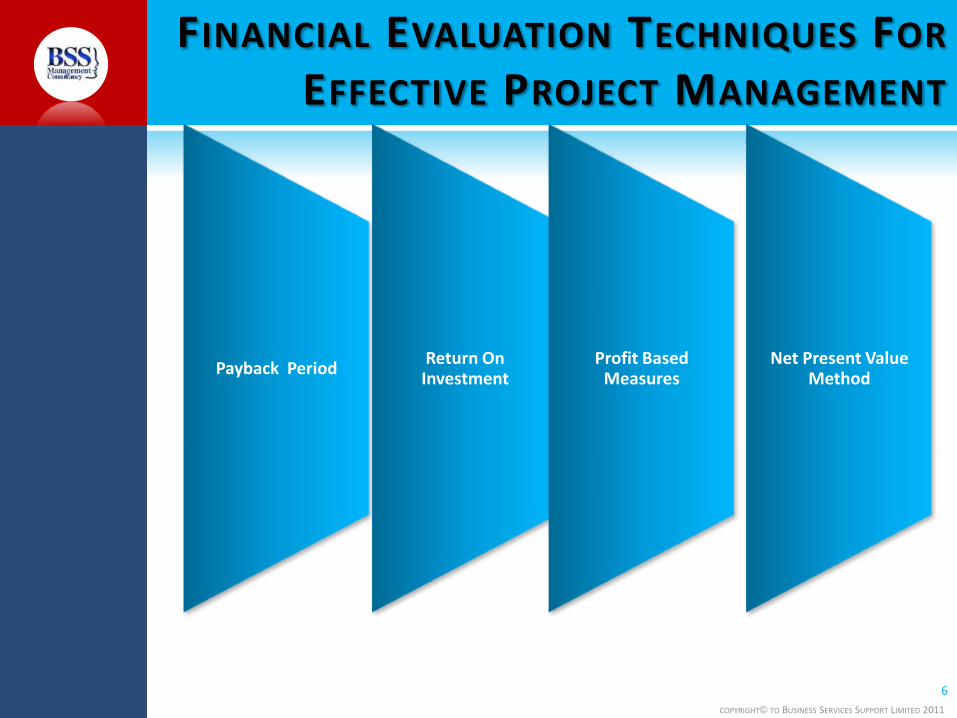
FINANCIAL EVALUATION TECHNIQUES FOR
EFFECTIVE PROJECT MANAGEMENT
6
Payback PeriodReturn On Investment
Profit Based Measures
Net Present Value Method
COPYRIGHT© TO BUSINESS SERVICES SUPPORT LIMITED 2011
PAYBACK PERIOD TECHNIQUE
7
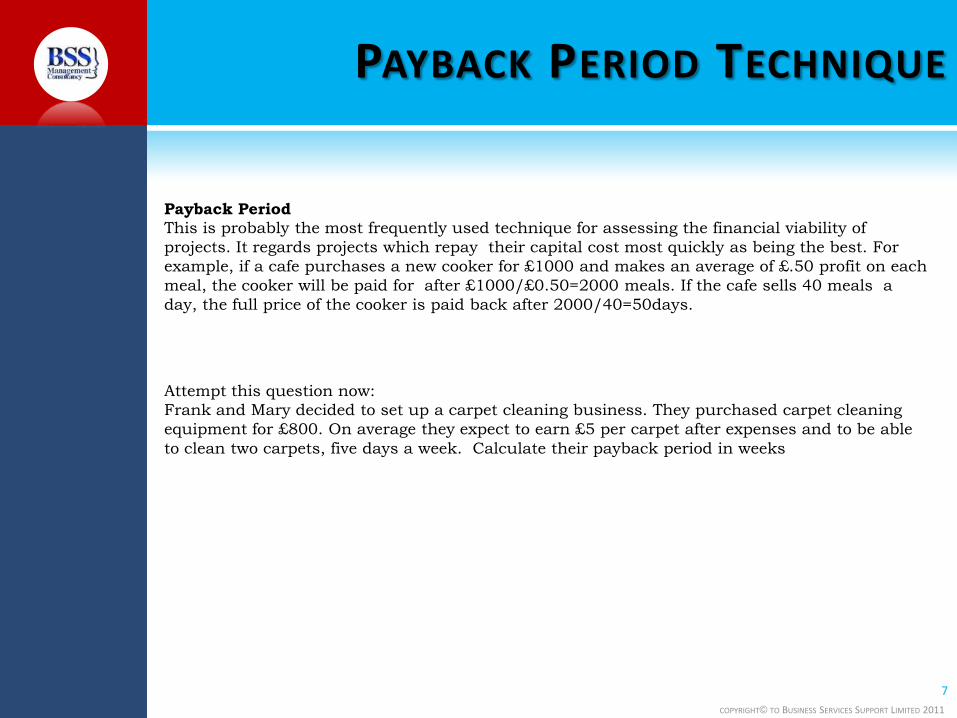
Payback Period
This is probably the most frequently used technique for assessing the financial viability of
projects. It regards projects which repay their capital cost most quickly as being the best. For
example, if a cafe purchases a new cooker for £1000 and makes an average of £.50 profit on each
meal, the cooker will be paid for after £1000/£0.50=2000 meals. If the cafe sells 40 meals a
day, the full price of the cooker is paid back after 2000/40=50days.
Attempt this question now:
Frank and Mary decided to set up a carpet cleaning business. They purchased carpet cleaning
equipment for £800. On average they expect to earn £5 per carpet after expenses and to be able
to clean two carpets, five days a week. Calculate their payback period in weeks
COPYRIGHT© TO BUSINESS SERVICES SUPPORT LIMITED 2011
PAYBACK PERIOD TECHNIQUE
8
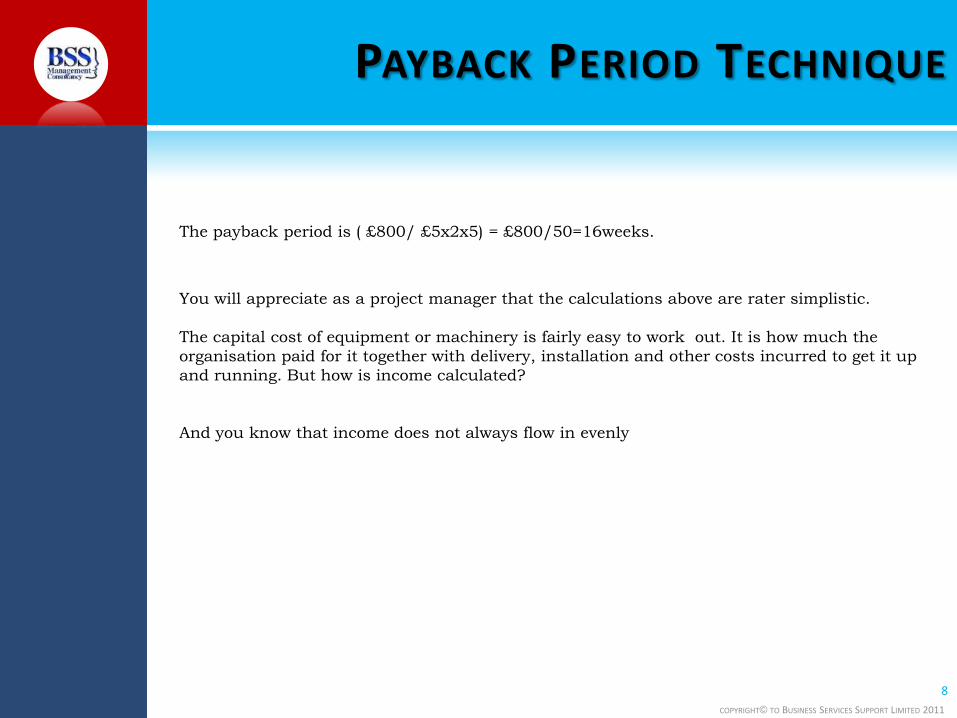
The payback period is ( £800/ £5x2x5) = £800/50=16weeks.
You will appreciate as a project manager that the calculations above are rater simplistic.
The capital cost of equipment or machinery is fairly easy to work out. It is how much the
organisation paid for it together with delivery, installation and other costs incurred to get it up
and running. But how is income calculated?
And you know that income does not always flow in evenly
COPYRIGHT© TO BUSINESS SERVICES SUPPORT LIMITED 2011
PROJECT MANAGEMENT – REVENUE
& COST PROJECTIONS
9
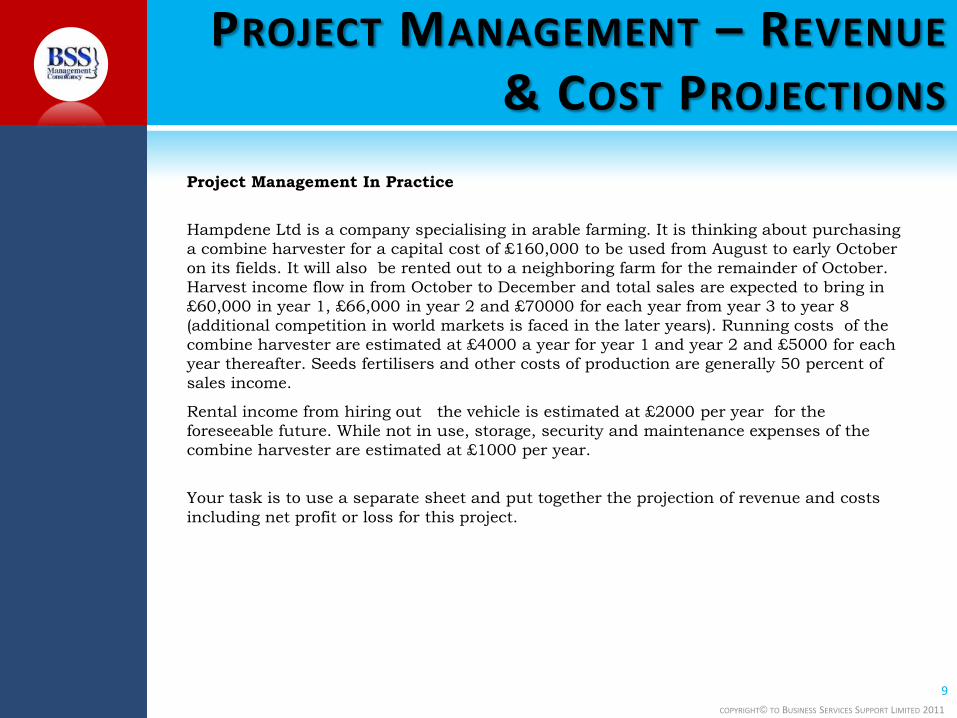
Project Management In Practice
Hampdene Ltd is a company specialising in arable farming. It is thinking about purchasing
a combine harvester for a capital cost of £160,000 to be used from August to early October
on its fields. It will also be rented out to a neighboring farm for the remainder of October.
Harvest income flow in from October to December and total sales are expected to bring in
£60,000 in year 1, £66,000 in year 2 and £70000 for each year from year 3 to year 8
(additional competition in world markets is faced in the later years). Running costs of the
combine harvester are estimated at £4000 a year for year 1 and year 2 and £5000 for each
year thereafter. Seeds fertilisers and other costs of production are generally 50 percent of
sales income.
Rental income from hiring out the vehicle is estimated at £2000 per year for the
foreseeable future. While not in use, storage, security and maintenance expenses of the
combine harvester are estimated at £1000 per year.
Your task is to use a separate sheet and put together the projection of revenue and costs
including net profit or loss for this project.
COPYRIGHT© TO BUSINESS SERVICES SUPPORT LIMITED 2011
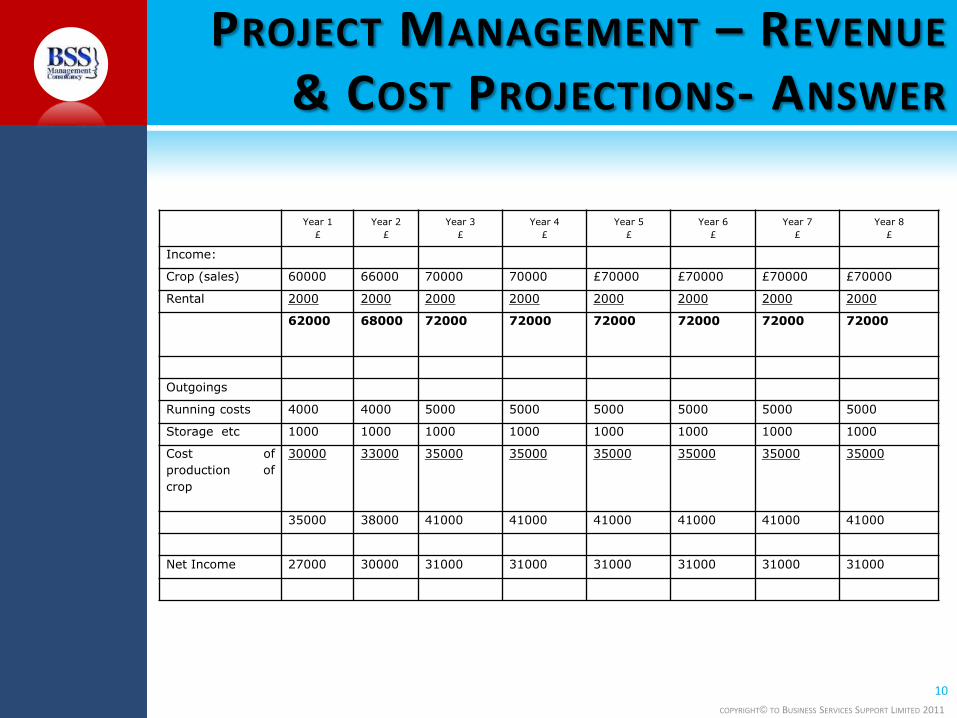
PROJECT MANAGEMENT – REVENUE
& COST PROJECTIONS- ANSWER
10
Year 1
£
Year 2
£
Year 3
£
Year 4
£
Year 5
£
Year 6
£
Year 7
£
Year 8
£
Income:
Crop (sales) 60000 66000 70000 70000 £70000 £70000 £70000 £70000
Rental 2000 2000 2000 2000 2000 2000 2000 2000
62000 68000 72000 72000 72000 72000 72000 72000
Outgoings
Running costs 4000 4000 5000 5000 5000 5000 5000 5000
Storage etc 1000 1000 1000 1000 1000 1000 1000 1000
Cost of
production of
crop
30000 33000 35000 35000 35000 35000 35000 35000
35000 38000 41000 41000 41000 41000 41000 41000
Net Income 27000 30000 31000 31000 31000 31000 31000 31000
COPYRIGHT© TO BUSINESS SERVICES SUPPORT LIMITED 2011
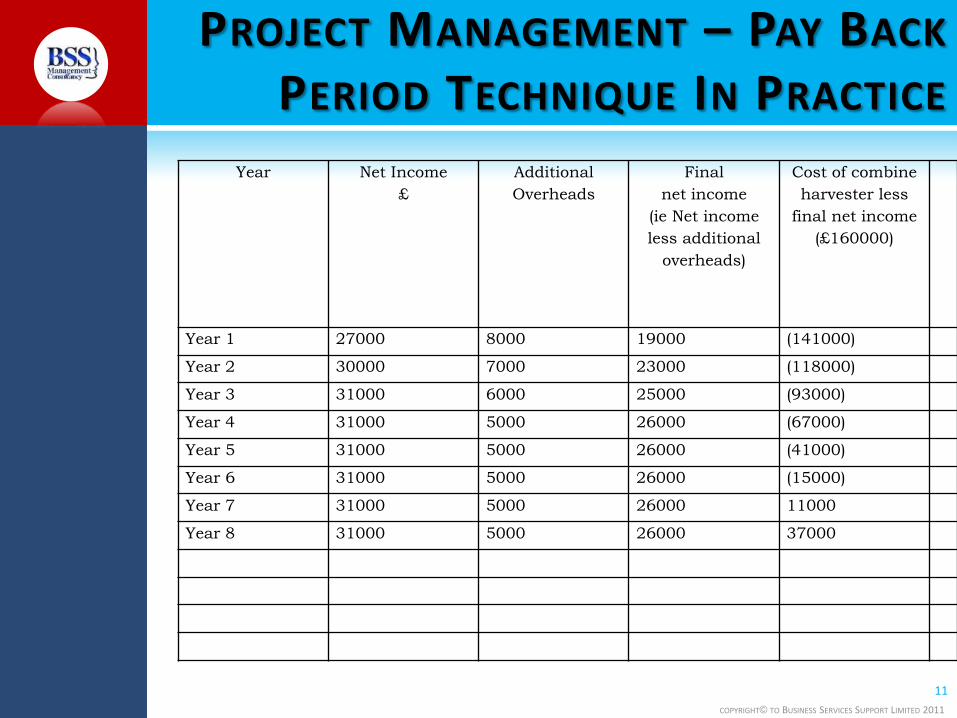
PROJECT MANAGEMENT – PAY BACK
PERIOD TECHNIQUE IN PRACTICE
11
Year Net Income
£
Additional
Overheads
Final
net income
(ie Net income
less additional
overheads)
Cost of combine
harvester less
final net income
(£160000)
Year 1 27000 8000 19000 (141000)
Year 2 30000 7000 23000 (118000)
Year 3 31000 6000 25000 (93000)
Year 4 31000 5000 26000 (67000)
Year 5 31000 5000 26000 (41000)
Year 6 31000 5000 26000 (15000)
Year 7 31000 5000 26000 11000
Year 8 31000 5000 26000 37000
COPYRIGHT© TO BUSINESS SERVICES SUPPORT LIMITED 2011
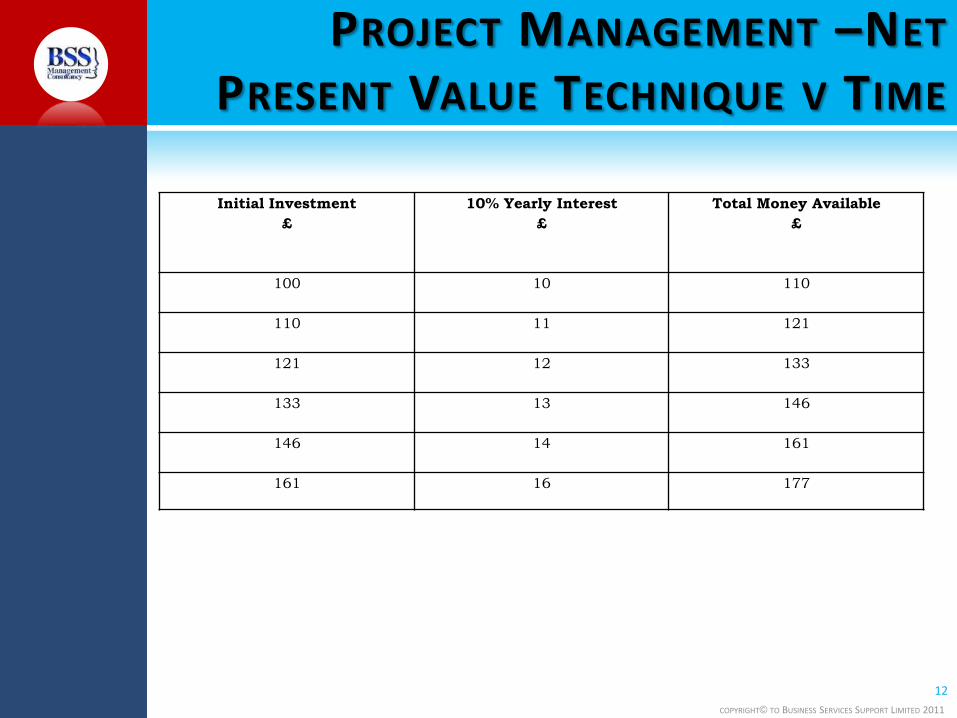
PROJECT MANAGEMENT –NET
PRESENT VALUE TECHNIQUE V TIME
12
Initial Investment
£
10% Yearly Interest
£
Total Money Available
£
100 10 110
110 11 121
121 12 133
133 13 146
146 14 161
161 16 177
COPYRIGHT© TO BUSINESS SERVICES SUPPORT LIMITED 2011
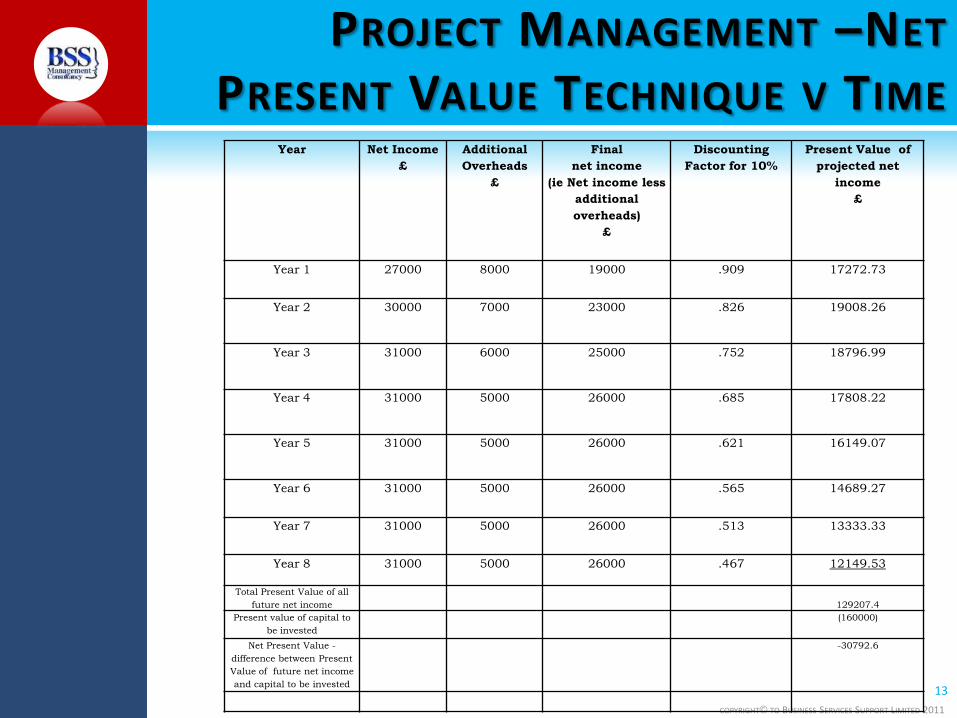
PROJECT MANAGEMENT –NET
PRESENT VALUE TECHNIQUE V TIME
13
Year Net Income
£
Additional
Overheads
£
Final
net income
(ie Net income less
additional
overheads)
£
Discounting
Factor for 10%
Present Value of
projected net
income
£
Year 1 27000 8000 19000 .909 17272.73
Year 2 30000 7000 23000 .826 19008.26
Year 3 31000 6000 25000 .752 18796.99
Year 4 31000 5000 26000 .685 17808.22
Year 5 31000 5000 26000 .621 16149.07
Year 6 31000 5000 26000 .565 14689.27
Year 7 31000 5000 26000 .513 13333.33
Year 8 31000 5000 26000 .467 12149.53
Total Present Value of all
future net income 129207.4
Present value of capital to
be invested
(160000)
Net Present Value -
difference between Present
Value of future net income
and capital to be invested
-30792.6
COPYRIGHT© TO BUSINESS SERVICES SUPPORT LIMITED 2011
CONCLUSION – THE END
For more information about our courses visit:
http://www.businessservicessupport.com
14