progress monitoring implementation: introduction to the ... · progress monitoring implementation:...
TRANSCRIPT
Progress Monitoring Implementation:
Introduction to the
PBS Implementation Checklist (PIC)
and Tier 1 PBS Walkthrough Heather Peshak George, Ph.D.
University of South FloridaMarch 11, 2011
8th International Conference on Positive Behavior Support: Denver, CO
2
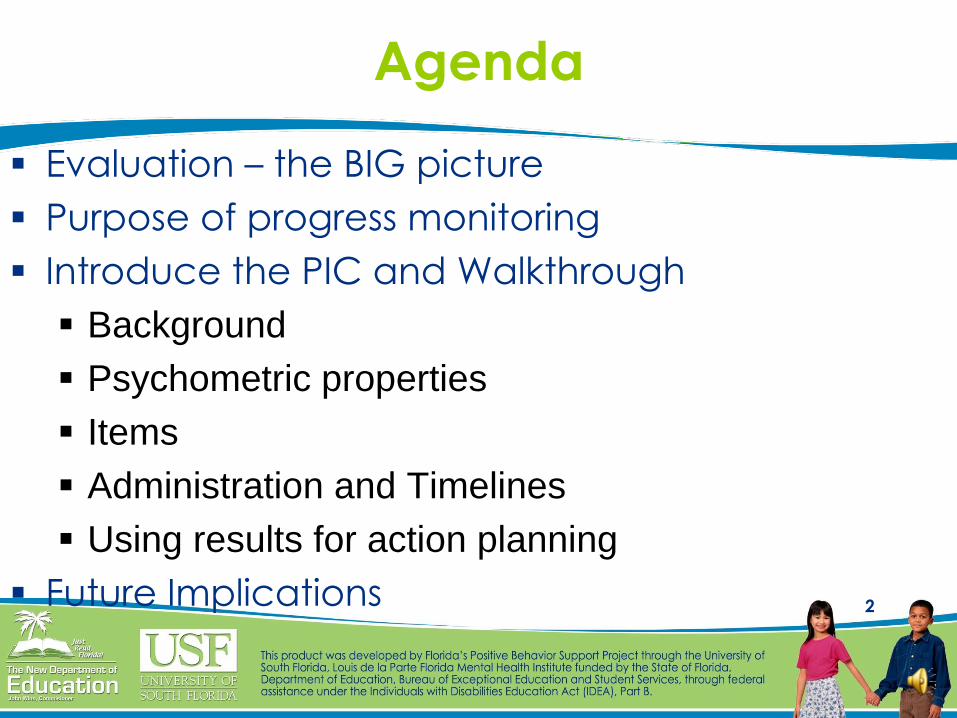
Agenda
Evaluation – the BIG picture
Purpose of progress monitoring
Introduce the PIC and Walkthrough
Background
Psychometric properties
Items
Administration and Timelines
Using results for action planning
Future Implications
3
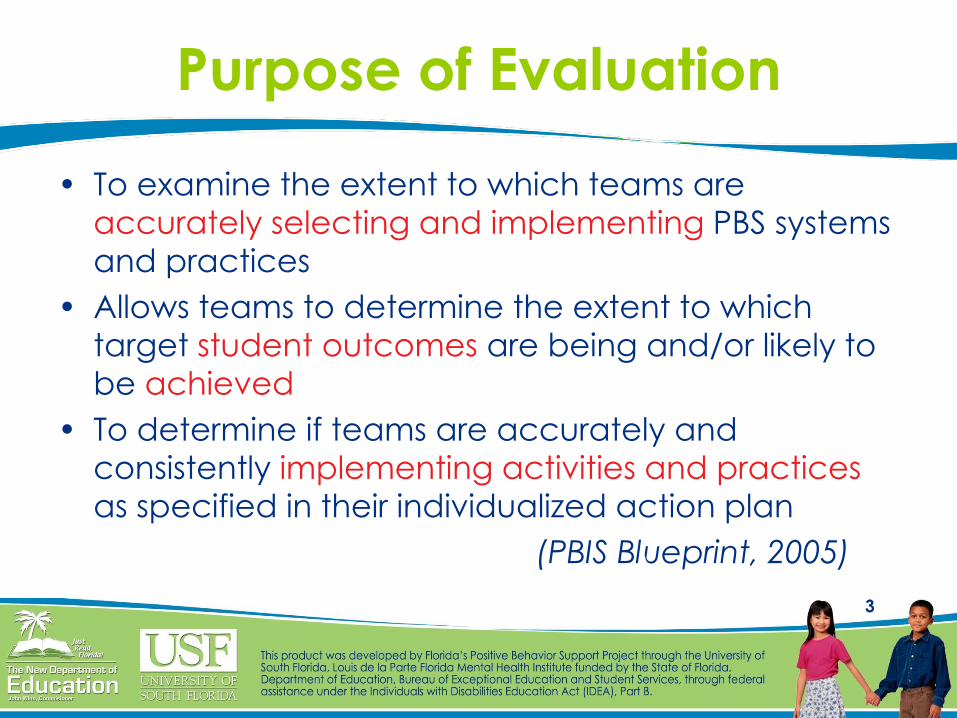
Purpose of Evaluation
• To examine the extent to which teams are
accurately selecting and implementing PBS systems
and practices
• Allows teams to determine the extent to which
target student outcomes are being and/or likely to
be achieved
• To determine if teams are accurately and
consistently implementing activities and practices
as specified in their individualized action plan
(PBIS Blueprint, 2005)
4
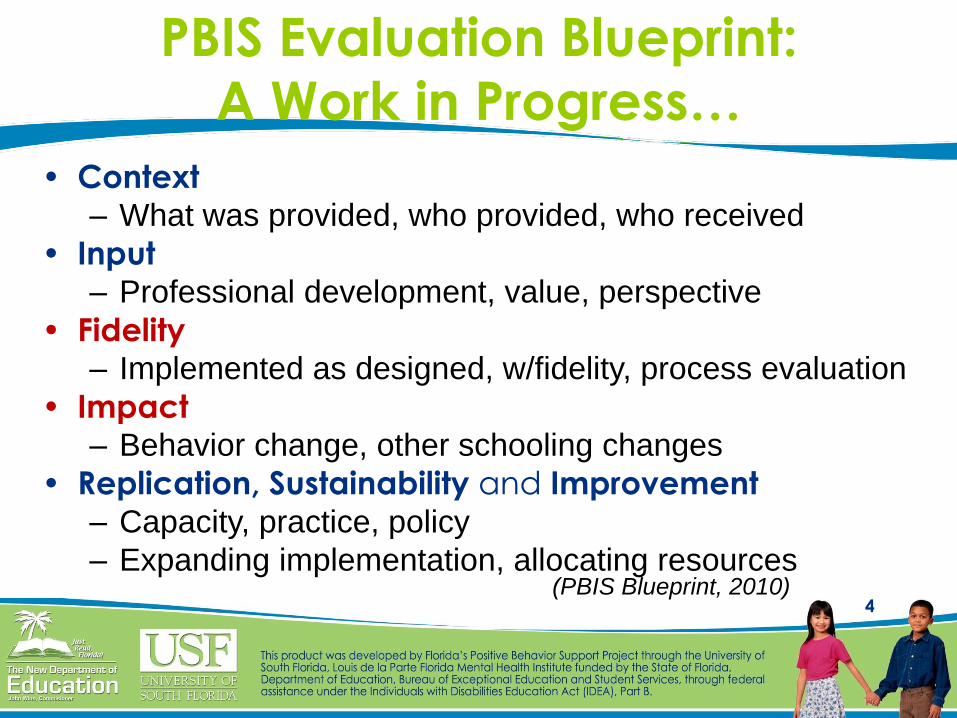
PBIS Evaluation Blueprint:
A Work in Progress…
• Context– What was provided, who provided, who received
• Input– Professional development, value, perspective
• Fidelity– Implemented as designed, w/fidelity, process evaluation
• Impact– Behavior change, other schooling changes
• Replication, Sustainability and Improvement– Capacity, practice, policy
– Expanding implementation, allocating resources(PBIS Blueprint, 2010)
5
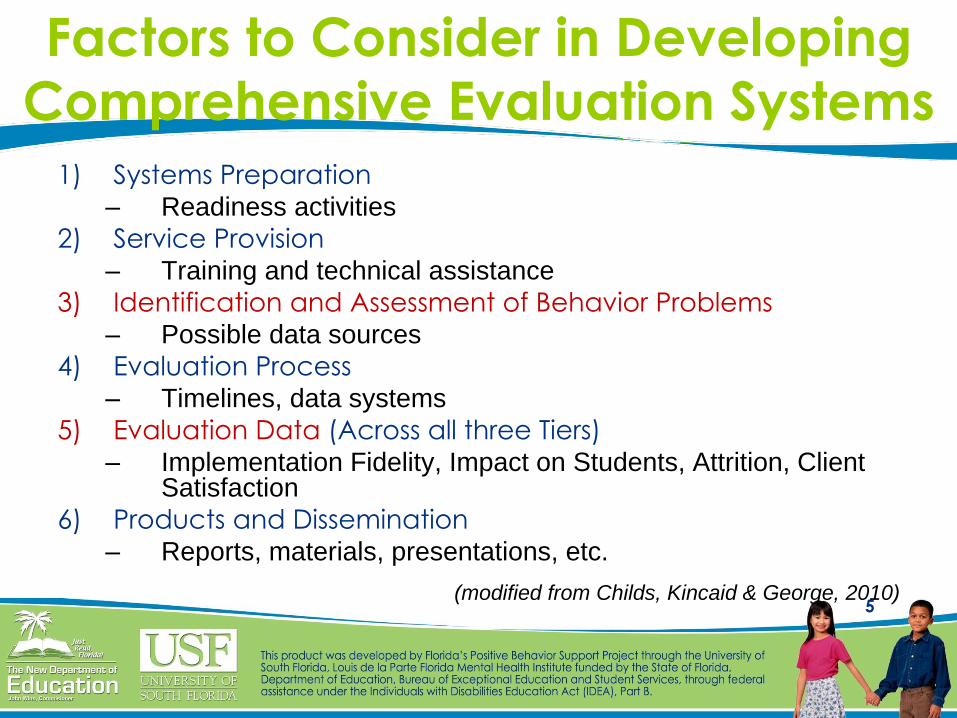
Factors to Consider in Developing
Comprehensive Evaluation Systems
1) Systems Preparation– Readiness activities
2) Service Provision– Training and technical assistance
3) Identification and Assessment of Behavior Problems– Possible data sources
4) Evaluation Process– Timelines, data systems
5) Evaluation Data (Across all three Tiers)– Implementation Fidelity, Impact on Students, Attrition, Client
Satisfaction
6) Products and Dissemination– Reports, materials, presentations, etc.
(modified from Childs, Kincaid & George, 2010)
6
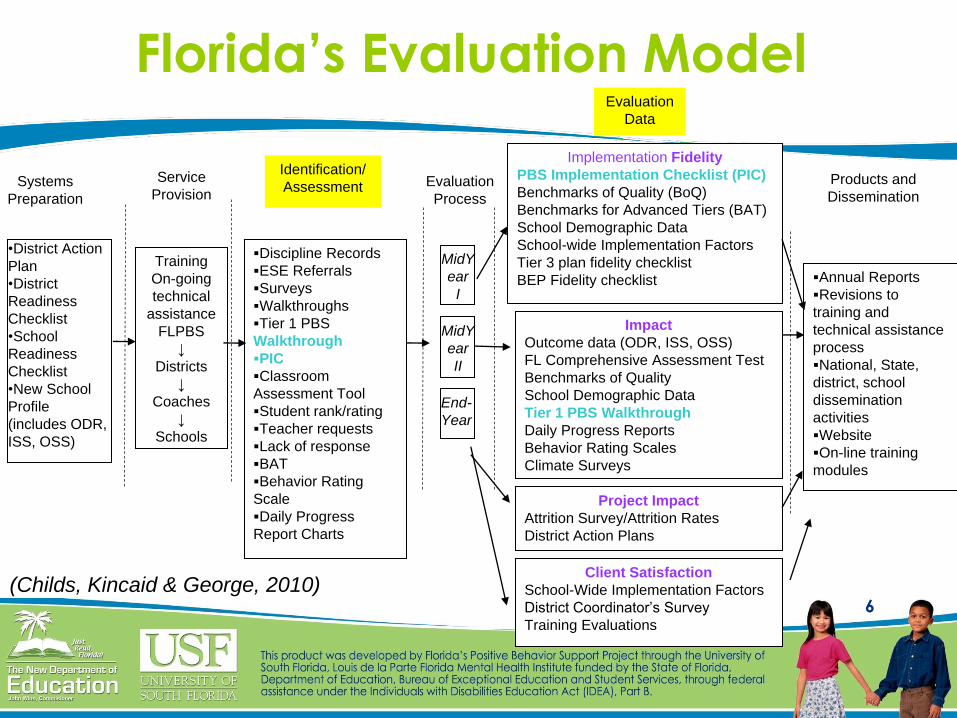
Florida’s Evaluation Model
Training
On-going
technical
assistance
FLPBS
↓
Districts
↓
Coaches
↓
Schools
End-
Year
Impact
Outcome data (ODR, ISS, OSS)
FL Comprehensive Assessment Test
Benchmarks of Quality
School Demographic Data
Tier 1 PBS Walkthrough
Daily Progress Reports
Behavior Rating Scales
Climate Surveys
Implementation Fidelity
PBS Implementation Checklist (PIC)
Benchmarks of Quality (BoQ)
Benchmarks for Advanced Tiers (BAT)
School Demographic Data
School-wide Implementation Factors
Tier 3 plan fidelity checklist
BEP Fidelity checklist
Project Impact
Attrition Survey/Attrition Rates
District Action Plans
Client Satisfaction
School-Wide Implementation Factors
District Coordinator’s Survey
Training Evaluations
Annual Reports
Revisions to
training and
technical assistance
process
National, State,
district, school
dissemination
activities
Website
On-line training
modules
Systems
Preparation
Service
ProvisionEvaluation
Process
Evaluation
Data
Products and
Dissemination
MidY
ear
I
MidY
ear
II
Identification/
Assessment
Discipline Records
ESE Referrals
Surveys
Walkthroughs
Tier 1 PBS
Walkthrough
PIC
Classroom
Assessment Tool
Student rank/rating
Teacher requests
Lack of response
BAT
Behavior Rating
Scale
Daily Progress
Report Charts
•District Action
Plan
•District
Readiness
Checklist
•School
Readiness
Checklist
•New School
Profile
(includes ODR,
ISS, OSS)
(Childs, Kincaid & George, 2010)
7
Comprehensive
Evaluation Blueprint:Implementation
Monitoring
Implementation
Integrity
Implementation
Research
•TIC (1)
Team Implementation Checklist
Sugai, Horner & Lewis-Palmer (2001)
• PIC (1,2,3)
PBS Implementation Checklist for Schools
Childs, Kincaid & George (2009)
• Walkthrough (1)
Tier 1 PBS Walkthrough
White, George, Childs & Martinez (2009)
•BoQ (1)
Benchmarks of Quality
Kincaid, Childs & George
(2005)
•BAT (2,3)
Benchmarks for Advanced
Tiers
Anderson, Childs, Kincaid,
Horner, George, Todd,
Sampson & Spaulding
(2009)
•SET (1)
School-wide Evaluation
Tool
Sugai, Lewis-Palmer,
Todd & Horner (2001)
•ISSET (2,3)
Individual Student
Systems Evaluation Tool
Anderson, Lewis-Palmer,
Todd, Horner, Sugai &
Sampson (2008)
8
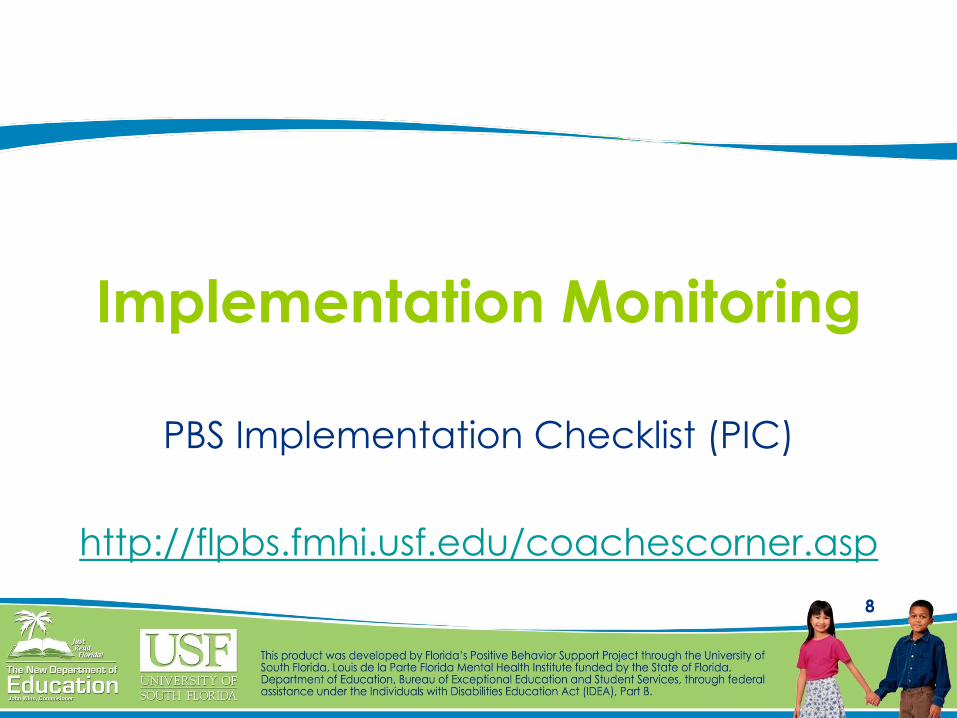
Implementation Monitoring
PBS Implementation Checklist (PIC)
http://flpbs.fmhi.usf.edu/coachescorner.asp

9
Progress Monitoring Measures
• designed to assess the same core features as the
research and annual self-assessment measures
• used by school teams (typically with the support of
their coach) on a frequent basis (e.g. monthly, every
two months, or quarterly) to guide action planning
during the implementation process
• requires 15-20 minutes to complete online and are
used by the team, coach and trainer to tailor actions,
supports, and training content associated with
assisting the school to implement with high fidelity
(PBIS Blueprint, 2010)
10
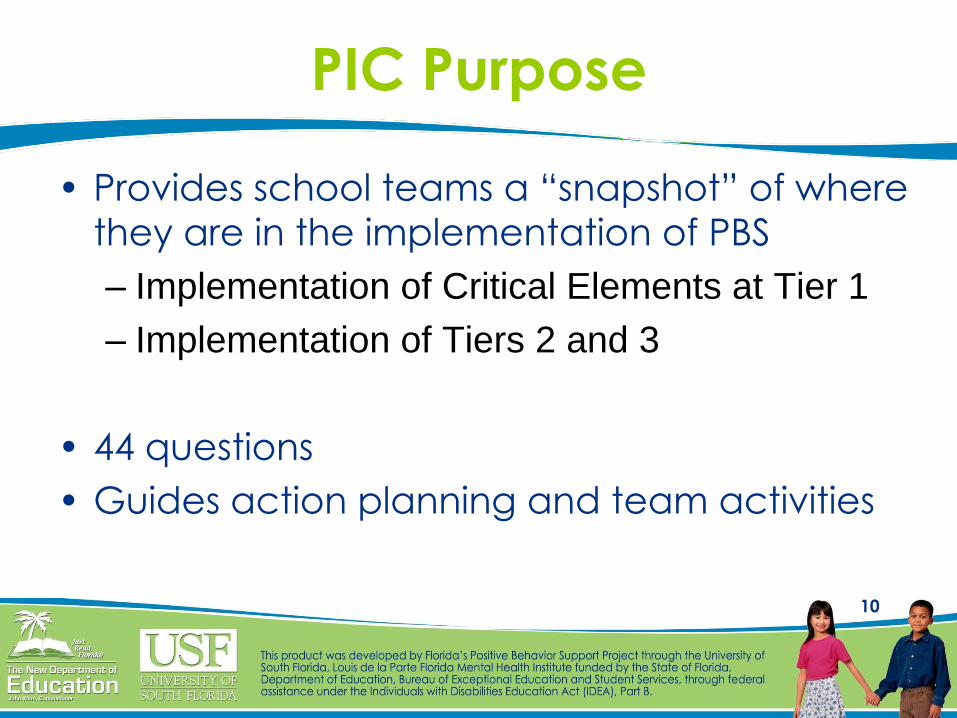
PIC Purpose
• Provides school teams a “snapshot” of where
they are in the implementation of PBS
– Implementation of Critical Elements at Tier 1
– Implementation of Tiers 2 and 3
• 44 questions
• Guides action planning and team activities

11
PIC Development Process
• Derived from the highest point areas indicated
by the Factor Analysis of the BoQ
• Expert Review
• Florida Pilot
– Elementary, Middle, High, Center/Alt
• Coach scoring
• Scale: 0=“No”, 1=“Somewhat” and 2=“Yes”
• Online administration
• No total score but graphic displays

12
Factors of the PIC:
Implementation Level
• Preparation 0-8 score
• Initiation 0-18 score
• Implementation 0-18 score
• Maintenance 0-10 score
• Extension into Tier 2 0-14 score
• Extension into Tier 3 0-20 score
13
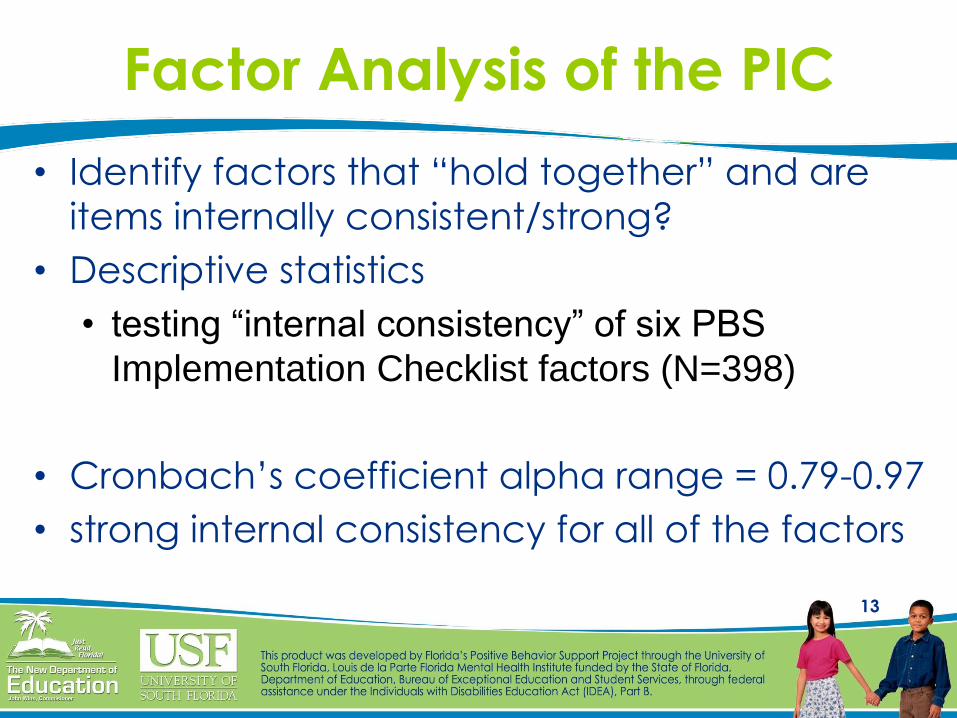
Factor Analysis of the PIC
• Identify factors that “hold together” and are
items internally consistent/strong?
• Descriptive statistics
• testing “internal consistency” of six PBS
Implementation Checklist factors (N=398)
• Cronbach’s coefficient alpha range = 0.79-0.97
• strong internal consistency for all of the factors
14
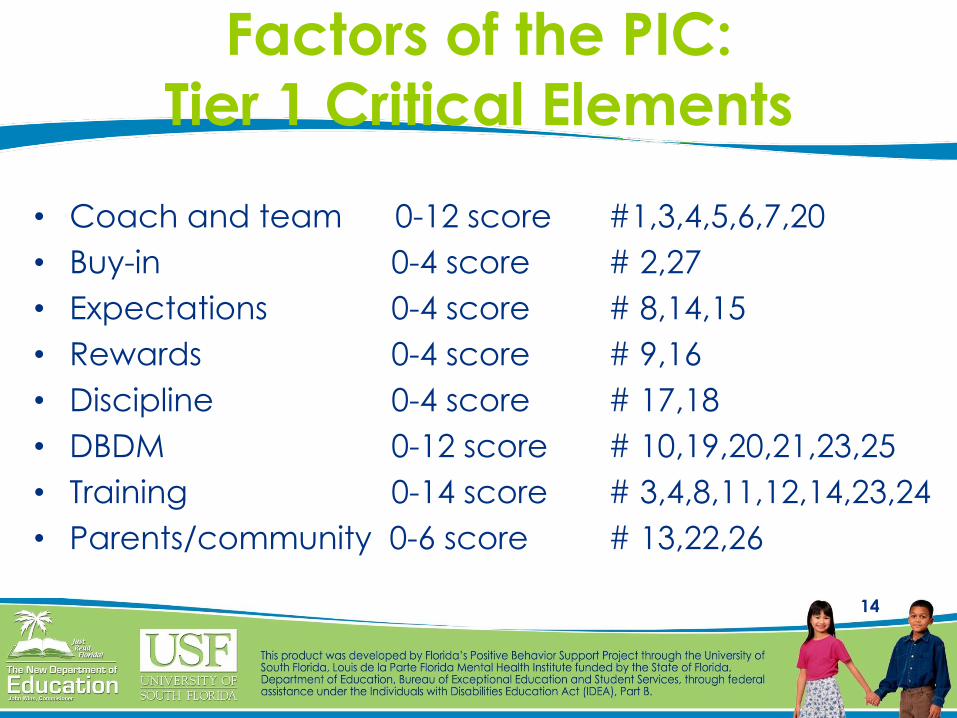
Factors of the PIC:
Tier 1 Critical Elements
• Coach and team 0-12 score #1,3,4,5,6,7,20
• Buy-in 0-4 score # 2,27
• Expectations 0-4 score # 8,14,15
• Rewards 0-4 score # 9,16
• Discipline 0-4 score # 17,18
• DBDM 0-12 score # 10,19,20,21,23,25
• Training 0-14 score # 3,4,8,11,12,14,23,24
• Parents/community 0-6 score # 13,22,26
15
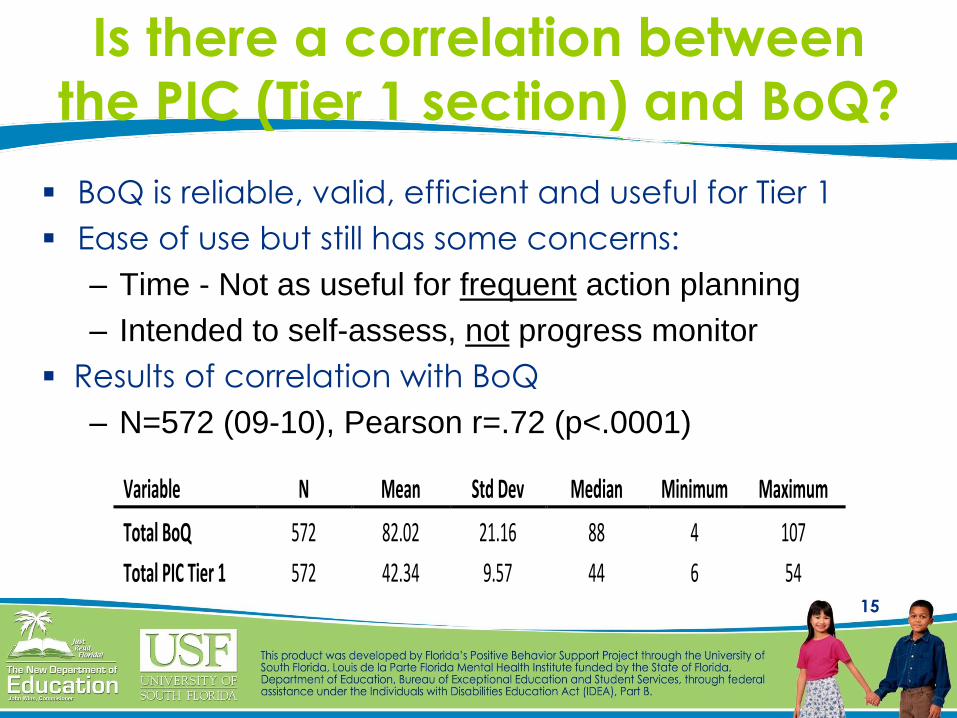
Is there a correlation between
the PIC (Tier 1 section) and BoQ?
BoQ is reliable, valid, efficient and useful for Tier 1
Ease of use but still has some concerns:
– Time - Not as useful for frequent action planning
– Intended to self-assess, not progress monitor
Results of correlation with BoQ
– N=572 (09-10), Pearson r=.72 (p<.0001)
Variable N Mean Std Dev Median Minimum Maximum
Total BoQ 572 82.02 21.16 88 4 107
Total PIC Tier 1 572 42.34 9.57 44 6 54
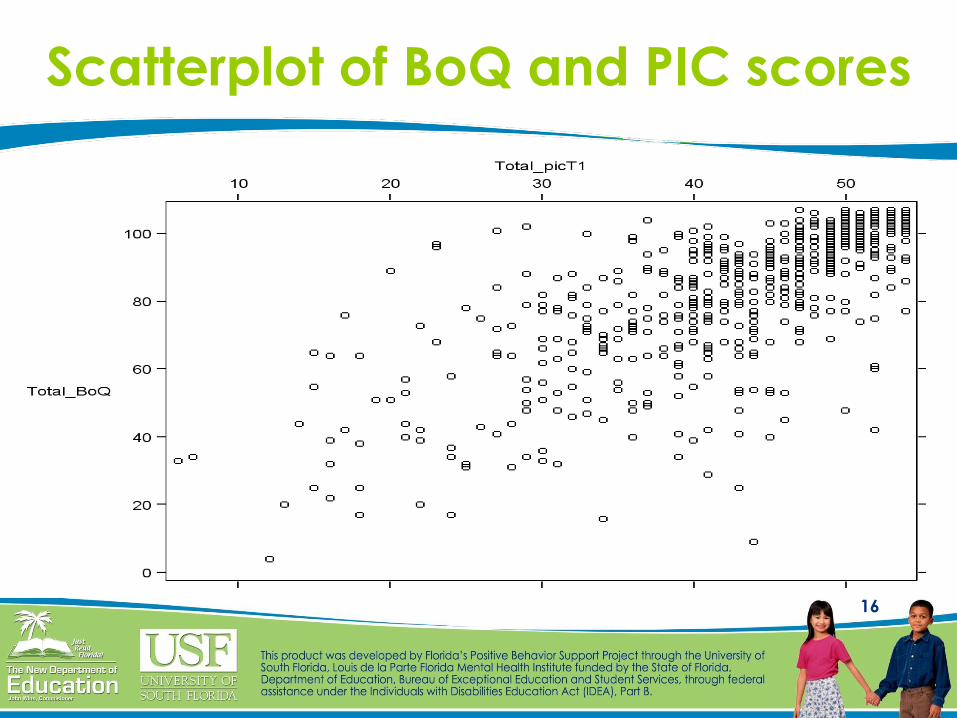
16
Scatterplot of BoQ and PIC scores
Is there a correlation between the
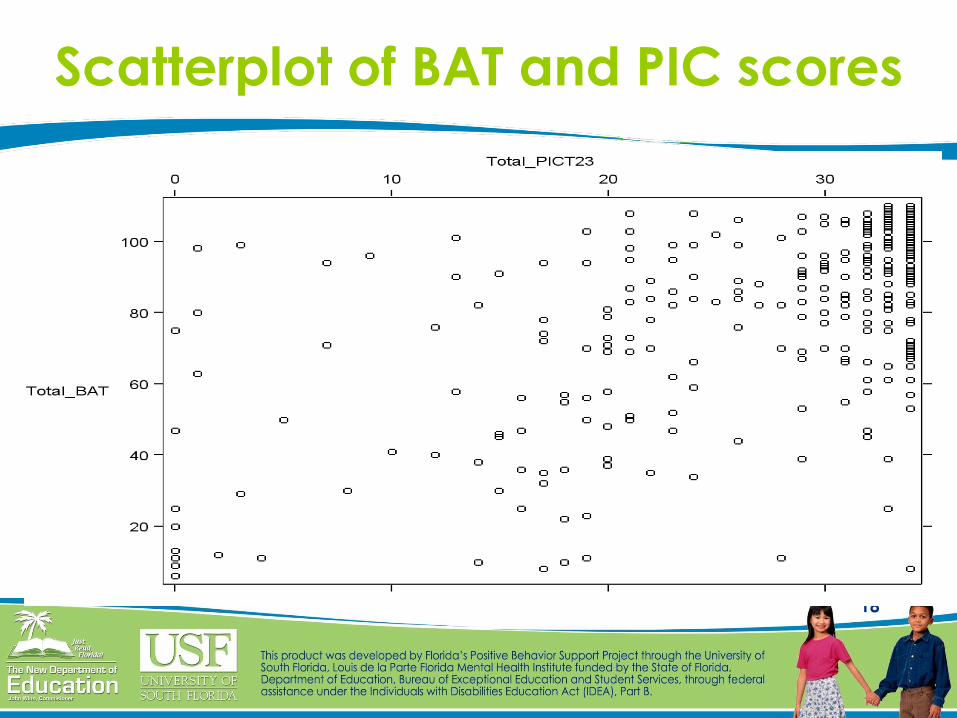
PIC (Tiers 2-3 section) and BAT?
BAT has strong internal consistency (factor analysis),
stability in administration (test/retest), theoretical
confidence (expert panel) for Tiers 2-3
Concerns:
– Time - Not as useful for frequent action planning
– Intended to self-assess, not progress monitor
– concurrent validity has yet to be demonstrated
statistically
Results of correlation with BAT
– N=296 (09-10), Pearson r=.57 (p<.0001)
Variable N Mean Std Dev Median Minimum Maximum
Total BAT 296 80.06 26.73 88 6 110
Total PIC Tier 23 296 26.84 9.04 31 0 34
18
Scatterplot of BAT and PIC scores
19
Use of the PIC
• Who completes the PBS Implementation
Checklist?
• The Coach
• Must be familiar with the school team
– Or completed as team activity with consensus
achieved on each item
• When is the PIC completed?
• Completed 3 and 6 months into the school year
• November 1st and March 1st annually
• Web-based data entry
20
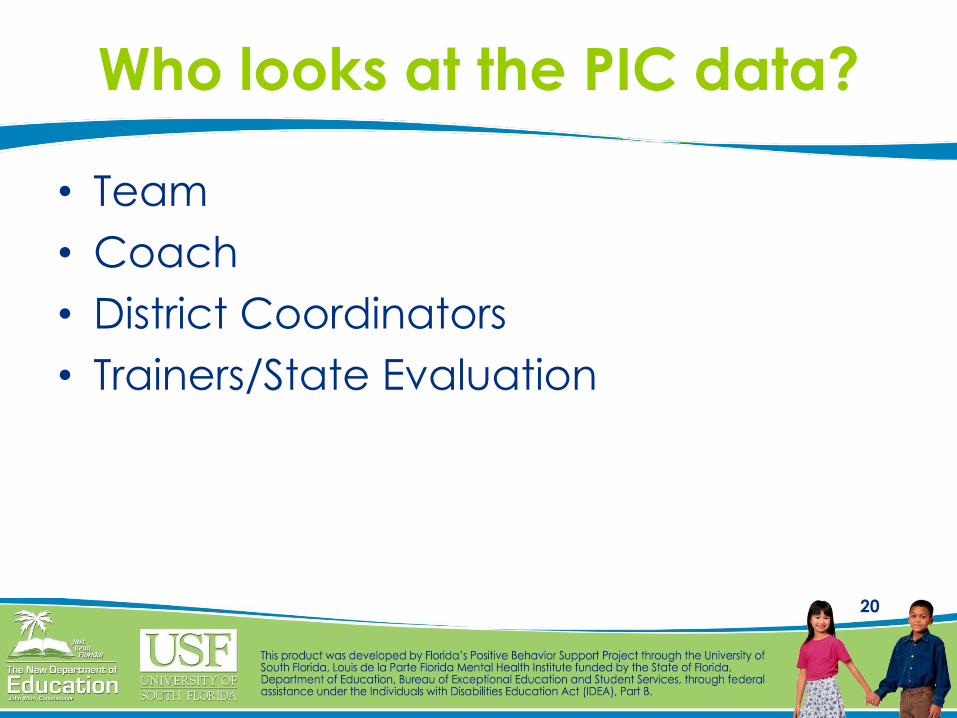
Who looks at the PIC data?
• Team
• Coach
• District Coordinators
• Trainers/State Evaluation
21
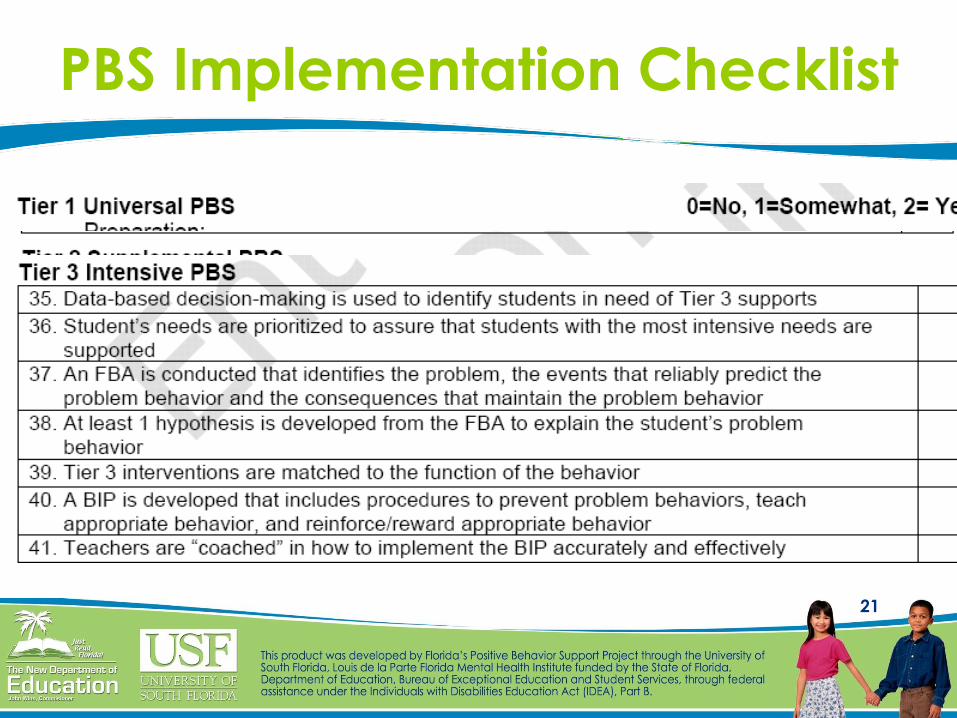
PBS Implementation Checklist
22
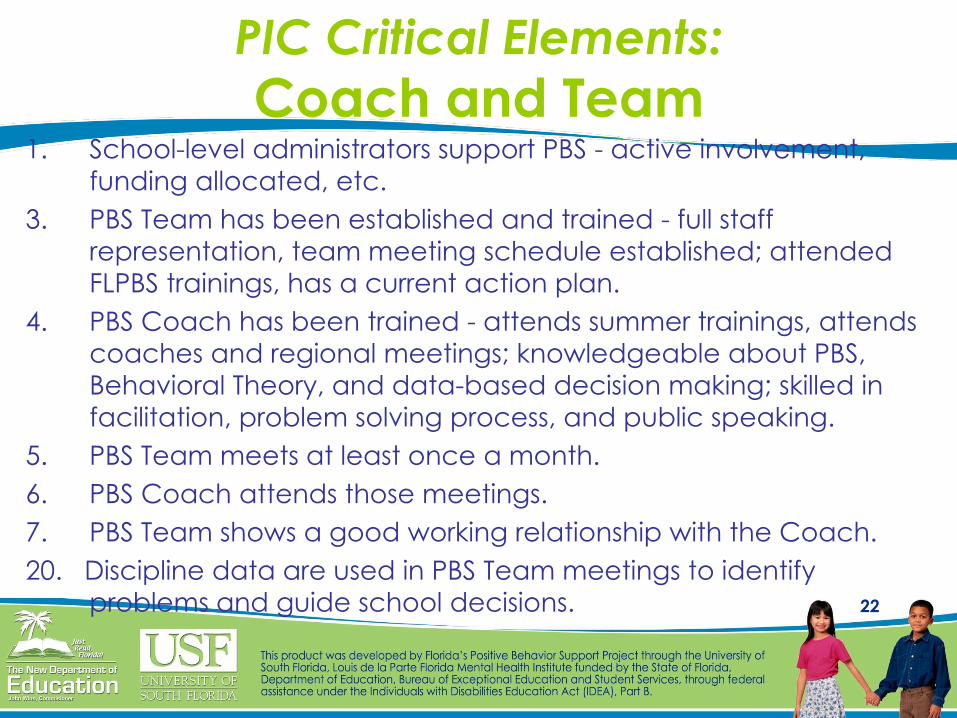
PIC Critical Elements:
Coach and Team1. School-level administrators support PBS - active involvement,
funding allocated, etc.
3. PBS Team has been established and trained - full staff
representation, team meeting schedule established; attended
FLPBS trainings, has a current action plan.
4. PBS Coach has been trained - attends summer trainings, attends
coaches and regional meetings; knowledgeable about PBS,
Behavioral Theory, and data-based decision making; skilled in
facilitation, problem solving process, and public speaking.
5. PBS Team meets at least once a month.
6. PBS Coach attends those meetings.
7. PBS Team shows a good working relationship with the Coach.
20. Discipline data are used in PBS Team meetings to identify
problems and guide school decisions.
23
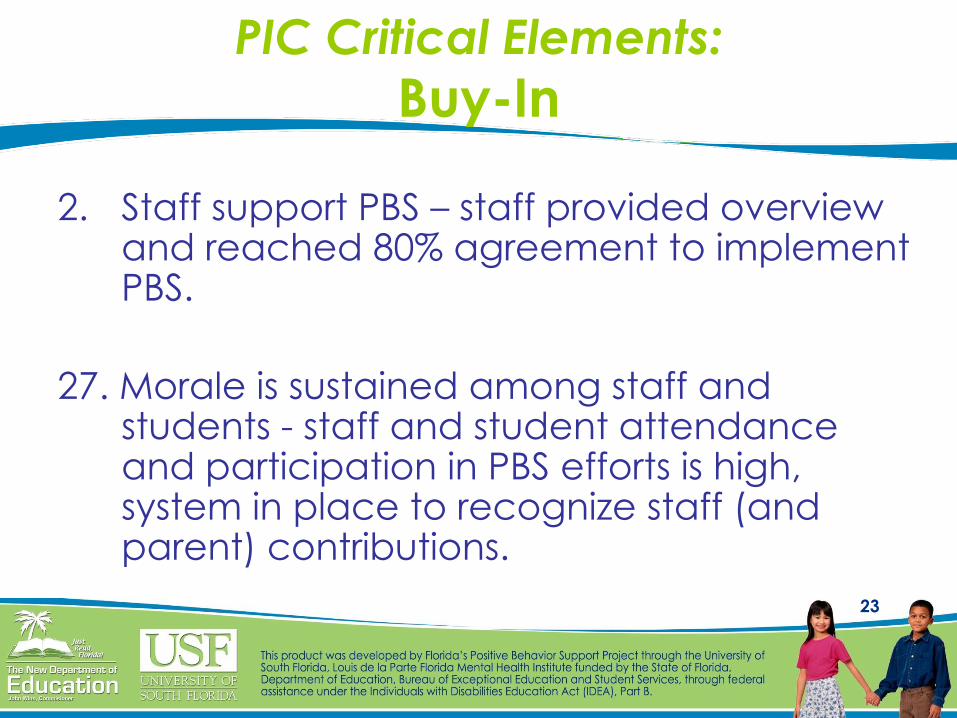
PIC Critical Elements:
Buy-In
2. Staff support PBS – staff provided overview and reached 80% agreement to implement PBS.
27. Morale is sustained among staff and students - staff and student attendance and participation in PBS efforts is high, system in place to recognize staff (and parent) contributions.
24
PIC Critical Elements:
Expectations8. 3-5 expectations have been clearly defined and
teaching plans have been described to staff.
14. Behavior expectations and reward systems are taught formally and informally to students - occurs multiple times during the year to include transferring students, integrated into curriculums, common language used by staff and students across settings; dates for reward activities have been set and placed on school calendars.
15. Behavior expectations have been posted throughout the school - including hallways, cafeteria, playground, special rooms, restrooms, offices, and classrooms.
25
PIC Critical Elements:
Rewards
9. System for rewarding students has been
developed – written documentation
required for full score.
16. Positive behaviors are rewarded
consistently across staff and settings.
26
PIC Critical Elements:
Discipline
17. Procedures for handling inappropriate
behaviors are implemented consistently
across staff and settings.
18. Office discipline forms are completed
consistently and accurately across staff.
27
PIC Critical Elements:
Data-based Decision-Making
10. Strategy for collecting and using discipline data has
been established.
19. Discipline data are gathered and entered into the database consistently and in a timely manner.
21. Discipline data are summarized and reported to staff on a regular basis.
23. Data and staff feedback are used to make decisions regarding additional training and professional staff development.
25. Data and staff feedback are used to revise and update the PBS action plan for the school and district -reviewed and revised as needed.
28
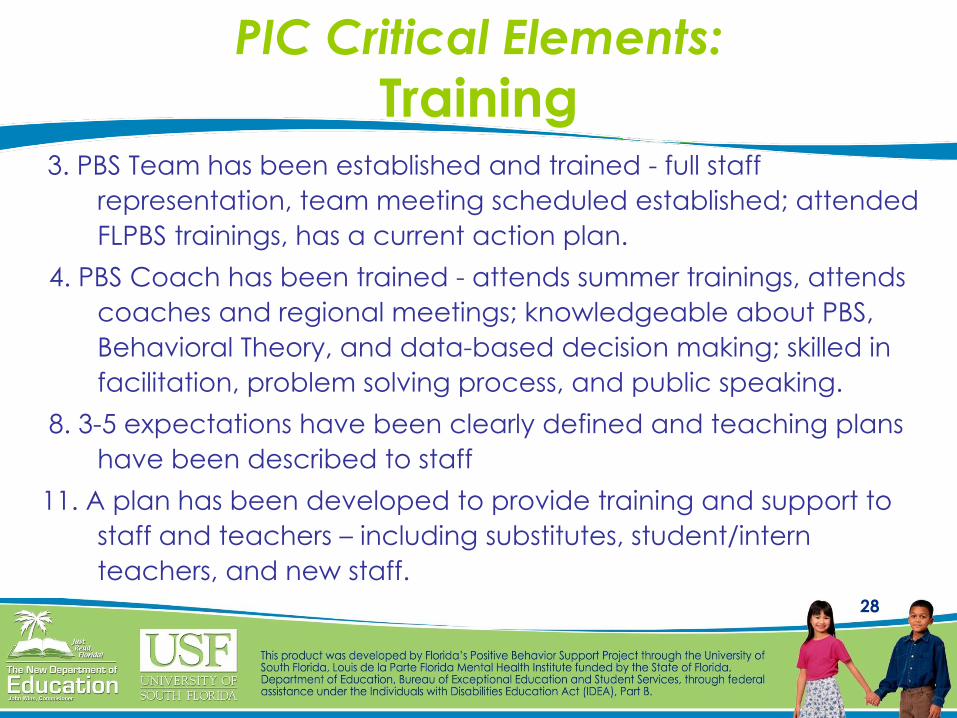
PIC Critical Elements:
Training3. PBS Team has been established and trained - full staff
representation, team meeting scheduled established; attended
FLPBS trainings, has a current action plan.
4. PBS Coach has been trained - attends summer trainings, attends
coaches and regional meetings; knowledgeable about PBS,
Behavioral Theory, and data-based decision making; skilled in
facilitation, problem solving process, and public speaking.
8. 3-5 expectations have been clearly defined and teaching plans
have been described to staff
11. A plan has been developed to provide training and support to
staff and teachers – including substitutes, student/intern
teachers, and new staff.
29
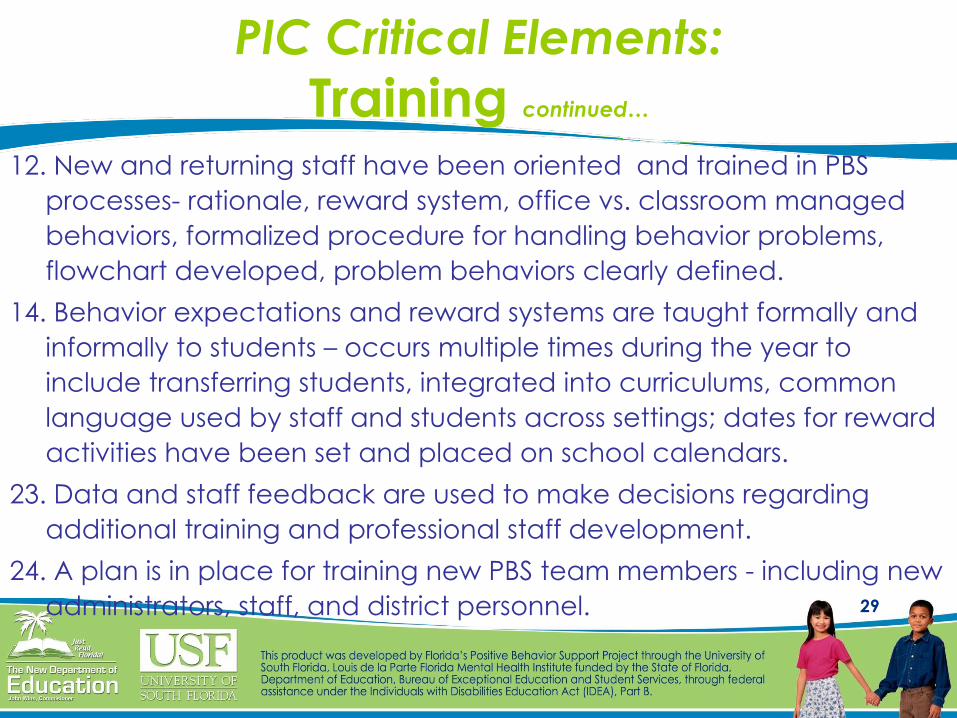
PIC Critical Elements:
Training continued…12. New and returning staff have been oriented and trained in PBS
processes- rationale, reward system, office vs. classroom managed
behaviors, formalized procedure for handling behavior problems,
flowchart developed, problem behaviors clearly defined.
14. Behavior expectations and reward systems are taught formally and
informally to students – occurs multiple times during the year to
include transferring students, integrated into curriculums, common
language used by staff and students across settings; dates for reward
activities have been set and placed on school calendars.
23. Data and staff feedback are used to make decisions regarding
additional training and professional staff development.
24. A plan is in place for training new PBS team members - including new
administrators, staff, and district personnel.
30
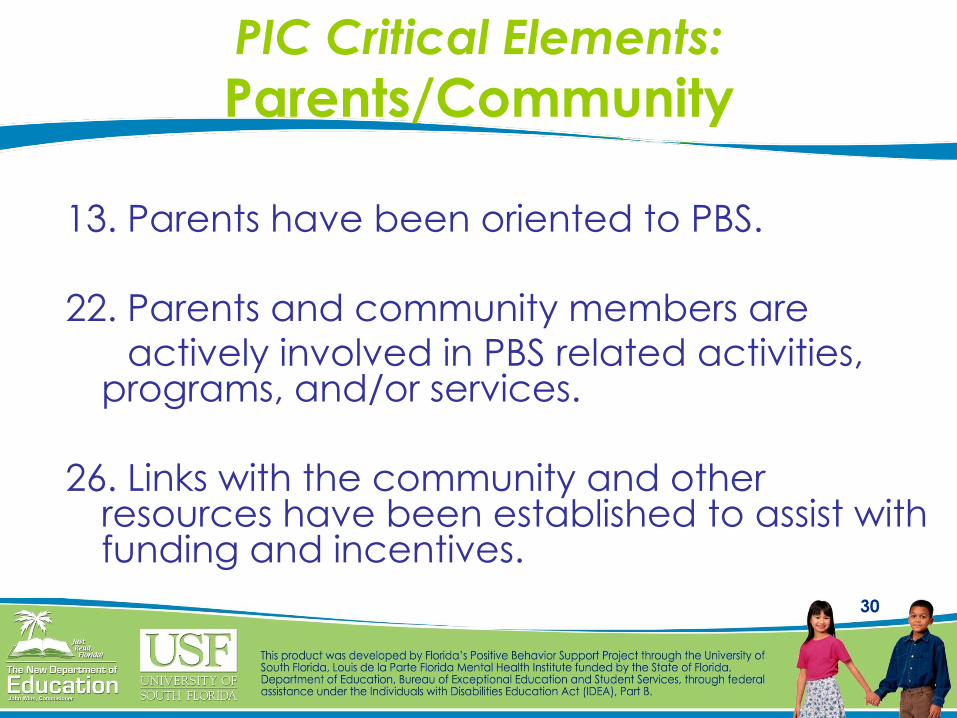
PIC Critical Elements:
Parents/Community
13. Parents have been oriented to PBS.
22. Parents and community members are
actively involved in PBS related activities, programs, and/or services.
26. Links with the community and other resources have been established to assist with funding and incentives.

31
Using PIC Results
• Use the PIC to guide your PBS team towards
implementation with fidelity at all three tiers
• Improvements since last BoQ?
• Are we doing what we said we would do? – RtI:Behavior implementation
– Implemented with fidelity
• Is it working?– sustainability of implementation
– benefits for students, staff, community over time
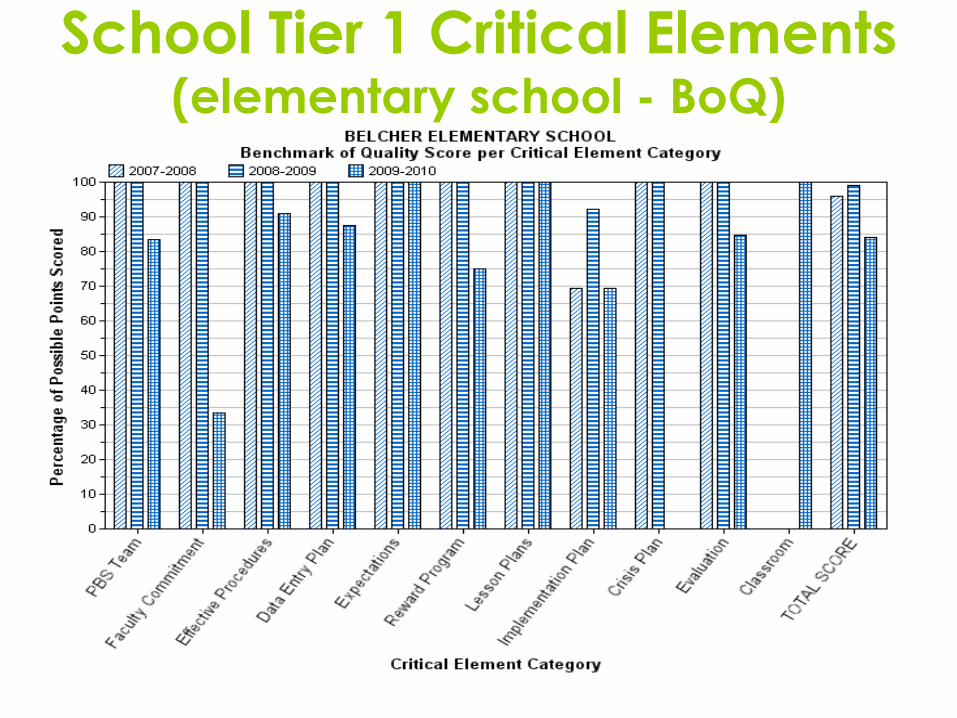
School Tier 1 Critical Elements(elementary school - BoQ)
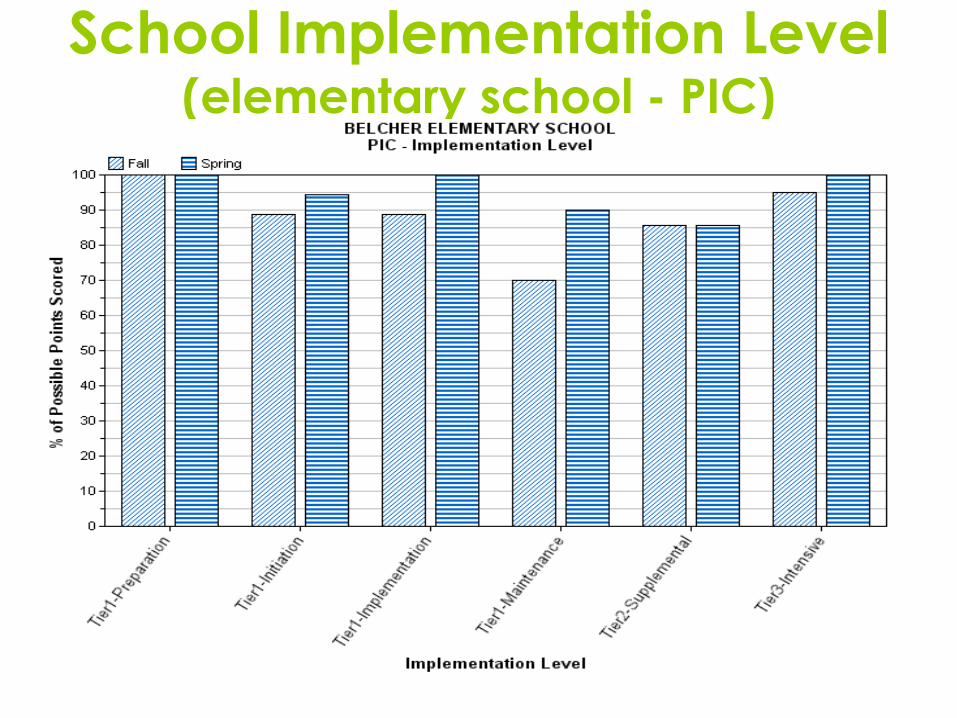
School Implementation Level(elementary school - PIC)
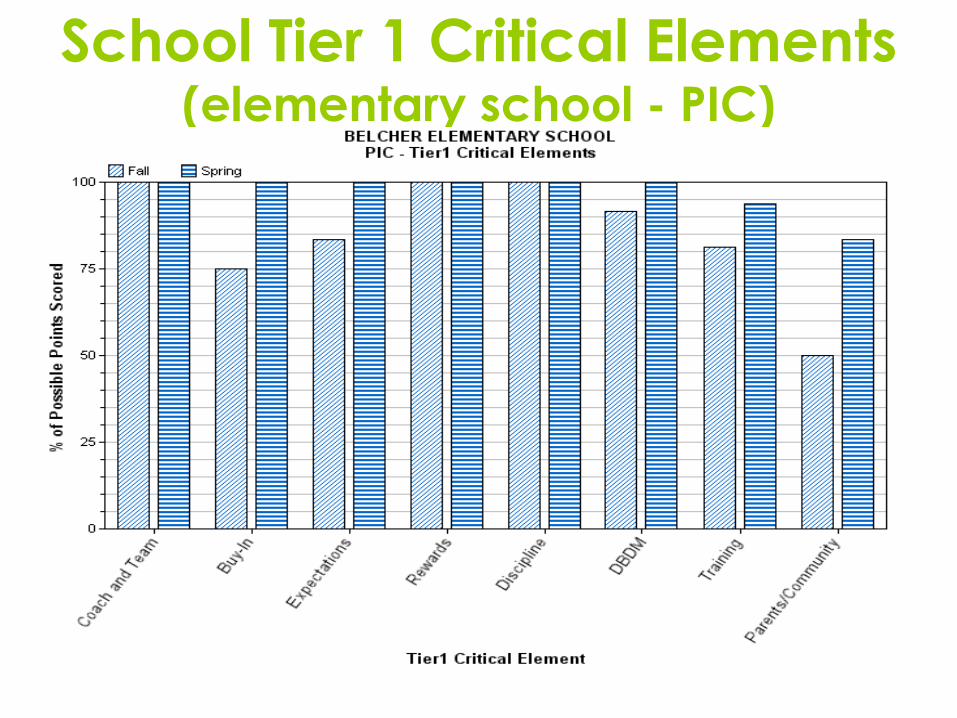
School Tier 1 Critical Elements(elementary school - PIC)

35
District Implementation Level (all schools - BoQ)
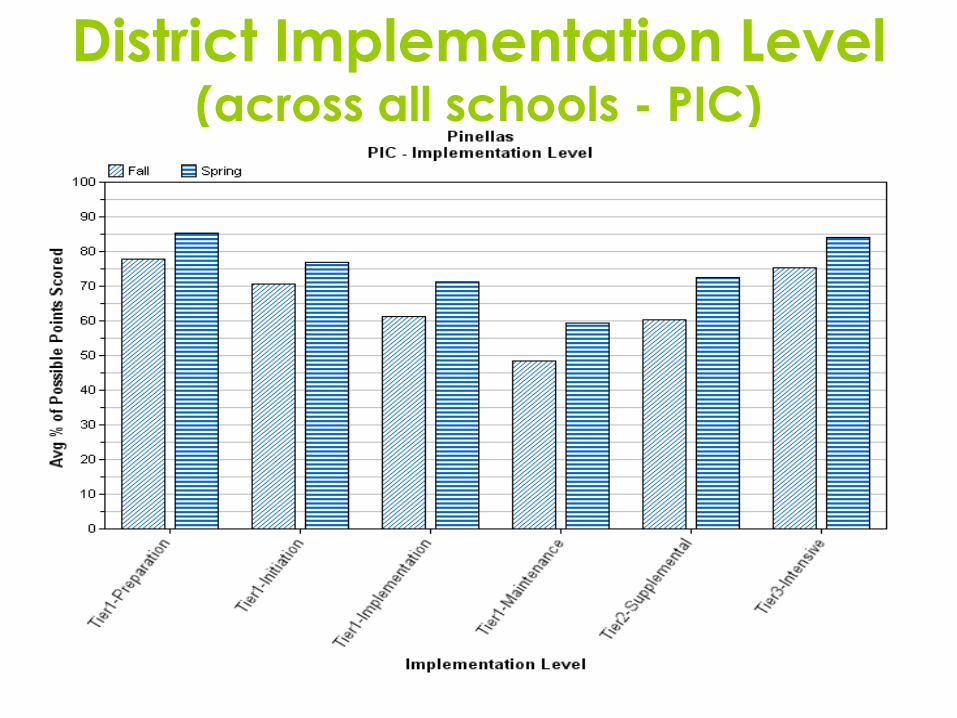
District Implementation Level (across all schools - PIC)
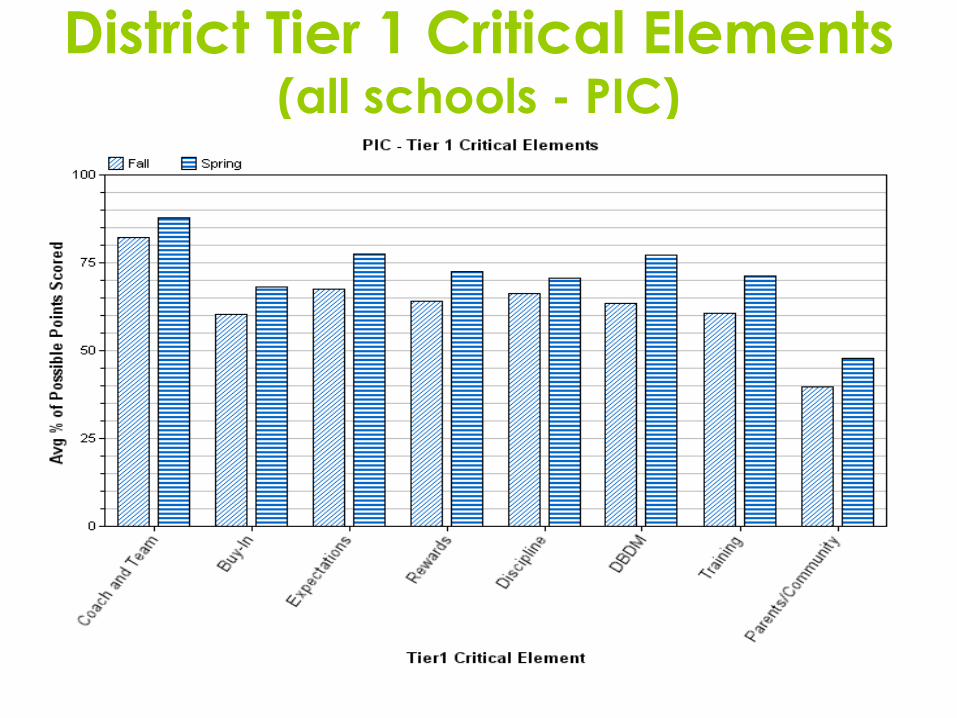
District Tier 1 Critical Elements(all schools - PIC)
38
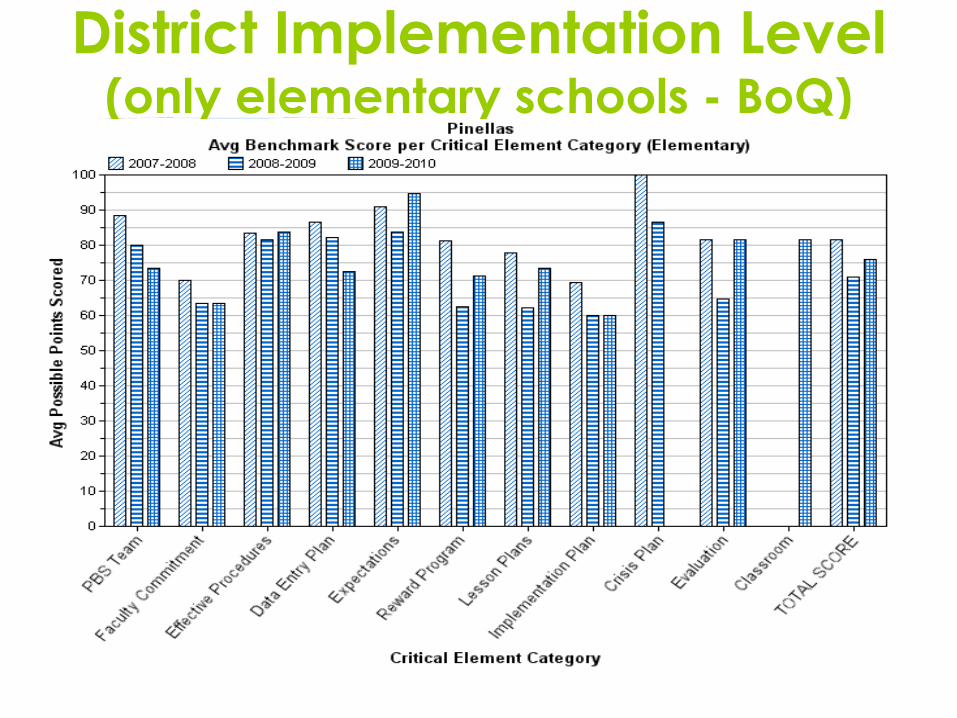
District Implementation Level (only elementary schools - BoQ)
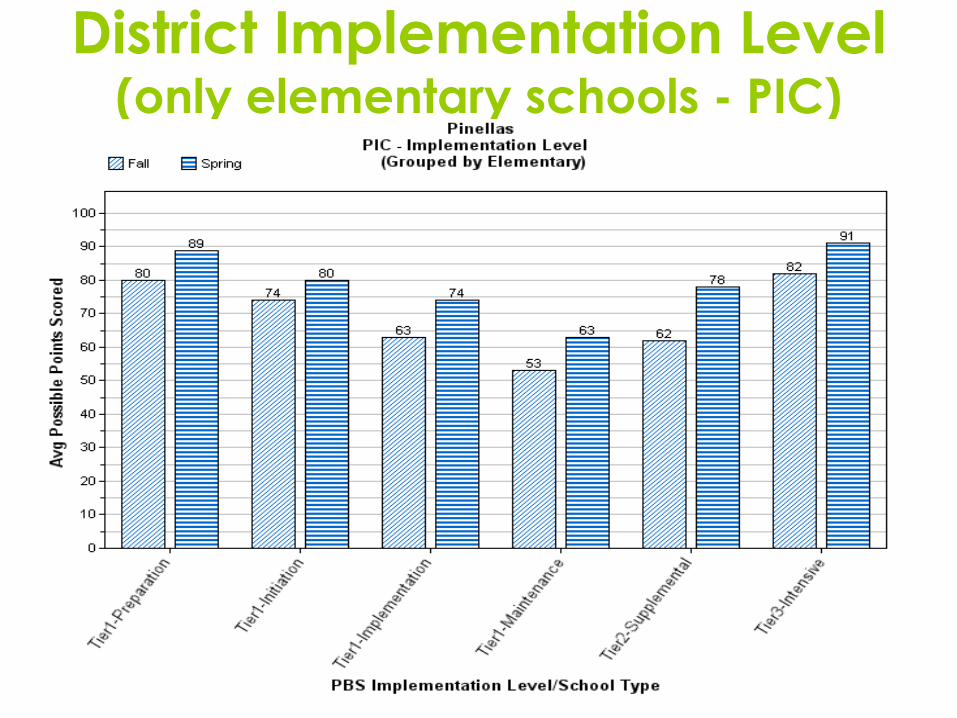
District Implementation Level (only elementary schools - PIC)
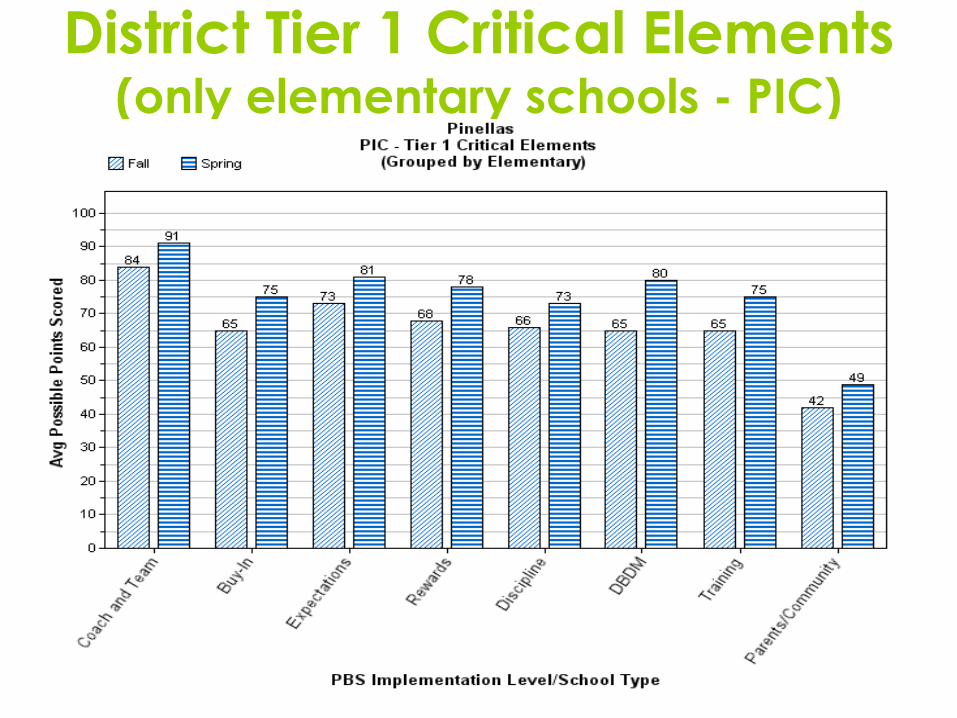
District Tier 1 Critical Elements (only elementary schools - PIC)
41
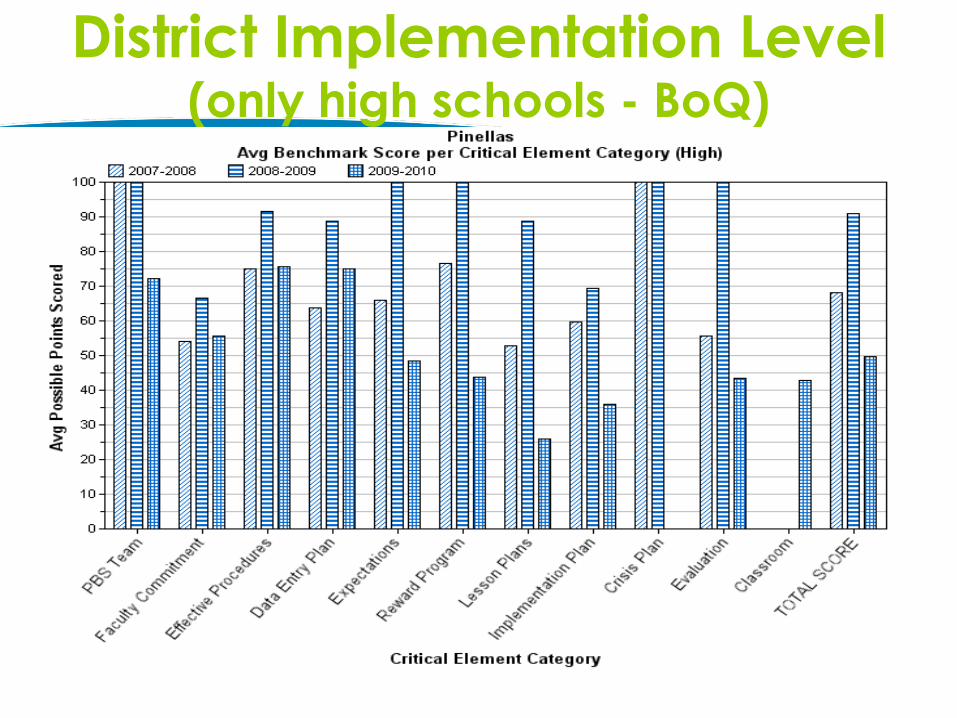
District Implementation Level (only high schools - BoQ)
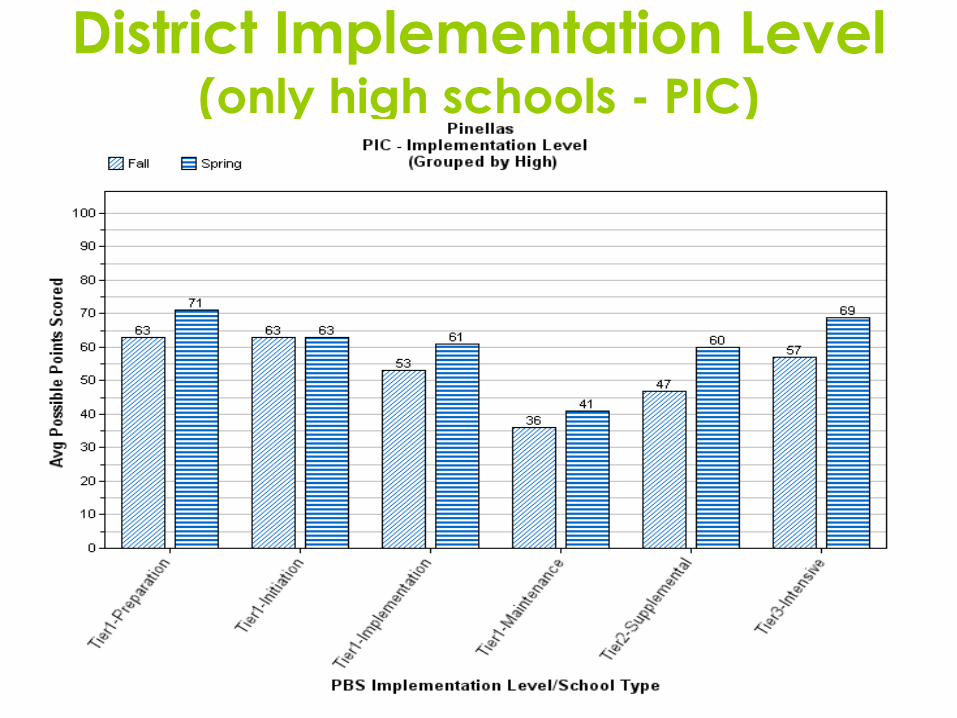
District Implementation Level (only high schools - PIC)
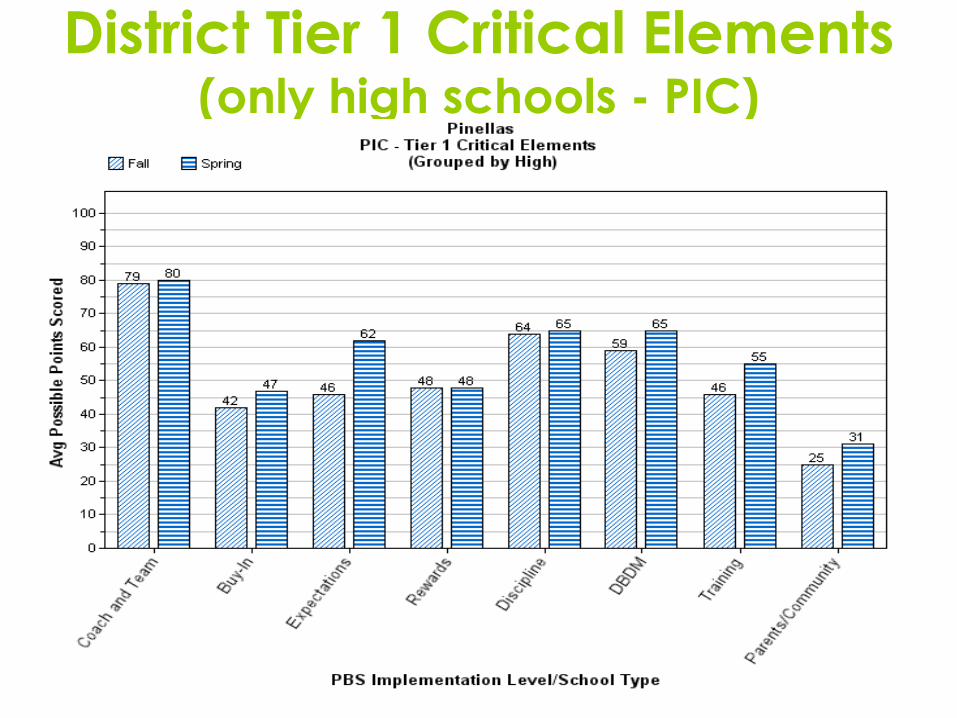
District Tier 1 Critical Elements (only high schools - PIC)
44
Action Planning with the PIC
• Define items marked “No” or “Somewhat” in
place
• Identify the items that will make the biggest
impact
• Define a task analysis of activities to achieve
items
• Allocate tasks to people, time, reporting event
45
Using the PIC Results
Action plan to increase fidelity of implementation
School
District
State/project
Outcome reporting
Identification of Model school candidates
Indication of who should apply
46
What if I Question the Results?
• District Level verification
• 2nd completion by internal/external coach
• On-site Walk-through

47
Implementation Monitoring
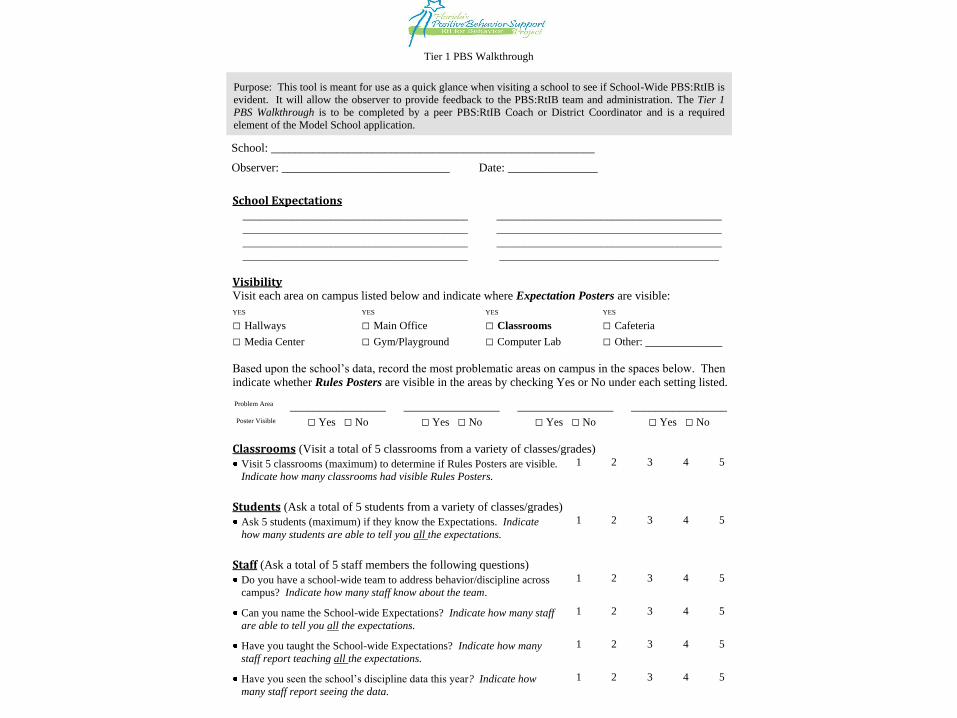
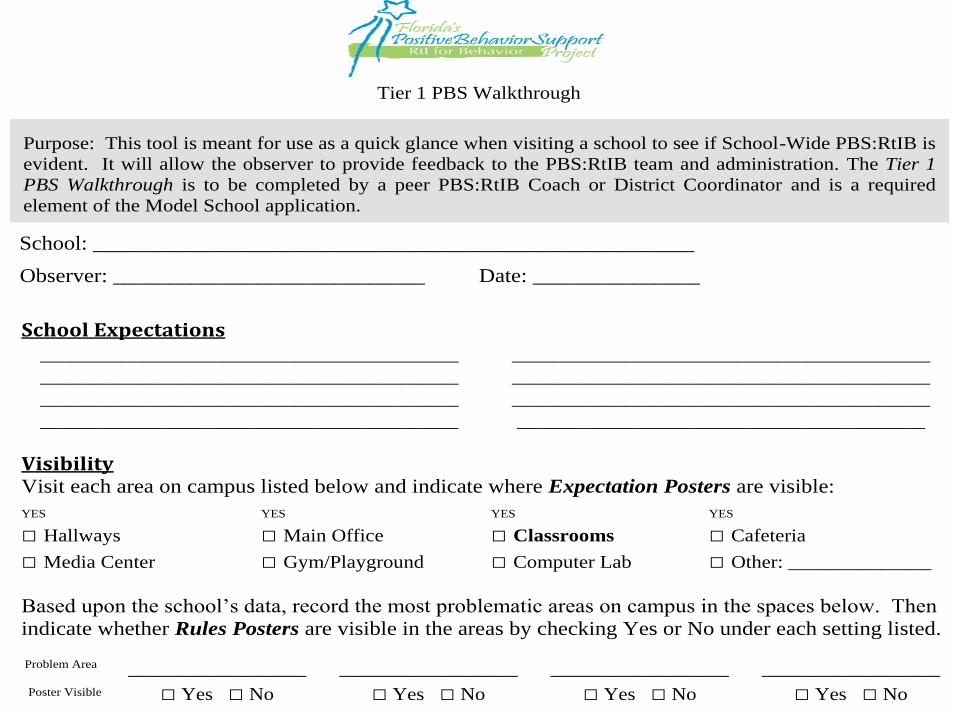
Tier 1 PBS Walkthrough
http://flpbs.fmhi.usf.edu/modelschools.asp

48
On-site Tier 1 PBS Walkthrough
• Tool is used as a quick glance during school site visit to determine SWPBS evidence
• Adapted from the SET (“mini-SET”)
• Created as a reliability measure against BOQ score and outcome data submitted
• Allows the observer to provide feedback to the PBS Team and administration
• Completed by a peer PBS Coach or District Coordinator
• Someone who has not been working directly with the team – outside observer
• Part of the PBS Model School application process
49
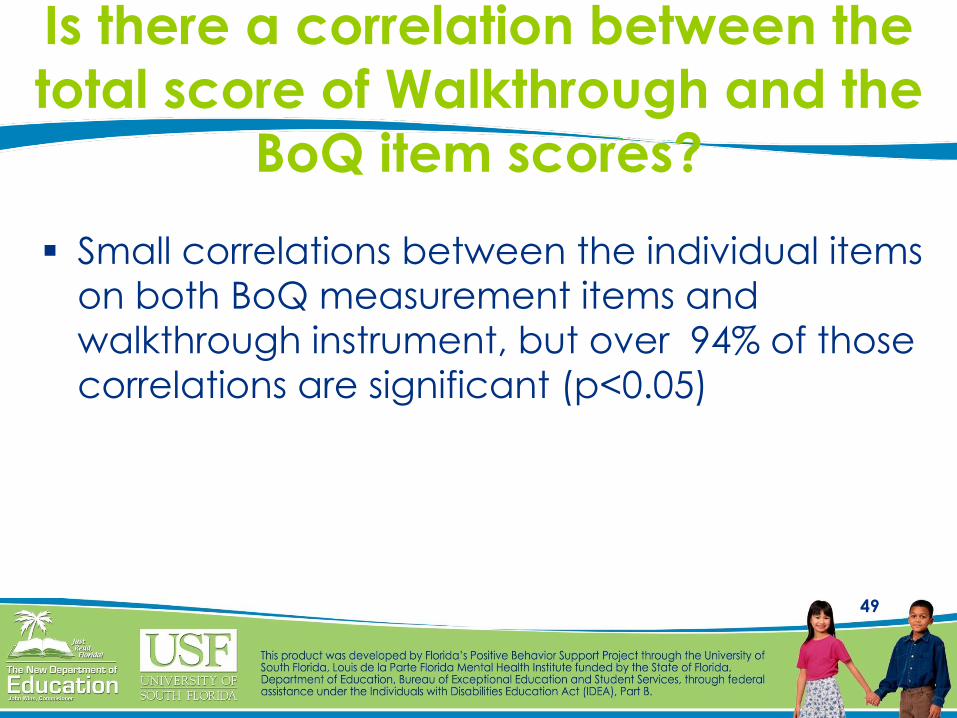
Is there a correlation between the
total score of Walkthrough and the
BoQ item scores?
Small correlations between the individual items
on both BoQ measurement items and
walkthrough instrument, but over 94% of those
correlations are significant (p<0.05)
50
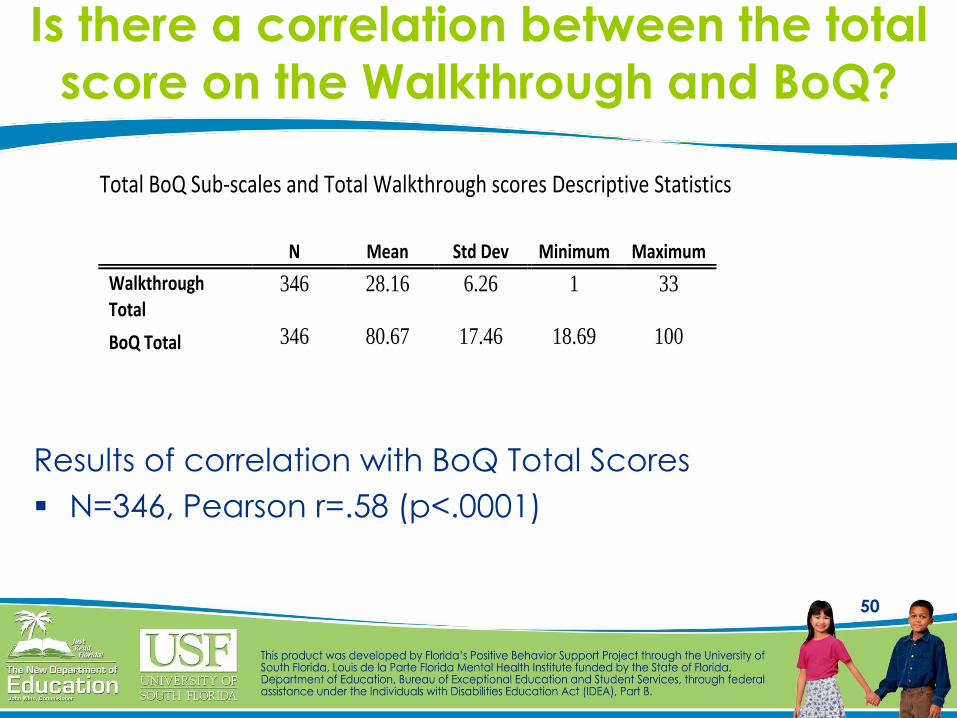
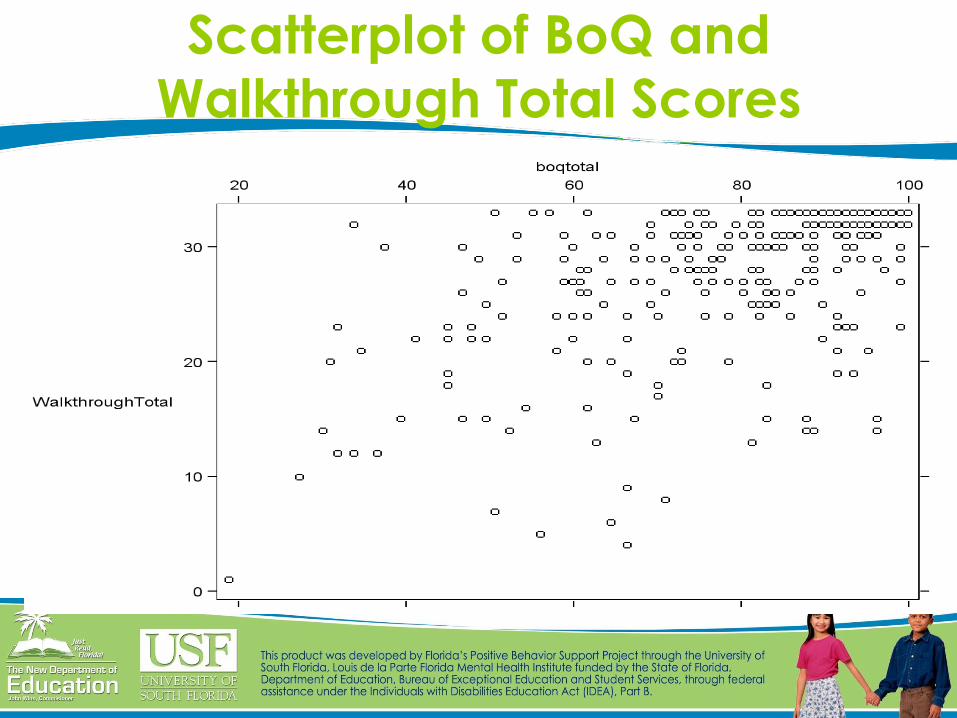
Is there a correlation between the total
score on the Walkthrough and BoQ?
Results of correlation with BoQ Total Scores
N=346, Pearson r=.58 (p<.0001)
Total BoQ Sub-scales and Total Walkthrough scores Descriptive Statistics
N Mean Std Dev Minimum Maximum
Walkthrough Total
346 28.16 6.26 1 33
BoQ Total 346 80.67 17.46 18.69 100
51
Scatterplot of BoQ and
Walkthrough Total Scores
Tier 1 PBS Walkthrough
School: ______________________________________________________
Observer: ____________________________ Date: _______________
School Expectations
_________________________________________ _________________________________________ _________________________________________ _________________________________________ _________________________________________ _________________________________________ _________________________________________ ________________________________________
Visibility
Visit each area on campus listed below and indicate where Expectation Posters are visible:
YES YES YES YES
□ Hallways □ Main Office □ Classrooms □ Cafeteria
□ Media Center □ Gym/Playground □ Computer Lab □ Other: ______________
Based upon the school’s data, record the most problematic areas on campus in the spaces below. Then
indicate whether Rules Posters are visible in the areas by checking Yes or No under each setting listed.
Problem Area ________________ ________________ ________________ ________________ Poster Visible □ Yes □ No □ Yes □ No □ Yes □ No □ Yes □ No
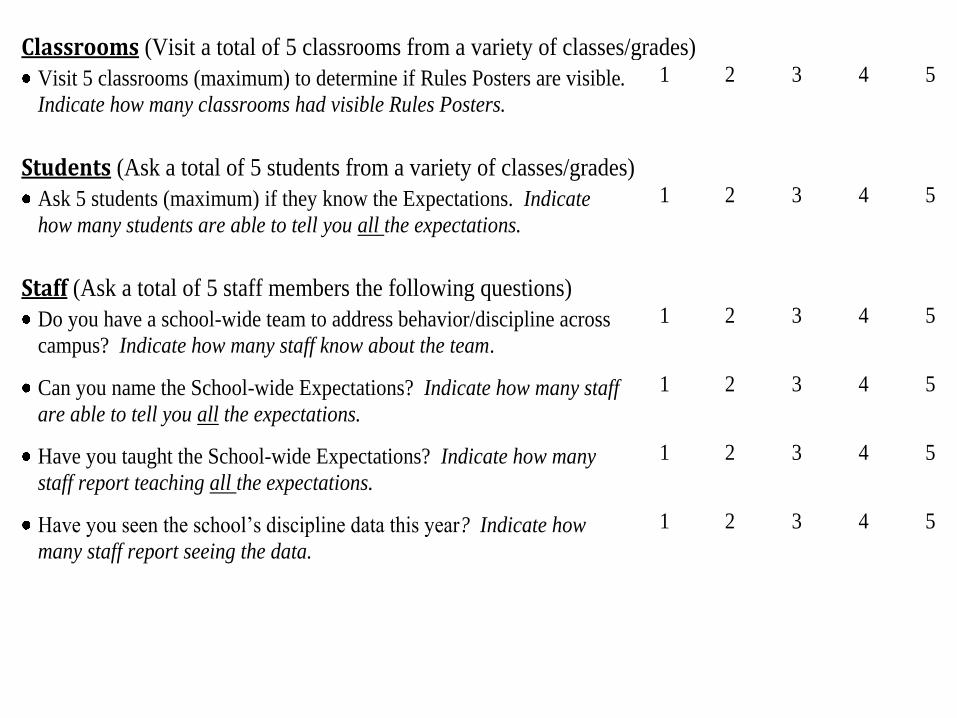
Classrooms (Visit a total of 5 classrooms from a variety of classes/grades)
Visit 5 classrooms (maximum) to determine if Rules Posters are visible.
Indicate how many classrooms had visible Rules Posters.
1 2 3 4 5
Students (Ask a total of 5 students from a variety of classes/grades)
Ask 5 students (maximum) if they know the Expectations. Indicate
how many students are able to tell you all the expectations.
1 2 3 4 5
Staff (Ask a total of 5 staff members the following questions)
Do you have a school-wide team to address behavior/discipline across
campus? Indicate how many staff know about the team.
1 2 3 4 5
Can you name the School-wide Expectations? Indicate how many staff
are able to tell you all the expectations.
1 2 3 4 5
Have you taught the School-wide Expectations? Indicate how many
staff report teaching all the expectations.
1 2 3 4 5
Have you seen the school’s discipline data this year? Indicate how
many staff report seeing the data.
1 2 3 4 5
Purpose: This tool is meant for use as a quick glance when visiting a school to see if School-Wide PBS:RtIB is
evident. It will allow the observer to provide feedback to the PBS:RtIB team and administration. The Tier 1
PBS Walkthrough is to be completed by a peer PBS:RtIB Coach or District Coordinator and is a required
element of the Model School application.
Tier 1 PBS Walkthrough
School: ______________________________________________________
Observer: ____________________________ Date: _______________
School Expectations
_________________________________________ _________________________________________ _________________________________________ _________________________________________ _________________________________________ _________________________________________ _________________________________________ ________________________________________
Visibility
Visit each area on campus listed below and indicate where Expectation Posters are visible:
YES YES YES YES
□ Hallways □ Main Office □ Classrooms □ Cafeteria
□ Media Center □ Gym/Playground □ Computer Lab □ Other: ______________
Based upon the school’s data, record the most problematic areas on campus in the spaces below. Then
indicate whether Rules Posters are visible in the areas by checking Yes or No under each setting listed.
Problem Area ________________ ________________ ________________ ________________ Poster Visible □ Yes □ No □ Yes □ No □ Yes □ No □ Yes □ No
Classrooms (Visit a total of 5 classrooms from a variety of classes/grades)
Visit 5 classrooms (maximum) to determine if Rules Posters are visible.
Indicate how many classrooms had visible Rules Posters.
1 2 3 4 5
Students (Ask a total of 5 students from a variety of classes/grades)
Ask 5 students (maximum) if they know the Expectations. Indicate
how many students are able to tell you all the expectations.
1 2 3 4 5
Staff (Ask a total of 5 staff members the following questions)
Do you have a school-wide team to address behavior/discipline across
campus? Indicate how many staff know about the team.
1 2 3 4 5
Can you name the School-wide Expectations? Indicate how many staff
are able to tell you all the expectations.
1 2 3 4 5
Have you taught the School-wide Expectations? Indicate how many
staff report teaching all the expectations.
1 2 3 4 5
Have you seen the school’s discipline data this year? Indicate how
many staff report seeing the data.
1 2 3 4 5
Purpose: This tool is meant for use as a quick glance when visiting a school to see if School-Wide PBS:RtIB is
evident. It will allow the observer to provide feedback to the PBS:RtIB team and administration. The Tier 1
PBS Walkthrough is to be completed by a peer PBS:RtIB Coach or District Coordinator and is a required
element of the Model School application.
55
Who looks at the
Tier 1 PBS Walkthrough data?
• Team
• Coach
• District Coordinators (possibly)
• Trainers/State Evaluation (only if
applying for Model School status)
• Anyone who makes a site visit can
conduct a Walkthrough
56
Implementation Monitoring Tools
• Will you progress monitor your school(s)?
– If so, how often? Which instrument(s)?
– Who is responsible to administer, collect and
synthesize the data?
– How will it be reported back to the team?
• How will you use the results?
• At the school, district, or state/project level?
• As it relates to fidelity? Outcomes? Identifying
potential Model Schools? Other?
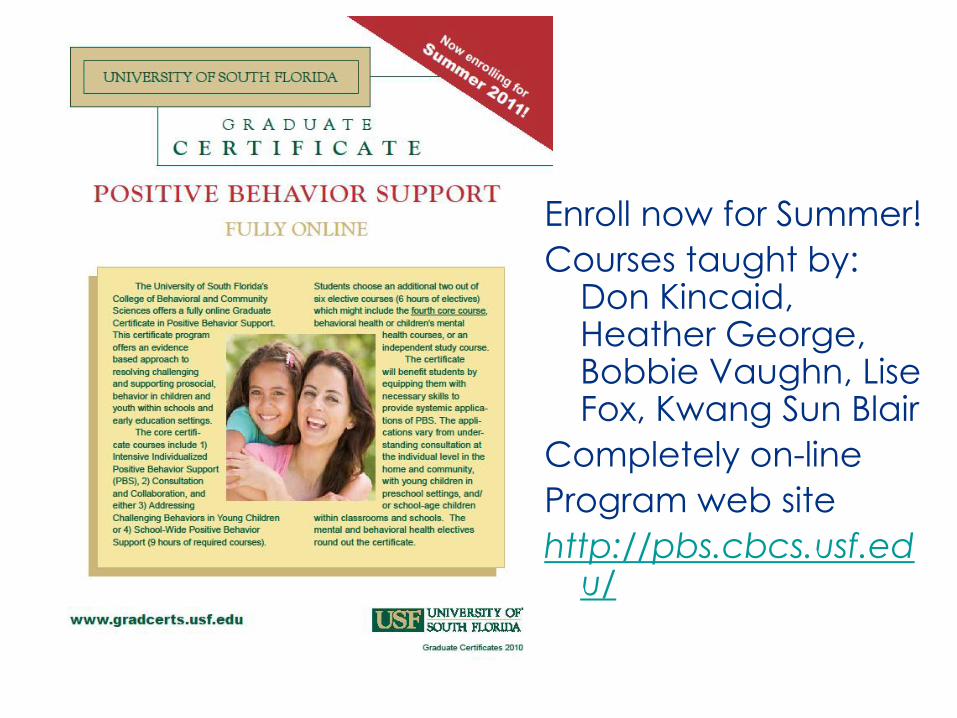
Enroll now for Summer!
Courses taught by: Don Kincaid, Heather George, Bobbie Vaughn, Lise Fox, Kwang Sun Blair
Completely on-line
Program web site
http://pbs.cbcs.usf.edu/
58
Contact
Heather Peshak George, Ph.D.
Associate Professor
Co-PI, Co-Director & PBIS Research Partner
Phone: (813) 974-6440
Fax: (813) 974-6115
Email: [email protected]
Website: http://flpbs.fmhi.usf.edu