profiling agricultural science teachers and other teaching...
TRANSCRIPT
MARCH 2008FET and HET Institutions
Profiling agricultural science teachers and other teaching profesionals at
EXECUTIVE SUMMARY 4
STUDY AIM 4
1.1 METHODOLOGY 4
1.2 KEY FINDINGS AND CONCLUSION 4
1.3 PROFILING ISSUES RELATED TO TEACHERS AT ACADEMIC SCHOOLS 5
1.4 PROFILING ISSUES RELATED TO TEACHERS IN AGRIC HIGH SCHOOLS 5
1.5 PROFILING ISSUES RELATED TO LECTURES AT AGRIC COLLEGES 5
1.6 PRIFILING ISSUES RELATED TO LECTURES AT OTHER FET COLLEGES 5
1.7 PROFILING ISSUES RELATED TO LECTURES AT HET INSTITUTIONS 6
1. CHAPTER 1: INTRODUCTION 7
1.1 BACKGROUND 7
1.2 OBJECTIVES OF THE STUDY 8
1.3 METHODOLOGY ADOPTED 8
1.4 STRUCTURE OF THE REPORT 8
2. CHAPTER 2: PROFILING OF AGRICULTURAL TEACHERS AT
SCHOOL LEVEL 9
2.1 MAINSTREAM ACADEMIC HIGH SCHOOLS 9
2.1.1 INTRODUCTION 10
2.1.2 PROFILING OF TEACHERS OFFERING AGRICULTURAL SCIENCES 10
2.2 AGRICULTURAL HIGH SCHOOLS 11
2.2.1 INTRODUCTION 11
2.2.2 METHODOLOGY APPLIED 12
2.2.3 RESPONSE RATE 13
2.2.4 PROFILING INFORMATION AND RESULTS 13- 16
3. CHAPTER 3: PROFILING OF AGRICULTURAL LECTURERS AT
FURTHER EDUCATION AND TRAINING (FET) LEVEL 17
3.1 AGRICULTURAL COLLEGES 17
3.1.1 INTRODUCTION 17
3.1.2 METHODOLOGY APPLIED 17
TABLE OF CONTENTS
2
3.1.3 RESPONSE RATE 17
3.1.4 PROFILING INFORMATION AND RESULTS 17
3.2 OTHER FET COLLEGES 22
3.2.1 INTRODUCTION 23
3.2.2 METHODOLOGY APPLIED 23
3.2.3 RESPONSE RATE 23
3.2.4 PROFILING INFORMATION AND RESULTS 23
4. CHAPTER 4: PROFILING OF AGRICULTURAL LECTURERS AT
HIGHER EDUCATION AND TRAINING (HET) LEVEL 27
4.1 INTRODUCTION 27
4.1.1 UNIVERSITIES OF TECHNOLOGY 27
4.1.2 UNIVERSITIES 29
4.2 METHODOLOGY APPLIED 30
4.1.3 RESPONSE RATE 30
4.1.4 PROFILING INFORMATION AND RESULTS 32
5. CHAPTER 5. 37
5.1 CONCLUSIONS 39
6. ANNEXURES 40- 41
6.1 ANNEXURE A: INFORMATION COLLECTION TEMPLATE FOR AGRICULTURAL
HIGH SCHOOLS
6.2 ANNEXURE B: INFORMATION COLLECTION TEMPLATE FOR AGRICULTURAL
AND OTHER FET COLLEGES
3
EXECUTIVE SUMMARY 1.1 STUDY AIM
One of the goals of the AET Strategy is to ensure that AET provider institutions are accredited and resourced with the appropriate number of teachers and trainers and that the teaching corps is adequately qualified and skilled. As part of the Strategy a need was subsequently identified to address shortfalls related to the agricultural teaching corps through investment in teacher development and by means of support programmes.
Since the above indicated investment and support programmes towards upgrading the teaching corps should be needs based, this assignment (study) was commissioned with the aim and objective to profile agricultural science teachers at school level and agricultural lecturers and professionals at institutions of higher learning. The study results should provide a clear profile of the agricultural teaching cadre with specific focus on aspects such as their qualifications, experi-ence, age and gender, etc.
1.2 METHODOLOGY
The methodology followed in undertaking the study included:
Document Review: Documents and reports of DoE and DoA were reviewed and interrogated for data and statistics
Interviews: Various officials within DoE and DoA as well as representatives of various provider groupings at the school, FET and HET levels were consulted.
Questionnaires: Questionnaires in the from of profiling templates were developed and administered to:
Schools questionnaire to 47 Agricultural High Schools (response rate of 75%)
FET questionnaire was distributed to all the 11 Agricultural Colleges and a further 14 FET Colleges (response rate of 90%)
HET questionnaire was distributed to 10 Universities and a further 6 Universities of Technology (response rate of 73%)
KEY FINDINGS AND CONCLUSIONS2.1 PROFILING ISSUES RELATED TO TEACHERS AT ACADEMIC SCHOOLS
Whilst the necessary information required for undertaking a detailed profiling of teachers at academic schools were not forthcoming from the DoE EMIS database, the following important observations could nevertheless be made from the other information gathered:
2.1.1 Strengths
The small sample group (39 teachers) reflected a mature profile (with only 20% having had less than 5 years teaching experience)
2.1.2 Weaknesses:
A considerable proportion of teachers offering the subject Agricultural Science at mainstream academic schools do not have sufficient qualifications or training to competently deliver the subject (25% of the sample group were under-qualified and it was projected that this figure could be as high as 40% for the country as a whole).
Few (if any) teachers have had practical agricultural experience and exposure (especially in a commercial environment). They thus lack practical knowledge and the context within which the subject is offered.
Teachers lack entrepreneurship knowledge and skills within an agricultural context and thus have shortfalls to teach farming as a business.
2.2 PROFILING ISSUES RELATED TO TEACHERS IN AGRICULTURAL HIGH SCHOOLS
The following key profiling observations are based on the responses received from the 32 Agricultural High Schools (106 teachers) that participated in the profiling survey.
Strengths:
Qualifications: The formal qualifications of the agricultural teacher corps in the agricultural high schools are relatively high when compared to the teaching fraternity in South Africa (with 60% of the group holding either degrees or post
DEP
ART
MEN
T O
F A
GR
ICU
LTU
RE
4
DEPA
RTMEN
T OF A
GR
ICU
LTUR
E
degree qualifications).
Weakne sses:
Gender: Male lecturers are dominant with 80% of all posts occupied by males. This poor gender equity may send wrong messages to prospective female students interested in following an agricultural career.
Race: Agricultural high schools have made little progress towards attaining employment equity from a racial per-spective with 69% of all lecturers falling in the white population group. White lecturers are particularly dominant in the Western Cape (100%) and Northern Cape (87%).
Experience: The overwhelming majority of lecturers have had no practical agricultural working experience (70%) and their knowledge of the subject is thus of an academic nature only. From a planning & development perspective opportunities must be created to expose them to practical farming practice in their fields of study.
2.3 PROFILING ISSUES RELATED TO LECTURERS AT AGRICULTURAL COLLEGES
The following key profiling observations are based on the responses received from the 10 Agricultural Colleges (174 lecturers) that participated in the profiling survey.
Strengths:
Qualifications: Lecturers are generally well qualified with 29% holding post graduate degrees and a further 44% having been qualified to degree level.
Race: Colleges have been able to attain employment equity from a racial perspective with 67% of all lecturers falling in the black population group. Black lecturers are particularly dominant in the North West and East Cape provinces where only black lecturers are employed (100%). In contrast the Northern Cape and KZN provinces still have a dominant white staffing profile with white lecturers respectively making up 90% and 66% of the lecturing complement.
Weaknesses:
Age: Generally speaking the lecturers are quite young (30% under the age of 30 years) and it raises a question regarding their ability to transfer knowledge and skills to the students. This becomes particularly evident when considering that 85% of all lecturers have had little or no practical commercial farming experience.
Race: From a planning /succession perspective it is important to note that linking race and agricultural experience data reflect that practical agricultural experience is primarily seated amongst white lecturers. Specific attention must thus be given to provide black lecturers with the opportunity to gain practical agricultural experience.
Experience: The overwhelming majority of lecturers (48%) have less than 3 years lecturing experience. This indi-cates a high turnover in staff which requires attention. Regarding practical agricultural experience the situation is bleak with many having now practical experience (50% falling in the category 0-3 years experience.)
Qualifications: Whilst lecturers are generally well qualified it must be noted that 24% of the lecturers only hold qualifications at a Diploma level and a further 3% at a Certificate level. Good academic practice prescribes that lec-turers should only offer learning programmes (especially programmes leading up to qualifications) at a NQF level that is lower than their own qualifications. This implies that this group of lecturers should confine themselves to offering skills programmes of a NQF level 4 and lower.
2.4 PROFILING ISSUES RELATED TO LECTURERS AT OTHER FET COLLEGES
The following key profiling observations are based on the responses received from the 12 FET Colleges (40 lectur-ers) that participated in the profiling survey.
2.4.1 Strengths:
Race: It is evident that the FET colleges have been able to attain employment equity from a racial perspective with 75% of all lecturers falling in the black population group. Black lecturers fill all posts in 5 of the provinces. The only exception is the Western Cape where no posts are held by black lecturers.
2.4.2 Weaknesses:
Age: Generally speaking the lecturers are quite young (33% under the age of 30 years) and raises a question regard-ing their ability to transfer knowledge and skills to the students. This is especially true in the East Cape and Limpopo Provinces where respectively 66% and 60% of al lecturers are under the age of 30 years.
Gender: Male lecturers are dominant with 75% of all posts occupied by males. This is particularly evident in the Eastern Cape, Free State, Limpopo and Mpumalanga Provinces where 100% of the respondents were male.
Experience: Whilst 42% of the lecturers have 10 or more years teaching experience, the overwhelming majority of
5
lecturers have had little practical agricultural experience (35% have no experience). This is especially high in KZN where 73% of the lecturers have indicated that they have never worked in the farming sector prior to becoming lecturers.
Qualifications: At the FET Colleges only 47% of the lecturers hold degree and/or post degree qualifications (as opposed to 63% at the Agricultural Colleges). FET colleges further employ some lecturers with Certificate qualifications only (12%) and a further relatively large group (40%) only has a Diploma as highest qualification.
2.5 PROFILING ISSUES RELATED TO LECURERS AT HET INSTITUTIONS
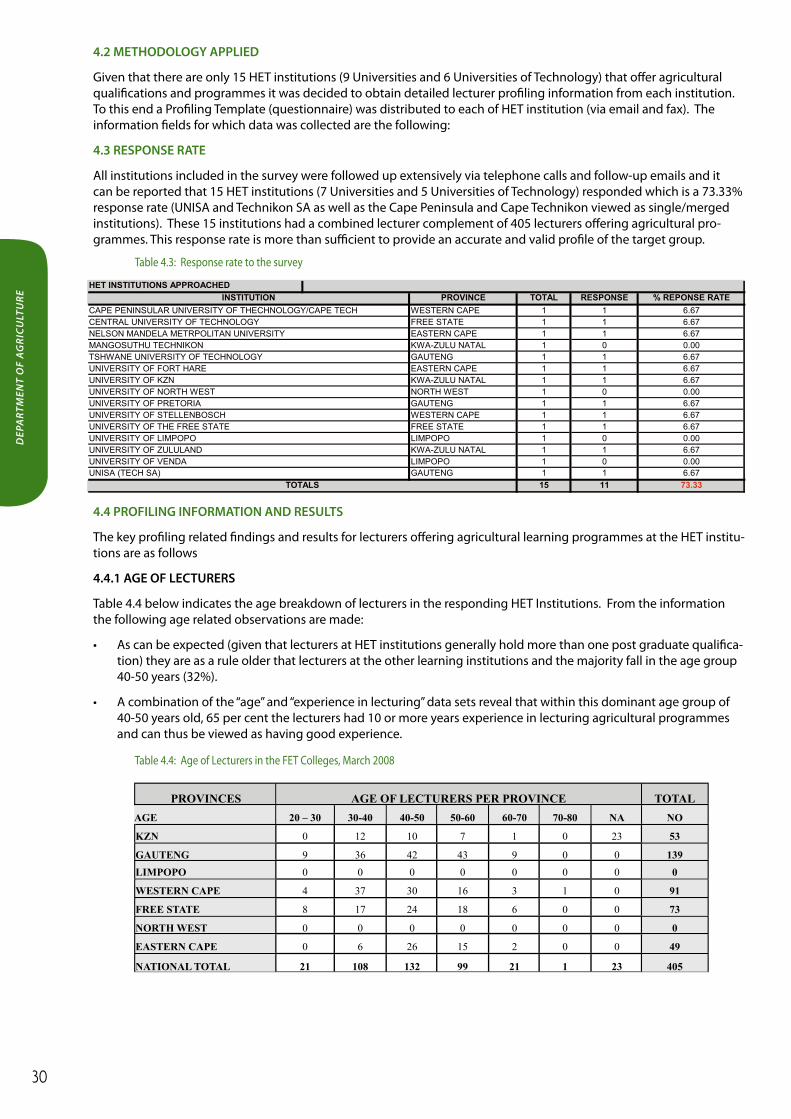
The following key profiling observations are based on the responses received from the 14 HET Institutions (9 Universities and 5 Universities of Technology with a combined total of 405 lecturers) that participated in the profiling survey.
2.5.1Strengths:
Age: As can be expected (given that lecturers at HET institutions generally hold more than one post graduate qualifica-tion) they are as a rule older that lecturers at the other learning institutions and the majority fall in the age group 40-50 years (32%). A combination of the “age” and “experience in lecturing” data sets reveal that within this dominant age group of 40-50 years old, 65 per cent the lecturers had 10 or more years experience in lecturing agricultural programmes.
Experience: Lecturers at the HET institutions generally have good teaching experience with more than 50% indicating 10 or more lecturing experience. It was also surprising to note that 70% of the HET lecturers indicated at least 5 years experience of a practical nature in the agricultural sector.
2.5.2 Weaknesses:
Gender: Male lecturers are dominant with 68% of all lecturing posts occupied by males. Male dominance is particularly evident in the Eastern Cape (92%) and Free State (85%) provinces. It is proposed that the HET institutions in these two provinces give particular attention to this matter towards addressing employment equity targets and since it may send wrong messages to prospective female students interested in following an agricultural career.
Race: It is evident that the HET institutions have not yet been able to attain employment equity from a racial perspec-tive with 75% of all lecturers belonging to the white population group. Attention is specifically drawn to the Western Cape (88%) and Free State (85%) provinces. A combination of the racial and qualification data sets reveal that this 25% representation is found at all levels of qualifications (i.e. from bachelor’s degree level through to doctorate degree level). This suggests sufficient numbers of highly qualified black candidates with an interest to take up employment positions at institutions of higher education.
Qualifications: As could be expected the qualifications of HET staff are good and they are well qualified (58% hold Doc-torate Degrees and 30% Masters Degrees).
DEP
ART
MEN
T O
F A
GR
ICU
LTU
RE
6

CHAPTER 1: INTRODUCTION
BACKGROUND
The Department of Agriculture developed the Agricultural Education and Training (AET) Strategy in an attempt to im-prove agricultural production through the rendering of quality agricultural education and training services. Whilst there are various challenges that hinder the improvement of agricultural production, constraints in the provisioning of quality education and training has been identified as a critical issue to be addressed.
It is generally recognised that agricultural teachers and agricultural lecturers at schools and other higher institutions of learning are pivotal in rendering quality education and training. However, the current cadre of agricultural teachers and lecturers reflect a variety of shortfalls and weaknesses resulting in poor delivery. The following are examples of constraints experienced:
Most high schools offering agriculture as a subject are poorly equipped in terms of qualified teachers (and practical train-ing equipment).
Teachers offering agricultural subjects (at both high schools and agricultural schools) are often inadequately trained – both in theory but especially in terms of practical farming experience
Few teachers have been trained to teach agriculture as a profit making subject (understanding of farming as a busi-ness).
There is a perception that there is a lack of interest amongst female teachers to offer agricultural subjects
As a result of the above challenges the image of agriculture as a career option (first choice option) is tarnished
It is one of the goals of the AET Strategy to ensure that AET is accredited and resourced with the appropriate number of teachers and trainers who are adequately qualified and skilled. As part of the Strategy a need was subsequently identi-fied to address shortfalls related to the agricultural teaching corps through investment in teacher development and by means of support programmes.
DEPA
RTMEN
T OF A
GR
ICU
LTUR
E
7
OBJECTIVES OF THIS STUDYSince the above indicated investment and support programmes towards upgrading the teaching corps should be needs based, this assignment (study) had as objective to profile agricultural science teachers at school level and agricultural lecturers and profession-als at institutions of higher learning. The study results should provide a clear profile of the agricultural teach-ing cadre with specific focus on aspects such as their qualifications, experience, age and gender, etc.
This profiling will then provide a base for the planned government investment and guide the support pro-grammes and other intended interventions. In this re-gard it is believed that the study results could provide guidance towards:
The retraining of especially agricultural science •teachers
The design of new qualifications for those involved •in the teaching of agriculture as a science
Recruitment and selection criteria and guidelines •for agricultural teachers and lecturers
METHODOLOGY ADOPTED
The methodology used in undertaking the assign-ment, taking into account the budgetary and time constraints, primarily consisted of a desk study and comprised the following:
1.3.1 DOCUMENT AND DATABASE REVIEW
A review was undertaken of existing documentation that could provide information relevant and useful to the study. In this regard the various databases of the Department of Education (e.g. EMIS) and reports on earlier studies undertaken by DoE and DoA would be interrogated and used in establishing data and statis-tics.
1.3.2 INTERVIEWS AND/OR FOCUS
GROUP MEETINGS
Interviews were held with selected key stakeholders and sources of information. In this regard relevant of-ficials in the DoE were interviewed as well as the Chair-persons of representatives of various provider group-ings at the School, FET and HET levels.
1.3.3 QUESTIONNAIRES
Questionnaires (in the form of profiling templates) were developed and administered to providers of agri-
cultural education and training service. In this regard a school questionnaire was distributed to each Agri-cultural High Schools (47 in total); a FET questionnaire was distributed to all the Agricultural Colleges (11 Col-leges) and to a further 14 FET Colleges; a HET question-naire was distributed to 10 Universities and a further 6 Universities of Technology.
The information obtained via the above data collec-tion processes were subsequently collated and analy-sed to develop teacher and lecturer profiles. The Draft Profiling Report was then presented to the DoA and other key stakeholders for discussion, verification and inputs. These inputs were subsequently worked into the Final Reported.
STRUCTURE OF THE REPORT
The Report has been structured as follows:
Chapter 1: Introduction
Chapter 2: Profiling of Agricultural Teachers at School level
General High Schools•
Agricultural High Schools•
Chapter 3: Further Education and Training Colleges
Agricultural Colleges•
Other FET Colleges•
Chapter 4: Higher Education and Training Institu- tions
Universities of Technology•
Universities•
Chapter 5: Conclusions
DEP
ART
MEN
T O
F A
GR
ICU
LTU
RE
8
DEPA
RTMEN
T OF A
GR
ICU
LTUR
E
CHAPTER 2: PROFILING OF AGRICULTURAL TEACHERS AT SCHOOL LEVEL
This Chapter reflects on agricultural education and training provisioning at school level and subsequently the focus is on the profiling of agricultural teachers. Within this band we differentiate between provision at mainstream (aca-demic) High Schools and at dedicated Agricultural Schools.
2.1 MAINSTREAM HIGH SCHOOLS
2.1.1 INTRODUCTION
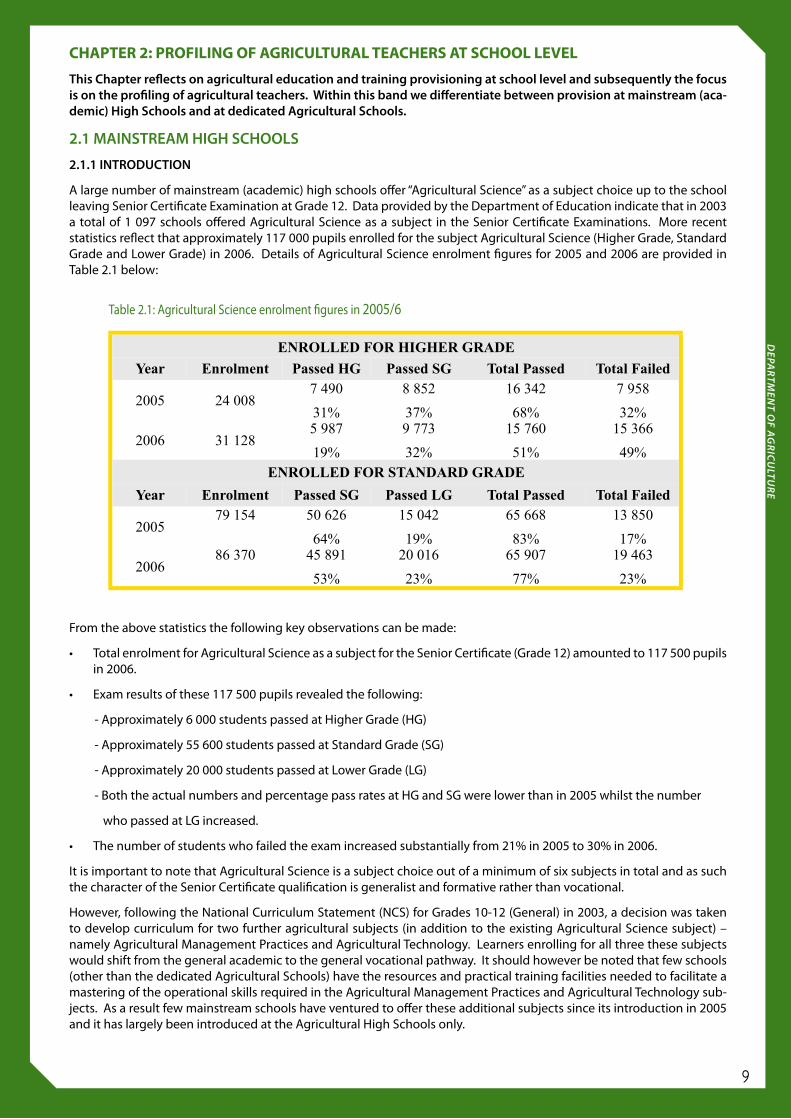
A large number of mainstream (academic) high schools offer “Agricultural Science” as a subject choice up to the school leaving Senior Certificate Examination at Grade 12. Data provided by the Department of Education indicate that in 2003 a total of 1 097 schools offered Agricultural Science as a subject in the Senior Certificate Examinations. More recent statistics reflect that approximately 117 000 pupils enrolled for the subject Agricultural Science (Higher Grade, Standard Grade and Lower Grade) in 2006. Details of Agricultural Science enrolment figures for 2005 and 2006 are provided in Table 2.1 below:
From the above statistics the following key observations can be made:
Total enrolment for Agricultural Science as a subject for the Senior Certificate (Grade 12) amounted to 117 500 pupils •in 2006.
Exam results of these 117 500 pupils revealed the following:•
- Approximately 6 000 students passed at Higher Grade (HG)
- Approximately 55 600 students passed at Standard Grade (SG)
- Approximately 20 000 students passed at Lower Grade (LG)
- Both the actual numbers and percentage pass rates at HG and SG were lower than in 2005 whilst the number
who passed at LG increased.
The number of students who failed the exam increased substantially from 21% in 2005 to 30% in 2006.•
It is important to note that Agricultural Science is a subject choice out of a minimum of six subjects in total and as such the character of the Senior Certificate qualification is generalist and formative rather than vocational.
However, following the National Curriculum Statement (NCS) for Grades 10-12 (General) in 2003, a decision was taken to develop curriculum for two further agricultural subjects (in addition to the existing Agricultural Science subject) – namely Agricultural Management Practices and Agricultural Technology. Learners enrolling for all three these subjects would shift from the general academic to the general vocational pathway. It should however be noted that few schools (other than the dedicated Agricultural Schools) have the resources and practical training facilities needed to facilitate a mastering of the operational skills required in the Agricultural Management Practices and Agricultural Technology sub-jects. As a result few mainstream schools have ventured to offer these additional subjects since its introduction in 2005 and it has largely been introduced at the Agricultural High Schools only.
Table 2.1: Agricultural Science enrolment figures in 2005/6
ENROLLED FOR HIGHER GRADE
Year Enrolment Passed HG Passed SG Total Passed Total Failed
2005 24 0087 490
31%
8 852
37%
16 342
68%
7 958
32%
2006 31 1285 987
19%
9 773
32%
15 760
51%
15 366
49%ENROLLED FOR STANDARD GRADE
Year Enrolment Passed SG Passed LG Total Passed Total Failed
200579 154 50 626
64%
15 042
19%
65 668
83%
13 850
17%
200686 370 45 891
53%
20 016
23%
65 907
77%
19 463
23%
9
2.1.2 PROFILE OF AGRICULTURAL TEACHERS IN SO-CALLED ACADEMIC HIGH SCHOOLS
Given the large number of schools offering Agricultural Science as a stand alone subject in many of the mainstream high schools, it was not possible to administer profiling questionnaires at all these schools (in excess of 100 000 pupils are enrolled for the subject nationally). Towards obtaining profiles of teacher offering the subject at mainstream schools the following methodology was subsequently adopted:
The Department of Education was requested to provide such information from their EMIS database.
At provincial level selected Deputy Chief Education Specialists and/or Learning Facilitators (for the subject Agricultural Science) was consulted to establish their views regarding the profile of teachers offering the subject in their respective provinces.
Review of relevant documents and publications
2.1.2.1 Results via the DoE EMIS Database
It must unfortunately be reported that the request for information from the DoE (via its EMIS database) has yielded no results. Whilst officials from the DoE initially indicated that the EMIS system could provide some of the information as requested from them, this was never provided despite various follow-up requests. Following one of the follow-up queries we were advised (2 weeks before the deadline for submission of the report) to approach the provincial FET Coordinators who could possibly assist with such information. Since a similar earlier request forwarded to a Provincial Coordinator did not yield results either it was realised that this approach (at such a late stage) would not be successful.
Given the resultant lack of statistical information re agricultural teacher profiles at academic schools, we were con-fined to relevant and related data from a limited teacher profiling survey undertaken by the Western Province DoE in 2003
2.2.2.2 Results via Provincial Inputs
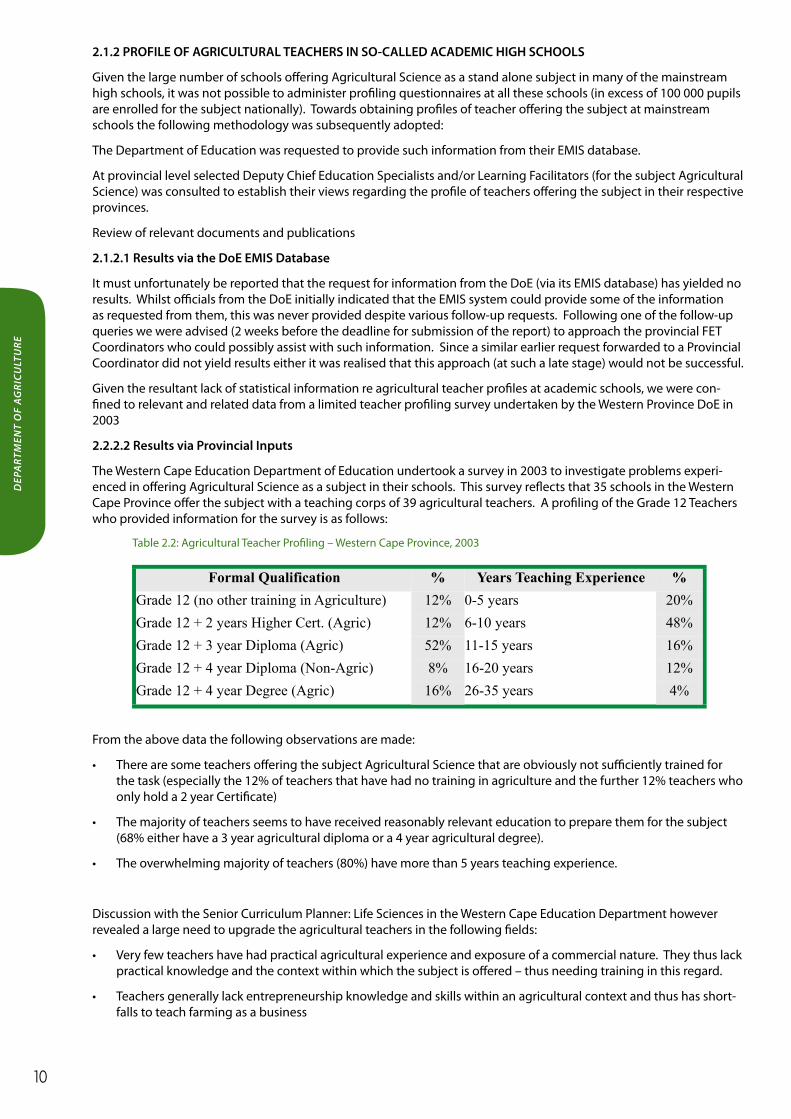
The Western Cape Education Department of Education undertook a survey in 2003 to investigate problems experi-enced in offering Agricultural Science as a subject in their schools. This survey reflects that 35 schools in the Western Cape Province offer the subject with a teaching corps of 39 agricultural teachers. A profiling of the Grade 12 Teachers who provided information for the survey is as follows:
Table 2.2: Agricultural Teacher Profiling – Western Cape Province, 2003
From the above data the following observations are made:
There are some teachers offering the subject Agricultural Science that are obviously not sufficiently trained for •the task (especially the 12% of teachers that have had no training in agriculture and the further 12% teachers who only hold a 2 year Certificate)
The majority of teachers seems to have received reasonably relevant education to prepare them for the subject •(68% either have a 3 year agricultural diploma or a 4 year agricultural degree).
The overwhelming majority of teachers (80%) have more than 5 years teaching experience.•
Discussion with the Senior Curriculum Planner: Life Sciences in the Western Cape Education Department however revealed a large need to upgrade the agricultural teachers in the following fields:
Very few teachers have had practical agricultural experience and exposure of a commercial nature. They thus lack •practical knowledge and the context within which the subject is offered – thus needing training in this regard.
Teachers generally lack entrepreneurship knowledge and skills within an agricultural context and thus has short-•falls to teach farming as a business
DEP
ART
MEN
T O
F A
GR
ICU
LTU
RE
Formal Qualification % Years Teaching Experience %
Grade 12 (no other training in Agriculture) 12% 0-5 years 20%
Grade 12 + 2 years Higher Cert. (Agric) 12% 6-10 years 48%
Grade 12 + 3 year Diploma (Agric) 52% 11-15 years 16%
Grade 12 + 4 year Diploma (Non-Agric) 8% 16-20 years 12%
Grade 12 + 4 year Degree (Agric) 16% 26-35 years 4%
10
2.2 AGRICULTURAL HIGH SCHOOLS
2.2.1 INTRODUCTION
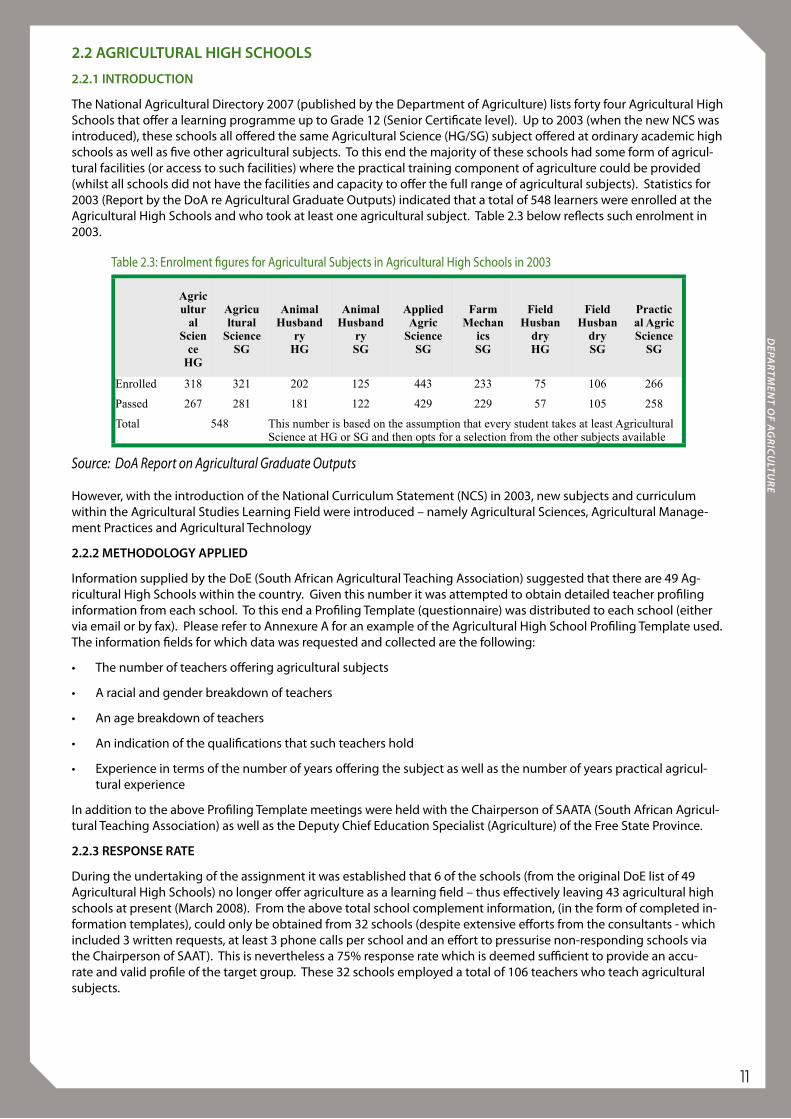
The National Agricultural Directory 2007 (published by the Department of Agriculture) lists forty four Agricultural High Schools that offer a learning programme up to Grade 12 (Senior Certificate level). Up to 2003 (when the new NCS was introduced), these schools all offered the same Agricultural Science (HG/SG) subject offered at ordinary academic high schools as well as five other agricultural subjects. To this end the majority of these schools had some form of agricul-tural facilities (or access to such facilities) where the practical training component of agriculture could be provided (whilst all schools did not have the facilities and capacity to offer the full range of agricultural subjects). Statistics for 2003 (Report by the DoA re Agricultural Graduate Outputs) indicated that a total of 548 learners were enrolled at the Agricultural High Schools and who took at least one agricultural subject. Table 2.3 below reflects such enrolment in 2003.
However, with the introduction of the National Curriculum Statement (NCS) in 2003, new subjects and curriculum within the Agricultural Studies Learning Field were introduced – namely Agricultural Sciences, Agricultural Manage-ment Practices and Agricultural Technology
2.2.2 METHODOLOGY APPLIED
Information supplied by the DoE (South African Agricultural Teaching Association) suggested that there are 49 Ag-ricultural High Schools within the country. Given this number it was attempted to obtain detailed teacher profiling information from each school. To this end a Profiling Template (questionnaire) was distributed to each school (either via email or by fax). Please refer to Annexure A for an example of the Agricultural High School Profiling Template used. The information fields for which data was requested and collected are the following:
The number of teachers offering agricultural subjects•
A racial and gender breakdown of teachers•
An age breakdown of teachers•
An indication of the qualifications that such teachers hold•
Experience in terms of the number of years offering the subject as well as the number of years practical agricul-•tural experience
In addition to the above Profiling Template meetings were held with the Chairperson of SAATA (South African Agricul-tural Teaching Association) as well as the Deputy Chief Education Specialist (Agriculture) of the Free State Province.
2.2.3 RESPONSE RATE
During the undertaking of the assignment it was established that 6 of the schools (from the original DoE list of 49 Agricultural High Schools) no longer offer agriculture as a learning field – thus effectively leaving 43 agricultural high schools at present (March 2008). From the above total school complement information, (in the form of completed in-formation templates), could only be obtained from 32 schools (despite extensive efforts from the consultants - which included 3 written requests, at least 3 phone calls per school and an effort to pressurise non-responding schools via the Chairperson of SAAT). This is nevertheless a 75% response rate which is deemed sufficient to provide an accu-rate and valid profile of the target group. These 32 schools employed a total of 106 teachers who teach agricultural subjects.
Table 2.3: Enrolment figures for Agricultural Subjects in Agricultural High Schools in 2003
Source: DoA Report on Agricultural Graduate Outputs
DEPA
RTMEN
T OF A
GR
ICU
LTUR
E
Agricultur
al Scien
ce HG
Agricultural
ScienceSG
Animal Husband
ryHG
Animal Husband
rySG
Applied Agric
ScienceSG
Farm Mechan
icsSG
Field Husban
dryHG
Field Husban
drySG
Practical AgricScience
SG
Enrolled 318 321 202 125 443 233 75 106 266
Passed 267 281 181 122 429 229 57 105 258
Total 548 This number is based on the assumption that every student takes at least Agricultural Science at HG or SG and then opts for a selection from the other subjects available
11
DEP
ART
MEN
T O
F A
GR
ICU
LTU
RE
2.2.4 AGRICULTURAL HIGH SCHOOL PROFILING RESULTS
The key profiling related findings and results for teachers offering agricultural subjects at the Agricultural High Schools are as follows:
2.2.4.1 Age of Teachers
Table 2.4 below indicates the age breakdown of teachers offering agricultural subjects lecturers in the agricultural high schools.
12

From the information the following important age related observations are made:
Generally speaking the age of teachers in the agricultural high schools is relatively spread over the different age groups with the majority falling in the age band 30 to 50 years. An exception is the Western Cape where more than 30% of the teachers are older than 56 years of age and are thus nearing retirement age.
The fact that 37% of all the teachers are still under the age of 40 years (with a further 31% in the age group 41 -50 years), is positive from a teacher upgrading and development perspective. This is especially relevant in view of the considerable teacher upgrading that will be required to orientate the existing teaching corps to the new agricultural subjects and curriculum.
2.2.4.2 Gender of Teachers
Table 2.5 provides a gender breakdown of teachers in the Agricultural High Schools. From the information the follow-ing important gender related observations are made:
Male lecturers are dominant with 80% of all posts occupied by males.
It is proposed that the schools give attention to this matter towards addressing employment equity targets and since it may send wrong messages to prospective female students interested in following an agricultural career.
When gender and qualification data fields are integrated it is interesting to note that 62% of the female teachers hold degree or post degree qualifications (which is slightly higher than that of their male counterparts).
DEPA
RTMEN
T OF A
GR
ICU
LTUR
E
PROVINCES AGE OF TEACHERS PER PROVINCE (NUMBERS) TOTAL
AGE GROUP 20 – 30 31 – 40 41 – 50 51 – 55 56 – 60 61 - + NO
FREE STATE 4 3 5 5 1 1 19
KZN 1 2 1 2 0 2 8
MPUMALANGA 3 8 5 4 0 0 20
LIMPOPO 1 7 7 1 0 0 16
NORTH WEST 2 0 2 2 1 0 7
NORTHERN CAPE 0 3 3 1 0 1 8
WESTERN CAPE 0 1 7 3 2 3 16
EASTERN CAPE 2 3 3 4 0 0 12
TOTAL 13 27 33 22 4 7 106
PROVINCES PERCENTAGE AGE DISTRIBUTION PER PROVINCE TOTAL
AGE GROUP 20 – 30 31 – 40 41 – 50 51 – 55 56 – 60 61 - + %
FREE STATE 21.1 15.8 26.3 26.3 5.3 5.3 100
KZN 12.5 25.0 12.5 25.0 0.0 25.0 100
MPUMALANGA 15.0 40.0 25.0 20.0 0.0 0.0 100
LIMPOPO 6.3 43.8 43.8 6.3 0.0 0.0 100
NORTH WEST 28.6 0.0 28.6 28.6 14.3 0.0 100
NORTHERN CAPE 0.0 37.5 37.5 12.5 0.0 12.5 100
WESTERN CAPE 0.0 6.3 43.8 18.8 12.5 18.8 100
EASTERN CAPE 18.2 18.2 27.3 36.4 0.0 0.0 100
TOTAL 12.4 24.8 31.4 21.0 3.8 6.7 100
13
Table 2.4: Age of Teachers in the Agricultural High Schools, March 2008
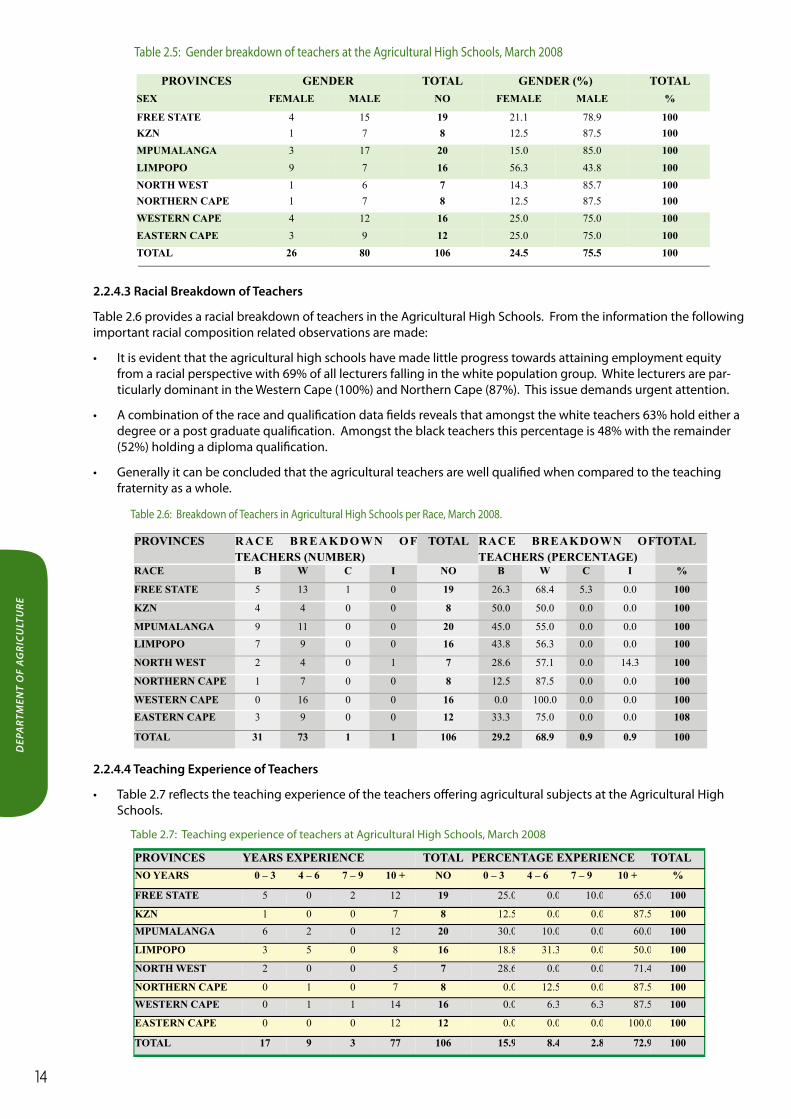
2.2.4.3 Racial Breakdown of Teachers
Table 2.6 provides a racial breakdown of teachers in the Agricultural High Schools. From the information the following important racial composition related observations are made:
It is evident that the agricultural high schools have made little progress towards attaining employment equity •from a racial perspective with 69% of all lecturers falling in the white population group. White lecturers are par-ticularly dominant in the Western Cape (100%) and Northern Cape (87%). This issue demands urgent attention.
A combination of the race and qualification data fields reveals that amongst the white teachers 63% hold either a •degree or a post graduate qualification. Amongst the black teachers this percentage is 48% with the remainder (52%) holding a diploma qualification.
Generally it can be concluded that the agricultural teachers are well qualified when compared to the teaching •fraternity as a whole.
2.2.4.4 Teaching Experience of Teachers
Table 2.7 reflects the teaching experience of the teachers offering agricultural subjects at the Agricultural High •Schools.
Table 2.7: Teaching experience of teachers at Agricultural High Schools, March 2008
Table 2.5: Gender breakdown of teachers at the Agricultural High Schools, March 2008
Table 2.6: Breakdown of Teachers in Agricultural High Schools per Race, March 2008.
PROVINCES YEARS EXPERIENCE TOTAL PERCENTAGE EXPERIENCE TOTAL
NO YEARS 0 – 3 4 – 6 7 – 9 10 + NO 0 – 3 4 – 6 7 – 9 10 + %
FREE STATE 5 0 2 12 19 25.0 0.0 10.0 65.0 100
KZN 1 0 0 7 8 12.5 0.0 0.0 87.5 100
MPUMALANGA 6 2 0 12 20 30.0 10.0 0.0 60.0 100
LIMPOPO 3 5 0 8 16 18.8 31.3 0.0 50.0 100
NORTH WEST 2 0 0 5 7 28.6 0.0 0.0 71.4 100
NORTHERN CAPE 0 1 0 7 8 0.0 12.5 0.0 87.5 100
WESTERN CAPE 0 1 1 14 16 0.0 6.3 6.3 87.5 100
EASTERN CAPE 0 0 0 12 12 0.0 0.0 0.0 100.0 100
TOTAL 17 9 3 77 106 15.9 8.4 2.8 72.9 100
PROVINCES RACE BREAKDOWN OFTEACHERS (NUMBER)
TOTAL RACE BREAKDOWN OFTEACHERS (PERCENTAGE)
TOTAL
RACE B W C I NO B W C I %
FREE STATE 5 13 1 0 19 26.3 68.4 5.3 0.0 100
KZN 4 4 0 0 8 50.0 50.0 0.0 0.0 100
MPUMALANGA 9 11 0 0 20 45.0 55.0 0.0 0.0 100
LIMPOPO 7 9 0 0 16 43.8 56.3 0.0 0.0 100
NORTH WEST 2 4 0 1 7 28.6 57.1 0.0 14.3 100
NORTHERN CAPE 1 7 0 0 8 12.5 87.5 0.0 0.0 100
WESTERN CAPE 0 16 0 0 16 0.0 100.0 0.0 0.0 100
EASTERN CAPE 3 9 0 0 12 33.3 75.0 0.0 0.0 108
TOTAL 31 73 1 1 106 29.2 68.9 0.9 0.9 100
PROVINCES GENDER TOTAL GENDER (%) TOTAL
SEX FEMALE MALE NO FEMALE MALE %
FREE STATE 4 15 19 21.1 78.9 100
KZN 1 7 8 12.5 87.5 100
MPUMALANGA 3 17 20 15.0 85.0 100
LIMPOPO 9 7 16 56.3 43.8 100
NORTH WEST 1 6 7 14.3 85.7 100
NORTHERN CAPE 1 7 8 12.5 87.5 100
WESTERN CAPE 4 12 16 25.0 75.0 100
EASTERN CAPE 3 9 12 25.0 75.0 100
TOTAL 26 80 106 24.5 75.5 100
DEP
ART
MEN
T O
F A
GR
ICU
LTU
RE
14
PROVINCES YEARS EXPERIENCE IN AGRICULTURE
TOTAL PERCENTAGE EXPERIENCE IN AGRICULTURE
TOTAL
No YEARS NONE 1 2 3 4 + NO NONE 1 2 3 4 + %
FREE STATE 14 1 2 1 2 20 70.0 5.0 10.0 5.0 10.0 100
KZN 6 0 0 0 2 8 75.0 0.0 0.0 0.0 25.0 100
MPUMALANGA 8 1 1 0 10 20 40.0 5.0 5.0 0.0 50.0 100
LIMPOPO 11 0 0 0 5 16 68.8 0.0 0.0 0.0 31.3 100
NORTH WEST 6 0 0 0 1 7 85.7 0.0 0.0 0.0 14.3 100
NORTHERN CAPE 7 0 0 0 1 8 87.5 0.0 0.0 0.0 12.5 100
WESTERN CAPE 13 0 0 2 1 16 81.3 0.0 0.0 12.5 6.3 100
EASTERN CAPE 10 0 0 0 2 12 83.3 0.0 0.0 0.0 16.7 100
TOTAL 75 2 3 3 24 107 70.1 1.9 2.8 2.8 22.4 100
From the information it is evident that:
It is an experienced teaching corps with 73% of the complement having more than 10 years experience in teach-•ing. The Eastern Cape in particular boasts a very experienced group of teachers with all having more than 10 years experience.
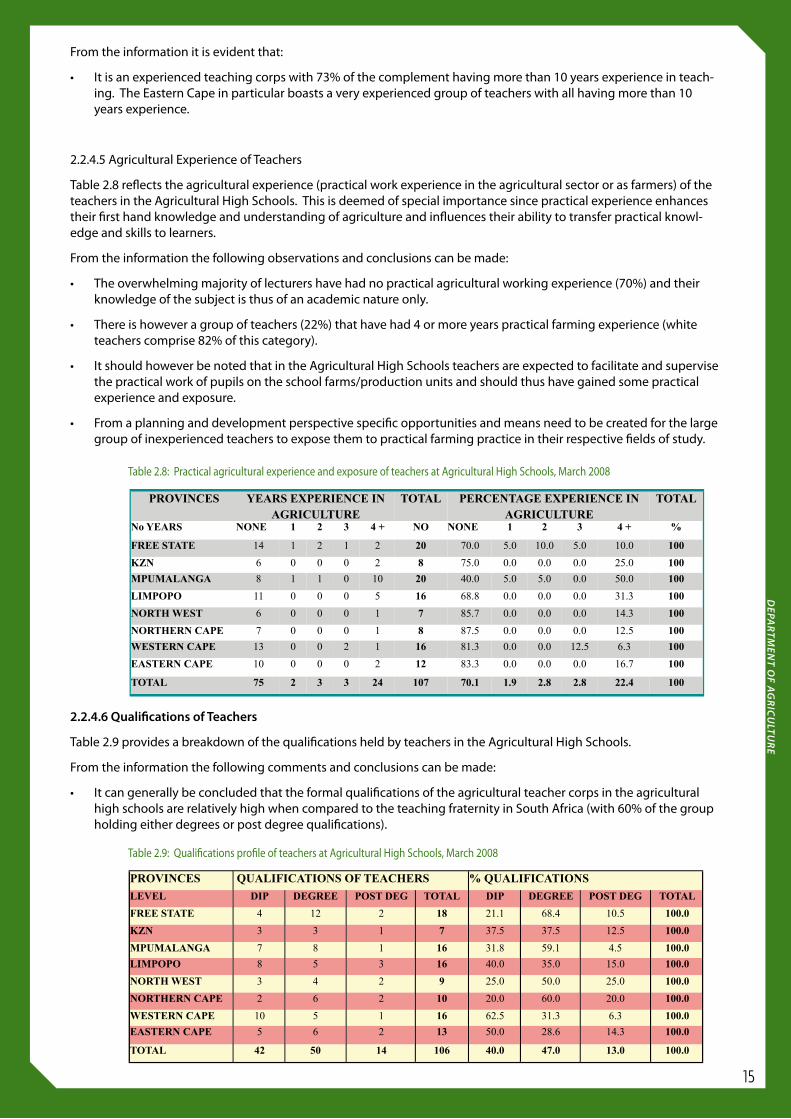
2.2.4.5 Agricultural Experience of Teachers
Table 2.8 reflects the agricultural experience (practical work experience in the agricultural sector or as farmers) of the teachers in the Agricultural High Schools. This is deemed of special importance since practical experience enhances their first hand knowledge and understanding of agriculture and influences their ability to transfer practical knowl-edge and skills to learners.
From the information the following observations and conclusions can be made:
The overwhelming majority of lecturers have had no practical agricultural working experience (70%) and their •knowledge of the subject is thus of an academic nature only.
There is however a group of teachers (22%) that have had 4 or more years practical farming experience (white •teachers comprise 82% of this category).
It should however be noted that in the Agricultural High Schools teachers are expected to facilitate and supervise •the practical work of pupils on the school farms/production units and should thus have gained some practical experience and exposure.
From a planning and development perspective specific opportunities and means need to be created for the large •group of inexperienced teachers to expose them to practical farming practice in their respective fields of study.
2.2.4.6 Qualifications of Teachers
Table 2.9 provides a breakdown of the qualifications held by teachers in the Agricultural High Schools.
From the information the following comments and conclusions can be made:
It can generally be concluded that the formal qualifications of the agricultural teacher corps in the agricultural •high schools are relatively high when compared to the teaching fraternity in South Africa (with 60% of the group holding either degrees or post degree qualifications).
Table 2.8: Practical agricultural experience and exposure of teachers at Agricultural High Schools, March 2008
Table 2.9: Qualifications profile of teachers at Agricultural High Schools, March 2008
PROVINCES QUALIFICATIONS OF TEACHERS % QUALIFICATIONS
LEVEL DIP DEGREE POST DEG TOTAL DIP DEGREE POST DEG TOTAL
FREE STATE 4 12 2 18 21.1 68.4 10.5 100.0
KZN 3 3 1 7 37.5 37.5 12.5 100.0
MPUMALANGA 7 8 1 16 31.8 59.1 4.5 100.0
LIMPOPO 8 5 3 16 40.0 35.0 15.0 100.0
NORTH WEST 3 4 2 9 25.0 50.0 25.0 100.0
NORTHERN CAPE 2 6 2 10 20.0 60.0 20.0 100.0
WESTERN CAPE 10 5 1 16 62.5 31.3 6.3 100.0
EASTERN CAPE 5 6 2 13 50.0 28.6 14.3 100.0
TOTAL 42 50 14 106 40.0 47.0 13.0 100.0
DEPA
RTMEN
T OF A
GR
ICU
LTUR
E
15
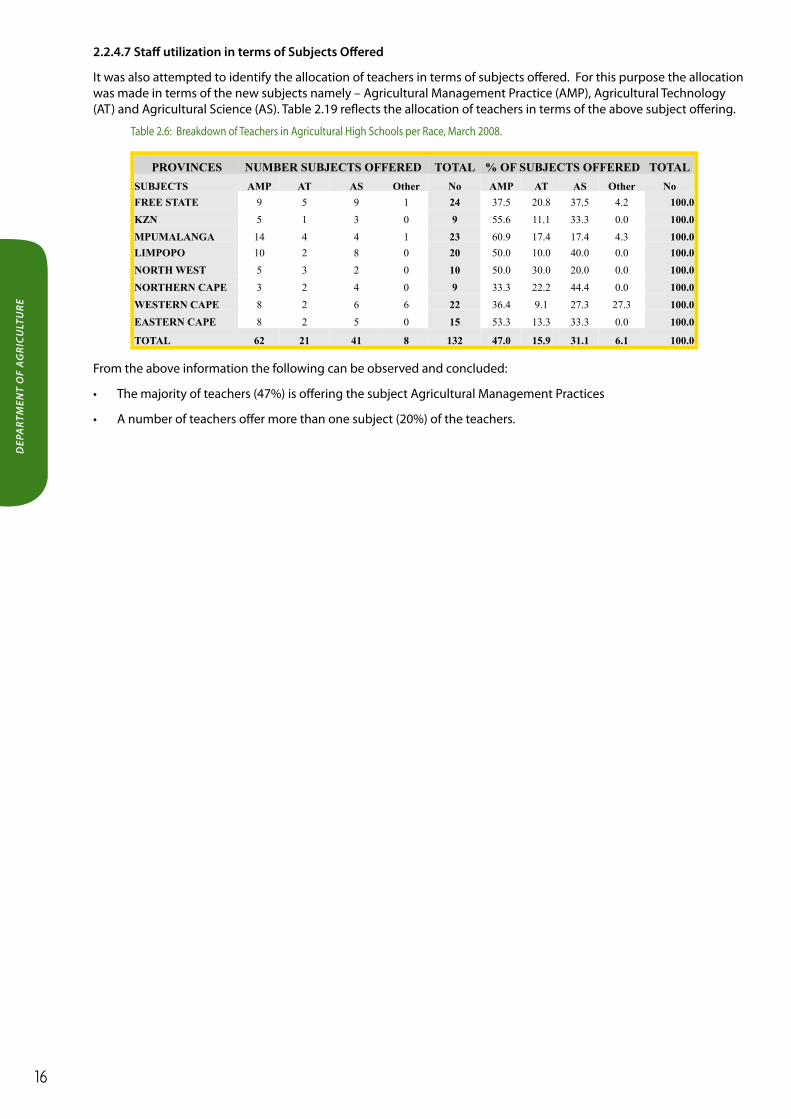
2.2.4.7 Staff utilization in terms of Subjects Offered
It was also attempted to identify the allocation of teachers in terms of subjects offered. For this purpose the allocation was made in terms of the new subjects namely – Agricultural Management Practice (AMP), Agricultural Technology (AT) and Agricultural Science (AS). Table 2.19 reflects the allocation of teachers in terms of the above subject offering.
From the above information the following can be observed and concluded:
The majority of teachers (47%) is offering the subject Agricultural Management Practices•
A number of teachers offer more than one subject (20%) of the teachers.•
Table 2.6: Breakdown of Teachers in Agricultural High Schools per Race, March 2008.
PROVINCES NUMBER SUBJECTS OFFERED TOTAL % OF SUBJECTS OFFERED TOTAL
SUBJECTS AMP AT AS Other No AMP AT AS Other No
FREE STATE 9 5 9 1 24 37.5 20.8 37.5 4.2 100.0
KZN 5 1 3 0 9 55.6 11.1 33.3 0.0 100.0
MPUMALANGA 14 4 4 1 23 60.9 17.4 17.4 4.3 100.0
LIMPOPO 10 2 8 0 20 50.0 10.0 40.0 0.0 100.0
NORTH WEST 5 3 2 0 10 50.0 30.0 20.0 0.0 100.0
NORTHERN CAPE 3 2 4 0 9 33.3 22.2 44.4 0.0 100.0
WESTERN CAPE 8 2 6 6 22 36.4 9.1 27.3 27.3 100.0
EASTERN CAPE 8 2 5 0 15 53.3 13.3 33.3 0.0 100.0
TOTAL 62 21 41 8 132 47.0 15.9 31.1 6.1 100.0
DEP
ART
MEN
T O
F A
GR
ICU
LTU
RE
16
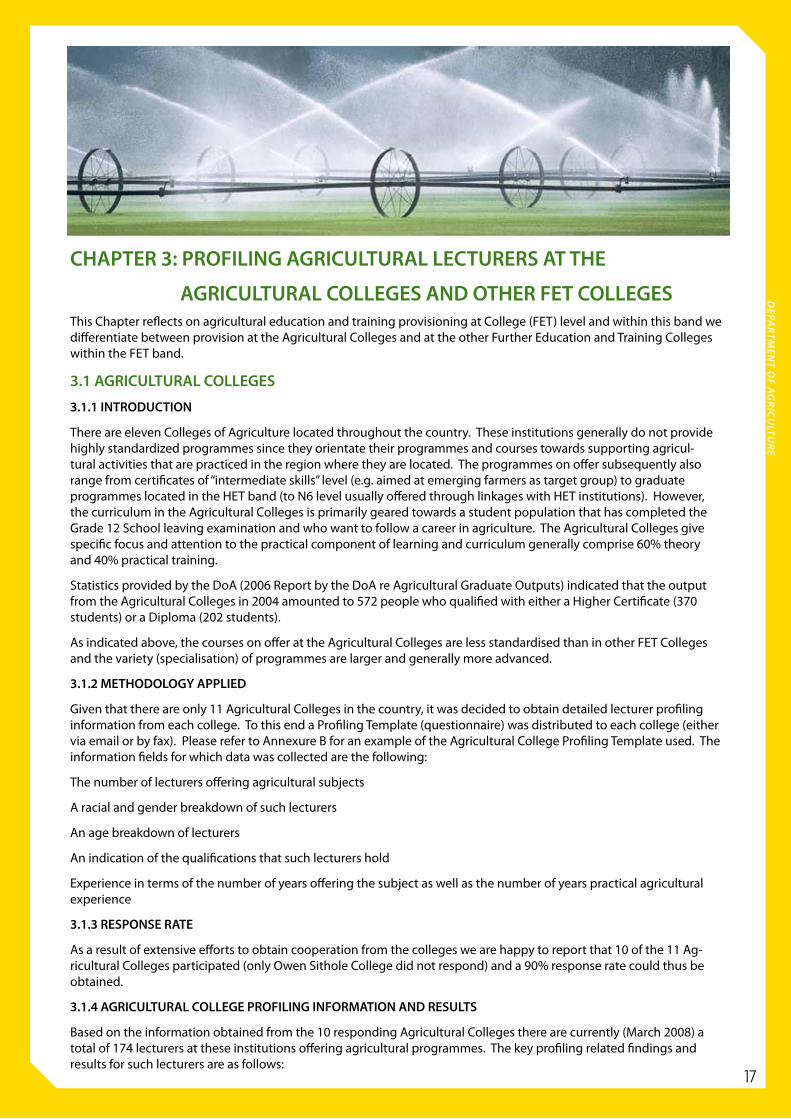
CHAPTER 3: PROFILING AGRICULTURAL LECTURERS AT THE
AGRICULTURAL COLLEGES AND OTHER FET COLLEGESThis Chapter reflects on agricultural education and training provisioning at College (FET) level and within this band we differentiate between provision at the Agricultural Colleges and at the other Further Education and Training Colleges within the FET band.
3.1 AGRICULTURAL COLLEGES
3.1.1 INTRODUCTION
There are eleven Colleges of Agriculture located throughout the country. These institutions generally do not provide highly standardized programmes since they orientate their programmes and courses towards supporting agricul-tural activities that are practiced in the region where they are located. The programmes on offer subsequently also range from certificates of “intermediate skills” level (e.g. aimed at emerging farmers as target group) to graduate programmes located in the HET band (to N6 level usually offered through linkages with HET institutions). However, the curriculum in the Agricultural Colleges is primarily geared towards a student population that has completed the Grade 12 School leaving examination and who want to follow a career in agriculture. The Agricultural Colleges give specific focus and attention to the practical component of learning and curriculum generally comprise 60% theory and 40% practical training.
Statistics provided by the DoA (2006 Report by the DoA re Agricultural Graduate Outputs) indicated that the output from the Agricultural Colleges in 2004 amounted to 572 people who qualified with either a Higher Certificate (370 students) or a Diploma (202 students).
As indicated above, the courses on offer at the Agricultural Colleges are less standardised than in other FET Colleges and the variety (specialisation) of programmes are larger and generally more advanced.
3.1.2 METHODOLOGY APPLIED
Given that there are only 11 Agricultural Colleges in the country, it was decided to obtain detailed lecturer profiling information from each college. To this end a Profiling Template (questionnaire) was distributed to each college (either via email or by fax). Please refer to Annexure B for an example of the Agricultural College Profiling Template used. The information fields for which data was collected are the following:
The number of lecturers offering agricultural subjects
A racial and gender breakdown of such lecturers
An age breakdown of lecturers
An indication of the qualifications that such lecturers hold
Experience in terms of the number of years offering the subject as well as the number of years practical agricultural experience
3.1.3 RESPONSE RATE
As a result of extensive efforts to obtain cooperation from the colleges we are happy to report that 10 of the 11 Ag-ricultural Colleges participated (only Owen Sithole College did not respond) and a 90% response rate could thus be obtained.
3.1.4 AGRICULTURAL COLLEGE PROFILING INFORMATION AND RESULTS
Based on the information obtained from the 10 responding Agricultural Colleges there are currently (March 2008) a total of 174 lecturers at these institutions offering agricultural programmes. The key profiling related findings and results for such lecturers are as follows:
DEPA
RTMEN
T OF A
GR
ICU
LTUR
E
17
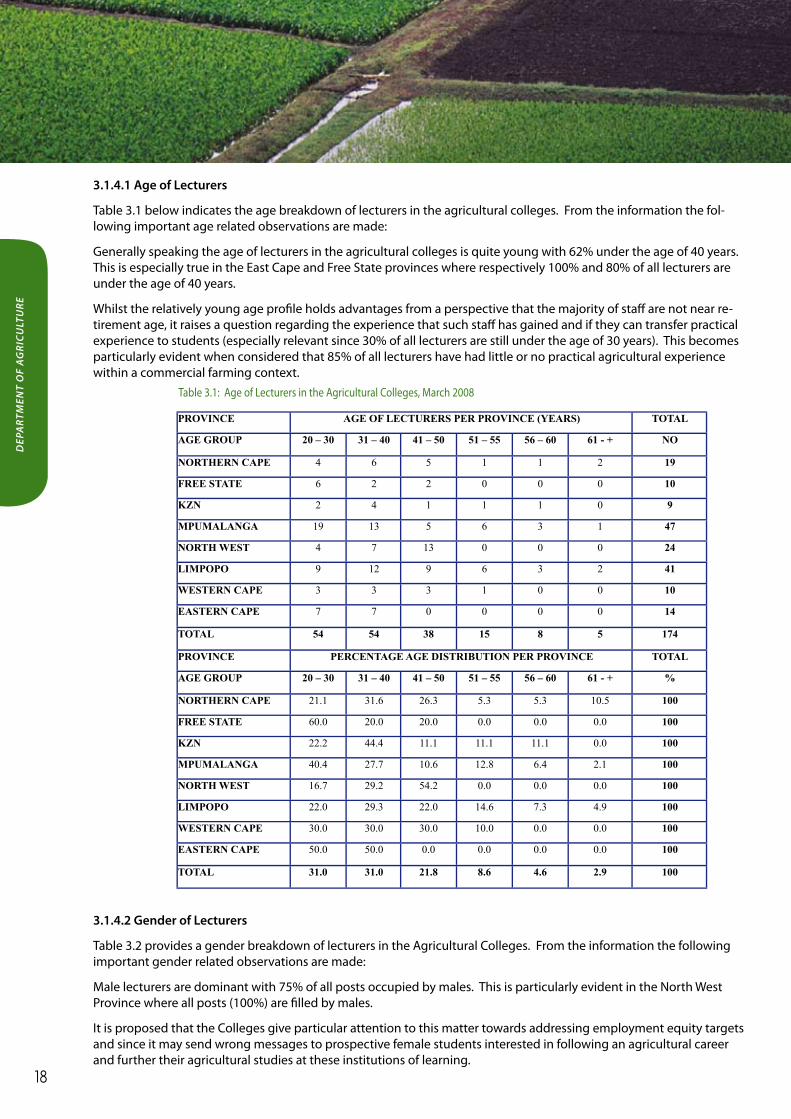
3.1.4.1 Age of Lecturers
Table 3.1 below indicates the age breakdown of lecturers in the agricultural colleges. From the information the fol-lowing important age related observations are made:
Generally speaking the age of lecturers in the agricultural colleges is quite young with 62% under the age of 40 years. This is especially true in the East Cape and Free State provinces where respectively 100% and 80% of all lecturers are under the age of 40 years.
Whilst the relatively young age profile holds advantages from a perspective that the majority of staff are not near re-tirement age, it raises a question regarding the experience that such staff has gained and if they can transfer practical experience to students (especially relevant since 30% of all lecturers are still under the age of 30 years). This becomes particularly evident when considered that 85% of all lecturers have had little or no practical agricultural experience within a commercial farming context.
3.1.4.2 Gender of Lecturers
Table 3.2 provides a gender breakdown of lecturers in the Agricultural Colleges. From the information the following important gender related observations are made:
Male lecturers are dominant with 75% of all posts occupied by males. This is particularly evident in the North West Province where all posts (100%) are filled by males.
It is proposed that the Colleges give particular attention to this matter towards addressing employment equity targets and since it may send wrong messages to prospective female students interested in following an agricultural career and further their agricultural studies at these institutions of learning.
Table 3.1: Age of Lecturers in the Agricultural Colleges, March 2008
PROVINCE AGE OF LECTURERS PER PROVINCE (YEARS) TOTAL
AGE GROUP 20 – 30 31 – 40 41 – 50 51 – 55 56 – 60 61 - + NO
NORTHERN CAPE 4 6 5 1 1 2 19
FREE STATE 6 2 2 0 0 0 10
KZN 2 4 1 1 1 0 9
MPUMALANGA 19 13 5 6 3 1 47
NORTH WEST 4 7 13 0 0 0 24
LIMPOPO 9 12 9 6 3 2 41
WESTERN CAPE 3 3 3 1 0 0 10
EASTERN CAPE 7 7 0 0 0 0 14
TOTAL 54 54 38 15 8 5 174
PROVINCE PERCENTAGE AGE DISTRIBUTION PER PROVINCE TOTAL
AGE GROUP 20 – 30 31 – 40 41 – 50 51 – 55 56 – 60 61 - + %
NORTHERN CAPE 21.1 31.6 26.3 5.3 5.3 10.5 100
FREE STATE 60.0 20.0 20.0 0.0 0.0 0.0 100
KZN 22.2 44.4 11.1 11.1 11.1 0.0 100
MPUMALANGA 40.4 27.7 10.6 12.8 6.4 2.1 100
NORTH WEST 16.7 29.2 54.2 0.0 0.0 0.0 100
LIMPOPO 22.0 29.3 22.0 14.6 7.3 4.9 100
WESTERN CAPE 30.0 30.0 30.0 10.0 0.0 0.0 100
EASTERN CAPE 50.0 50.0 0.0 0.0 0.0 0.0 100
TOTAL 31.0 31.0 21.8 8.6 4.6 2.9 100
DEP
ART
MEN
T O
F A
GR
ICU
LTU
RE
18
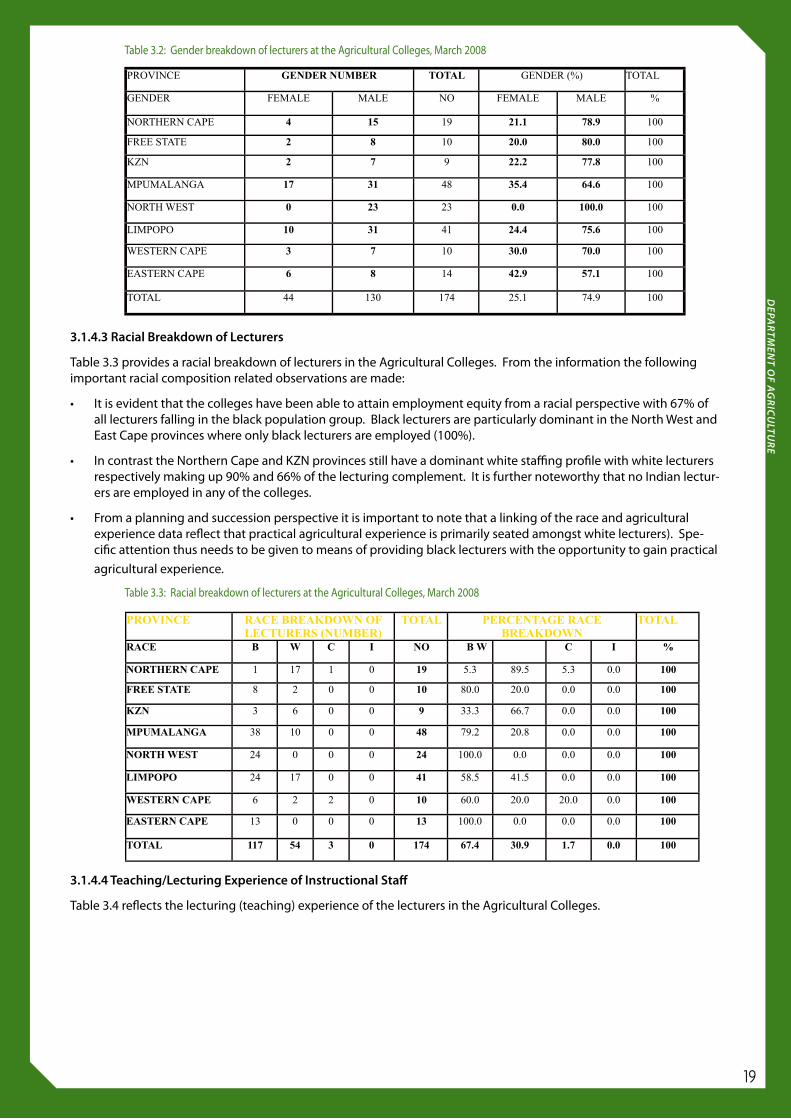
Table 3.2: Gender breakdown of lecturers at the Agricultural Colleges, March 2008
Table 3.3: Racial breakdown of lecturers at the Agricultural Colleges, March 2008
PROVINCE GENDER NUMBER TOTAL GENDER (%) TOTAL
GENDER FEMALE MALE NO FEMALE MALE %
NORTHERN CAPE 4 15 19 21.1 78.9 100
FREE STATE 2 8 10 20.0 80.0 100
KZN 2 7 9 22.2 77.8 100
MPUMALANGA 17 31 48 35.4 64.6 100
NORTH WEST 0 23 23 0.0 100.0 100
LIMPOPO 10 31 41 24.4 75.6 100
WESTERN CAPE 3 7 10 30.0 70.0 100
EASTERN CAPE 6 8 14 42.9 57.1 100
TOTAL 44 130 174 25.1 74.9 100
3.1.4.3 Racial Breakdown of Lecturers
Table 3.3 provides a racial breakdown of lecturers in the Agricultural Colleges. From the information the following important racial composition related observations are made:
It is evident that the colleges have been able to attain employment equity from a racial perspective with 67% of •all lecturers falling in the black population group. Black lecturers are particularly dominant in the North West and East Cape provinces where only black lecturers are employed (100%).
In contrast the Northern Cape and KZN provinces still have a dominant white staffing profile with white lecturers •respectively making up 90% and 66% of the lecturing complement. It is further noteworthy that no Indian lectur-ers are employed in any of the colleges.
From a planning and succession perspective it is important to note that a linking of the race and agricultural •experience data reflect that practical agricultural experience is primarily seated amongst white lecturers). Spe-cific attention thus needs to be given to means of providing black lecturers with the opportunity to gain practical agricultural experience.
3.1.4.4 Teaching/Lecturing Experience of Instructional Staff
Table 3.4 reflects the lecturing (teaching) experience of the lecturers in the Agricultural Colleges.
PROVINCE RACE BREAKDOWN OF LECTURERS (NUMBER)
TOTAL PERCENTAGE RACE BREAKDOWN
TOTAL
RACE B W C I NO B W C I %
NORTHERN CAPE 1 17 1 0 19 5.3 89.5 5.3 0.0 100
FREE STATE 8 2 0 0 10 80.0 20.0 0.0 0.0 100
KZN 3 6 0 0 9 33.3 66.7 0.0 0.0 100
MPUMALANGA 38 10 0 0 48 79.2 20.8 0.0 0.0 100
NORTH WEST 24 0 0 0 24 100.0 0.0 0.0 0.0 100
LIMPOPO 24 17 0 0 41 58.5 41.5 0.0 0.0 100
WESTERN CAPE 6 2 2 0 10 60.0 20.0 20.0 0.0 100
EASTERN CAPE 13 0 0 0 13 100.0 0.0 0.0 0.0 100
TOTAL 117 54 3 0 174 67.4 30.9 1.7 0.0 100
DEPA
RTMEN
T OF A
GR
ICU
LTUR
E
19
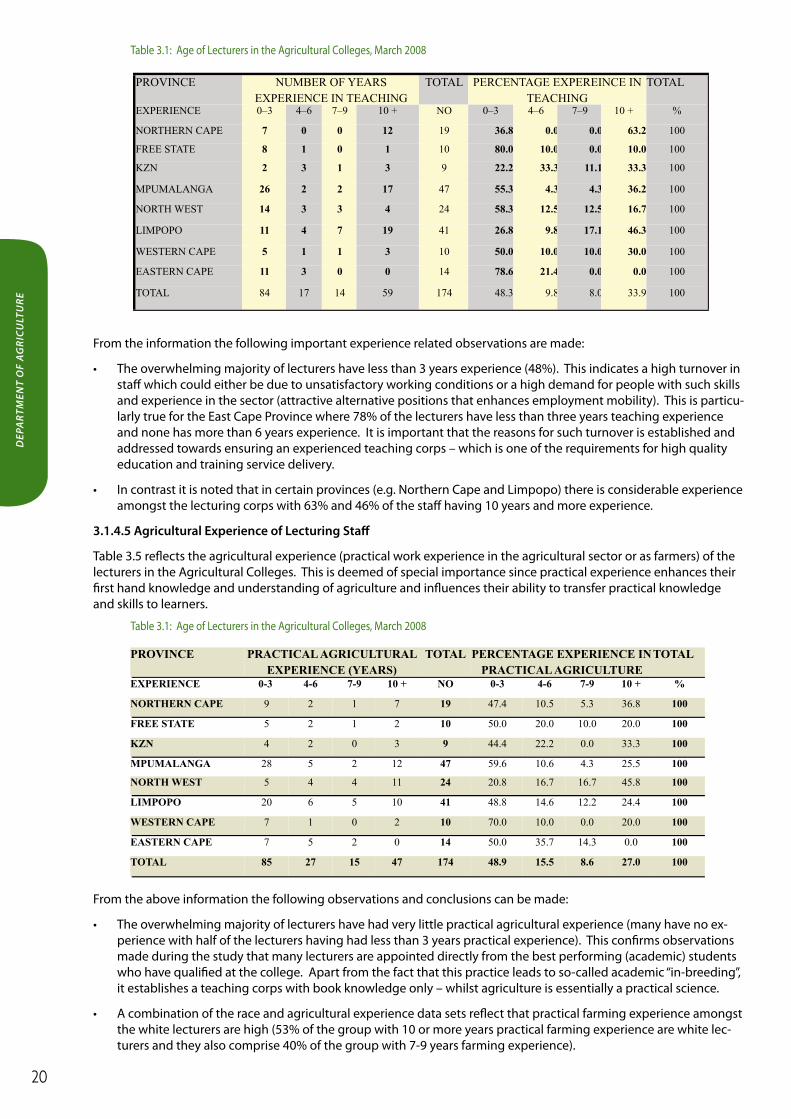
From the information the following important experience related observations are made:
The overwhelming majority of lecturers have less than 3 years experience (48%). This indicates a high turnover in •staff which could either be due to unsatisfactory working conditions or a high demand for people with such skills and experience in the sector (attractive alternative positions that enhances employment mobility). This is particu-larly true for the East Cape Province where 78% of the lecturers have less than three years teaching experience and none has more than 6 years experience. It is important that the reasons for such turnover is established and addressed towards ensuring an experienced teaching corps – which is one of the requirements for high quality education and training service delivery.
In contrast it is noted that in certain provinces (e.g. Northern Cape and Limpopo) there is considerable experience •amongst the lecturing corps with 63% and 46% of the staff having 10 years and more experience.
3.1.4.5 Agricultural Experience of Lecturing Staff
Table 3.5 reflects the agricultural experience (practical work experience in the agricultural sector or as farmers) of the lecturers in the Agricultural Colleges. This is deemed of special importance since practical experience enhances their first hand knowledge and understanding of agriculture and influences their ability to transfer practical knowledge and skills to learners.
From the above information the following observations and conclusions can be made:
The overwhelming majority of lecturers have had very little practical agricultural experience (many have no ex-•perience with half of the lecturers having had less than 3 years practical experience). This confirms observations made during the study that many lecturers are appointed directly from the best performing (academic) students who have qualified at the college. Apart from the fact that this practice leads to so-called academic “in-breeding”, it establishes a teaching corps with book knowledge only – whilst agriculture is essentially a practical science.
A combination of the race and agricultural experience data sets reflect that practical farming experience amongst •the white lecturers are high (53% of the group with 10 or more years practical farming experience are white lec-turers and they also comprise 40% of the group with 7-9 years farming experience).
Table 3.1: Age of Lecturers in the Agricultural Colleges, March 2008
Table 3.1: Age of Lecturers in the Agricultural Colleges, March 2008
PROVINCE NUMBER OF YEARS EXPERIENCE IN TEACHING
TOTAL PERCENTAGE EXPEREINCE IN TEACHING
TOTAL
EXPERIENCE 0–3 4–6 7–9 10 + NO 0–3 4–6 7–9 10 + %
NORTHERN CAPE 7 0 0 12 19 36.8 0.0 0.0 63.2 100
FREE STATE 8 1 0 1 10 80.0 10.0 0.0 10.0 100
KZN 2 3 1 3 9 22.2 33.3 11.1 33.3 100
MPUMALANGA 26 2 2 17 47 55.3 4.3 4.3 36.2 100
NORTH WEST 14 3 3 4 24 58.3 12.5 12.5 16.7 100
LIMPOPO 11 4 7 19 41 26.8 9.8 17.1 46.3 100
WESTERN CAPE 5 1 1 3 10 50.0 10.0 10.0 30.0 100
EASTERN CAPE 11 3 0 0 14 78.6 21.4 0.0 0.0 100
TOTAL 84 17 14 59 174 48.3 9.8 8.0 33.9 100
PROVINCE PRACTICAL AGRICULTURAL
EXPERIENCE (YEARS)
TOTAL PERCENTAGE EXPERIENCE IN
PRACTICAL AGRICULTURE
TOTAL
EXPERIENCE 0-3 4-6 7-9 10 + NO 0-3 4-6 7-9 10 + %
NORTHERN CAPE 9 2 1 7 19 47.4 10.5 5.3 36.8 100
FREE STATE 5 2 1 2 10 50.0 20.0 10.0 20.0 100
KZN 4 2 0 3 9 44.4 22.2 0.0 33.3 100
MPUMALANGA 28 5 2 12 47 59.6 10.6 4.3 25.5 100
NORTH WEST 5 4 4 11 24 20.8 16.7 16.7 45.8 100
LIMPOPO 20 6 5 10 41 48.8 14.6 12.2 24.4 100
WESTERN CAPE 7 1 0 2 10 70.0 10.0 0.0 20.0 100
EASTERN CAPE 7 5 2 0 14 50.0 35.7 14.3 0.0 100
TOTAL 85 27 15 47 174 48.9 15.5 8.6 27.0 100
DEP
ART
MEN
T O
F A
GR
ICU
LTU
RE
20
From a planning and development perspective specific opportunities and means need to be afforded to the large •group of young lecturers to be exposed to practical farming practice in their respective fields of study.
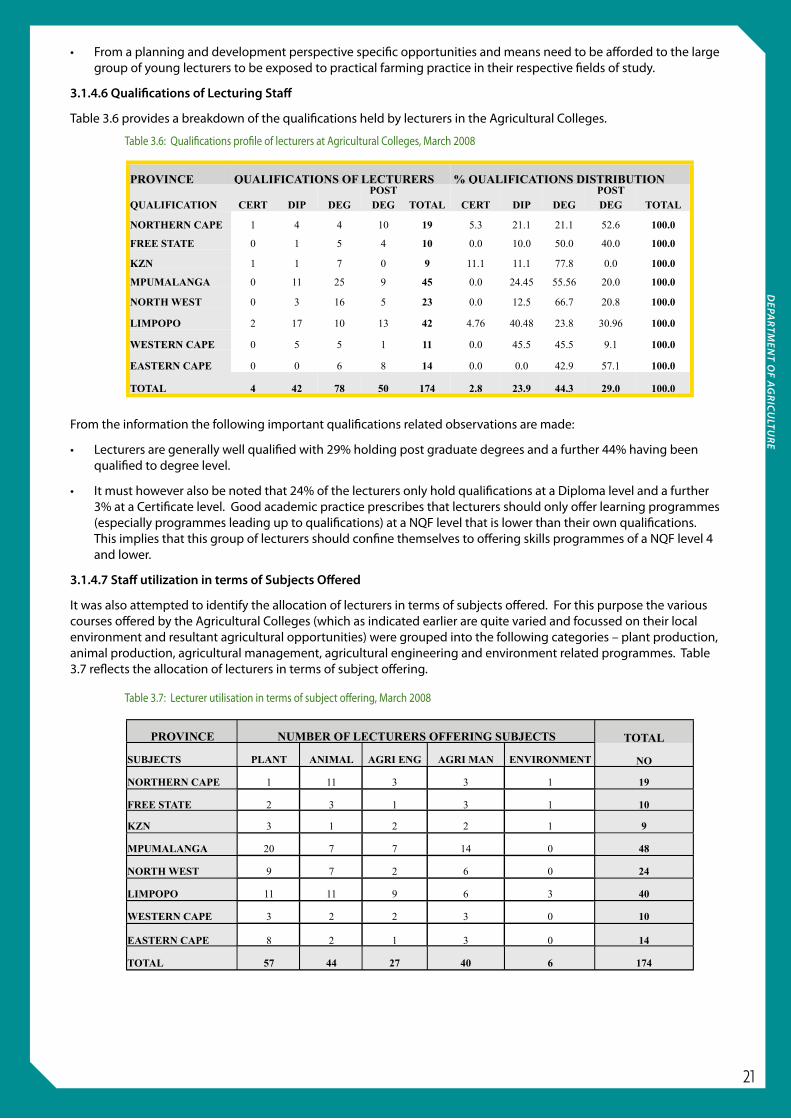
3.1.4.6 Qualifications of Lecturing Staff
Table 3.6 provides a breakdown of the qualifications held by lecturers in the Agricultural Colleges.
From the information the following important qualifications related observations are made:
Lecturers are generally well qualified with 29% holding post graduate degrees and a further 44% having been •qualified to degree level.
It must however also be noted that 24% of the lecturers only hold qualifications at a Diploma level and a further •3% at a Certificate level. Good academic practice prescribes that lecturers should only offer learning programmes (especially programmes leading up to qualifications) at a NQF level that is lower than their own qualifications. This implies that this group of lecturers should confine themselves to offering skills programmes of a NQF level 4 and lower.
3.1.4.7 Staff utilization in terms of Subjects Offered
It was also attempted to identify the allocation of lecturers in terms of subjects offered. For this purpose the various courses offered by the Agricultural Colleges (which as indicated earlier are quite varied and focussed on their local environment and resultant agricultural opportunities) were grouped into the following categories – plant production, animal production, agricultural management, agricultural engineering and environment related programmes. Table 3.7 reflects the allocation of lecturers in terms of subject offering.
Table 3.6: Qualifications profile of lecturers at Agricultural Colleges, March 2008
Table 3.7: Lecturer utilisation in terms of subject offering, March 2008
PROVINCE QUALIFICATIONS OF LECTURERS % QUALIFICATIONS DISTRIBUTION
QUALIFICATION CERT DIP DEGPOST DEG TOTAL CERT DIP DEG
POST DEG TOTAL
NORTHERN CAPE 1 4 4 10 19 5.3 21.1 21.1 52.6 100.0
FREE STATE 0 1 5 4 10 0.0 10.0 50.0 40.0 100.0
KZN 1 1 7 0 9 11.1 11.1 77.8 0.0 100.0
MPUMALANGA 0 11 25 9 45 0.0 24.45 55.56 20.0 100.0
NORTH WEST 0 3 16 5 23 0.0 12.5 66.7 20.8 100.0
LIMPOPO 2 17 10 13 42 4.76 40.48 23.8 30.96 100.0
WESTERN CAPE 0 5 5 1 11 0.0 45.5 45.5 9.1 100.0
EASTERN CAPE 0 0 6 8 14 0.0 0.0 42.9 57.1 100.0
TOTAL 4 42 78 50 174 2.8 23.9 44.3 29.0 100.0
PROVINCE NUMBER OF LECTURERS OFFERING SUBJECTS TOTAL
SUBJECTS PLANT ANIMAL AGRI ENG AGRI MAN ENVIRONMENT NO
NORTHERN CAPE 1 11 3 3 1 19
FREE STATE 2 3 1 3 1 10
KZN 3 1 2 2 1 9
MPUMALANGA 20 7 7 14 0 48
NORTH WEST 9 7 2 6 0 24
LIMPOPO 11 11 9 6 3 40
WESTERN CAPE 3 2 2 3 0 10
EASTERN CAPE 8 2 1 3 0 14
TOTAL 57 44 27 40 6 174
DEPA
RTMEN
T OF A
GR
ICU
LTUR
E
21
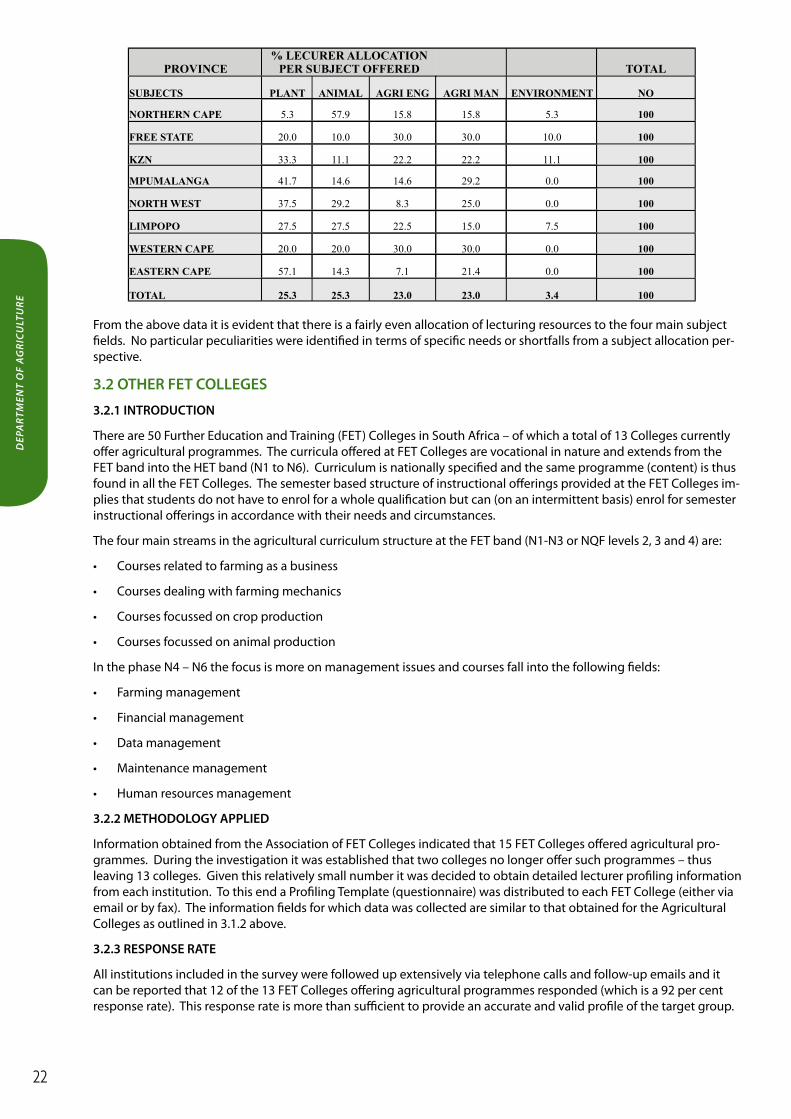
PROVINCE% LECURER ALLOCATION
PER SUBJECT OFFERED TOTAL
SUBJECTS PLANT ANIMAL AGRI ENG AGRI MAN ENVIRONMENT NO
NORTHERN CAPE 5.3 57.9 15.8 15.8 5.3 100
FREE STATE 20.0 10.0 30.0 30.0 10.0 100
KZN 33.3 11.1 22.2 22.2 11.1 100
MPUMALANGA 41.7 14.6 14.6 29.2 0.0 100
NORTH WEST 37.5 29.2 8.3 25.0 0.0 100
LIMPOPO 27.5 27.5 22.5 15.0 7.5 100
WESTERN CAPE 20.0 20.0 30.0 30.0 0.0 100
EASTERN CAPE 57.1 14.3 7.1 21.4 0.0 100
TOTAL 25.3 25.3 23.0 23.0 3.4 100
From the above data it is evident that there is a fairly even allocation of lecturing resources to the four main subject fields. No particular peculiarities were identified in terms of specific needs or shortfalls from a subject allocation per-spective.
3.2 OTHER FET COLLEGES
3.2.1 INTRODUCTION
There are 50 Further Education and Training (FET) Colleges in South Africa – of which a total of 13 Colleges currently offer agricultural programmes. The curricula offered at FET Colleges are vocational in nature and extends from the FET band into the HET band (N1 to N6). Curriculum is nationally specified and the same programme (content) is thus found in all the FET Colleges. The semester based structure of instructional offerings provided at the FET Colleges im-plies that students do not have to enrol for a whole qualification but can (on an intermittent basis) enrol for semester instructional offerings in accordance with their needs and circumstances.
The four main streams in the agricultural curriculum structure at the FET band (N1-N3 or NQF levels 2, 3 and 4) are:
Courses related to farming as a business•
Courses dealing with farming mechanics•
Courses focussed on crop production•
Courses focussed on animal production•
In the phase N4 – N6 the focus is more on management issues and courses fall into the following fields:
Farming management•
Financial management•
Data management•
Maintenance management•
Human resources management•
3.2.2 METHODOLOGY APPLIED
Information obtained from the Association of FET Colleges indicated that 15 FET Colleges offered agricultural pro-grammes. During the investigation it was established that two colleges no longer offer such programmes – thus leaving 13 colleges. Given this relatively small number it was decided to obtain detailed lecturer profiling information from each institution. To this end a Profiling Template (questionnaire) was distributed to each FET College (either via email or by fax). The information fields for which data was collected are similar to that obtained for the Agricultural Colleges as outlined in 3.1.2 above.
3.2.3 RESPONSE RATE
All institutions included in the survey were followed up extensively via telephone calls and follow-up emails and it can be reported that 12 of the 13 FET Colleges offering agricultural programmes responded (which is a 92 per cent response rate). This response rate is more than sufficient to provide an accurate and valid profile of the target group.
DEP
ART
MEN
T O
F A
GR
ICU
LTU
RE
22
PROVINCES AGE OF LECTURERS PER PROVINCE (YEARS) TOTAL
AGE 20 – 30 31 – 40 41 – 50 51 – 55 56 – 60 61 - + NO
KZN 8 0 2 0 1 0 11
MPUMALANGA 0 1 3 0 0 0 4
LIMPOPO 3 2 0 0 0 0 5
WESTERN CAPE 0 2 3 2 0 2 9
FREE STATE 0 0 3 3 0 0 6
NORTH WEST 0 2 0 0 0 0 2
EASTERN CAPE 2 0 0 1 0 0 3
TOTAL 13 7 11 6 1 2 40
PROVINCES PERCENTAGE OF AGE PER PROVINCE TOTAL
AGE 20 – 30 31 – 40 41 – 50 51 – 55 56 – 60 61 - + %
KZN 72.7 0.0 18.2 0.0 9.1 0.0 100
MPUMALANGA 0.0 25.0 75.0 0.0 0.0 0.0 100
LIMPOPO 60.0 40.0 0.0 0.0 0.0 0.0 100
WESTERN CAPE 0.0 22.2 33.3 22.2 0.0 22.2 100
FREE STATE 0.0 0.0 50.0 50.0 0.0 0.0 100
NORTH WEST 0.0 100.0 0.0 0.0 0.0 0.0 100
EATERN CAPE 66.7 0.0 0.0 33.3 0.0 0.0 100
TOTAL 32.5 17.5 27.5 15.0 2.5 5.0 100
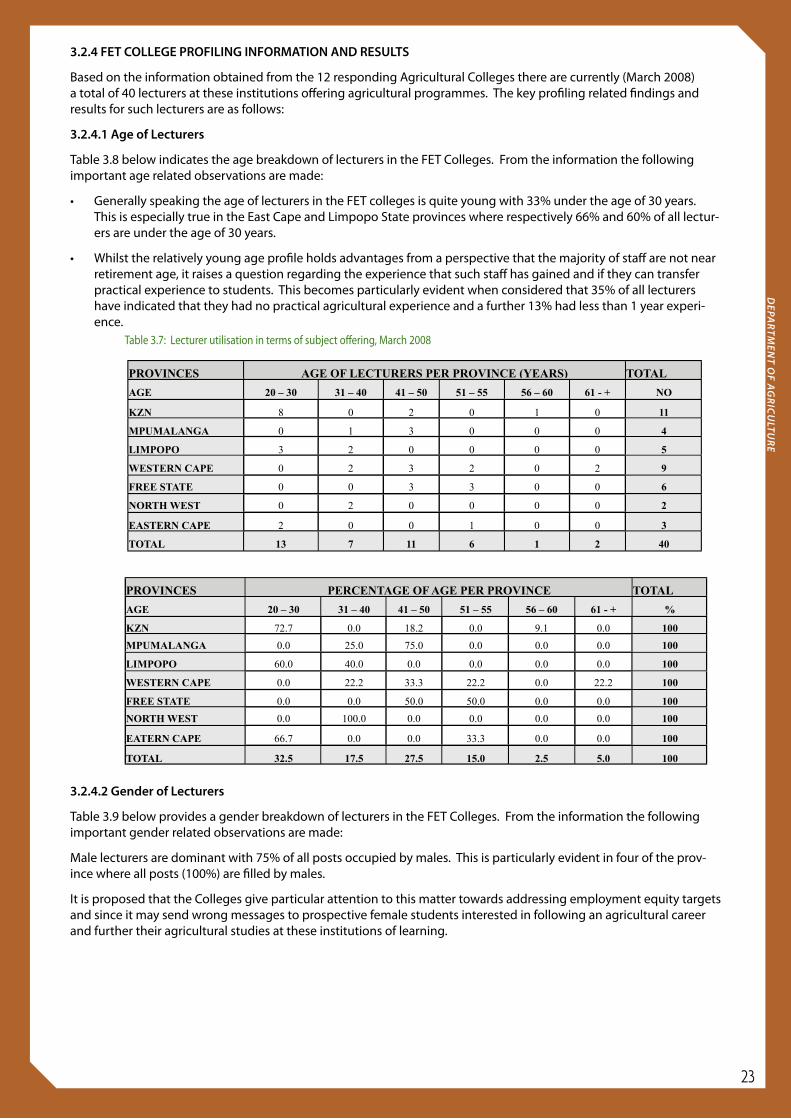
3.2.4 FET COLLEGE PROFILING INFORMATION AND RESULTS
Based on the information obtained from the 12 responding Agricultural Colleges there are currently (March 2008) a total of 40 lecturers at these institutions offering agricultural programmes. The key profiling related findings and results for such lecturers are as follows:
3.2.4.1 Age of Lecturers
Table 3.8 below indicates the age breakdown of lecturers in the FET Colleges. From the information the following important age related observations are made:
Generally speaking the age of lecturers in the FET colleges is quite young with 33% under the age of 30 years. •This is especially true in the East Cape and Limpopo State provinces where respectively 66% and 60% of all lectur-ers are under the age of 30 years.
Whilst the relatively young age profile holds advantages from a perspective that the majority of staff are not near •retirement age, it raises a question regarding the experience that such staff has gained and if they can transfer practical experience to students. This becomes particularly evident when considered that 35% of all lecturers have indicated that they had no practical agricultural experience and a further 13% had less than 1 year experi-ence.
3.2.4.2 Gender of Lecturers
Table 3.9 below provides a gender breakdown of lecturers in the FET Colleges. From the information the following important gender related observations are made:
Male lecturers are dominant with 75% of all posts occupied by males. This is particularly evident in four of the prov-ince where all posts (100%) are filled by males.
It is proposed that the Colleges give particular attention to this matter towards addressing employment equity targets and since it may send wrong messages to prospective female students interested in following an agricultural career and further their agricultural studies at these institutions of learning.
Table 3.7: Lecturer utilisation in terms of subject offering, March 2008
DEPA
RTMEN
T OF A
GR
ICU
LTUR
E
23

3.2.4.3 Racial Breakdown of Lecturers
Table 3.10 provides a racial breakdown of lecturers in the FET Colleges. From the information the following important racial composition related observations are made:
It is evident that the colleges have been able to attain employment equity from a racial perspective with 75% •of all lecturers falling in the black population group. In five provinces the total complement is made up of black lecturers (100%) with the Free State (83%) and the Western Cape (0%) the only exceptions.
Attention is drawn to the fact that the Western Province does not have any black lecturers and it is recommended •that urgent action be taken to establish better employment equity.
3.2.4.4 Teaching/Lecturing Experience of Instructional Staff
Table 3.11 reflects the lecturing (teaching) experience of the agricultural lecturers in the FET Colleges.
Table 3.9: Gender breakdown of lecturers at the FET Colleges, March 2008
Table 3.10: Racial breakdown of lecturers at the FET Colleges, March 2008
Table 3.11: Years teaching experience of lecturers at FET Colleges, March 2008
PROVINCE GENDER NUMBERTOTAL GENDER (%)
TOTAL
GENDER FEMALEMALE NO FEMALE MALE
%
KZN 56 11 45.5 54.5
100
MPUMALANGA 04 4 0.0 100.0
100
LIMPOPO 05 5 0.0 100.0
100
WESTERN CAPE 45 9 44.4. 55.6
100
FREE STATE 06 6 0.0 100.0
100
NORTH WEST 11 2 50.0 50.0
100
EASTERN CAPE 03 3 0.0 100.0
100
TOTAL 1030 40 25.0 75.0
100
PROVINCESR A C E B R E A K D O W N(NUMBERS) TOTAL PERCENTAGE BREAKDOWN TOTAL
RACE B W C I NO B W C I %
KZN 11 0 0 0 11 100.0 0.0 0.0 0.0 100
MPUMALANGA 4 0 0 0 4 100.0 0.0 0.0 0.0 100
LIMPOPO 5 0 0 0 5 100.0 0.0 0.0 0.0 100
WESTERN CAPE 0 8 1 0 9 0.0 88.9 11.1 0.0 100
FREE STATE 5 1 0 0 6 83.3 16.7 0.0 0.0 100
NORTH WEST 2 0 0 0 2 100.0 0.0 0.0 0.0 100
EASTERN CAPE 3 0 0 0 3 100.0 0.0 0.0 0.0 100
TOTAL 30 9 1 0 40 75.0 22.5 2.5 0.0 100
PROVINCESE X P E R I E N C E O FLECTURERS (YEARS) TOTAL
PERCENTAGE EXPERIENCE OF LECTURERS TOTAL
YEARS 0 – 3 4 – 6 7 – 9 10 + NO 0 – 3 4 – 6 7 – 9 10 + %
KZN 6 4 0 1 11 54.5 36.4 0.0 9.1 100
MPUMALANGA 0 0 0 4 4 0.0 0.0 0.0 100.0 100
LIMPOPO 2 3 0 0 5 40.0 60.0 0.0 0.0 100
WESTERN CAPE 1 1 1 6 9 11.1 11.1 11.1 66.7 100
FREE STATE 0 1 0 5 6 0.0 16.7 0.0 83.3 100
NORTH WEST 0 2 0 0 2 0.0 100.0 0.0 0.0 100
EATERN CAPE 1 1 0 1 3 33.3 33.3 0.0 33.3 100
TOTAL 10 12 1 17 40 25.0 30.0 2.5 42.5 100
DEP
ART
MEN
T O
F A
GR
ICU
LTU
RE
24
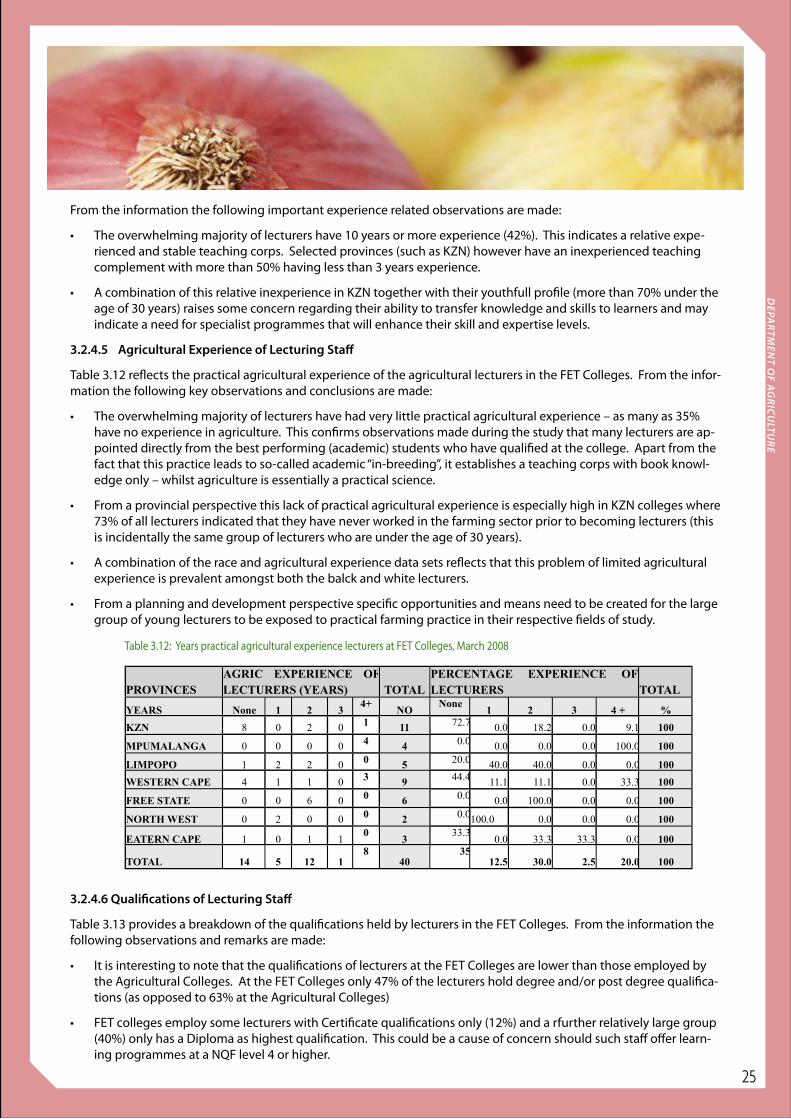
From the information the following important experience related observations are made:
The overwhelming majority of lecturers have 10 years or more experience (42%). This indicates a relative expe-•rienced and stable teaching corps. Selected provinces (such as KZN) however have an inexperienced teaching complement with more than 50% having less than 3 years experience.
A combination of this relative inexperience in KZN together with their youthfull profile (more than 70% under the •age of 30 years) raises some concern regarding their ability to transfer knowledge and skills to learners and may indicate a need for specialist programmes that will enhance their skill and expertise levels.
3.2.4.5 Agricultural Experience of Lecturing Staff
Table 3.12 reflects the practical agricultural experience of the agricultural lecturers in the FET Colleges. From the infor-mation the following key observations and conclusions are made:
The overwhelming majority of lecturers have had very little practical agricultural experience – as many as 35% •have no experience in agriculture. This confirms observations made during the study that many lecturers are ap-pointed directly from the best performing (academic) students who have qualified at the college. Apart from the fact that this practice leads to so-called academic “in-breeding”, it establishes a teaching corps with book knowl-edge only – whilst agriculture is essentially a practical science.
From a provincial perspective this lack of practical agricultural experience is especially high in KZN colleges where •73% of all lecturers indicated that they have never worked in the farming sector prior to becoming lecturers (this is incidentally the same group of lecturers who are under the age of 30 years).
A combination of the race and agricultural experience data sets reflects that this problem of limited agricultural •experience is prevalent amongst both the balck and white lecturers.
From a planning and development perspective specific opportunities and means need to be created for the large •group of young lecturers to be exposed to practical farming practice in their respective fields of study.
3.2.4.6 Qualifications of Lecturing Staff
Table 3.13 provides a breakdown of the qualifications held by lecturers in the FET Colleges. From the information the following observations and remarks are made:
It is interesting to note that the qualifications of lecturers at the FET Colleges are lower than those employed by •the Agricultural Colleges. At the FET Colleges only 47% of the lecturers hold degree and/or post degree qualifica-tions (as opposed to 63% at the Agricultural Colleges)
FET colleges employ some lecturers with Certificate qualifications only (12%) and a rfurther relatively large group •(40%) only has a Diploma as highest qualification. This could be a cause of concern should such staff offer learn-ing programmes at a NQF level 4 or higher.
Table 3.12: Years practical agricultural experience lecturers at FET Colleges, March 2008
PROVINCESAGRIC EXPERIENCE OFLECTURERS (YEARS) TOTAL
PERCENTAGE EXPERIENCE OFLECTURERS TOTAL
YEARS None 1 2 34+
NONone
1 2 3 4 + %
KZN 8 0 2 0 1 11 72.7 0.0 18.2 0.0 9.1 100
MPUMALANGA 0 0 0 0 4 4 0.0 0.0 0.0 0.0 100.0 100
LIMPOPO 1 2 2 0 0 5 20.0 40.0 40.0 0.0 0.0 100
WESTERN CAPE 4 1 1 0 3 9 44.4 11.1 11.1 0.0 33.3 100
FREE STATE 0 0 6 0 0 6 0.0 0.0 100.0 0.0 0.0 100
NORTH WEST 0 2 0 0 0 2 0.0100.0 0.0 0.0 0.0 100
EATERN CAPE 1 0 1 10
333.3
0.0 33.3 33.3 0.0 100
TOTAL 14 5 12 18
4035
12.5 30.0 2.5 20.0 100
DEPA
RTMEN
T OF A
GR
ICU
LTUR
E
25
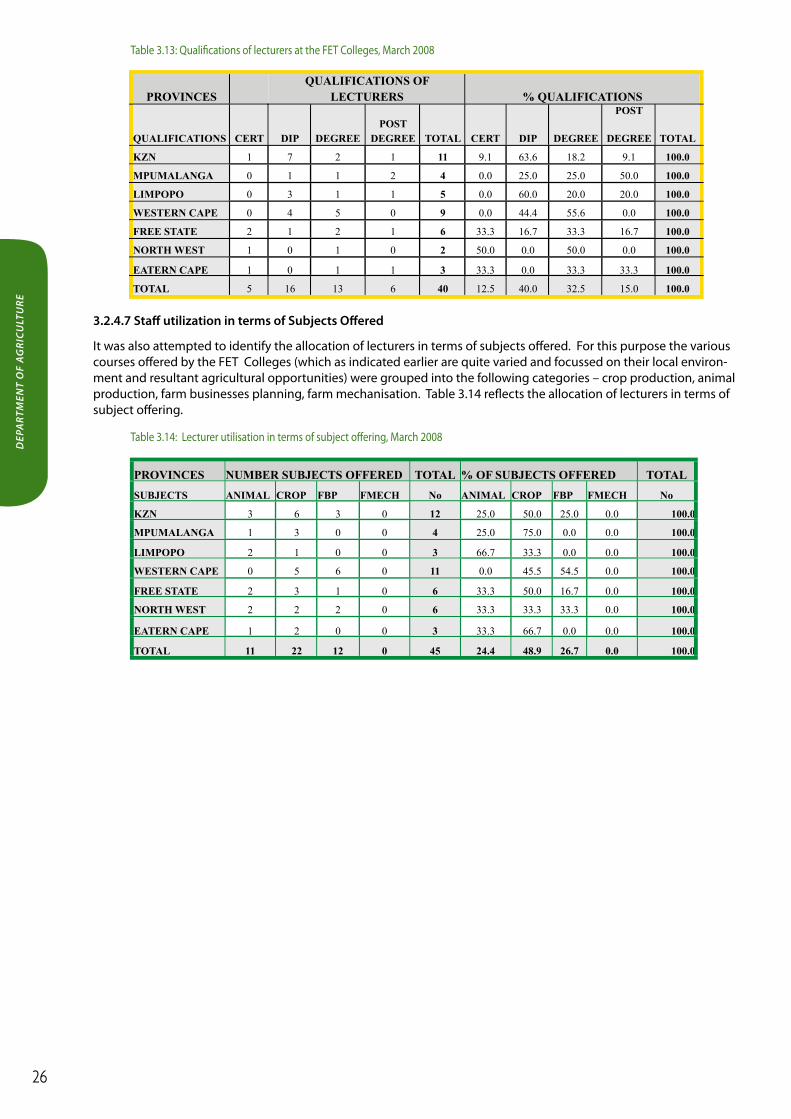
Table 3.13: Qualifications of lecturers at the FET Colleges, March 2008
Table 3.14: Lecturer utilisation in terms of subject offering, March 2008
PROVINCESQUALIFICATIONS OF
LECTURERS % QUALIFICATIONS
QUALIFICATIONS CERT DIP DEGREEPOST
DEGREE TOTAL CERT DIP DEGREE
POST
DEGREE TOTAL
KZN 1 7 2 1 11 9.1 63.6 18.2 9.1 100.0
MPUMALANGA 0 1 1 2 4 0.0 25.0 25.0 50.0 100.0
LIMPOPO 0 3 1 1 5 0.0 60.0 20.0 20.0 100.0
WESTERN CAPE 0 4 5 0 9 0.0 44.4 55.6 0.0 100.0
FREE STATE 2 1 2 1 6 33.3 16.7 33.3 16.7 100.0
NORTH WEST 1 0 1 0 2 50.0 0.0 50.0 0.0 100.0
EATERN CAPE 1 0 1 1 3 33.3 0.0 33.3 33.3 100.0
TOTAL 5 16 13 6 40 12.5 40.0 32.5 15.0 100.0
3.2.4.7 Staff utilization in terms of Subjects Offered
It was also attempted to identify the allocation of lecturers in terms of subjects offered. For this purpose the various courses offered by the FET Colleges (which as indicated earlier are quite varied and focussed on their local environ-ment and resultant agricultural opportunities) were grouped into the following categories – crop production, animal production, farm businesses planning, farm mechanisation. Table 3.14 reflects the allocation of lecturers in terms of subject offering.
PROVINCES NUMBER SUBJECTS OFFERED TOTAL % OF SUBJECTS OFFERED TOTAL
SUBJECTS ANIMAL CROP FBP FMECH No ANIMAL CROP FBP FMECH No
KZN 3 6 3 0 12 25.0 50.0 25.0 0.0 100.0
MPUMALANGA 1 3 0 0 4 25.0 75.0 0.0 0.0 100.0
LIMPOPO 2 1 0 0 3 66.7 33.3 0.0 0.0 100.0
WESTERN CAPE 0 5 6 0 11 0.0 45.5 54.5 0.0 100.0
FREE STATE 2 3 1 0 6 33.3 50.0 16.7 0.0 100.0
NORTH WEST 2 2 2 0 6 33.3 33.3 33.3 0.0 100.0
EATERN CAPE 1 2 0 0 3 33.3 66.7 0.0 0.0 100.0
TOTAL 11 22 12 0 45 24.4 48.9 26.7 0.0 100.0
DEP
ART
MEN
T O
F A
GR
ICU
LTU
RE
26
CHAPTER 4: PROFILING AGRICULTURAL LECTURERS AT THE HIGHER EDUCATION
AND TRAINING LEVEL
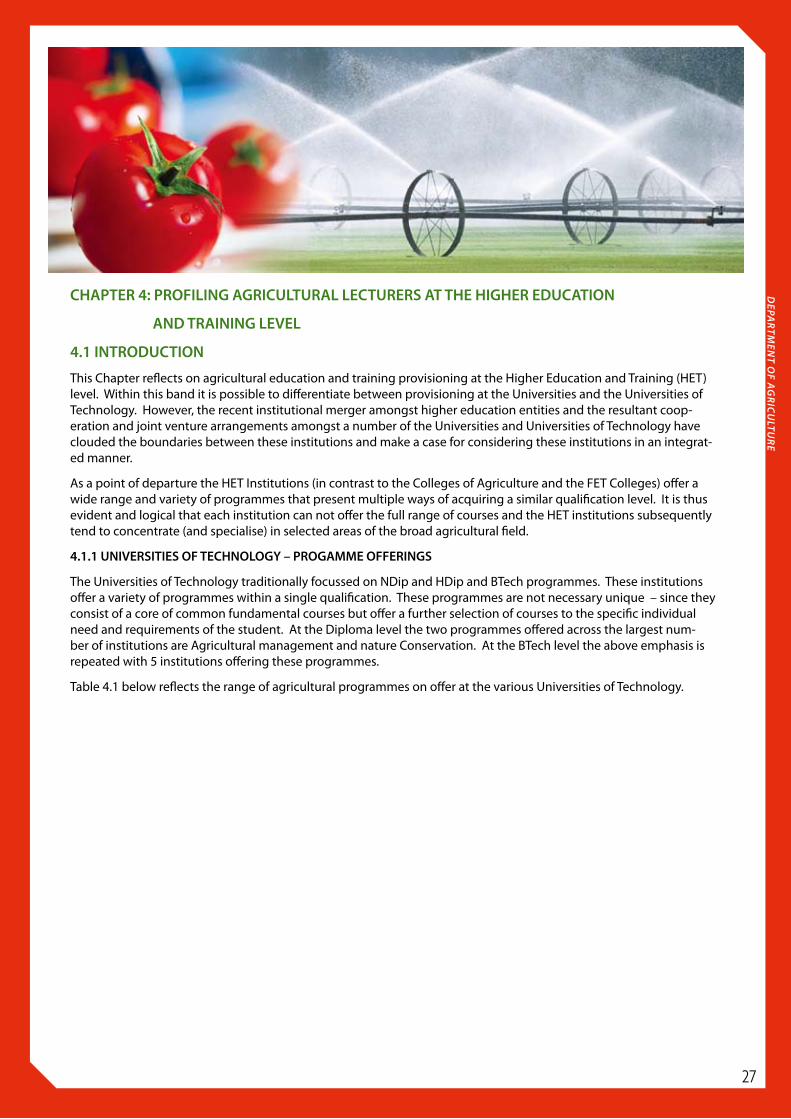
4.1 INTRODUCTION
This Chapter reflects on agricultural education and training provisioning at the Higher Education and Training (HET) level. Within this band it is possible to differentiate between provisioning at the Universities and the Universities of Technology. However, the recent institutional merger amongst higher education entities and the resultant coop-eration and joint venture arrangements amongst a number of the Universities and Universities of Technology have clouded the boundaries between these institutions and make a case for considering these institutions in an integrat-ed manner.
As a point of departure the HET Institutions (in contrast to the Colleges of Agriculture and the FET Colleges) offer a wide range and variety of programmes that present multiple ways of acquiring a similar qualification level. It is thus evident and logical that each institution can not offer the full range of courses and the HET institutions subsequently tend to concentrate (and specialise) in selected areas of the broad agricultural field.
4.1.1 UNIVERSITIES OF TECHNOLOGY – PROGAMME OFFERINGS
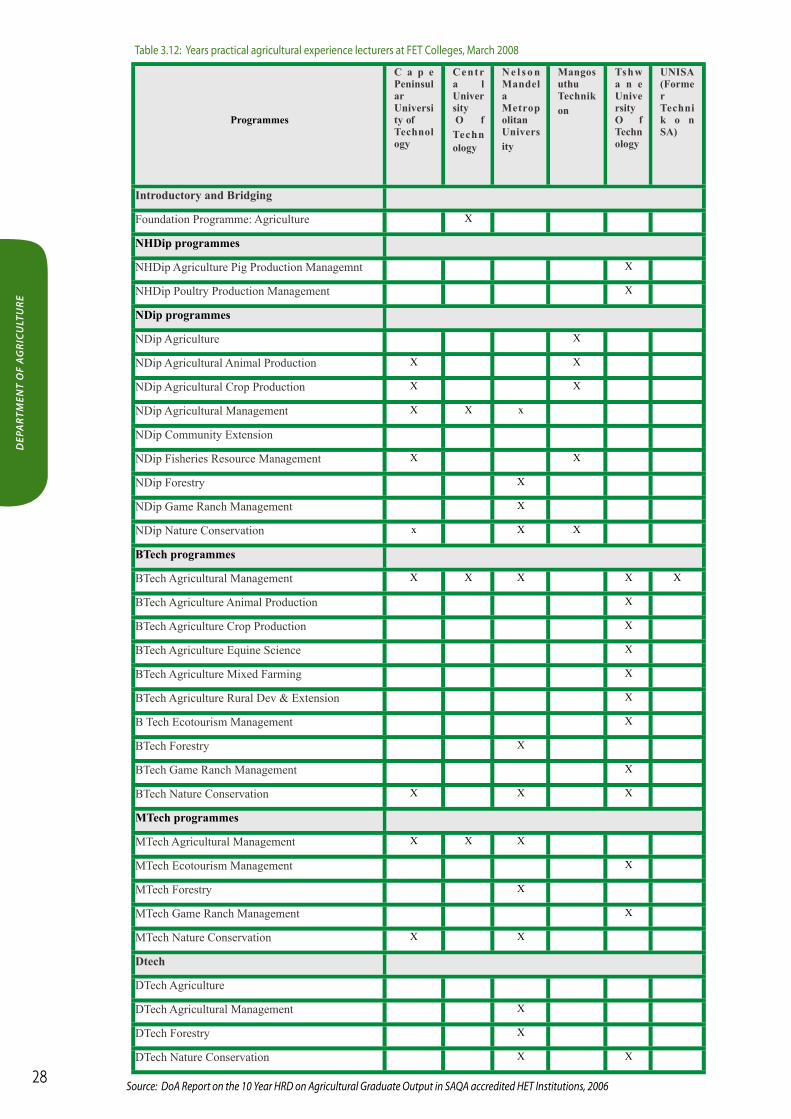
The Universities of Technology traditionally focussed on NDip and HDip and BTech programmes. These institutions offer a variety of programmes within a single qualification. These programmes are not necessary unique – since they consist of a core of common fundamental courses but offer a further selection of courses to the specific individual need and requirements of the student. At the Diploma level the two programmes offered across the largest num-ber of institutions are Agricultural management and nature Conservation. At the BTech level the above emphasis is repeated with 5 institutions offering these programmes.
Table 4.1 below reflects the range of agricultural programmes on offer at the various Universities of Technology.
DEPA
RTMEN
T OF A
GR
ICU
LTUR
E
27
Programmes
C a p e PeninsularUniversity ofTechnology
Centra l University O f Technology
N e l s o n MandelaMetropolitanUniversity
MangosuthuTechnikon
Tshwa n e UniversityO f Technology
UNISA (FormerTechnik o n SA)
Introductory and Bridging
Foundation Programme: Agriculture X
NHDip programmes
NHDip Agriculture Pig Production Managemnt X
NHDip Poultry Production Management X
NDip programmes
NDip Agriculture X
NDip Agricultural Animal Production X X
NDip Agricultural Crop Production X X
NDip Agricultural Management X X x
NDip Community Extension
NDip Fisheries Resource Management X X
NDip Forestry X
NDip Game Ranch Management X
NDip Nature Conservation x X X
BTech programmes
BTech Agricultural Management X X X X X
BTech Agriculture Animal Production X
BTech Agriculture Crop Production X
BTech Agriculture Equine Science X
BTech Agriculture Mixed Farming X
BTech Agriculture Rural Dev & Extension X
B Tech Ecotourism Management X
BTech Forestry X
BTech Game Ranch Management X
BTech Nature Conservation X X X
MTech programmes
MTech Agricultural Management X X X
MTech Ecotourism Management X
MTech Forestry X
MTech Game Ranch Management X
MTech Nature Conservation X X
Dtech
DTech Agriculture
DTech Agricultural Management X
DTech Forestry X
DTech Nature Conservation X X
Table 3.12: Years practical agricultural experience lecturers at FET Colleges, March 2008
Source: DoA Report on the 10 Year HRD on Agricultural Graduate Output in SAQA accredited HET Institutions, 2006
DEP
ART
MEN
T O
F A
GR
ICU
LTU
RE
28
Degree Programme
U n iversi t y ofFort H a re
University ofKwa Zulu N a tal
University ofNorth West
University ofPretoria
University ofStelle n bo s ch
University oft h e Free State
University oft h e North
University ofV e nda
University ofZululand
Bagric
General x x x
Management x
Agricultural Education x
Administration
Binst Agrar
x
BSc Agric
General x x x x
A g r i c u l t u r a lAdministration
x
Agricultural and Economic Analysis
x
Agricultural Economics x x
Agriculture and Rural Development
x
Agronomy x x
Animal Health x
Animal Science x x
Crop Science x
Horticulture x
Land Management x
Pasture Science x
Plant Production x
Science and Agribusiness
x
Soil Science x
Wine ProductionSystems
x
Bcom
Agricultural Economics x x
Source: DoA Report on the 10 Year HRD on Agricultural Graduate Output in SAQA accredited HET Institutions, 2006
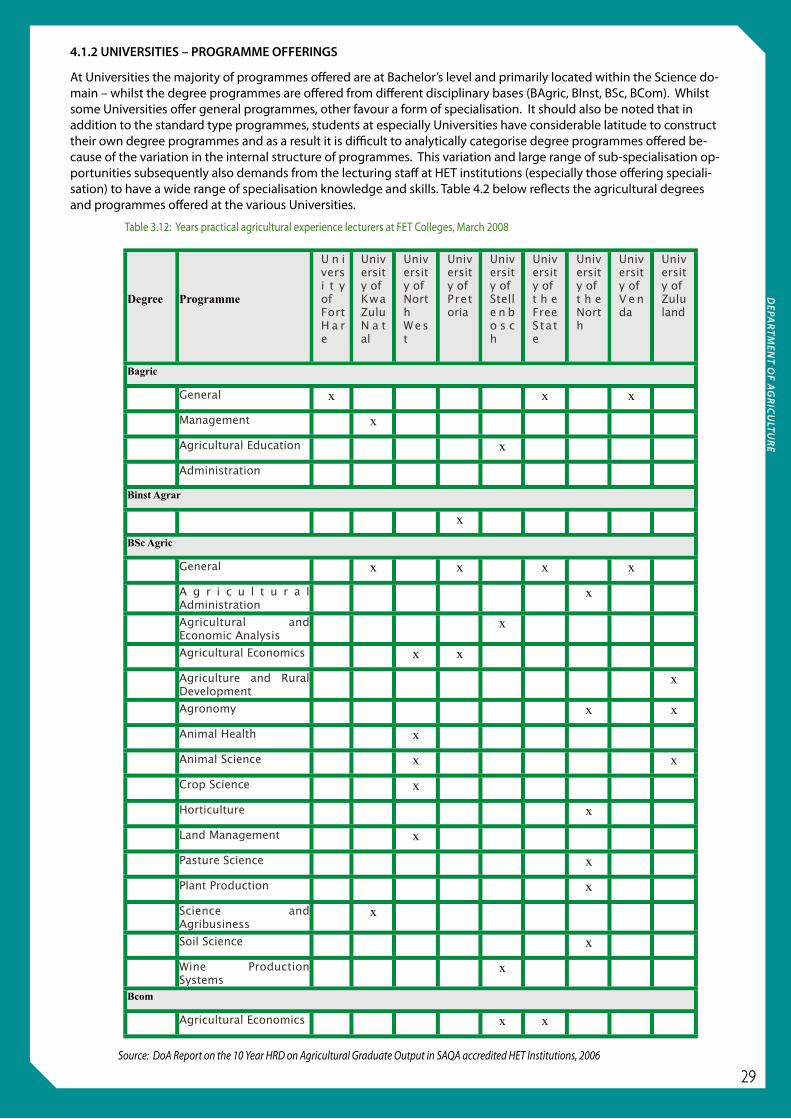
4.1.2 UNIVERSITIES – PROGRAMME OFFERINGS
At Universities the majority of programmes offered are at Bachelor’s level and primarily located within the Science do-main – whilst the degree programmes are offered from different disciplinary bases (BAgric, BInst, BSc, BCom). Whilst some Universities offer general programmes, other favour a form of specialisation. It should also be noted that in addition to the standard type programmes, students at especially Universities have considerable latitude to construct their own degree programmes and as a result it is difficult to analytically categorise degree programmes offered be-cause of the variation in the internal structure of programmes. This variation and large range of sub-specialisation op-portunities subsequently also demands from the lecturing staff at HET institutions (especially those offering speciali-sation) to have a wide range of specialisation knowledge and skills. Table 4.2 below reflects the agricultural degrees and programmes offered at the various Universities.
Table 3.12: Years practical agricultural experience lecturers at FET Colleges, March 2008
DEPA
RTMEN
T OF A
GR
ICU
LTUR
E
29
PROVINCES AGE OF LECTURERS PER PROVINCE TOTAL
AGE 20 – 30 30-40 40-50 50-60 60-70 70-80 NA NO
KZN 0 12 10 7 1 0 23 53
GAUTENG 9 36 42 43 9 0 0 139
LIMPOPO 0 0 0 0 0 0 0 0
WESTERN CAPE 4 37 30 16 3 1 0 91
FREE STATE 8 17 24 18 6 0 0 73
NORTH WEST 0 0 0 0 0 0 0 0
EASTERN CAPE 0 6 26 15 2 0 0 49
NATIONAL TOTAL 21 108 132 99 21 1 23 405
PROVINCES PERCENTAGE AGE PER PROVINCE TOTAL
AGE 20 – 30 30-40 40-50 50-60 60-70 70-80 NA %
KZN 0.0 22.6 18.87 13.2 1.9 0.0 43.4 100
GAUTENG 6.5 25.9 30.22 30.9 6.5 0.0 0.0 100
LIMPOPO 0.0 0.0 0.00 0.0 0.0 0.0 0.0 0
WESTERN CAPE 4.4 40.7 32.97 17.6 3.3 1.1 0.0 100
FREE STATE 11.0 23.3 32.88 24.7 8.2 0.0 0.0 100
NORTH WEST 0.0 0.0 0.00 0.0 0.0 0.0 0.0 0
EASTERN CAPE 0.0 12.2 53.06 30.6 4.1 0.0 0.0 100
NATIONAL TOTAL 5.2 26.7 32.59 24.4 5.2 0.2 5.7 100.0
4.2 METHODOLOGY APPLIED
Given that there are only 15 HET institutions (9 Universities and 6 Universities of Technology) that offer agricultural qualifications and programmes it was decided to obtain detailed lecturer profiling information from each institution. To this end a Profiling Template (questionnaire) was distributed to each of HET institution (via email and fax). The information fields for which data was collected are the following:
4.3 RESPONSE RATE
All institutions included in the survey were followed up extensively via telephone calls and follow-up emails and it can be reported that 15 HET institutions (7 Universities and 5 Universities of Technology) responded which is a 73.33% response rate (UNISA and Technikon SA as well as the Cape Peninsula and Cape Technikon viewed as single/merged institutions). These 15 institutions had a combined lecturer complement of 405 lecturers offering agricultural pro-grammes. This response rate is more than sufficient to provide an accurate and valid profile of the target group.
4.4 PROFILING INFORMATION AND RESULTS
The key profiling related findings and results for lecturers offering agricultural learning programmes at the HET institu-tions are as follows
4.4.1 AGE OF LECTURERS
Table 4.4 below indicates the age breakdown of lecturers in the responding HET Institutions. From the information the following age related observations are made:
As can be expected (given that lecturers at HET institutions generally hold more than one post graduate qualifica-•tion) they are as a rule older that lecturers at the other learning institutions and the majority fall in the age group 40-50 years (32%).
A combination of the “age” and “experience in lecturing” data sets reveal that within this dominant age group of •40-50 years old, 65 per cent the lecturers had 10 or more years experience in lecturing agricultural programmes and can thus be viewed as having good experience.
Table 4.3: Response rate to the survey
Table 4.4: Age of Lecturers in the FET Colleges, March 2008
DEP
ART
MEN
T O
F A
GR
ICU
LTU
RE
30
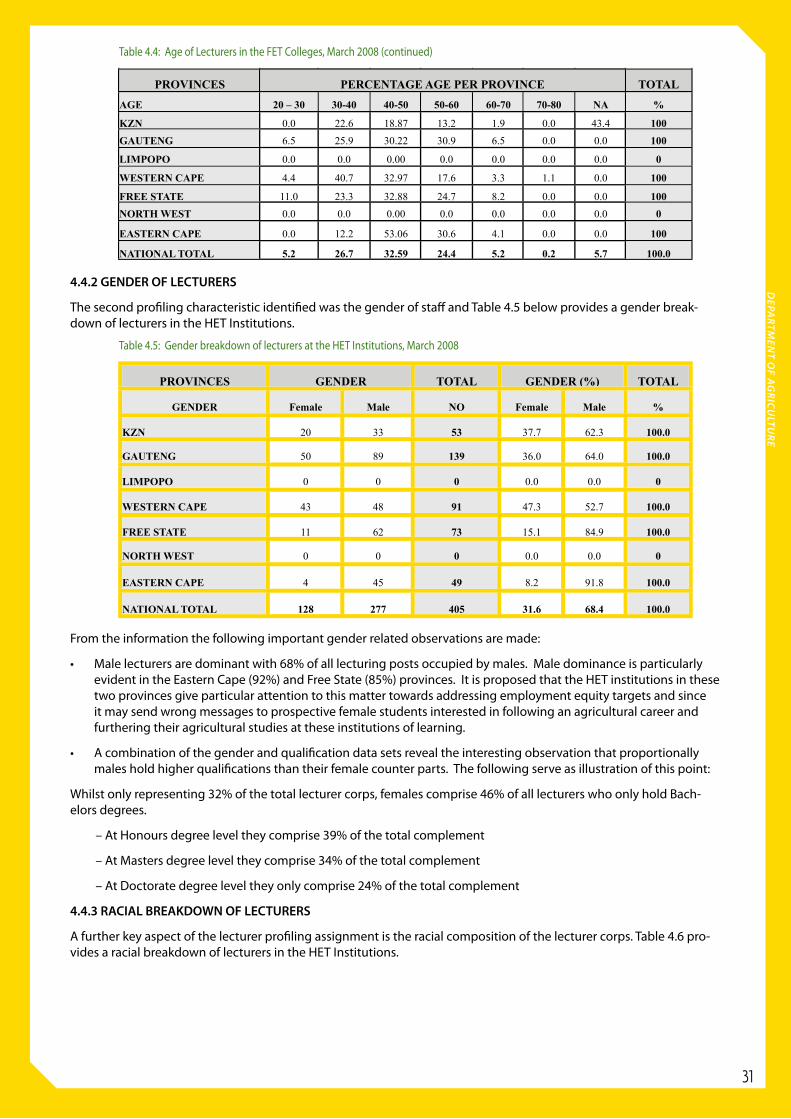
PROVINCES AGE OF LECTURERS PER PROVINCE TOTAL
AGE 20 – 30 30-40 40-50 50-60 60-70 70-80 NA NO
KZN 0 12 10 7 1 0 23 53
GAUTENG 9 36 42 43 9 0 0 139
LIMPOPO 0 0 0 0 0 0 0 0
WESTERN CAPE 4 37 30 16 3 1 0 91
FREE STATE 8 17 24 18 6 0 0 73
NORTH WEST 0 0 0 0 0 0 0 0
EASTERN CAPE 0 6 26 15 2 0 0 49
NATIONAL TOTAL 21 108 132 99 21 1 23 405
PROVINCES PERCENTAGE AGE PER PROVINCE TOTAL
AGE 20 – 30 30-40 40-50 50-60 60-70 70-80 NA %
KZN 0.0 22.6 18.87 13.2 1.9 0.0 43.4 100
GAUTENG 6.5 25.9 30.22 30.9 6.5 0.0 0.0 100
LIMPOPO 0.0 0.0 0.00 0.0 0.0 0.0 0.0 0
WESTERN CAPE 4.4 40.7 32.97 17.6 3.3 1.1 0.0 100
FREE STATE 11.0 23.3 32.88 24.7 8.2 0.0 0.0 100
NORTH WEST 0.0 0.0 0.00 0.0 0.0 0.0 0.0 0
EASTERN CAPE 0.0 12.2 53.06 30.6 4.1 0.0 0.0 100
NATIONAL TOTAL 5.2 26.7 32.59 24.4 5.2 0.2 5.7 100.0
PROVINCES GENDER TOTAL GENDER (%) TOTAL
GENDER Female Male NO Female Male %
KZN 20 33 53 37.7 62.3 100.0
GAUTENG 50 89 139 36.0 64.0 100.0
LIMPOPO 0 0 0 0.0 0.0 0
WESTERN CAPE 43 48 91 47.3 52.7 100.0
FREE STATE 11 62 73 15.1 84.9 100.0
NORTH WEST 0 0 0 0.0 0.0 0
EASTERN CAPE 4 45 49 8.2 91.8 100.0
NATIONAL TOTAL 128 277 405 31.6 68.4 100.0
Table 4.4: Age of Lecturers in the FET Colleges, March 2008 (continued)
Table 4.5: Gender breakdown of lecturers at the HET Institutions, March 2008
4.4.2 GENDER OF LECTURERS
The second profiling characteristic identified was the gender of staff and Table 4.5 below provides a gender break-down of lecturers in the HET Institutions.
From the information the following important gender related observations are made:
Male lecturers are dominant with 68% of all lecturing posts occupied by males. Male dominance is particularly •evident in the Eastern Cape (92%) and Free State (85%) provinces. It is proposed that the HET institutions in these two provinces give particular attention to this matter towards addressing employment equity targets and since it may send wrong messages to prospective female students interested in following an agricultural career and furthering their agricultural studies at these institutions of learning.
A combination of the gender and qualification data sets reveal the interesting observation that proportionally •males hold higher qualifications than their female counter parts. The following serve as illustration of this point:
Whilst only representing 32% of the total lecturer corps, females comprise 46% of all lecturers who only hold Bach-elors degrees.
– At Honours degree level they comprise 39% of the total complement
– At Masters degree level they comprise 34% of the total complement
– At Doctorate degree level they only comprise 24% of the total complement
4.4.3 RACIAL BREAKDOWN OF LECTURERS
A further key aspect of the lecturer profiling assignment is the racial composition of the lecturer corps. Table 4.6 pro-vides a racial breakdown of lecturers in the HET Institutions.
DEPA
RTMEN
T OF A
GR
ICU
LTUR
E
31
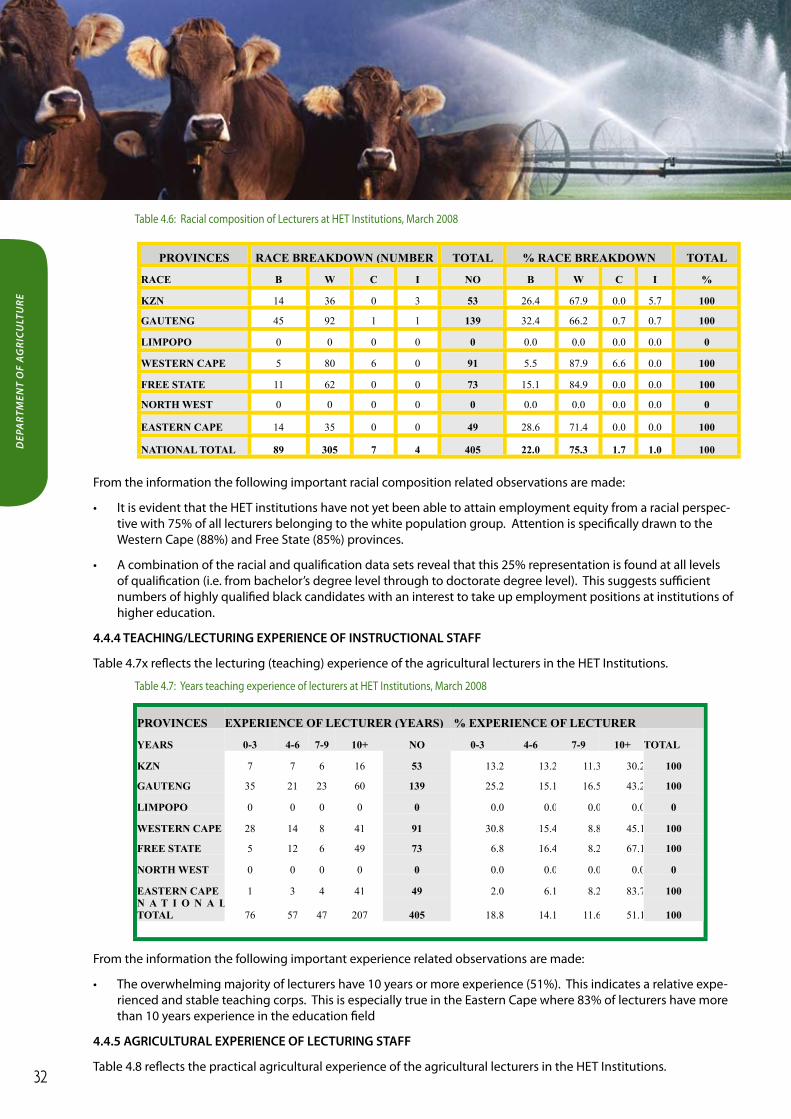
PROVINCES RACE BREAKDOWN (NUMBER TOTAL % RACE BREAKDOWN TOTAL
RACE B W C I NO B W C I %
KZN 14 36 0 3 53 26.4 67.9 0.0 5.7 100
GAUTENG 45 92 1 1 139 32.4 66.2 0.7 0.7 100
LIMPOPO 0 0 0 0 0 0.0 0.0 0.0 0.0 0
WESTERN CAPE 5 80 6 0 91 5.5 87.9 6.6 0.0 100
FREE STATE 11 62 0 0 73 15.1 84.9 0.0 0.0 100
NORTH WEST 0 0 0 0 0 0.0 0.0 0.0 0.0 0
EASTERN CAPE 14 35 0 0 49 28.6 71.4 0.0 0.0 100
NATIONAL TOTAL 89 305 7 4 405 22.0 75.3 1.7 1.0 100
Table 4.6: Racial composition of Lecturers at HET Institutions, March 2008
Table 4.7: Years teaching experience of lecturers at HET Institutions, March 2008
From the information the following important racial composition related observations are made:
It is evident that the HET institutions have not yet been able to attain employment equity from a racial perspec-•tive with 75% of all lecturers belonging to the white population group. Attention is specifically drawn to the Western Cape (88%) and Free State (85%) provinces.
A combination of the racial and qualification data sets reveal that this 25% representation is found at all levels •of qualification (i.e. from bachelor’s degree level through to doctorate degree level). This suggests sufficient numbers of highly qualified black candidates with an interest to take up employment positions at institutions of higher education.
4.4.4 TEACHING/LECTURING EXPERIENCE OF INSTRUCTIONAL STAFF
Table 4.7x reflects the lecturing (teaching) experience of the agricultural lecturers in the HET Institutions.
From the information the following important experience related observations are made:
The overwhelming majority of lecturers have 10 years or more experience (51%). This indicates a relative expe-•rienced and stable teaching corps. This is especially true in the Eastern Cape where 83% of lecturers have more than 10 years experience in the education field
4.4.5 AGRICULTURAL EXPERIENCE OF LECTURING STAFF
Table 4.8 reflects the practical agricultural experience of the agricultural lecturers in the HET Institutions.
PROVINCES EXPERIENCE OF LECTURER (YEARS) % EXPERIENCE OF LECTURER
YEARS 0-3 4-6 7-9 10+ NO 0-3 4-6 7-9 10+ TOTAL
KZN 7 7 6 16 53 13.2 13.2 11.3 30.2 100
GAUTENG 35 21 23 60 139 25.2 15.1 16.5 43.2 100
LIMPOPO 0 0 0 0 0 0.0 0.0 0.0 0.0 0
WESTERN CAPE 28 14 8 41 91 30.8 15.4 8.8 45.1 100
FREE STATE 5 12 6 49 73 6.8 16.4 8.2 67.1 100
NORTH WEST 0 0 0 0 0 0.0 0.0 0.0 0.0 0
EASTERN CAPE 1 3 4 41 49 2.0 6.1 8.2 83.7 100N A T I O N A LTOTAL 76 57 47 207 405 18.8 14.1 11.6 51.1 100
32
DEP
ART
MEN
T O
F A
GR
ICU
LTU
RE
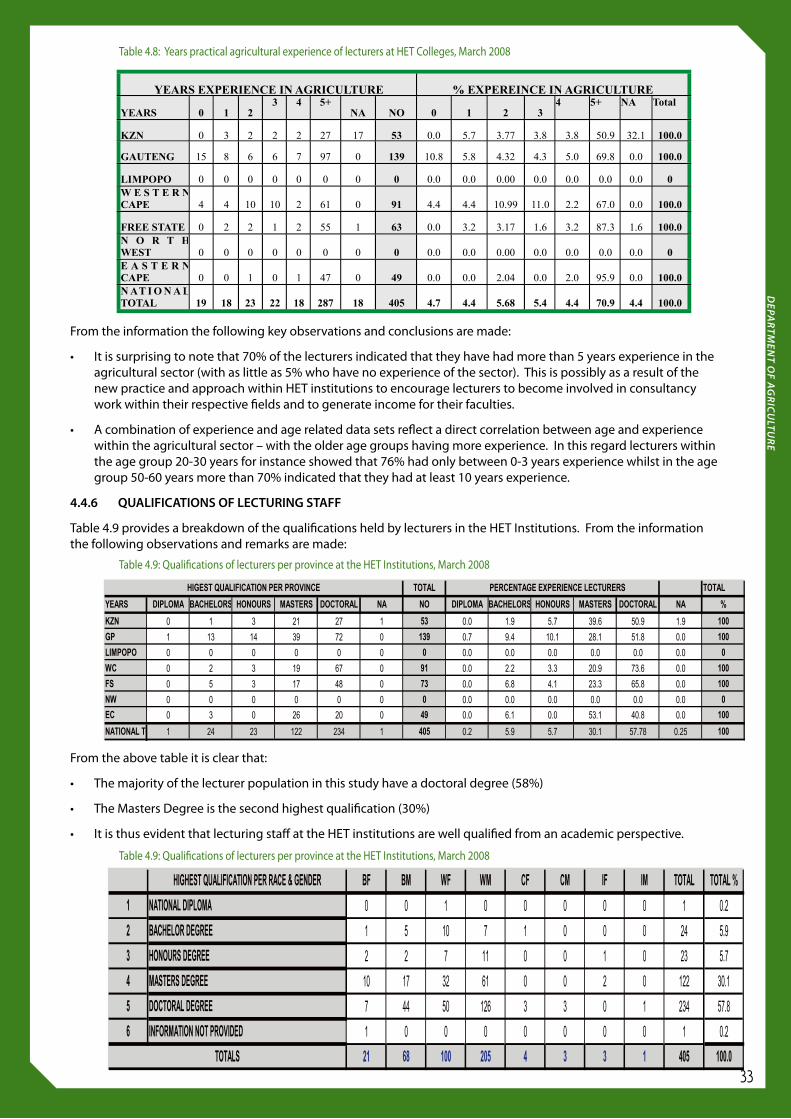
Table 4.8: Years practical agricultural experience of lecturers at HET Colleges, March 2008
Table 4.9: Qualifications of lecturers per province at the HET Institutions, March 2008
Table 4.9: Qualifications of lecturers per province at the HET Institutions, March 2008
YEARS EXPERIENCE IN AGRICULTURE % EXPEREINCE IN AGRICULTURE
YEARS 0 1 23 4 5+
NA NO 0 1 2 34 5+ NA Total
KZN 0 3 2 2 2 27 17 53 0.0 5.7 3.77 3.8 3.8 50.9 32.1 100.0
GAUTENG 15 8 6 6 7 97 0 139 10.8 5.8 4.32 4.3 5.0 69.8 0.0 100.0
LIMPOPO 0 0 0 0 0 0 0 0 0.0 0.0 0.00 0.0 0.0 0.0 0.0 0W E S T E R NCAPE 4 4 10 10 2 61 0 91 4.4 4.4 10.99 11.0 2.2 67.0 0.0 100.0
FREE STATE 0 2 2 1 2 55 1 63 0.0 3.2 3.17 1.6 3.2 87.3 1.6 100.0N O R T HWEST 0 0 0 0 0 0 0 0 0.0 0.0 0.00 0.0 0.0 0.0 0.0 0E A S T E R NCAPE 0 0 1 0 1 47 0 49 0.0 0.0 2.04 0.0 2.0 95.9 0.0 100.0N AT I O N A LTOTAL 19 18 23 22 18 287 18 405 4.7 4.4 5.68 5.4 4.4 70.9 4.4 100.0
From the information the following key observations and conclusions are made:
It is surprising to note that 70% of the lecturers indicated that they have had more than 5 years experience in the •agricultural sector (with as little as 5% who have no experience of the sector). This is possibly as a result of the new practice and approach within HET institutions to encourage lecturers to become involved in consultancy work within their respective fields and to generate income for their faculties.
A combination of experience and age related data sets reflect a direct correlation between age and experience •within the agricultural sector – with the older age groups having more experience. In this regard lecturers within the age group 20-30 years for instance showed that 76% had only between 0-3 years experience whilst in the age group 50-60 years more than 70% indicated that they had at least 10 years experience.
4.4.6 QUALIFICATIONS OF LECTURING STAFF
Table 4.9 provides a breakdown of the qualifications held by lecturers in the HET Institutions. From the information the following observations and remarks are made:
From the above table it is clear that:
The majority of the lecturer population in this study have a doctoral degree (58%)•
The Masters Degree is the second highest qualification (30%)•
It is thus evident that lecturing staff at the HET institutions are well qualified from an academic perspective.•
33
DEPA
RTMEN
T OF A
GR
ICU
LTUR
E

With regards to Race and Gender breakdown of the lecturer qualification, the following is clear:
The highest overall qualification per race and gender is represented by white males (51%)•
followed by white females (25%)
The highest qualification: white males represent 31% of all the doctoral degrees followed by white females at 12% •and by black males at 11%
Indian males are the least represented within the total lecturer population at 0.25% and consists of 1 Doctoral •Degree.
4.4.7 STAFF UTILIZATION IN TERMS OF SUBJECTS OFFERED
It was also attempted to identify the allocation of lecturers in terms of subjects offered. From Table 4.11 is evident that the programmes/courses offered by the HET Institutions are quite varied and with various specialisation fields).
Information in the above table indicates the following:
A total of 34 subjects were identified from the questionnaires received from the HET institutions that responded•
Subjects offered are taught by predominantly white males and females (309), followed by black males and fe-•males (86)
Subjects offered by most lecturers are Soil, Crop and Climate science (55%) followed by Agricultural Management •(10%) and Agricultural Economics, Extension and Rural Development (9%)
Table 4.11: Lecturer utilisation in terms of subject offering at HET Institutions, March 2008
DEP
ART
MEN
T O
F A
GR
ICU
LTU
RE
34
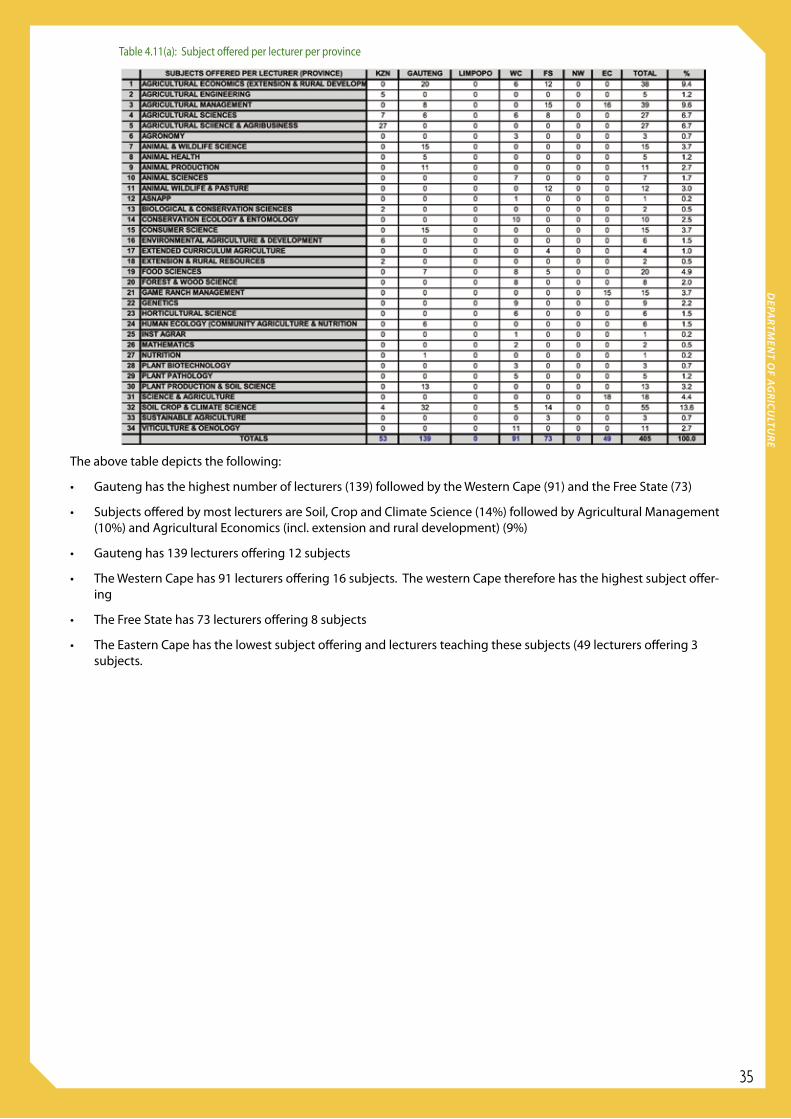
Table 4.11(a): Subject offered per lecturer per province
The above table depicts the following:
Gauteng has the highest number of lecturers (139) followed by the Western Cape (91) and the Free State (73)•
Subjects offered by most lecturers are Soil, Crop and Climate Science (14%) followed by Agricultural Management •(10%) and Agricultural Economics (incl. extension and rural development) (9%)
Gauteng has 139 lecturers offering 12 subjects•
The Western Cape has 91 lecturers offering 16 subjects. The western Cape therefore has the highest subject offer-•ing
The Free State has 73 lecturers offering 8 subjects•
The Eastern Cape has the lowest subject offering and lecturers teaching these subjects (49 lecturers offering 3 •subjects.
DEPA
RTMEN
T OF A
GR
ICU
LTUR
E
35
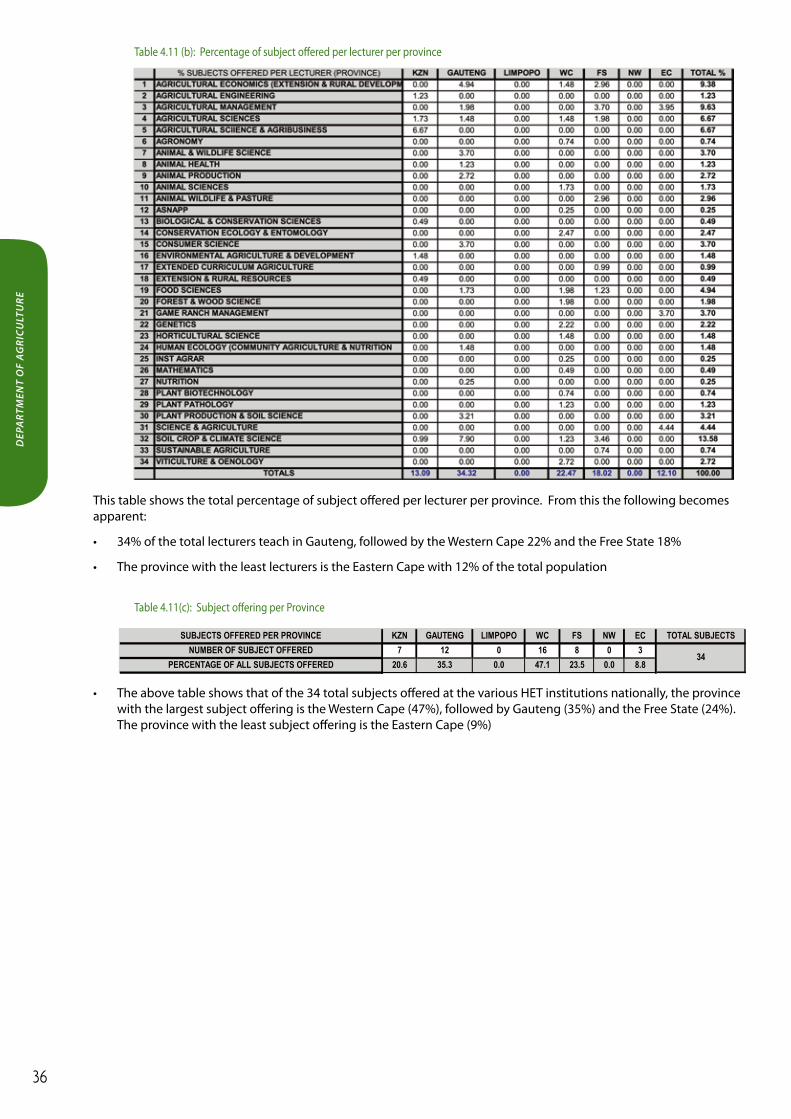
Table 4.11 (b): Percentage of subject offered per lecturer per province
Table 4.11(c): Subject offering per Province
This table shows the total percentage of subject offered per lecturer per province. From this the following becomes apparent:
34% of the total lecturers teach in Gauteng, followed by the Western Cape 22% and the Free State 18%•
The province with the least lecturers is the Eastern Cape with 12% of the total population•
The above table shows that of the 34 total subjects offered at the various HET institutions nationally, the province •with the largest subject offering is the Western Cape (47%), followed by Gauteng (35%) and the Free State (24%). The province with the least subject offering is the Eastern Cape (9%)
DEP
ART
MEN
T O
F A
GR
ICU
LTU
RE
36
CHAPTER 5: CONCLUSIONS RE AREAS OF CONCERNThis section of the report provides a summary of the most salient issues identified during the profiling study. Focus is placed on shortfalls and constraints identified and which requires attention.
5.1 PROFILING ISSUES RELATED TO TEACHERS AT ACADEMIC SCHOOLS
Whilst the necessary information required for undertaking a detailed profiling of teachers at academic schools were not forthcoming from the DoE EMIS database, the following important observations could nevertheless be made from the other information gathered:
5.1.1 A considerable proportion of teachers offering the subject Agricultural Science at mainstream academic schools do not have sufficient qualifications or training to competently deliver the subject (at least 25% of the sample group were under-qualified).
5.1.2 Very few teachers have had practical agricultural experience and exposure (especially in a commercial environ-ment). They thus lack practical knowledge and the context within which the subject is offered.
5.1.3 Teachers generally lack entrepreneurship knowledge and skills within an agricultural context and thus have shortfalls to teach farming as a business.
5.2 PROFILING ISSUES RE TEACHERS IN AGRICULTURAL HIGH SCHOOLS
The following key profiling observations are based on the responses received from the 32 Agricultural High Schools (106 teachers) that participated in the profiling survey.
5.2.1 Gender: Male lecturers are dominant with 80% of all posts occupied by males. It is proposed that the schools give attention to this matter towards addressing employment equity targets and since it may send wrong messages to prospective female students interested in following an agricultural career.
5.2.2 Race: It is evident that the agricultural high schools have made little progress towards attaining employment equity from a racial perspective with 69% of all lecturers falling in the white population group. White lecturers are particularly dominant in the Western Cape (100%) and Northern Cape (87%). This issue demands urgent attention.
5.2.3 Experience: The overwhelming majority of lecturers have had no practical agricultural working experience (70%) and their knowledge of the subject is thus of an academic nature only. From a planning and development perspec-tive specific opportunities and means need to be created for the large group of inexperienced teachers to expose them to practical farming practice in their respective fields of study.
5.2.4 Qualifications: It can generally be concluded that the formal qualifications of the agricultural teacher corps in the agricultural high schools are relatively high when compared to the teaching fraternity in South Africa (with 60% of the group holding either degrees or post degree qualifications).
5.2 PROFILING ISSUES RE LECTURERS AT AGRICULTURAL COLLEGES
The following key profiling observations are based on the responses received from the 10 Agricultural Colleges (174 lecturers) that participated in the profiling survey.
5.2.1 Age: Generally speaking the lecturers are quite young (30% under the age of 30 years) and raises a question re-garding their ability to transfer knowledge and skills to the students. This becomes particularly evident when consid-ering that 85% of all lecturers have had little or no practical experience within a commercial farming context.
5.2.2 Race: It is evident that the colleges have been able to attain employment equity from a racial perspective with 67% of all lecturers falling in the black population group. Black lecturers are particularly dominant in the North West and East Cape provinces where only black lecturers are employed (100%). In contrast the Northern Cape and KZN provinces still have a dominant white staffing profile with white lecturers respectively making up 90% and 66% of the lecturing complement. From a planning and succession perspective it is important to note that a linking of the race and agricultural experience data reflect that practical agricultural experience is primarily seated amongst white lecturers. Specific attention thus needs to be given to means of providing black lecturers with the opportunity to gain practical agricultural experience.
DEPA
RTMEN
T OF A
GR
ICU
LTUR
E
37
5.2.3 Experience: The overwhelming majority of lecturers (48%) have less than 3 years lecturing experience. This indicates a high turnover in staff which requires attention. Regarding practical agricultural experience the situation is bleak with many having now practical experience (50% falling in the category 0-3 years experience.)
5.2.4 Qualifications: Lecturers are generally well qualified with 29% holding post graduate degrees and a further 44% having been qualified to degree level. It must however also be noted that 24% of the lecturers only hold quali-fications at a Diploma level and a further 3% at a Certificate level. Good academic practice prescribes that lecturers should only offer learning programmes (especially programmes leading up to qualifications) at a NQF level that is lower than their own qualifications. This implies that this group of lecturers should confine themselves to offering skills programmes of a NQF level 4 and lower.
5.3 PROFILING ISSUES RE LECTURERS AT OTHER FET COLLEGES
The following key profiling observations are based on the responses received from the 12 FET Colleges (40 lecturers) that participated in the profiling survey.
5.3.1 Age: Generally speaking the lecturers are quite young (33% under the age of 30 years) and raises a question regarding their ability to transfer knowledge and skills to the students. This is especially true in the East Cape and Limpopo Provinces where respectively 66% and 60% of al lecturers are under the age of 30 years.
5.3.2 Gender: Male lecturers are dominant with 75% of all posts occupied by males. This is particularly evident in the Eastern Cape, Free State , Limpopo and Mpumalanga Provinces where 100% of the respondents were male.
5.3.3 Race: It is evident that the FET colleges have been able to attain employment equity from a racial perspective with 75% of all lecturers falling in the black population group. Black lecturers fill all posts in 5 of the provinces. The only exception is the Western Cape where no posts are held by black lecturers.
5.3.4 Experience: Whilst 42% of the lecturers have 10 or more years teaching experience, the overwhelming major-ity of lecturers have had little practical agricultural experience (35% have no experience). This is especially high in KZN where 73% of the lecturers have indicated that they have never worked in the farming sector prior to becoming lecturers.
5.3.5 Qualifications: It is interesting to note that the qualifications of lecturers at the FET Colleges are lower than those employed by the Agricultural Colleges. At the FET Colleges only 47% of the lecturers hold degree and/or post degree qualifications (as opposed to 63% at the Agricultural Colleges). FET colleges further employ some lecturers with Certificate qualifications only (12%) and a further relatively large group (40%) only has a Diploma as highest qualification. This could be a cause of concern should such staff offer learning programmes at a NQF level 4 or higher.
5.4 PROFILING ISSUES RELATED TO LECURERS AT HET INSTITUTIONS
The following key profiling observations are based on the responses received from the 15 HET Institutions (9 Universi-ties and 5 Universities of Technology with a combined total of 405 lecturers) that participated in the profiling survey.
5.4.1 Age: As can be expected (given that lecturers at HET institutions generally hold more than one post graduate qualification) they are as a rule older that lecturers at the other learning institutions and the majority fall in the age group 40-50 years (32%). A combination of the “age” and “experience in lecturing” data sets reveal that within this dominant age group of 40-50 years old, 65 per cent the lecturers had 10 or more years experience in lecturing agricul-tural programmes and can thus be viewed as having good experience.
5.4.2 Gender: Male lecturers are dominant with 68% of all lecturing posts occupied by males. Male dominance is particularly evident in the Eastern Cape (92%) and Free State (85%) provinces. It is proposed that the HET institutions in these two provinces give particular attention to this matter towards addressing employment equity targets and since it may send wrong messages to prospective female students interested in following an agricultural career and furthering their agricultural studies at these institutions of learning.
5.4.3 Race: It is evident that the HET institutions have not yet been able to attain employment equity from a racial perspective with 75% of all lecturers belonging to the white population group. Attention is specifically drawn to the Western Cape (88%) and Free State (85%) provinces. A combination of the racial and qualification data sets reveal that this 25% representation is found at all levels of qualifications (i.e. from bachelor’s degree level through to doctor-
DEP
ART
MEN
T O
F A
GR
ICU
LTU
RE
38

ate degree level). This suggests sufficient numbers of highly qualified black candidates with an interest to take up employment positions at institutions of higher education.
5.4.4 Experience: Lecturers at the HET institutions generally have good teaching experience with more than 50% indi-cating 10 or more lecturing experience. It was also surprising to note that 70% of the HET lecturers indicated at least 5 years experience of a practical nature in the agricultural sector.
5.4.5 Qualifications: As could be expected the qualifications of HET staff are good and they are well qualified (58% hold Doctorate degrees and 30% Masters degrees).
DEPA
RTMEN
T OF A
GR
ICU
LTUR
E
39
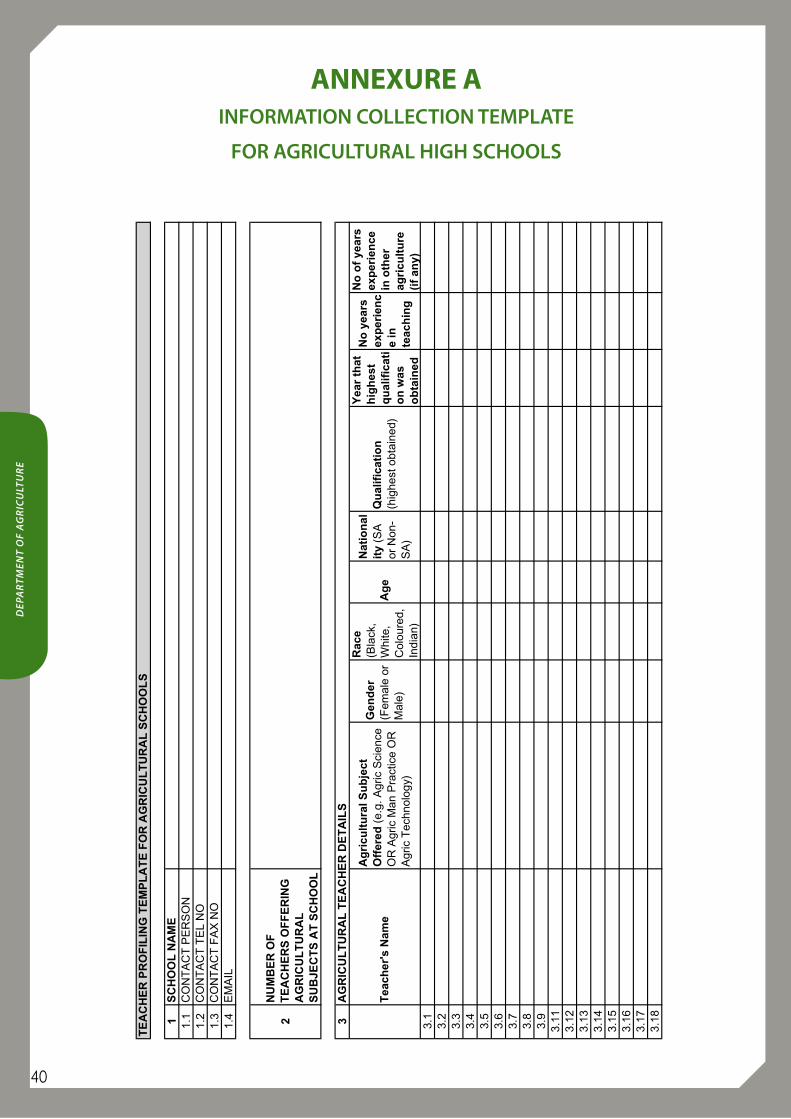
1S
CH
OO
L N
AM
E1.
1C
ON
TA
CT
PE
RS
ON
1.2
CO
NT
AC
T T
EL
NO
1.3
CO
NT
AC
T F
AX
NO
1.4
EM
AIL
2N
UM
BE
R O
F
TE
AC
HE
RS
OF
FE
RIN
G
AG
RIC
UL
TU
RA
LS
UB
JEC
TS
AT
SC
HO
OL
3 3.1
3.2
3.3
3.4
3.5
3.6
3.7
3.8
3.9
3.11
3.12
3.13
3.14
3.15
3.16
3.17
3.18
Gen
der
(Fem
ale
or
Mal
e)
Rac
e(B
lack
,W
hite
,C
olou
red,
Indi
an)
Tea
cher
's N
ame
Ag
ricu
ltu
ral S
ub
ject
O
ffer
ed(e
.g. A
gric
Sci
ence
O
R A
gric
Man
Pra
ctic
e O
R
Agr
ic T
echn
olog
y)
Ag
e
Nat
ion
alit
y (S
A
or N
on-
SA
)
Qu
alif
icat
ion
(hig
hest
obt
aine
d)
Yea
r th
at
hig
hes
tq
ual
ific
ati
on
was
o
bta
ined
No
yea
rs
exp
erie
nc
e in
te
ach
ing
No
of
year
s ex
per
ien
cein
oth
er
agri
cult
ure
(if
any)
AG
RIC
UL
TU
RA
L T
EA
CH
ER
DE
TA
ILS
TE
AC
HE
R P
RO
FIL
ING
TE
MP
LA
TE
FO
R A
GR
ICU
LT
UR
AL
SC
HO
OL
S
DEP
ART
MEN
T O
F A
GR
ICU
LTU
RE
ANNEXURE AINFORMATION COLLECTION TEMPLATE
FOR AGRICULTURAL HIGH SCHOOLS
40
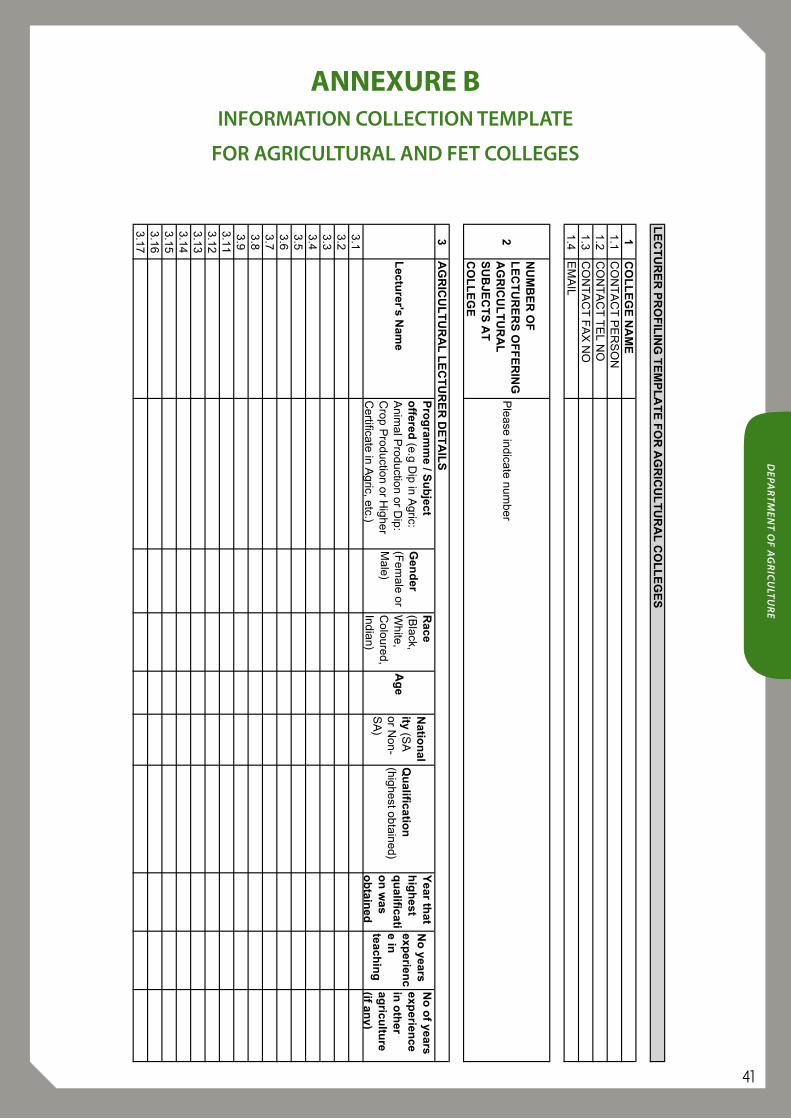
DEPA
RTMEN
T OF A
GR
ICU
LTUR
E
ANNEXURE BINFORMATION COLLECTION TEMPLATE
FOR AGRICULTURAL AND FET COLLEGES
41
1C
OL
LE
GE
NA
ME
1.1C
ON
TA
CT
PE
RS
ON
1.2C
ON
TA
CT
TE
L NO
1.3C
ON
TA
CT
FA
X N
O1.4
EM
AIL
2
NU
MB
ER
OF
L
EC
TU
RE
RS
OF
FE
RIN
G
AG
RIC
UL
TU
RA
LS
UB
JEC
TS
AT
C
OL
LE
GE
33.13.23.33.43.53.63.73.83.93.113.123.133.143.153.163.17
No
years exp
erienc
e in
teachin
g
No
of years
experien
cein
oth
er ag
ricultu
re(if an
y)
AG
RIC
UL
TU
RA
L L
EC
TU
RE
R D
ET
AIL
S
Please indicate num
ber
Gen
der
(Fem
ale or M
ale)
Race
(Black,
White,
Coloured,
Indian)
Lectu
rer's Nam
e
Pro
gram
me / S
ub
ject o
ffered(e.g D
ip in Agric:
Anim
al Production or D
ip: C
rop Production or H
igher C
ertificate in Ag ric, etc.)
LE
CT
UR
ER
PR
OF
ILIN
G T
EM
PL
AT
E F
OR
AG
RIC
UL
TU
RA
L C
OL
LE
GE
S
Ag
e
Natio
nal
ity (SA
or N
on-S
A)
Qu
alification
(highest obtained)
Year th
at h
igh
estq
ualificati
on
was
ob
tained
42
43
Department of Agriculture