prof. dr. jürgen scheffran & prof. dr. udo schickhoff · climate and environmental change...
TRANSCRIPT
Prof. Dr. Jürgen Scheffran & Prof. Dr. Udo Schickhoffincluding slides provided by Prof. Dr. Jürgen Böhner
CLIMATE AND ENVIRONMENTAL CHANGEM.Sc. Module ‚Global Transformation and Environmental Change‘
Prof. Dr. Jürgen Scheffran
Abteilung Integrative Geographie, Universität HamburgResearch Group Climate Change and SecurityGrindelberg 7, Room 2014 (Sprechstunde nach Vereinbarung)
Tel: 040 – 42838 7722Email: [email protected]: www.clisec-hamburg.de (Courses)User name: Course No: 63-181, Password: Climate2015
Part A: Climate and Environment – Jürgen Scheffran
I Introduction
II The Climate System
III Climate Change
IV Environmental Change
Part B: Human Impact on World Vegetation – Udo Schickhoff
Final Exam
CLIMATE AND ENVIRONMENTAL CHANGEM.Sc. Module ‚Global Transformation and Environmental Change‘
CLIMATE AND ENVIRONMENTAL CHANGEM.Sc. Module ‚Global Transformation and Environmental Change‘
Literature:
Barry, R.G.; Chorley, R.J. (2003) Atmosphere, weather, and climate, Routledge.
Schönwiese, Christian-Dietrich (2013) Klimatologie, 4.th edition, UTB.
IPCC (2013) Climate Change 2013: The Physical Science Basis, Contribution of WG Ito the Fifth Assessment Report of the Intergovernmental Panel on Climate Change, WGIAR5 4th Assessment Report.
Gebhardt, H., Glaser, R., Radtke, U., Reuber, P. (eds.) (2012) Geographie - PhysischeGeographie und Humangeographie, Berlin: Springer.
IPCC (2007) Climate Change 2007 – The Physical Science Basis, Contribution of WGI to the Fourth Assessment Report of the Intergovernmental Panel on Climate Change.Cambridge University Press, UK und NY, USA.
Oke, T.R. (1987): Boundary Layer Climates. – Wiley & Sons, New York.
McKnight, T.L. & D. Hess (2008): Physical Geography. – Pearson. London
Hess, D. & T.L. McKnight (2009): Physische Geographie. – Pearson. London.

Aims of the lecture
Knowledge of the fundamentals of climate system dynamics and factorsaffecting climate change in present, past and future;
Insights in climate and human-induced environmental changes andpressures on environmental resources, ecosystem functions and serviceswith a particular focus on human impact on world vegetation
CLIMATE AND ENVIRONMENTAL CHANGEM.Sc. Module ‚Global Transformation and Environmental Change‘
Content
CLIMATE AND ENVIRONMENTAL CHANGEM.Sc. Module ‚Global Transformation and Environmental Change‘
Introduction into basic physical processes causing fluctuationsin the Earth's climate
Evolution of the Earth’s climate system and the climate historyClimate-determined process domains and environments Impact of climate change on environmental resources (soil, water,
vegetation) Interdependencies of climate and human induced degradation
processes and deterioration of ecosystem functions and serviceswith a particular focus on human impact on world vegetation
Scenario-based projections of future climate and environmentalchange; climate change adaptation and mitigation strategies.

CLIMATE AND ENVIRONMENTAL CHANGEM.Sc. Module ‚Global Transformation and Environmental Change‘
-0.6
-0.4
-0.2
0.0
0.2
0.4
0.6
0.8
1.0
1860 1880 1900 1920 1940 1960 1980 2000
Tem
pera
ture
anom
alie
s [°
C]
observation (global mean)
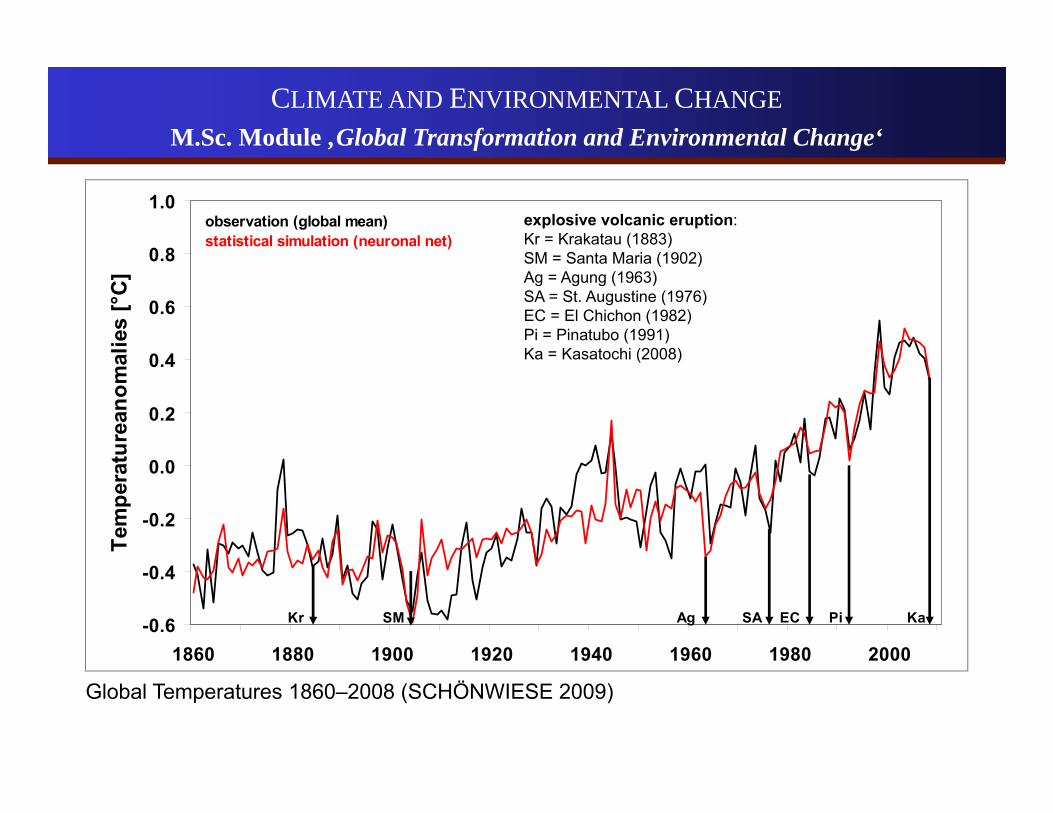
Global Temperatures 1860–2008 (SCHÖNWIESE 2009)

CLIMATE AND ENVIRONMENTAL CHANGEM.Sc. Module ‚Global Transformation and Environmental Change‘
-0.6
-0.4
-0.2
0.0
0.2
0.4
0.6
0.8
1.0
1860 1880 1900 1920 1940 1960 1980 2000
Tem
pera
ture
anom
alie
s [°
C]
observation (global mean) statistical simulation (neuronal net)
Global Temperatures 1860–2008 (SCHÖNWIESE 2009)
CLIMATE AND ENVIRONMENTAL CHANGEM.Sc. Module ‚Global Transformation and Environmental Change‘
-0.6
-0.4
-0.2
0.0
0.2
0.4
0.6
0.8
1.0
1860 1880 1900 1920 1940 1960 1980 2000
Tem
pera
ture
anom
alie
s [°
C]
Kr SM Ag SA EC Pi Ka
observation (global mean) statistical simulation (neuronal net)
explosive volcanic eruption:Kr = Krakatau (1883)SM = Santa Maria (1902)Ag = Agung (1963)SA = St. Augustine (1976)EC = El Chichon (1982)Pi = Pinatubo (1991)Ka = Kasatochi (2008)
Global Temperatures 1860–2008 (SCHÖNWIESE 2009)
CLIMATE AND ENVIRONMENTAL CHANGEM.Sc. Module ‚Global Transformation and Environmental Change‘
-0.6
-0.4
-0.2
0.0
0.2
0.4
0.6
0.8
1.0
1860 1880 1900 1920 1940 1960 1980 2000
Tem
pera
ture
anom
alie
s [°
C]
Kr SM Ag SA EC Pi Ka
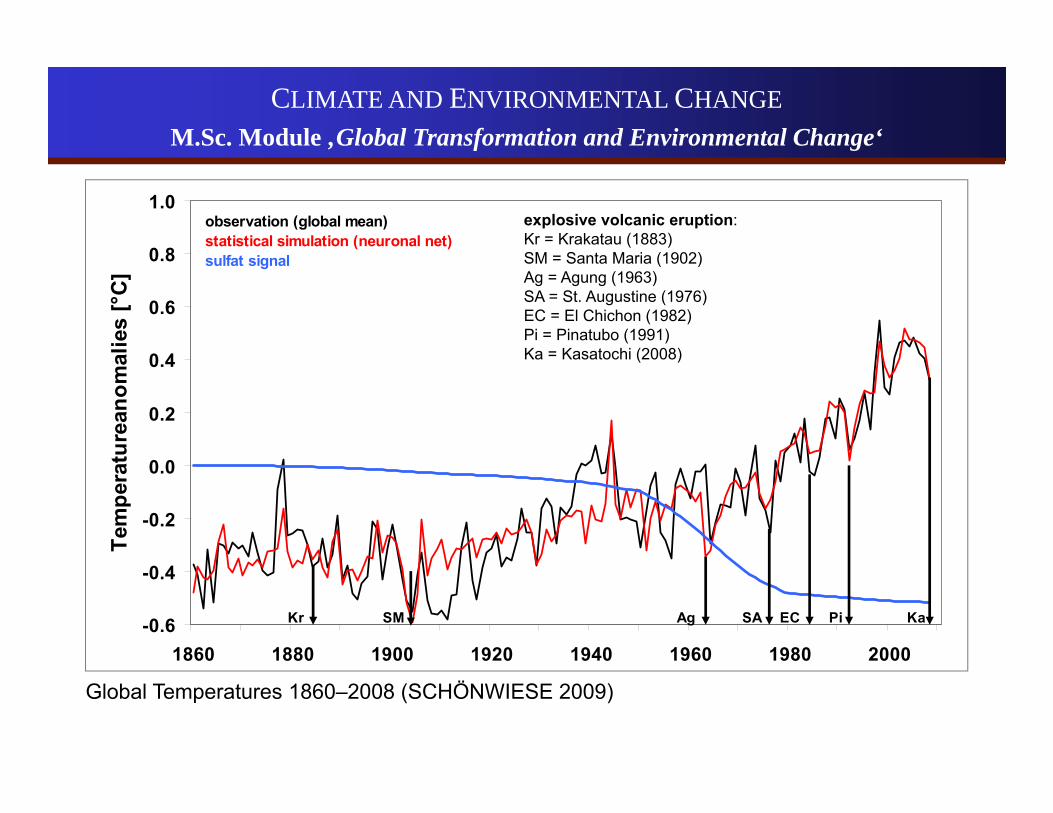
observation (global mean) statistical simulation (neuronal net)sulfat signal
explosive volcanic eruption:Kr = Krakatau (1883)SM = Santa Maria (1902)Ag = Agung (1963)SA = St. Augustine (1976)EC = El Chichon (1982)Pi = Pinatubo (1991)Ka = Kasatochi (2008)
Global Temperatures 1860–2008 (SCHÖNWIESE 2009)

CLIMATE AND ENVIRONMENTAL CHANGEM.Sc. Module ‚Global Transformation and Environmental Change‘
-0.6
-0.4
-0.2
0.0
0.2
0.4
0.6
0.8
1.0
1860 1880 1900 1920 1940 1960 1980 2000
Tem
pera
ture
anom
alie
s [°
C]
Kr SM Ag SA EC Pi Ka
● ●●
●
●
●●
observation (global mean) statistical simulation (neuronal net)sulfat signal
explosive volcanic eruption:Kr = Krakatau (1883)SM = Santa Maria (1902)Ag = Agung (1963)SA = St. Augustine (1976)EC = El Chichon (1982)Pi = Pinatubo (1991)Ka = Kasatochi (2008)
El Niño
Global Temperatures 1860–2008 (SCHÖNWIESE 2009)

CLIMATE AND ENVIRONMENTAL CHANGEM.Sc. Module ‚Global Transformation and Environmental Change‘
-0.6
-0.4
-0.2
0.0
0.2
0.4
0.6
0.8
1.0
1860 1880 1900 1920 1940 1960 1980 2000
Tem
pera
ture
anom
alie
s [°
C]
Kr SM Ag SA EC Pi Ka
● ●●
●
●
●●
observation (global mean) statistical simulation (neuronal net)sulfat signalgreenhouse gas signal
explosive volcanic eruption:Kr = Krakatau (1883)SM = Santa Maria (1902)Ag = Agung (1963)SA = St. Augustine (1976)EC = El Chichon (1982)Pi = Pinatubo (1991)Ka = Kasatochi (2008)
El Niño
Global Temperatures 1860–2008 (SCHÖNWIESE 2009)
CLIMATE AND ENVIRONMENTAL CHANGEM.Sc. Module ‚Global Transformation and Environmental Change‘
-0.6
-0.4
-0.2
0.0
0.2
0.4
0.6
0.8
1.0
1860 1880 1900 1920 1940 1960 1980 2000
Tem
pera
ture
anom
alie
s [°
C]
Kr SM Ag SA EC Pi Ka
● ●●
●
●
●●
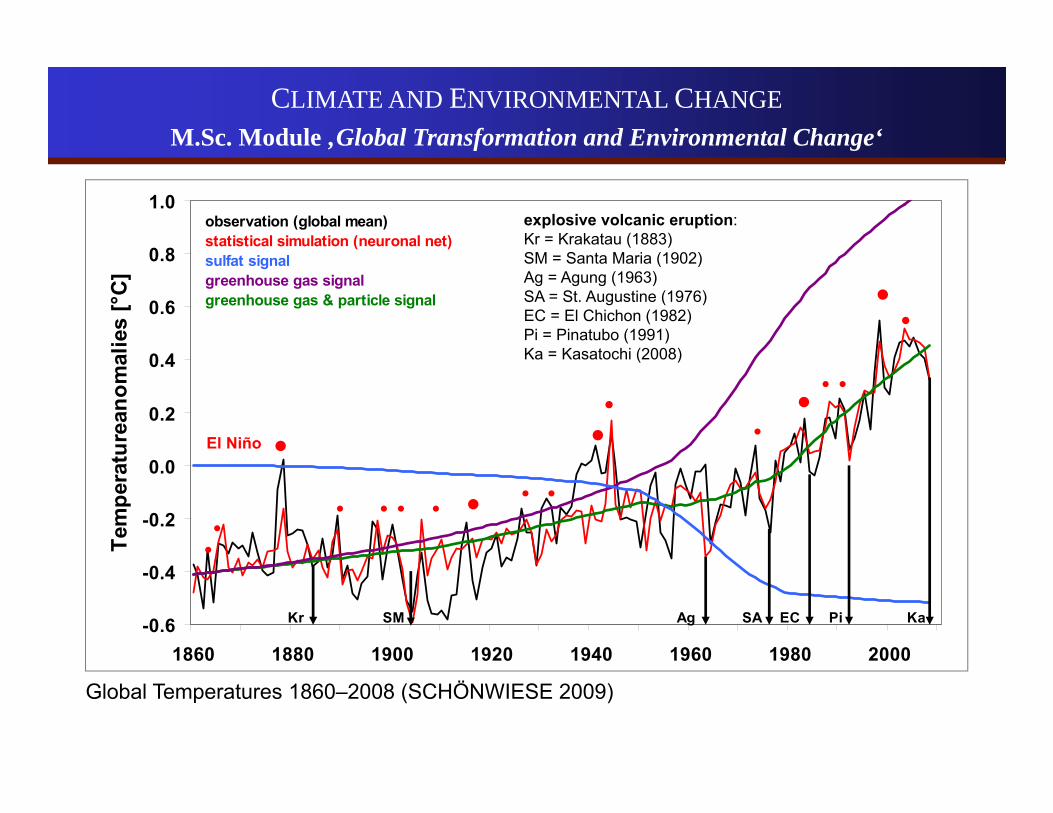
observation (global mean) statistical simulation (neuronal net)sulfat signalgreenhouse gas signalgreenhouse gas & particle signal
explosive volcanic eruption:Kr = Krakatau (1883)SM = Santa Maria (1902)Ag = Agung (1963)SA = St. Augustine (1976)EC = El Chichon (1982)Pi = Pinatubo (1991)Ka = Kasatochi (2008)
El Niño
Global Temperatures 1860–2008 (SCHÖNWIESE 2009)
CLIMATE AND ENVIRONMENTAL CHANGEM.Sc. Module ‚Global Transformation and Environmental Change‘
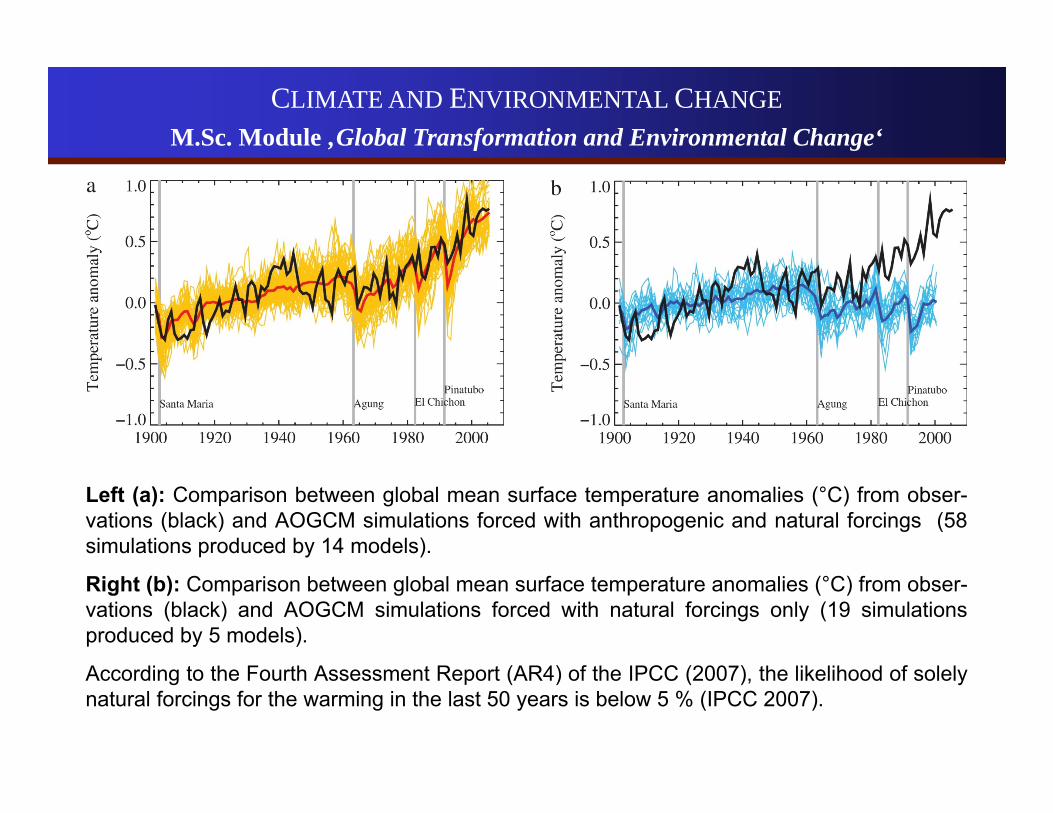
Left (a): Comparison between global mean surface temperature anomalies (°C) from obser-vations (black) and AOGCM simulations forced with anthropogenic and natural forcings (58simulations produced by 14 models).
Right (b): Comparison between global mean surface temperature anomalies (°C) from obser-vations (black) and AOGCM simulations forced with natural forcings only (19 simulationsproduced by 5 models).
According to the Fourth Assessment Report (AR4) of the IPCC (2007), the likelihood of solelynatural forcings for the warming in the last 50 years is below 5 % (IPCC 2007).
CLIMATE AND ENVIRONMENTAL CHANGEM.Sc. Module ‚Global Transformation and Environmental Change‘
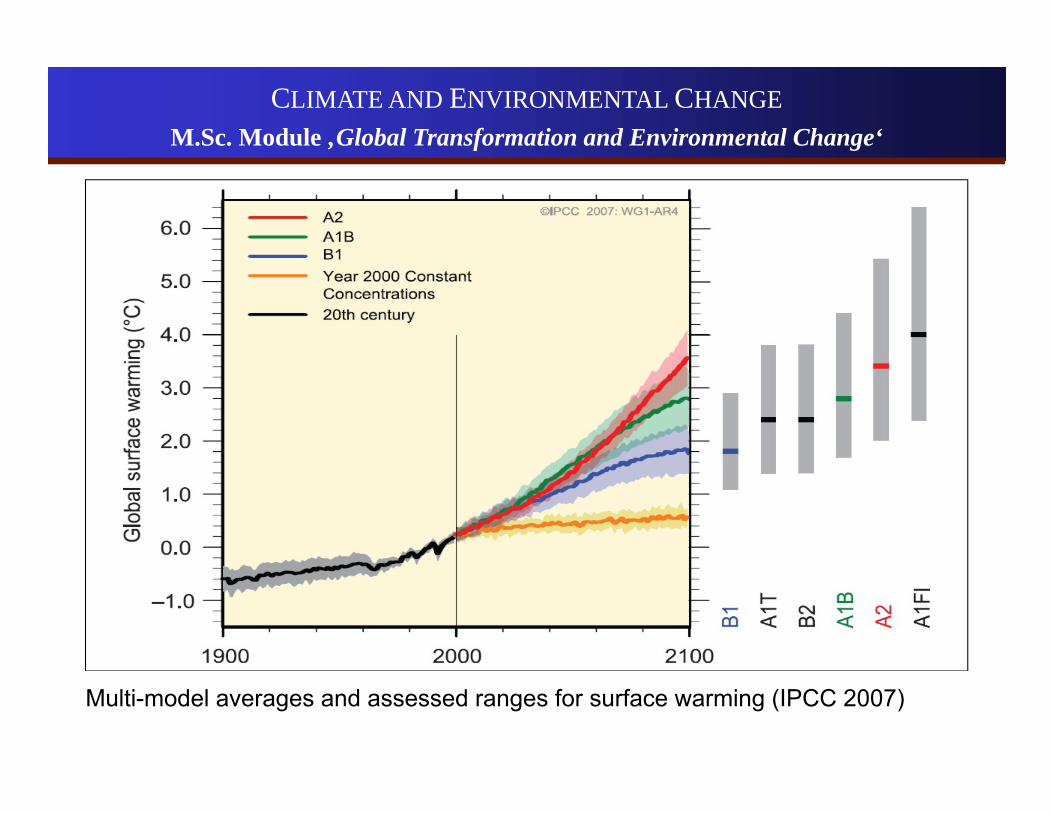
Multi-model averages and assessed ranges for surface warming (IPCC 2007)
Part A: Climate and Environment – Jürgen Scheffran
I Introduction
II The Climate System
III Climate Change
IV Environmental Change
Part B: Human Impact on World Vegetation – Udo Schickhoff
CLIMATE AND ENVIRONMENTAL CHANGEM.Sc. Module ‚Global Transformation and Environmental Change‘

II THE CLIMATE SYSTEM Basics
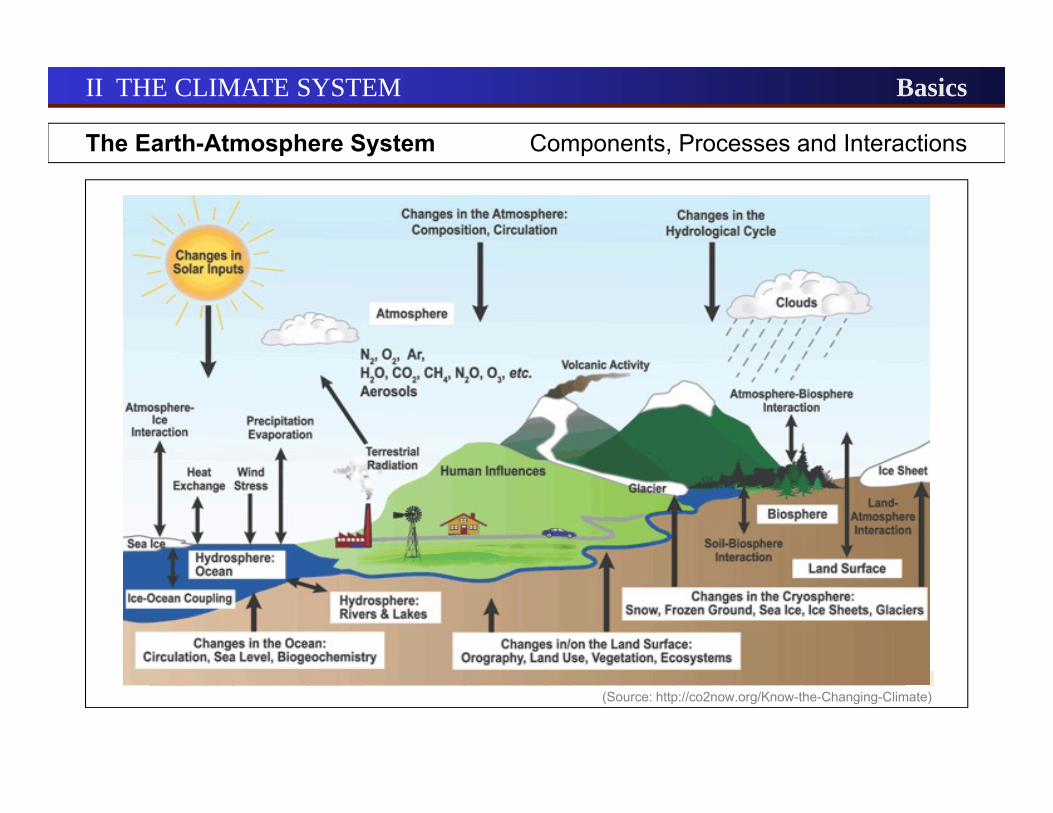
The Earth-Atmosphere System Components, Processes and Interactions
(Source:www.bom.gov.au/lam/climate)
II THE CLIMATE SYSTEM Basics
The Earth-Atmosphere System Components, Processes and Interactions
(Source:www.bom.gov.au/lam/climate)(Source: http://co2now.org/Know-the-Changing-Climate)
Scales Spatiotemporal Dimensions
II THE CLIMATE SYSTEM Basics
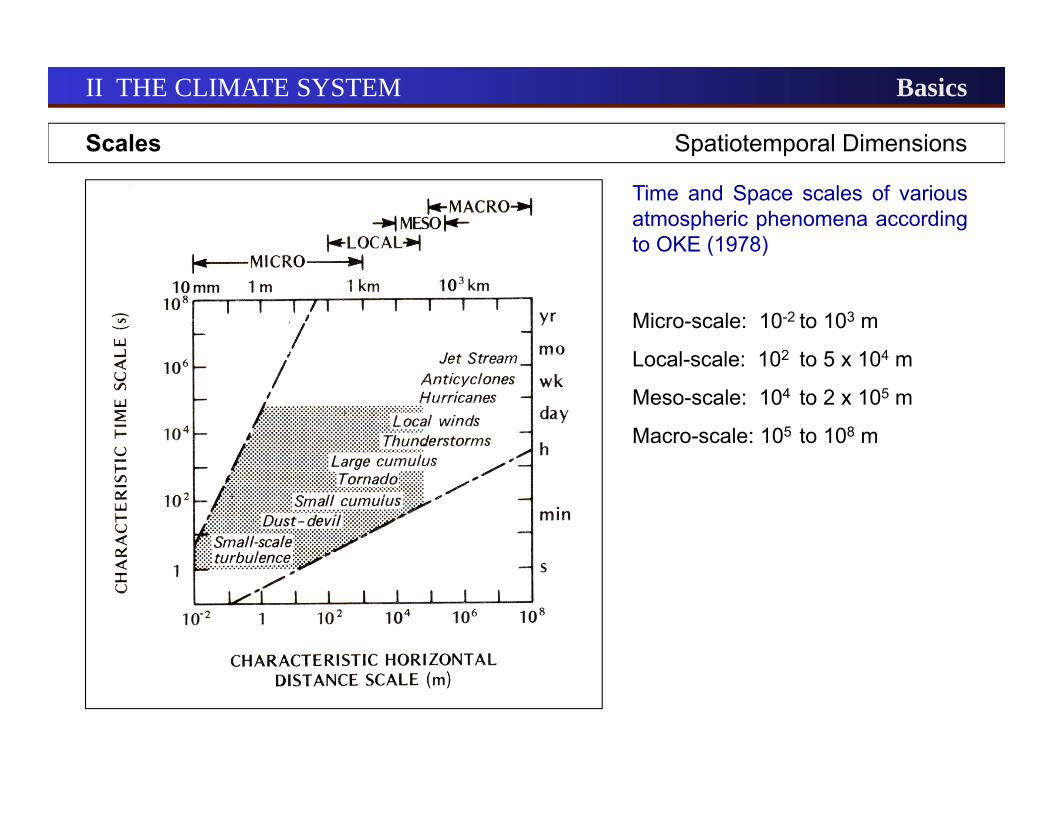
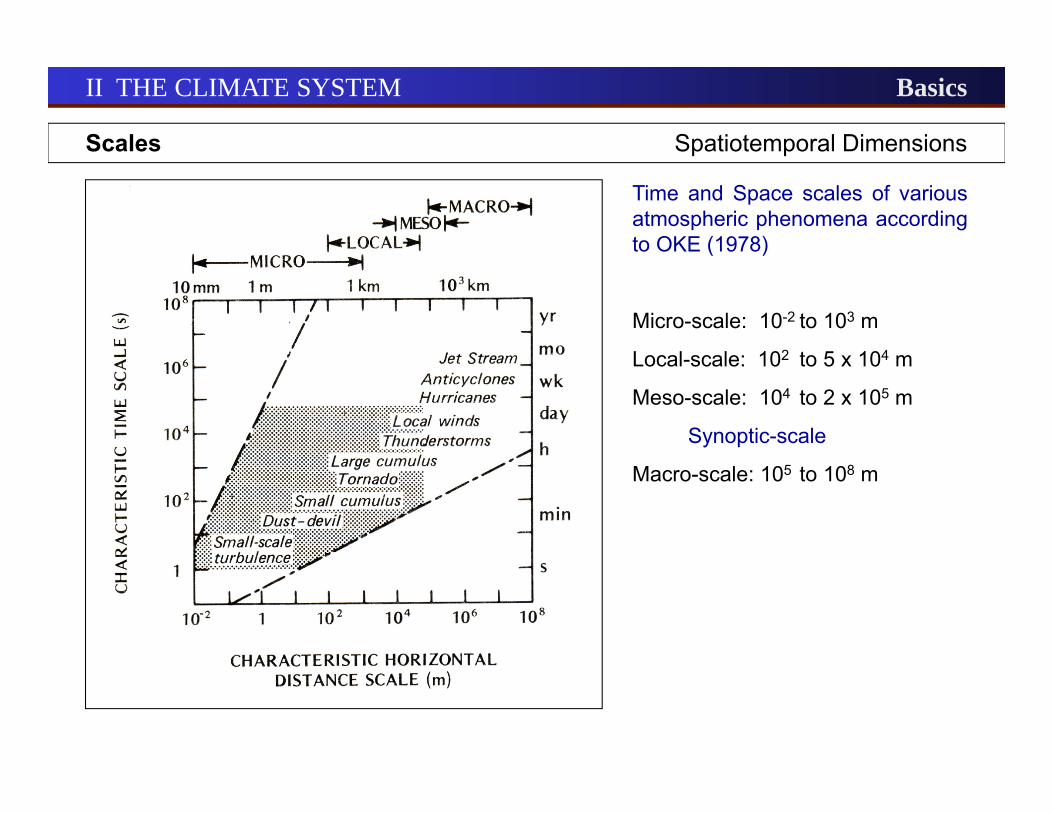
Time and Space scales of variousatmospheric phenomena accordingto OKE (1978)
Micro-scale: 10-2 to 103 m
Local-scale: 102 to 5 x 10⁴ m
Meso-scale: 104 to 2 x 10⁵ m
Macro-scale: 105 to 108 m
Scales Spatiotemporal Dimensions
II THE CLIMATE SYSTEM Basics
Time and Space scales of variousatmospheric phenomena accordingto OKE (1978)
Micro-scale: 10-2 to 103 m
Local-scale: 102 to 5 x 10⁴ m
Meso-scale: 104 to 2 x 10⁵ m
Synoptic-scale
Macro-scale: 105 to 108 m
Scales Spatiotemporal Dimensions
II THE CLIMATE SYSTEM Basics
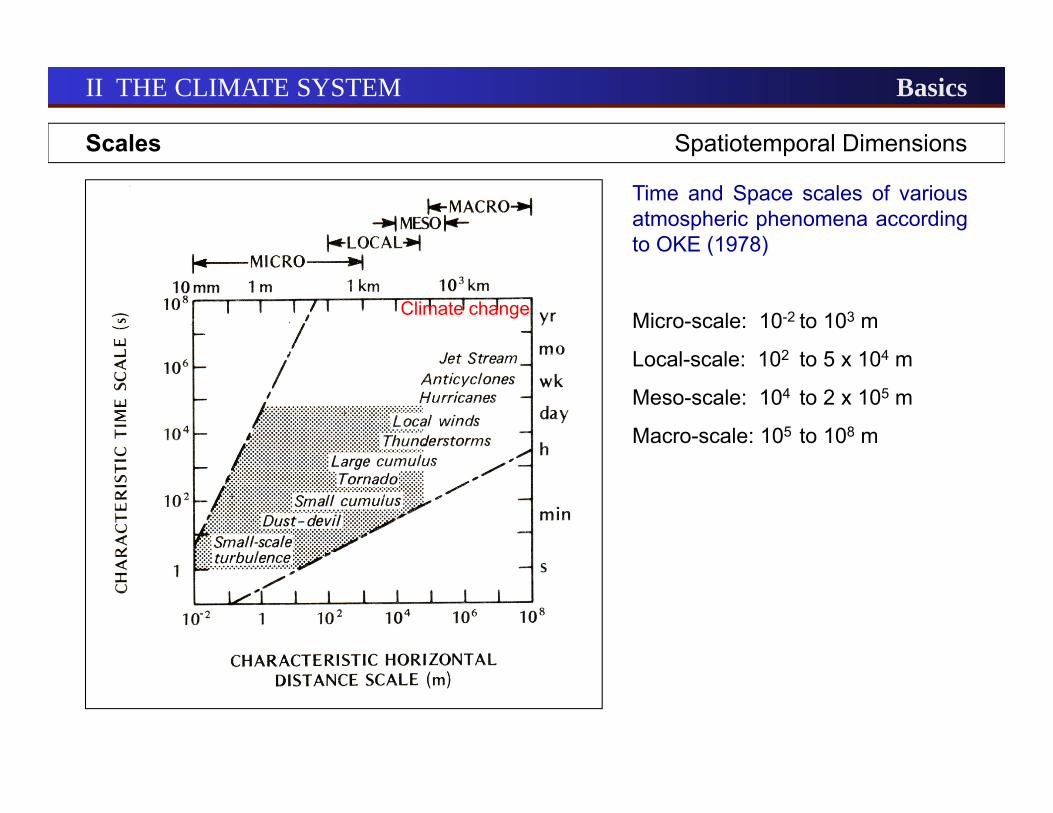
Time and Space scales of variousatmospheric phenomena accordingto OKE (1978)
Micro-scale: 10-2 to 103 m
Local-scale: 102 to 5 x 10⁴ m
Meso-scale: 104 to 2 x 10⁵ m
Macro-scale: 105 to 108 m
Climate change
Scales Spatiotemporal Dimensions
II THE CLIMATE SYSTEM Basics
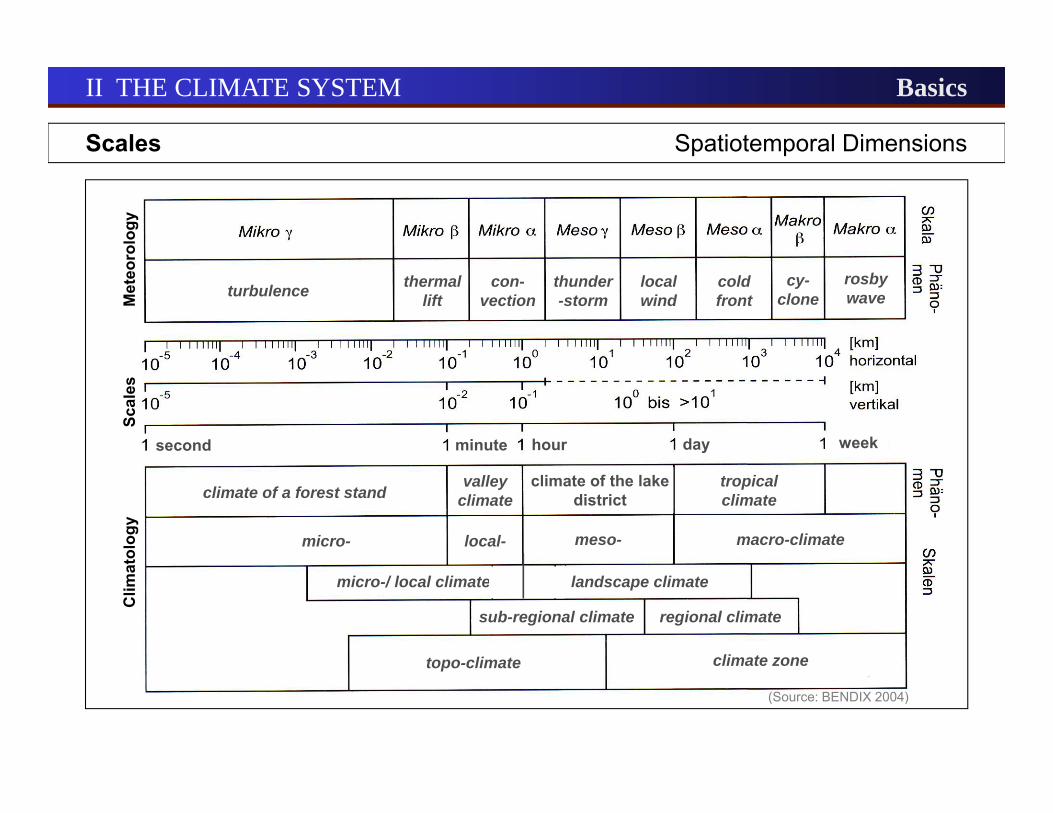
(Source: BENDIX 2004)
topo-climate climate zone
regional climatesub-regional climate
landscape climate
micro- local- meso- macro-climate
climate of a forest standvalley
climateclimate of the lake
districttropical climate
weekdayhourminutesecond
turbulence thermal lift
con-vection
thunder-storm
local wind
cold front
cy-clone
rosby wave
Clim
atol
ogy
Scal
es
Met
eoro
logy
micro-/ local climate

Earth-Sun Relations The Solar System
II THE CLIMATE SYSTEM Basics
The Solar System (McKNIGHT & HESS 2008)
Earth-Sun Relations The Sun
II THE CLIMATE SYSTEM Basics
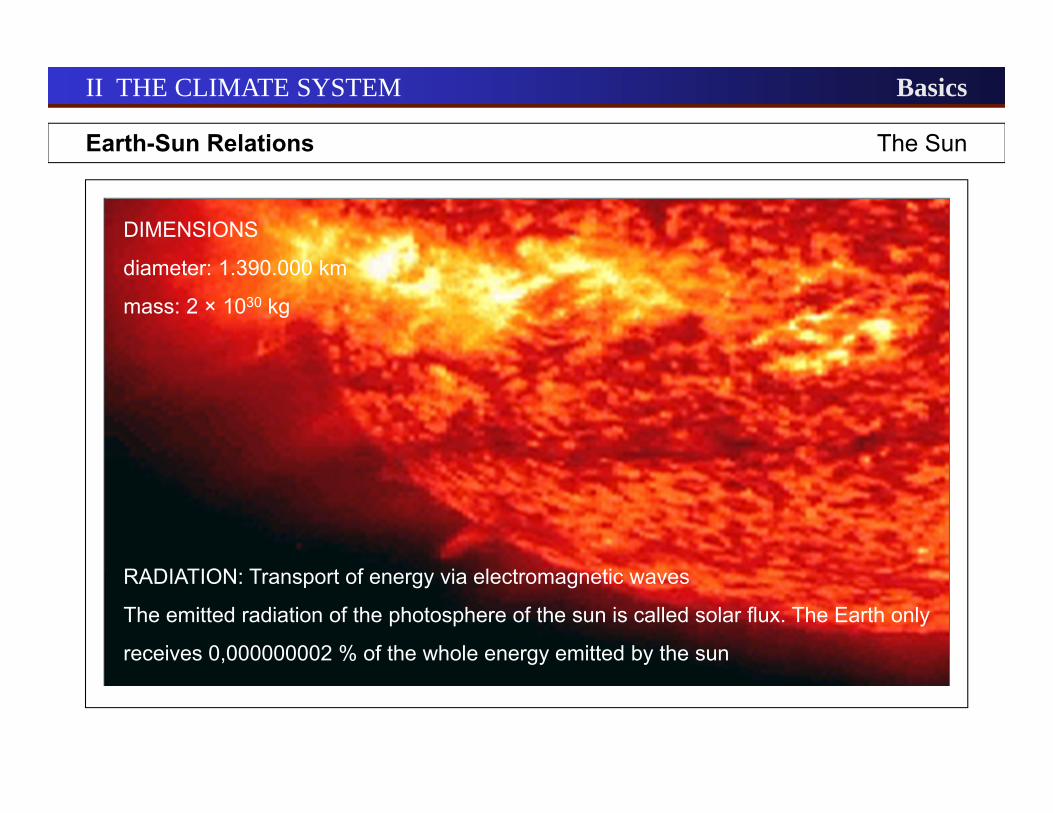
RADIATION: Transport of energy via electromagnetic waves
The emitted radiation of the photosphere of the sun is called solar flux. The Earth only
receives 0,000000002 % of the whole energy emitted by the sun
DIMENSIONS
diameter: 1.390.000 km
mass: 2 × 1030 kg
Erdkruste
Ozeanische Kruste 6 km (0-9 km)
Kontinentale Kruste 40 km (10-80 km)
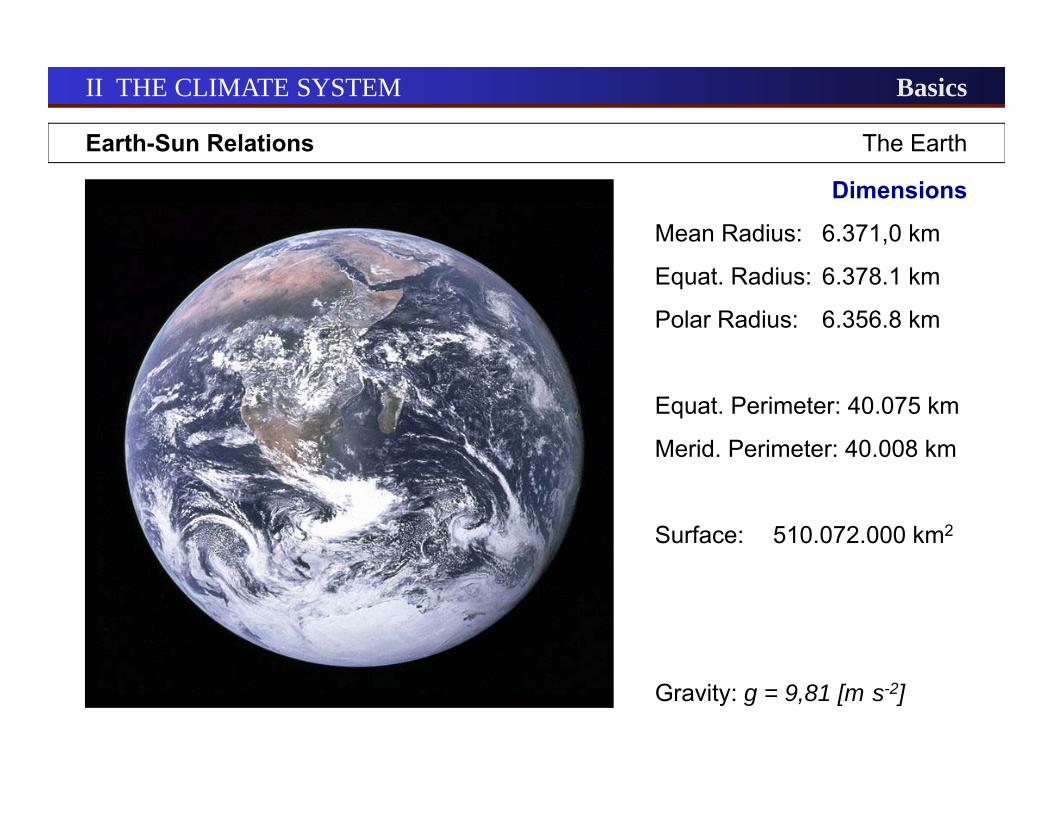
Dimensions
Mean Radius: 6.371,0 km
Equat. Radius: 6.378.1 km
Polar Radius: 6.356.8 km
Equat. Perimeter: 40.075 km
Merid. Perimeter: 40.008 km
Surface: 510.072.000 km2
Gravity: g = 9,81 [m·s-2]
Earth-Sun Relations The Earth
II THE CLIMATE SYSTEM Basics
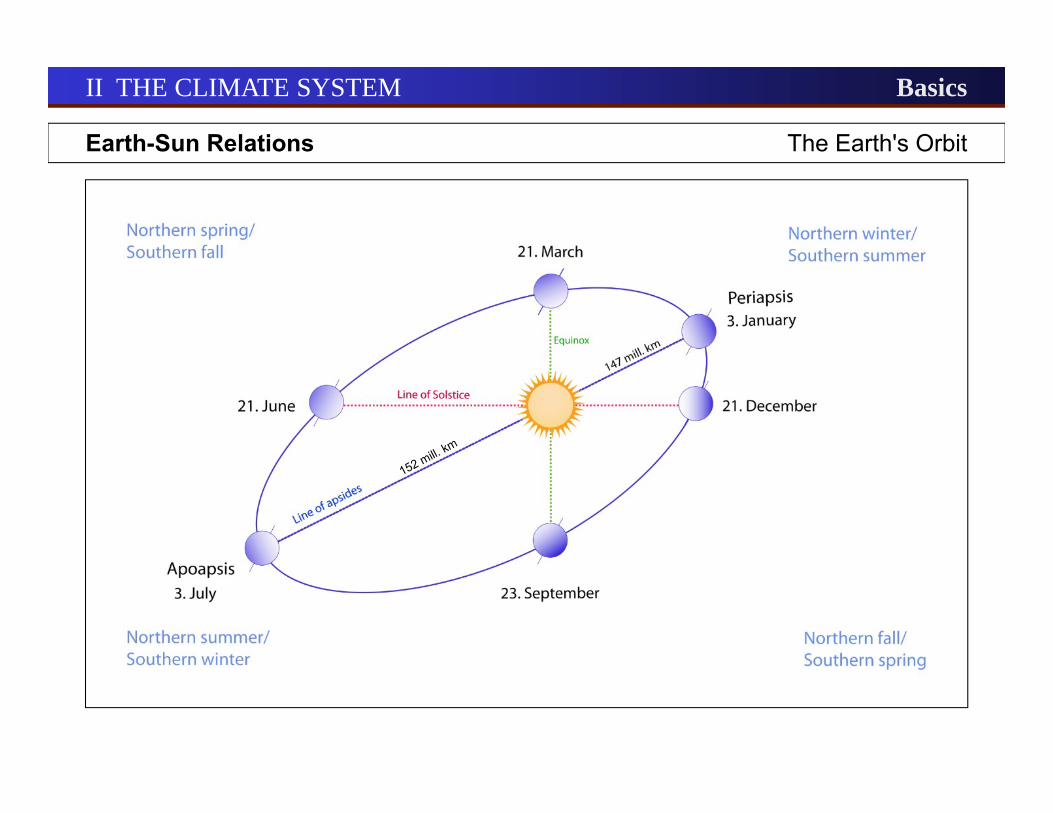
Earth-Sun Relations The Earth's Orbit
II THE CLIMATE SYSTEM Basics
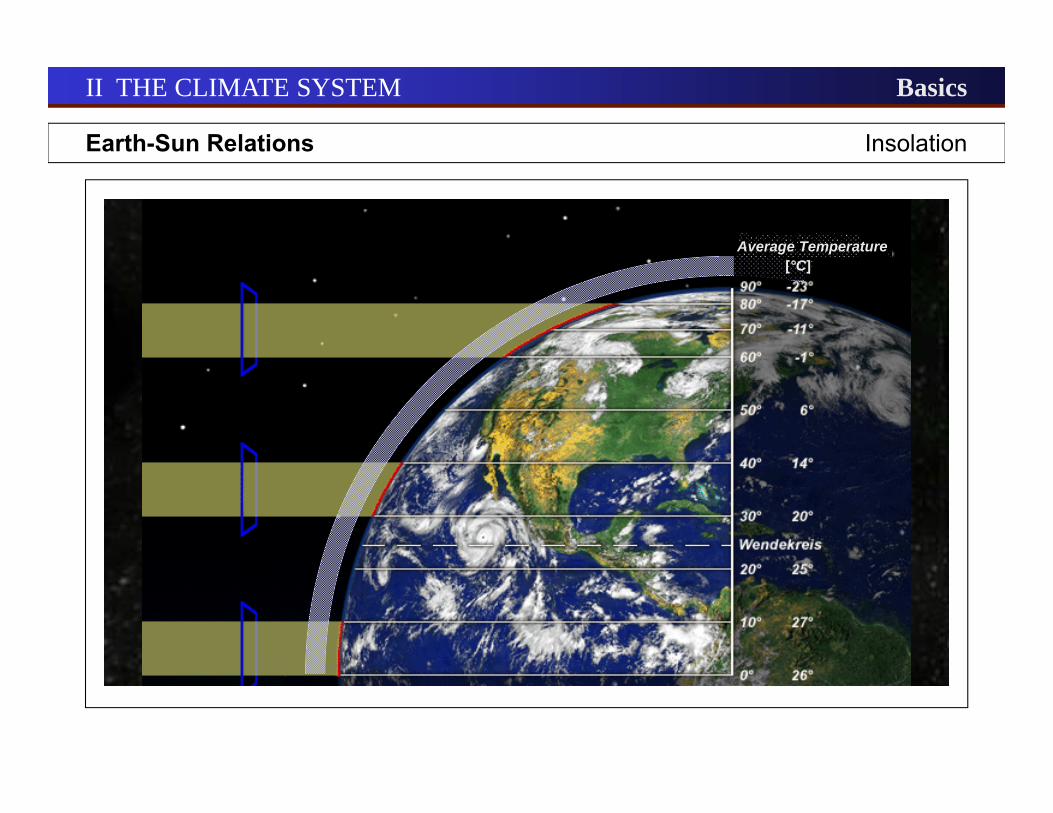
Earth-Sun Relations Insolation
II THE CLIMATE SYSTEM Basics
Average Temperature[°C]
Earth-Sun Relations Irradiation
II THE CLIMATE SYSTEM Basics
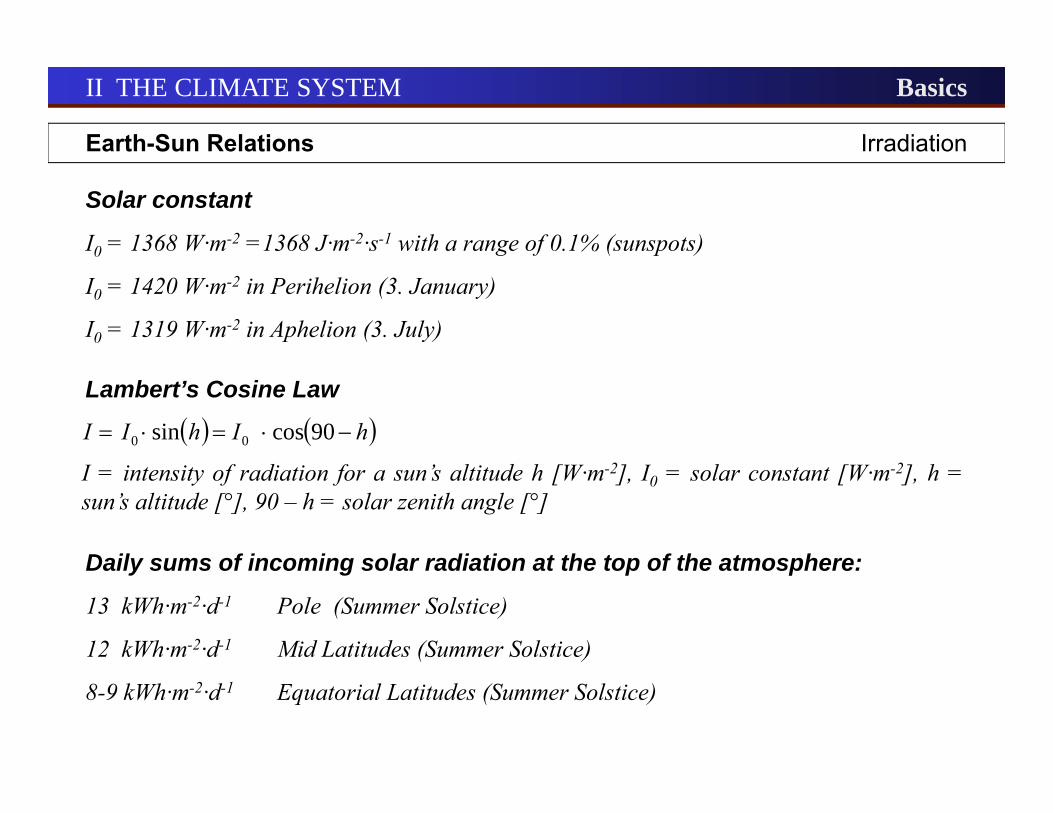
Solar constant
I0 = 1368 W·m-2 =1368 J·m-2·s-1 with a range of 0.1% (sunspots)
I0 = 1420 W·m-2 in Perihelion (3. January)
I0 = 1319 W·m-2 in Aphelion (3. July)
Daily sums of incoming solar radiation at the top of the atmosphere:
13 kWh·m-2·d-1 Pole (Summer Solstice)
12 kWh·m-2·d-1 Mid Latitudes (Summer Solstice)
8-9 kWh·m-2·d-1 Equatorial Latitudes (Summer Solstice)
hIhII 90cossin 00
Lambert’s Cosine Law
I = intensity of radiation for a sun’s altitude h [W·m-2], I0 = solar constant [W·m-2], h =sun’s altitude [°], 90 – h = solar zenith angle [°]
The Atmosphere Structure and Composition
II THE CLIMATE SYSTEM Basics
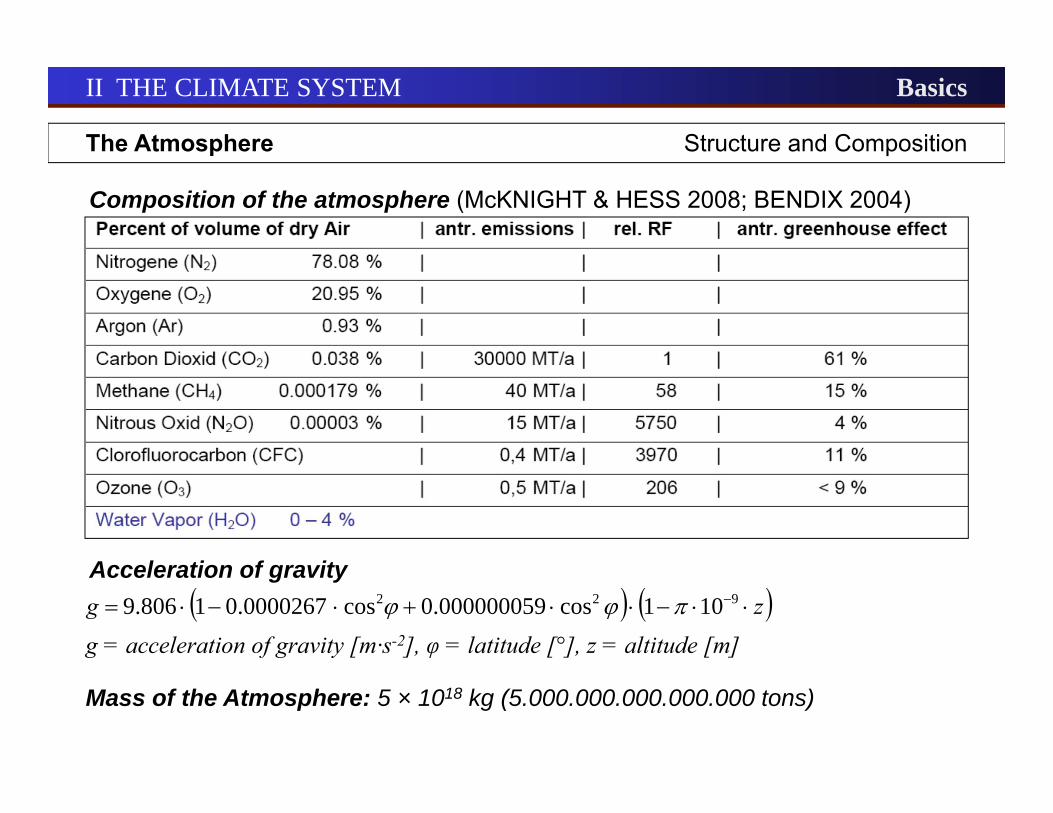
Composition of the atmosphere (McKNIGHT & HESS 2008; BENDIX 2004)
Acceleration of gravity zg 922 101cos000000059.0cos0000267.01806.9
g = acceleration of gravity [m·s-2], φ = latitude [°], z = altitude [m]
Mass of the Atmosphere: 5 × 10¹⁸ kg (5.000.000.000.000.000 tons)
The Atmosphere Structure and Composition
II THE CLIMATE SYSTEM Basics
[°C] suface
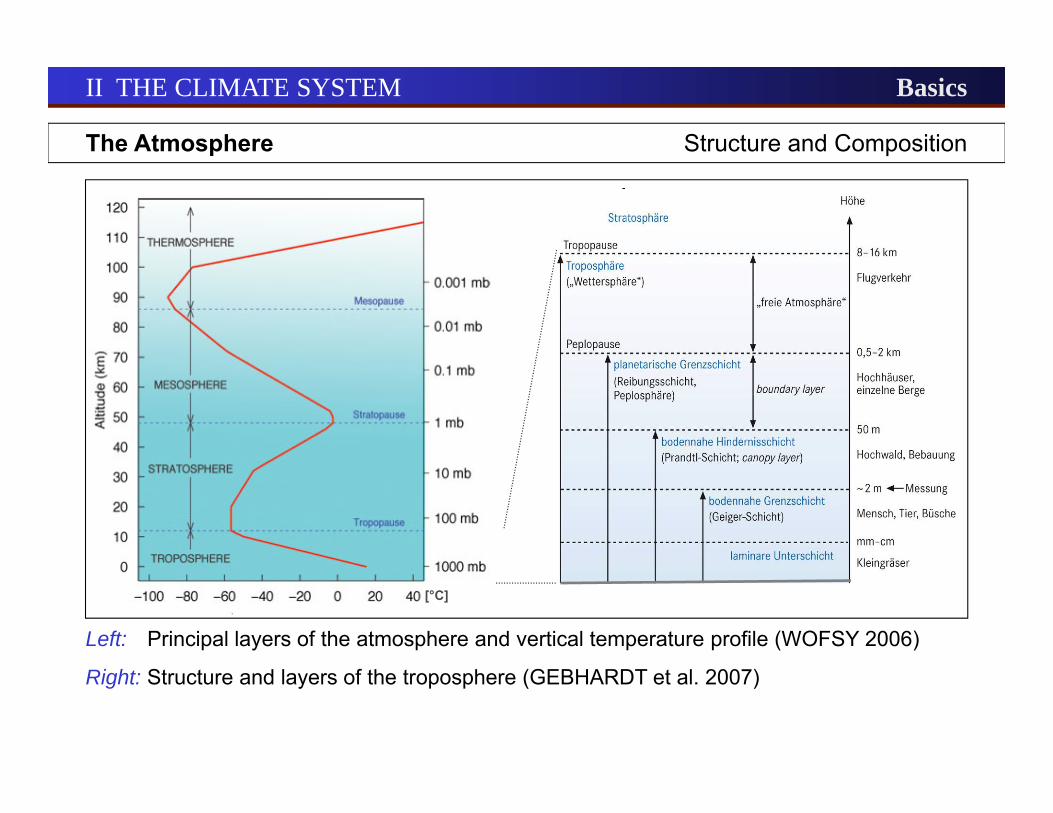
Left: Principal layers of the atmosphere and vertical temperature profile (WOFSY 2006)
Right: Structure and layers of the troposphere (GEBHARDT et al. 2007)
The Atmosphere Structure and Composition
II THE CLIMATE SYSTEM Basics
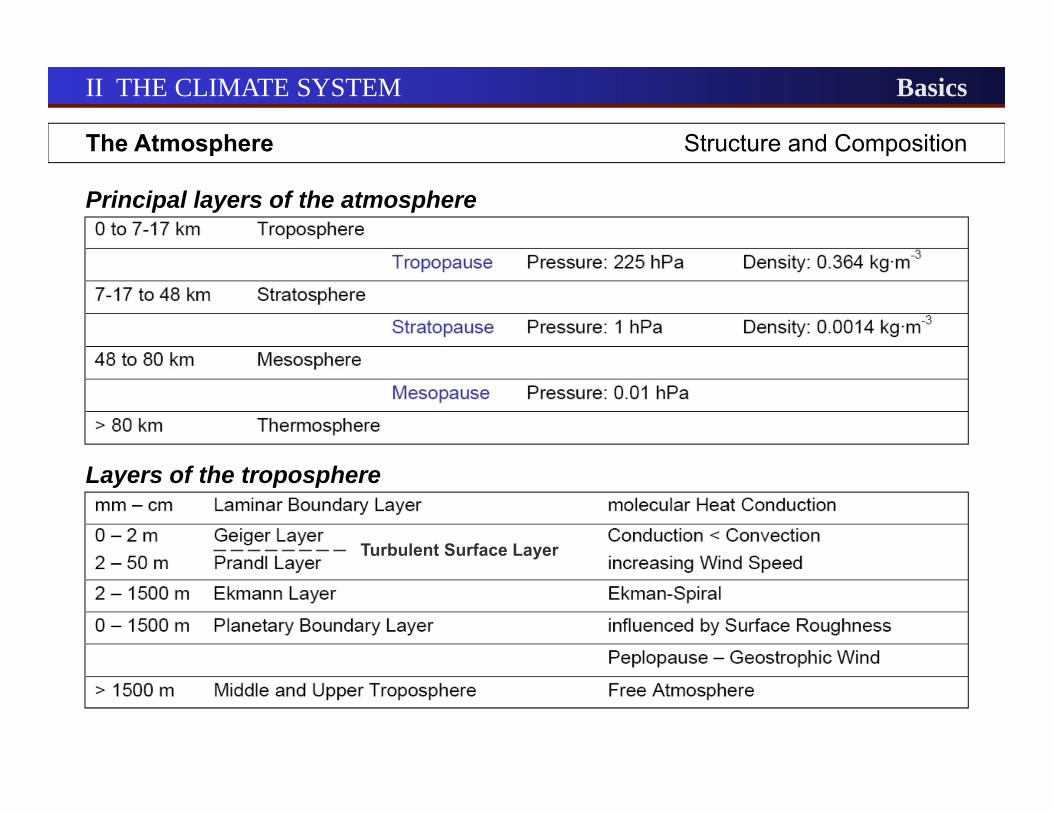
Principal layers of the atmosphere
Layers of the troposphere
─ ─ ─ ─ ─ ─ ─ ─ Turbulent Surface Layer

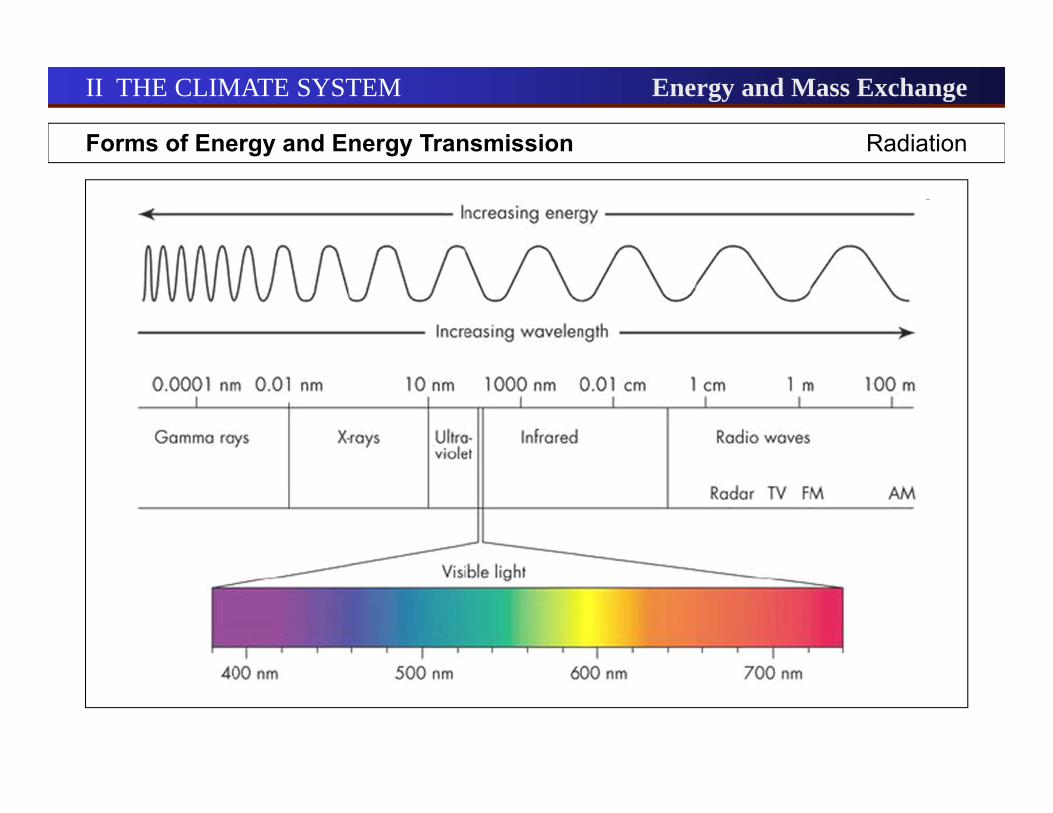
Forms of Energy and Energy Transmission Overview
(Source: Jensen 2000)
II THE CLIMATE SYSTEM Energy and Mass Exchange
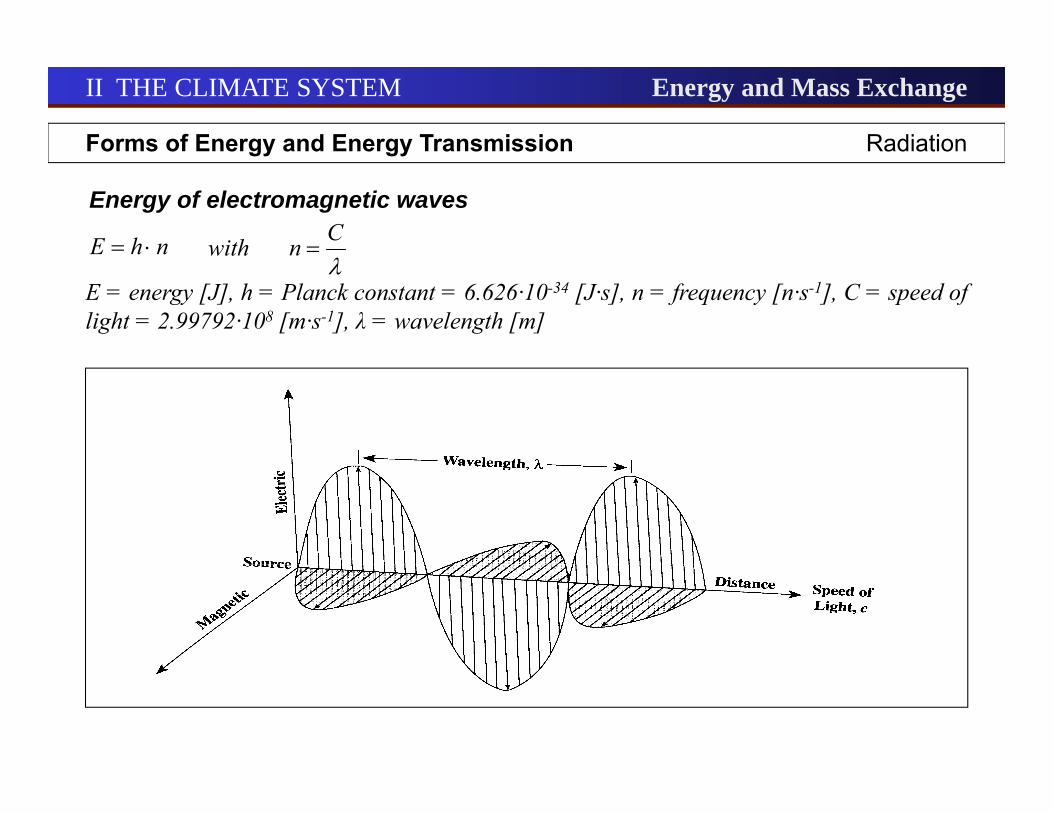
nhE withCn
E = energy [J], h = Planck constant = 6.626·10-34 [J·s], n = frequency [n·s-1], C = speed oflight = 2.99792·108 [m·s-1], λ = wavelength [m]
Energy of electromagnetic waves
Forms of Energy and Energy Transmission Radiation
II THE CLIMATE SYSTEM Energy and Mass Exchange
Forms of Energy and Energy Transmission Radiation
II THE CLIMATE SYSTEM Energy and Mass Exchange
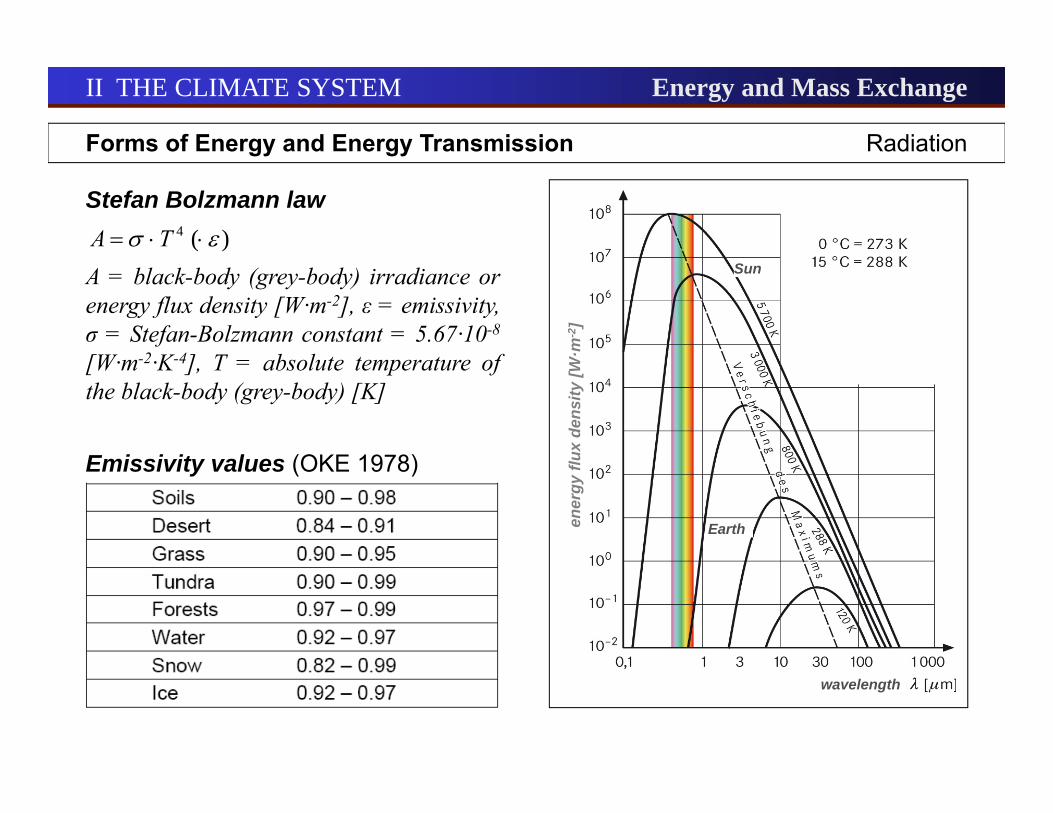
Emissivity values (OKE 1978)
Stefan Bolzmann law
A = black-body (grey-body) irradiance orenergy flux density [W·m-2], ε = emissivity,σ = Stefan-Bolzmann constant = 5.67·10-8
[W·m-2·K-4], T = absolute temperature ofthe black-body (grey-body) [K]
)(4 TA
Forms of Energy and Energy Transmission Radiation
II THE CLIMATE SYSTEM Energy and Mass Exchange
wavelength
ener
gyflu
xde
nsity
[W·m
-2]
Earth
Sun
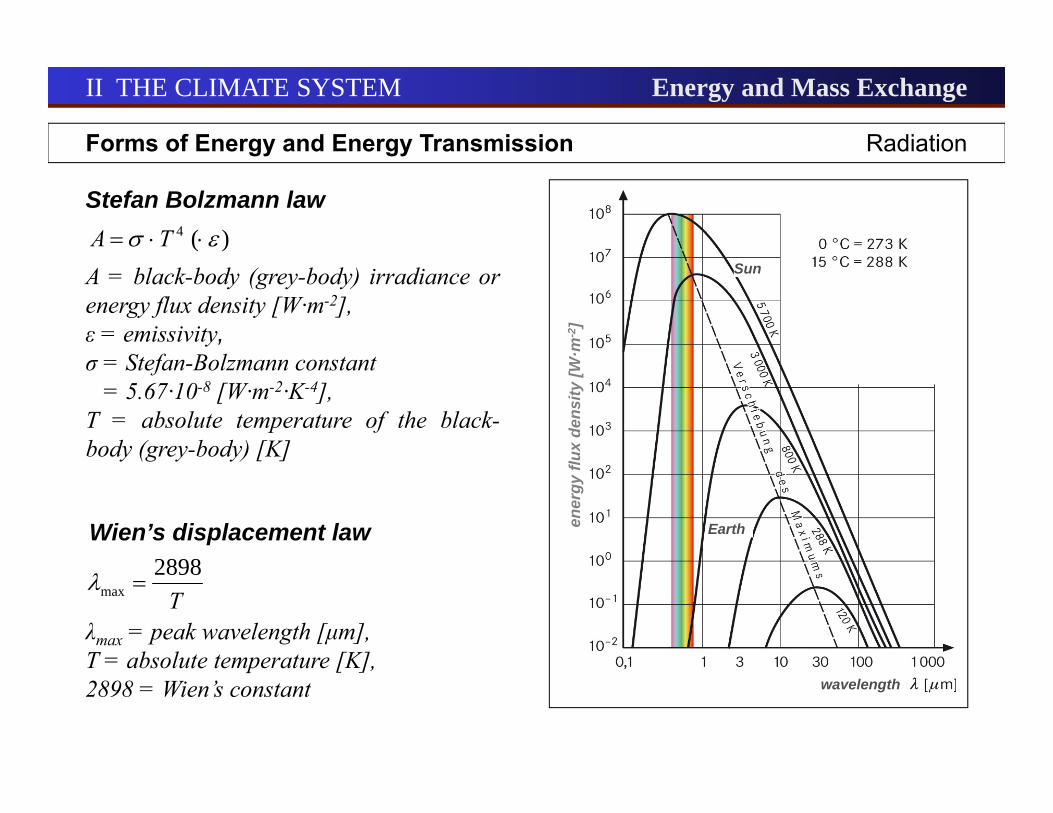
λmax = peak wavelength [μm],T = absolute temperature [K],2898 = Wien’s constant
Wien’s displacement law
T2898
max
Stefan Bolzmann law
A = black-body (grey-body) irradiance orenergy flux density [W·m-2],ε = emissivity,σ = Stefan-Bolzmann constant
= 5.67·10-8 [W·m-2·K-4],T = absolute temperature of the black-body (grey-body) [K]
)(4 TA
Forms of Energy and Energy Transmission Radiation
II THE CLIMATE SYSTEM Energy and Mass Exchange
wavelength
ener
gyflu
xde
nsity
[W·m
-2]
Earth
Sun
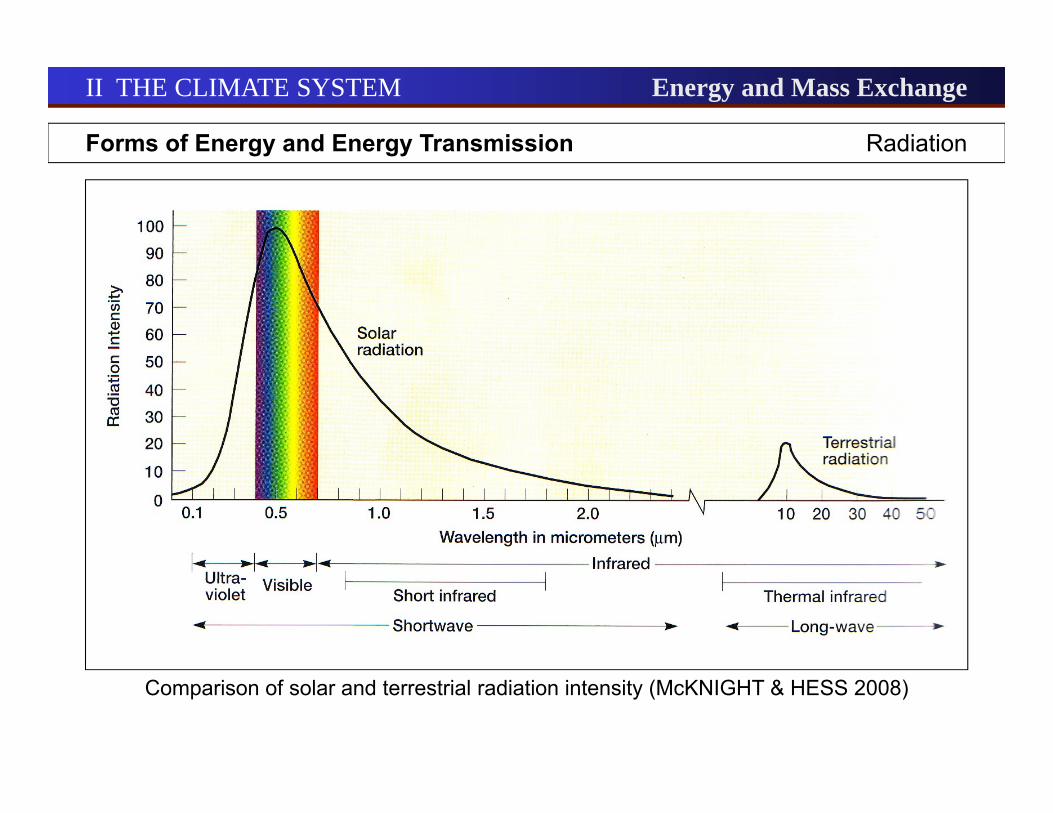
Forms of Energy and Energy Transmission Radiation
II THE CLIMATE SYSTEM Energy and Mass Exchange
Comparison of solar and terrestrial radiation intensity (McKNIGHT & HESS 2008)
Erdkruste
Ozeanische Kruste 6 km (0-9 km)
Kontinentale Kruste 40 km (10-80 km)
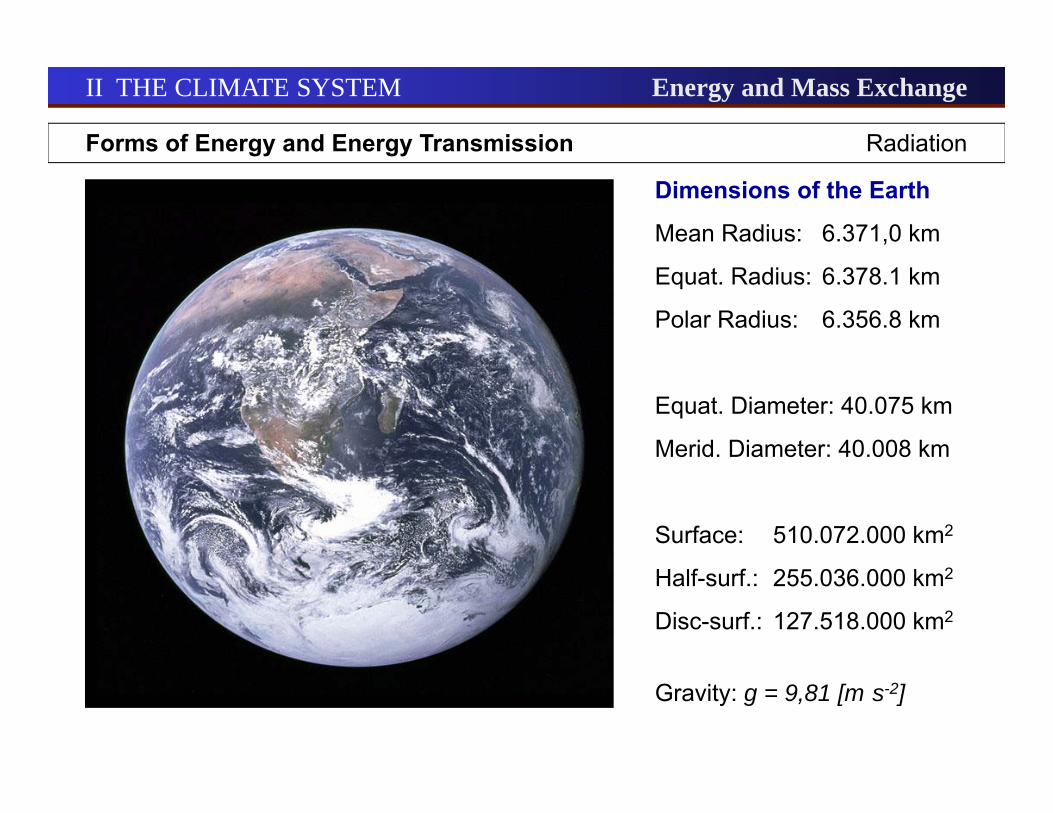
Dimensions of the Earth
Mean Radius: 6.371,0 km
Equat. Radius: 6.378.1 km
Polar Radius: 6.356.8 km
Equat. Diameter: 40.075 km
Merid. Diameter: 40.008 km
Surface: 510.072.000 km2
Half-surf.: 255.036.000 km2
Disc-surf.: 127.518.000 km2
Gravity: g = 9,81 [m·s-2]
Forms of Energy and Energy Transmission Radiation
II THE CLIMATE SYSTEM Energy and Mass Exchange
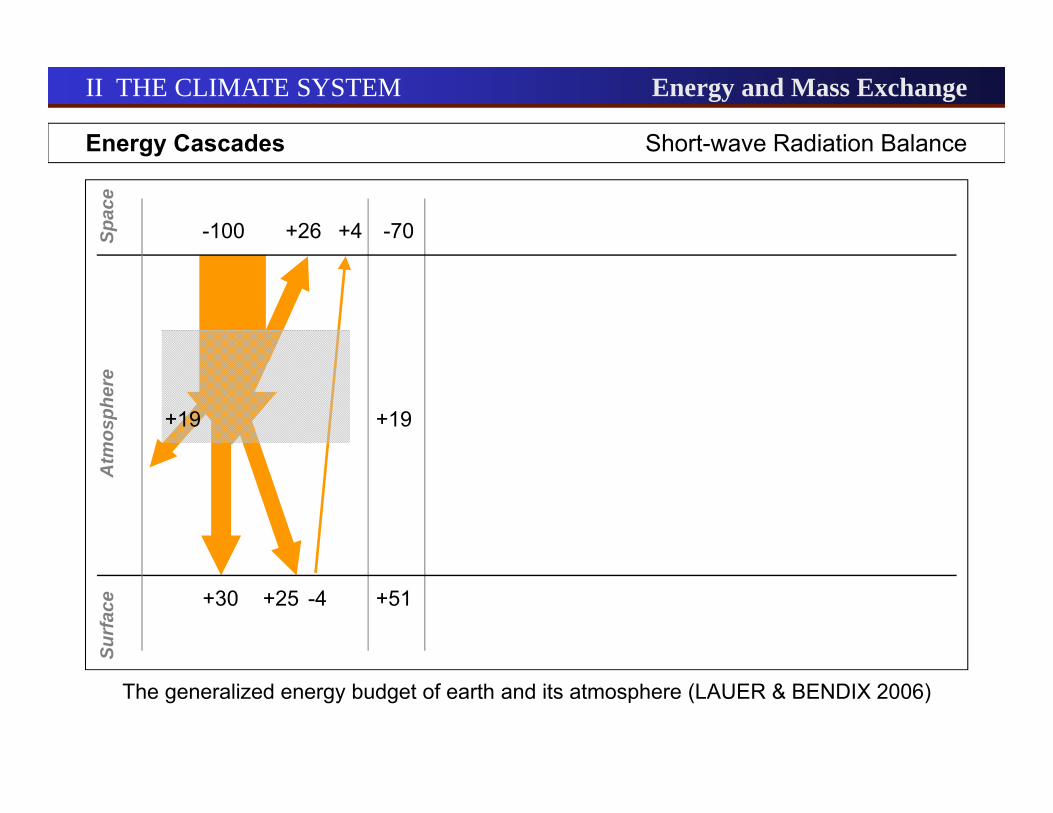
Energy Cascades Short-wave Radiation Balance
II THE CLIMATE SYSTEM Energy and Mass Exchange
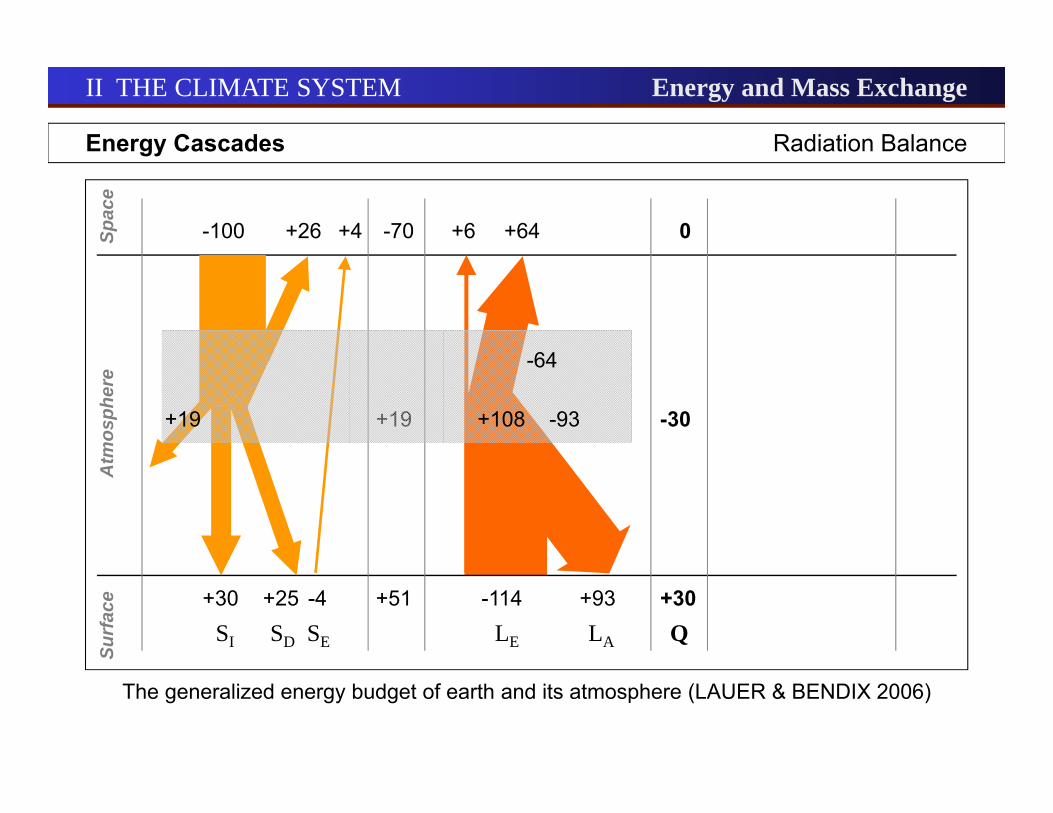
The generalized energy budget of earth and its atmosphere (LAUER & BENDIX 2006)
-100 +26 +4
+30 +25 -4
-70
+19
+51
Surf
ace
Atm
osph
ere
Spac
e
+19
SI SD SE QS
QS = short-wave radiation balance [W·m-2],SI = direct solar radiation [W·m-2],SD = diffuse short-wave beam [W·m-2],SE = reflected short-wave radiation [W·m-2],α = albedo
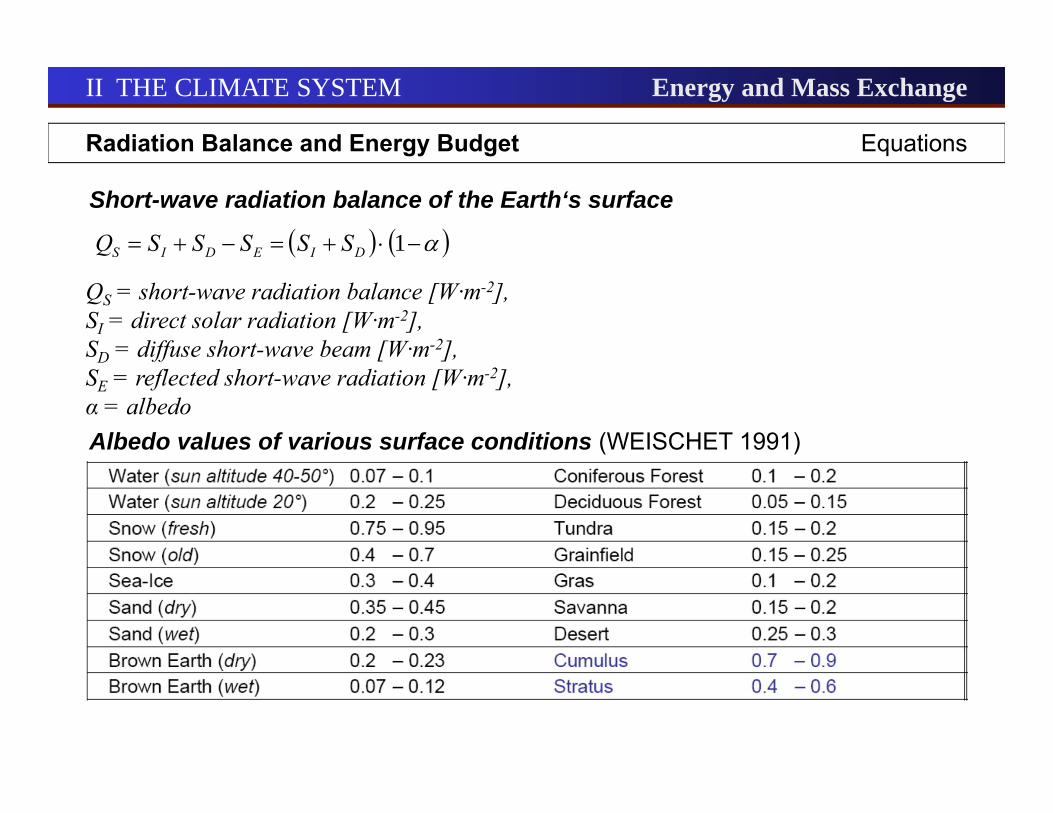
Short-wave radiation balance of the Earth‘s surface
Radiation Balance and Energy Budget Equations
II THE CLIMATE SYSTEM Energy and Mass Exchange
1DIEDIS SSSSSQ
Albedo values of various surface conditions (WEISCHET 1991)
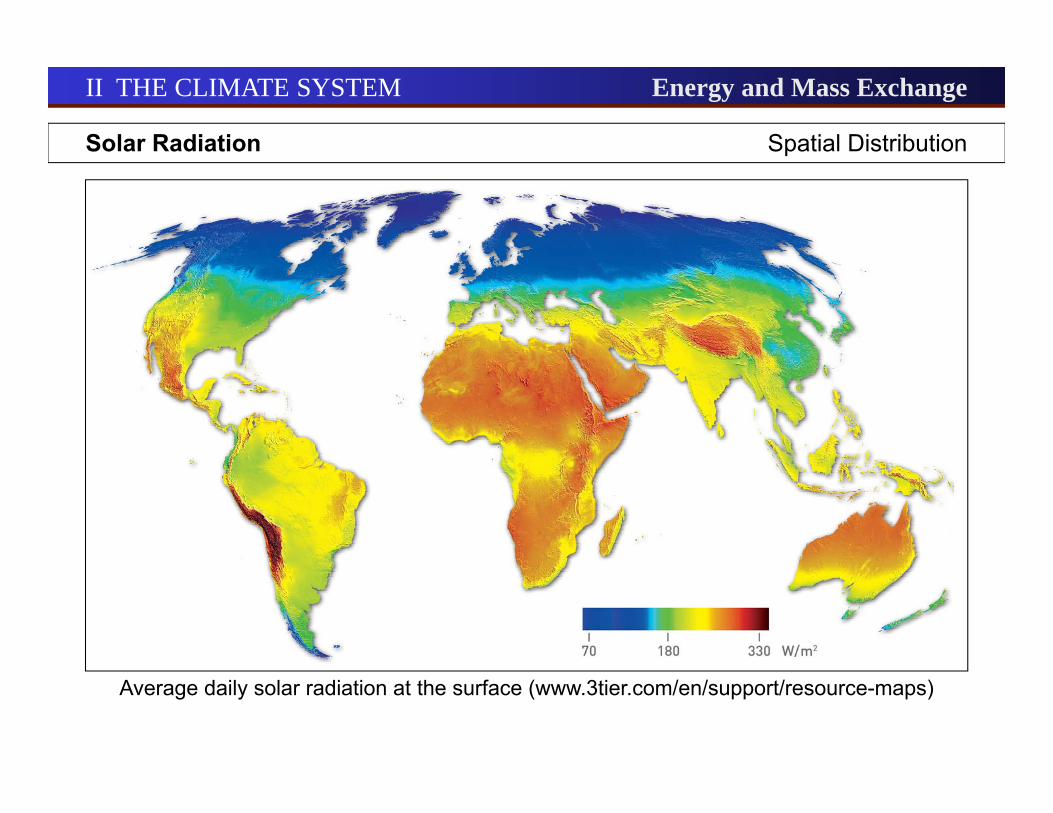
Solar Radiation Spatial Distribution
II THE CLIMATE SYSTEM Energy and Mass Exchange
Average daily solar radiation at the surface (www.3tier.com/en/support/resource-maps)
II THE CLIMATE SYSTEM Energy and Mass ExchangeSu
rfac
eA
tmos
pher
eSp
ace
-100 +26 +4
+30 +25 -4
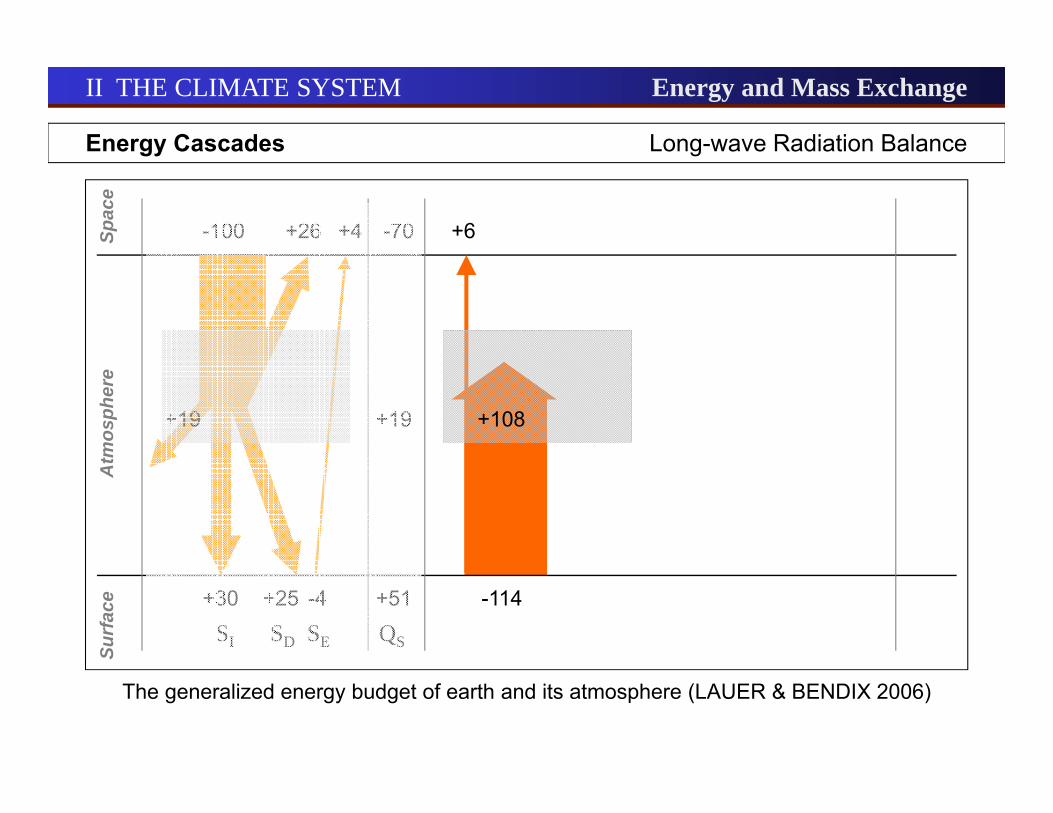
+6
-114
+19 +108
SI SD SE QS LE
-70
+19
+51
Energy Cascades Long-wave Radiation Balance
The generalized energy budget of earth and its atmosphere (LAUER & BENDIX 2006)
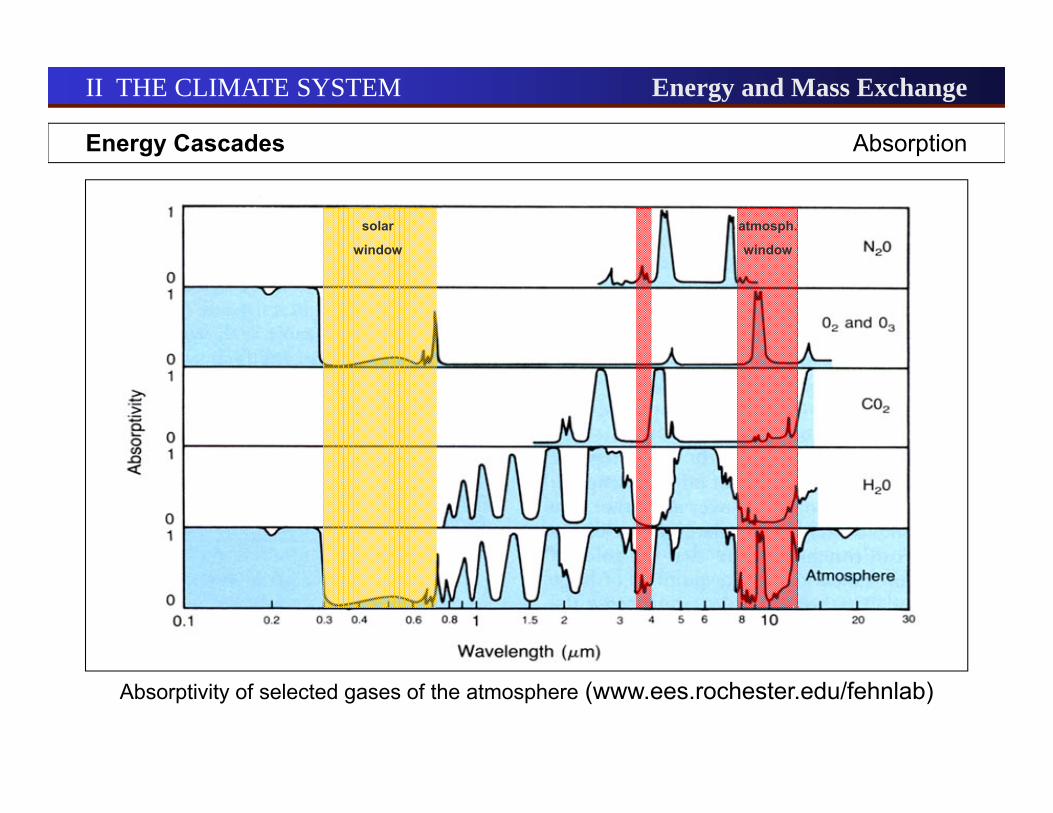
Energy Cascades Absorption
II THE CLIMATE SYSTEM Energy and Mass Exchange
Absorptivity of selected gases of the atmosphere (www.ees.rochester.edu/fehnlab)
solar
window
atmosph.
window
II THE CLIMATE SYSTEM Energy and Mass ExchangeSu
rfac
eA
tmos
pher
eSp
ace
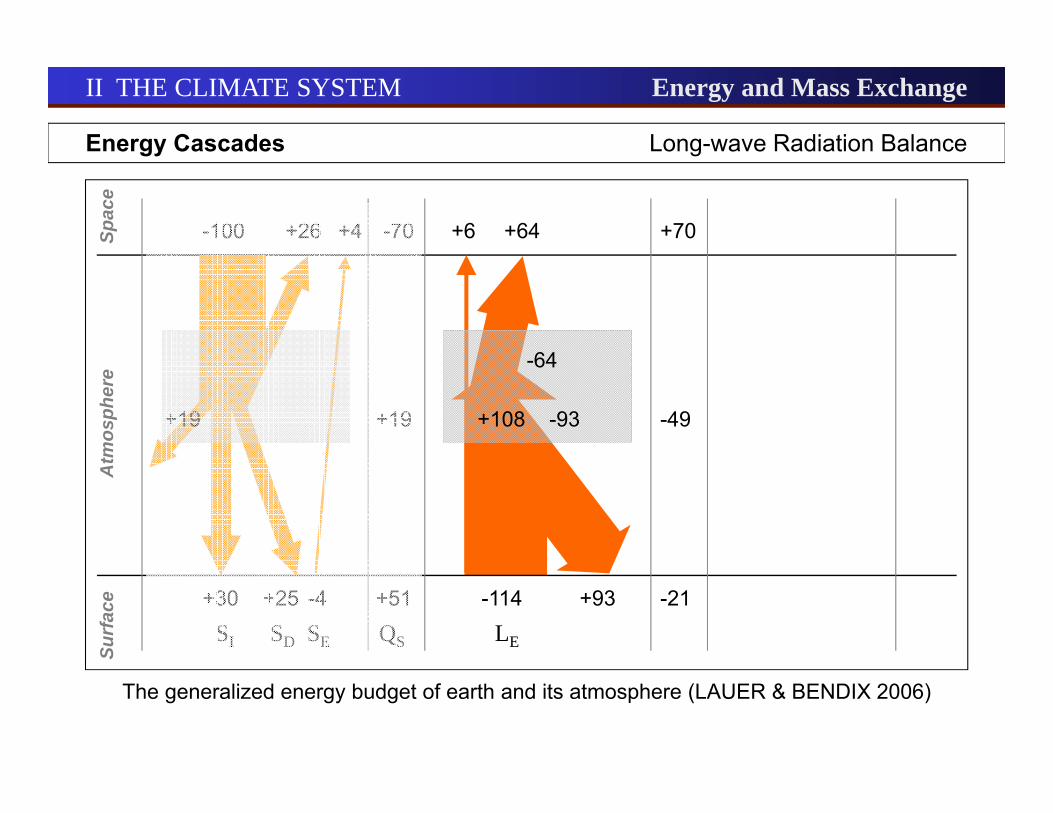
-100 +26 +4
+30 +25 -4
+70
-49
-21
+64+6
-114 +93
+19 +108 -93
-64
SI SD SE QS LE LA QL
-70
+19
+51
Energy Cascades Long-wave Radiation Balance
The generalized energy budget of earth and its atmosphere (LAUER & BENDIX 2006)
II THE CLIMATE SYSTEM Energy and Mass ExchangeSu
rfac
eA
tmos
pher
eSp
ace
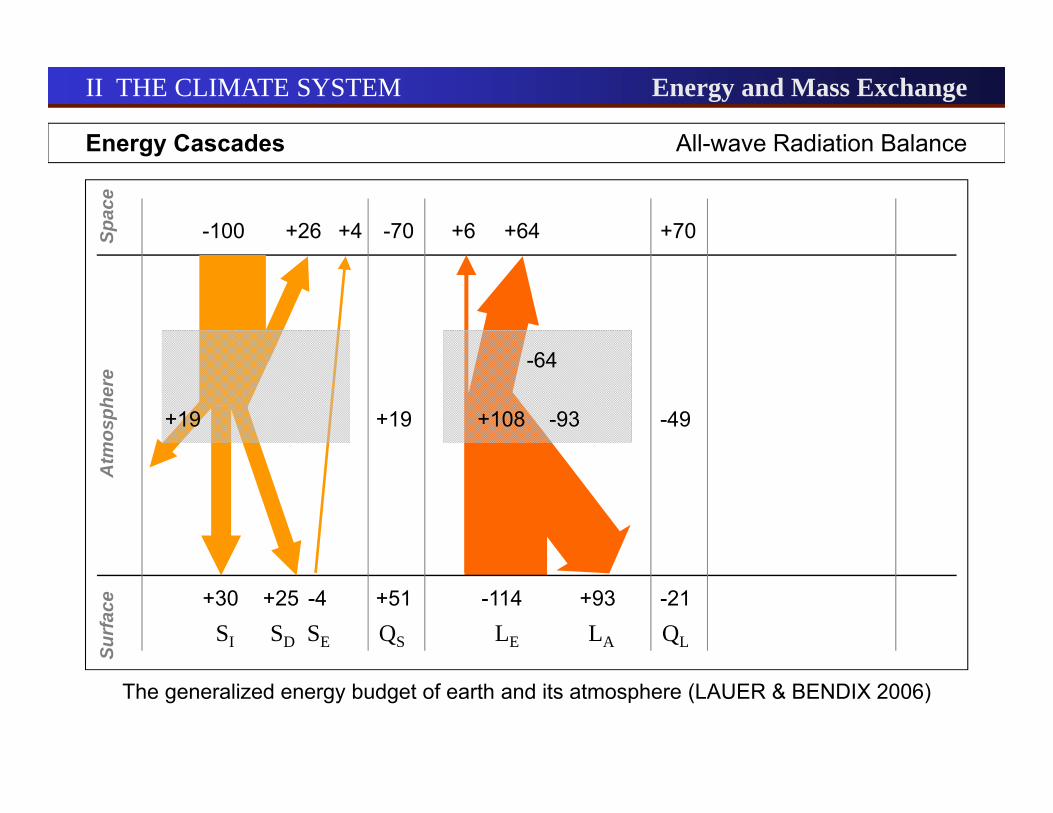
-100 +26 +4
+30 +25 -4
-70
+19
+51
+64+6
-114 +93
+19 +108 -93
-64
SI SD SE QS LE LA QL
+70
-49
-21
Energy Cascades All-wave Radiation Balance
The generalized energy budget of earth and its atmosphere (LAUER & BENDIX 2006)
II THE CLIMATE SYSTEM Energy and Mass ExchangeSu
rfac
eA
tmos
pher
eSp
ace
-100 +26 +4
+30 +25 -4
-70
+19
+51
0
-30
+30
+64+6
-114 +93
+19 +108 -93
-64
SI SD SE QS LE LA QLQ
Energy Cascades Radiation Balance
The generalized energy budget of earth and its atmosphere (LAUER & BENDIX 2006)
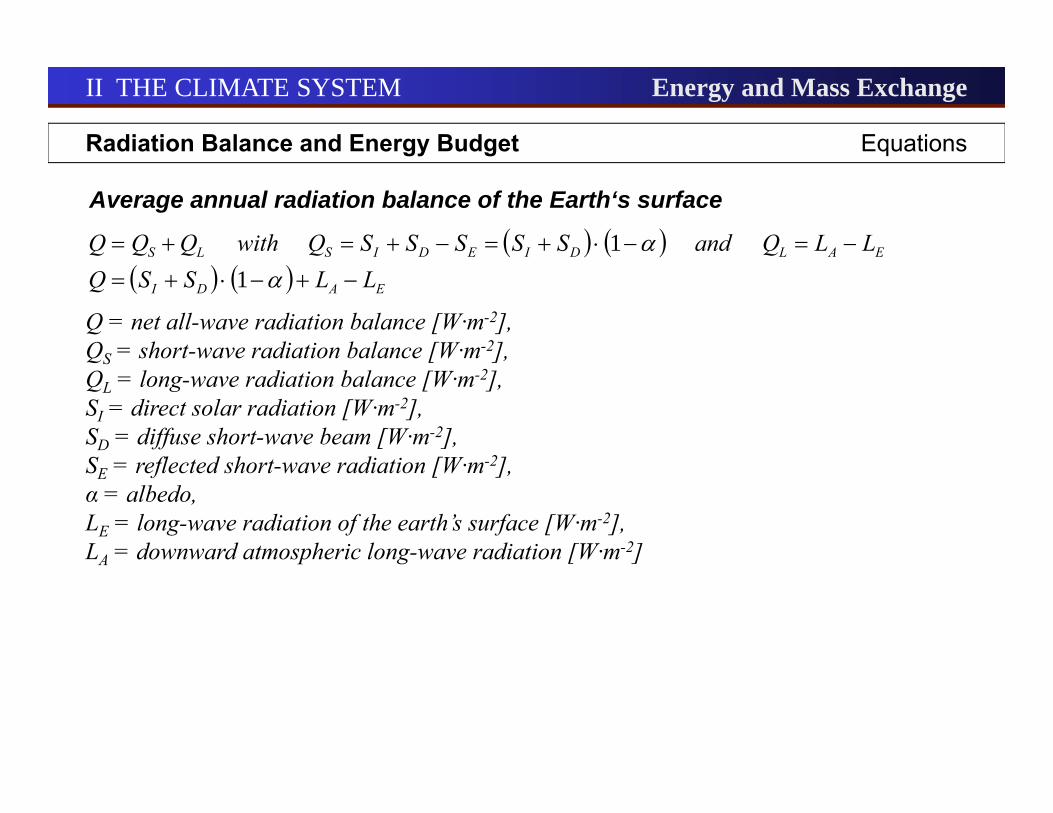
Q = net all-wave radiation balance [W·m-2],QS = short-wave radiation balance [W·m-2],QL = long-wave radiation balance [W·m-2],SI = direct solar radiation [W·m-2],SD = diffuse short-wave beam [W·m-2],SE = reflected short-wave radiation [W·m-2],α = albedo,LE = long-wave radiation of the earth’s surface [W·m-2],LA = downward atmospheric long-wave radiation [W·m-2]
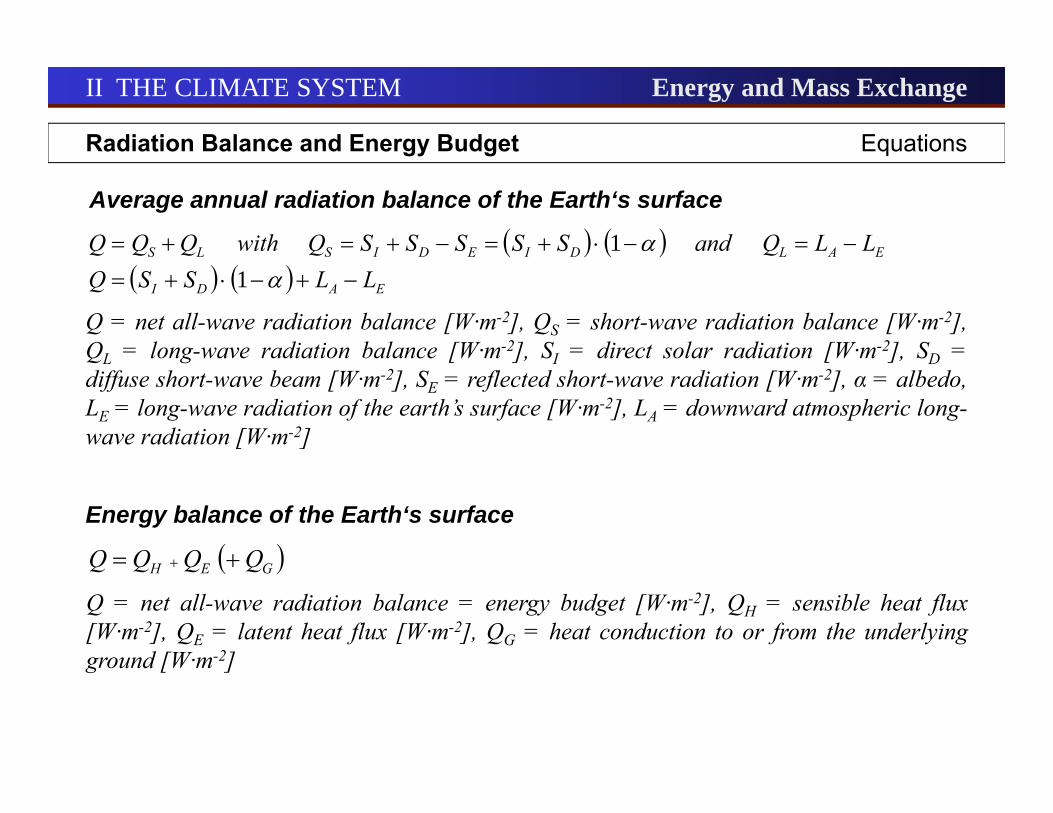
Average annual radiation balance of the Earth‘s surface
Radiation Balance and Energy Budget Equations
II THE CLIMATE SYSTEM Energy and Mass Exchange
EADI
EALDIEDISLS
LLSSQLLQandSSSSSQwithQQQ
11
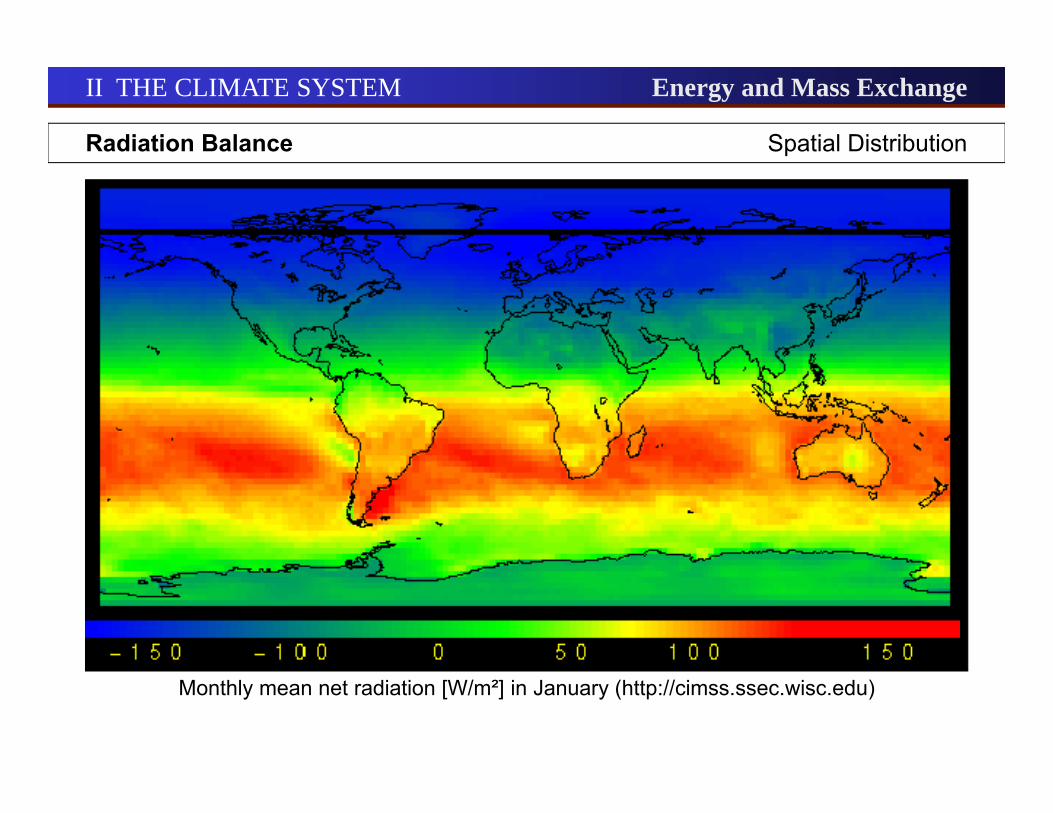
Radiation Balance Spatial Distribution
II THE CLIMATE SYSTEM Energy and Mass Exchange
Monthly mean net radiation [W/m²] in January (http://cimss.ssec.wisc.edu)
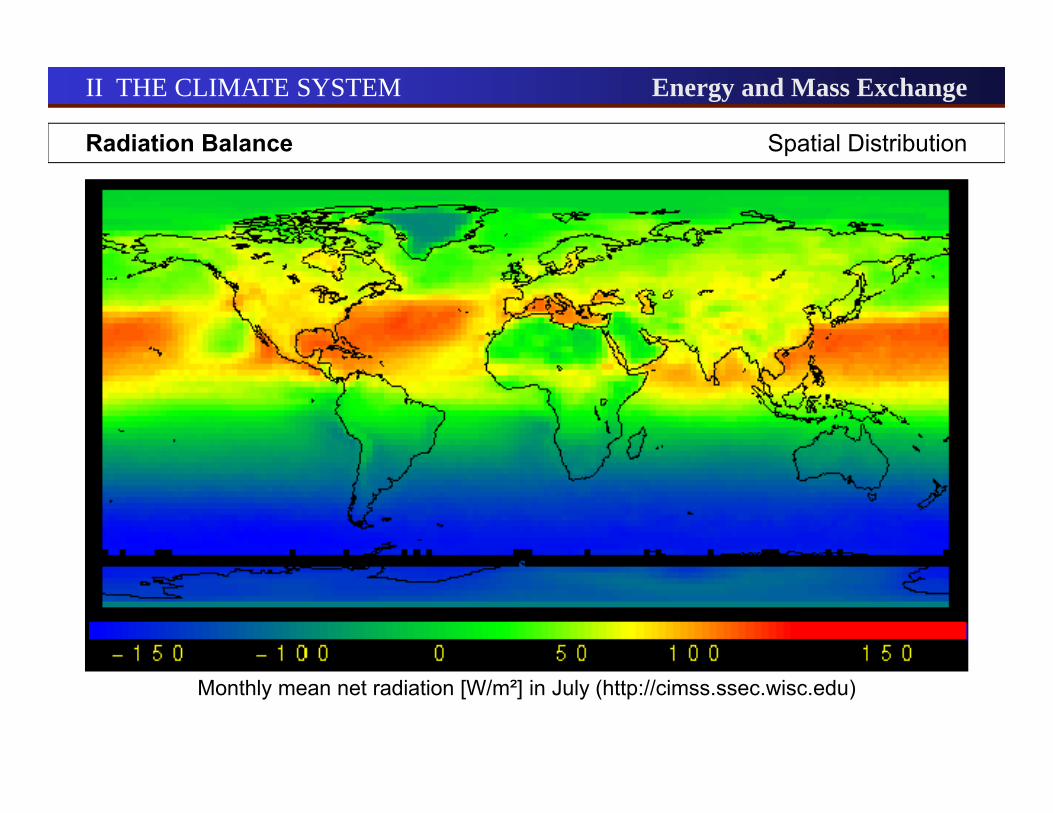
Radiation Balance Spatial Distribution
II THE CLIMATE SYSTEM Energy and Mass Exchange
Monthly mean net radiation [W/m²] in July (http://cimss.ssec.wisc.edu)
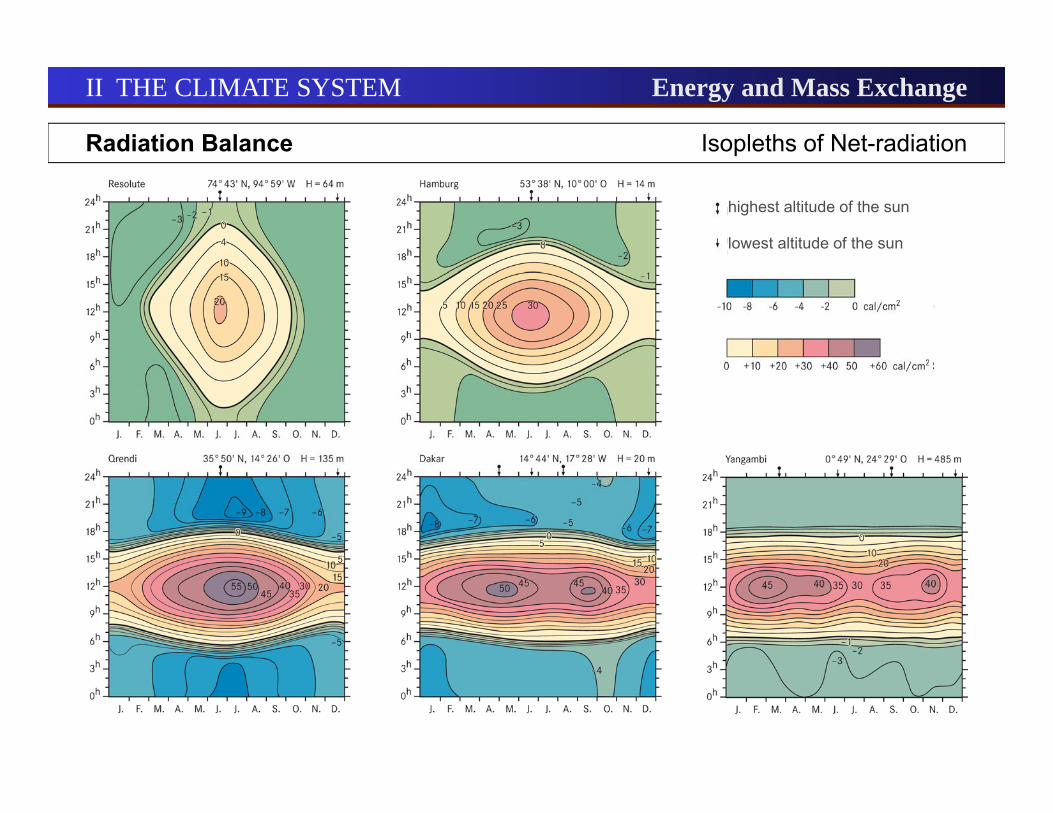
Radiation Balance Isopleths of Net-radiation
II THE CLIMATE SYSTEM Energy and Mass Exchange
highest altitude of the sun
lowest altitude of the sun

Energy Cascades Radiation Balance and Energy Budget
II THE CLIMATE SYSTEM Energy and Mass ExchangeSu
rfac
eA
tmos
pher
eSp
ace
-100 +26 +4
+30 +25 -4
0
+30
+64+6
-114 +93
+19 +108 -93
-64
SI SD SE QS LE LA QLQ-23 -7
+23 +7
0
0
0-30
QE QH
The generalized energy budget of earth and its atmosphere (LAUER & BENDIX 2006)
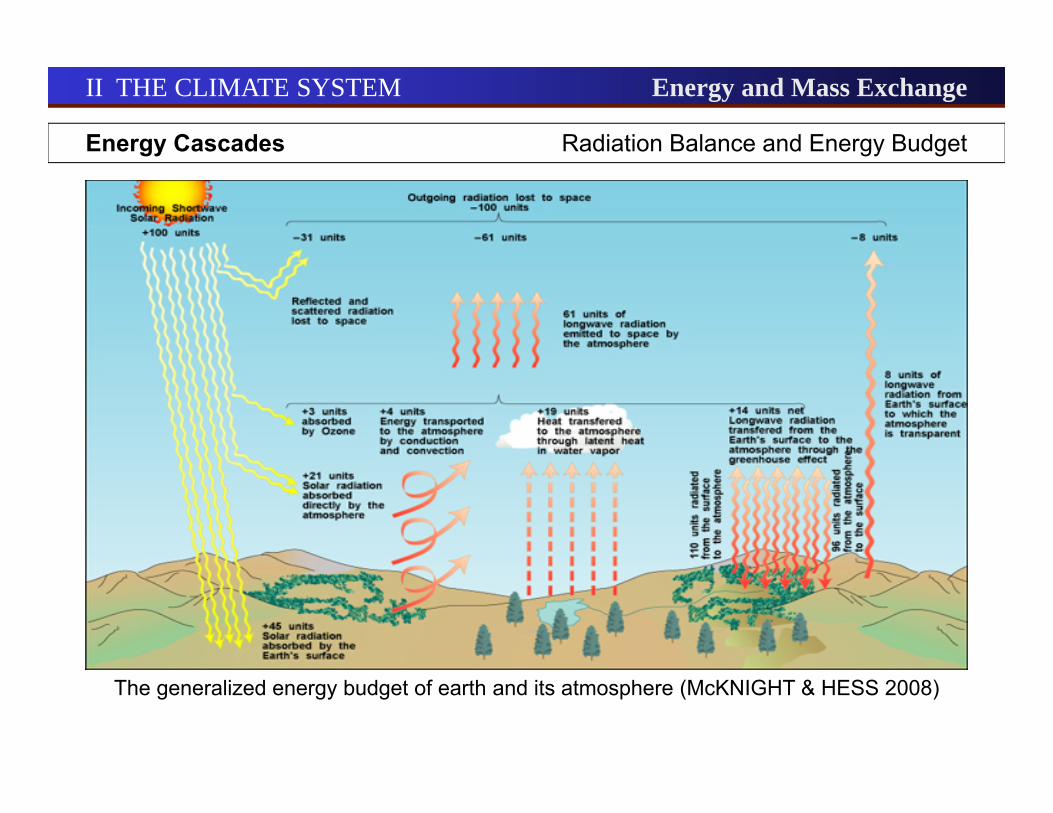
The generalized energy budget of earth and its atmosphere (McKNIGHT & HESS 2008)
Energy Cascades Radiation Balance and Energy Budget
II THE CLIMATE SYSTEM Energy and Mass Exchange

Q = net all-wave radiation balance [W·m-2], QS = short-wave radiation balance [W·m-2],QL = long-wave radiation balance [W·m-2], SI = direct solar radiation [W·m-2], SD =diffuse short-wave beam [W·m-2], SE = reflected short-wave radiation [W·m-2], α = albedo,LE = long-wave radiation of the earth’s surface [W·m-2], LA = downward atmospheric long-wave radiation [W·m-2]
Average annual radiation balance of the Earth‘s surface
Q = net all-wave radiation balance = energy budget [W·m-2], QH = sensible heat flux[W·m-2], QE = latent heat flux [W·m-2], QG = heat conduction to or from the underlyingground [W·m-2]
Energy balance of the Earth‘s surface
Radiation Balance and Energy Budget Equations
II THE CLIMATE SYSTEM Energy and Mass Exchange
GEH QQQQ
EADI
EALDIEDISLS
LLSSQLLQandSSSSSQwithQQQ
11
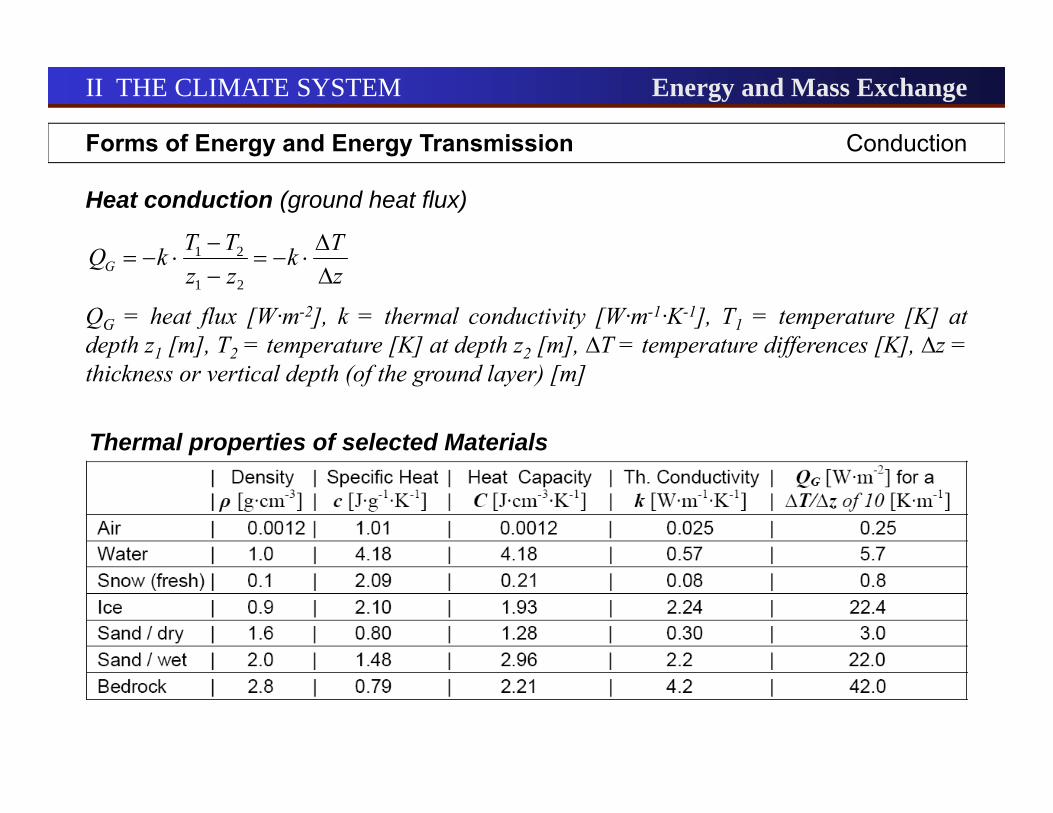
Forms of Energy and Energy Transmission Conduction
II THE CLIMATE SYSTEM Energy and Mass Exchange
QG = heat flux [W·m-2], k = thermal conductivity [W·m-1·K-1], T1 = temperature [K] atdepth z1 [m], T2 = temperature [K] at depth z2 [m], ∆T = temperature differences [K], ∆z =thickness or vertical depth (of the ground layer) [m]
Heat conduction (ground heat flux)
Thermal properties of selected Materials
zTk
zzTTkQG
21
21
21
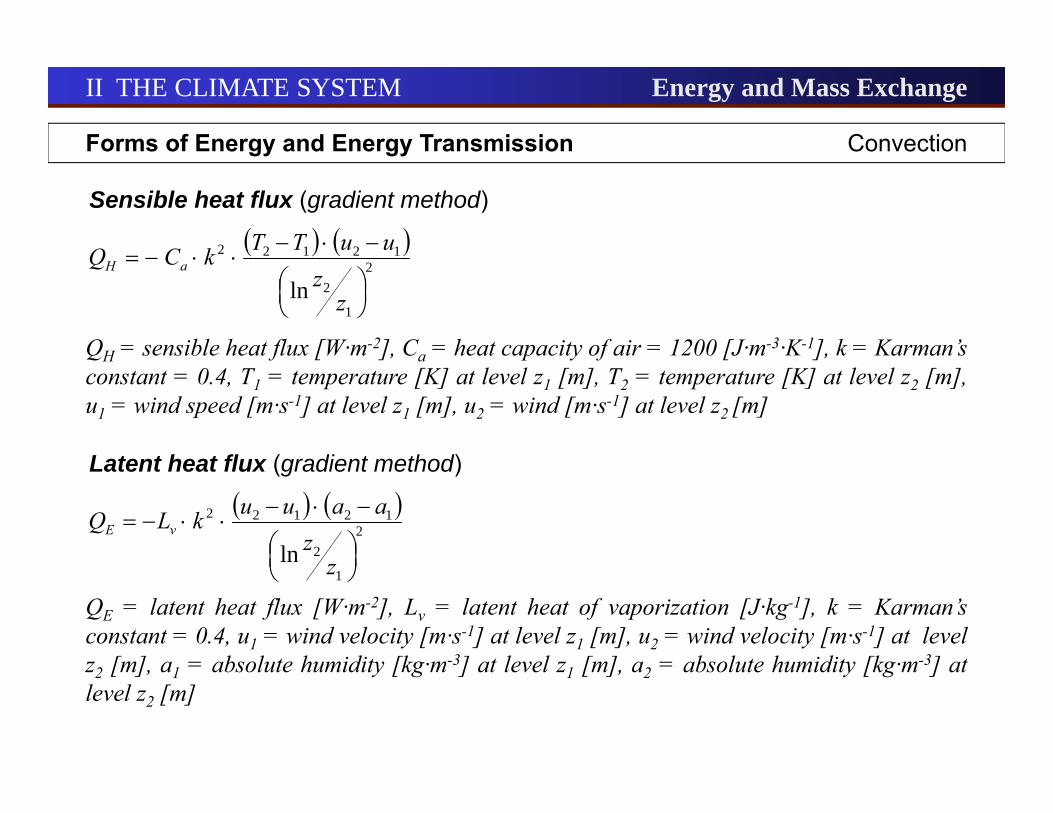
QH = sensible heat flux [W·m-2], Ca = heat capacity of air = 1200 [J·m-3·K-1], k = Karman’sconstant = 0.4, T1 = temperature [K] at level z1 [m], T2 = temperature [K] at level z2 [m],u1 = wind speed [m·s-1] at level z1 [m], u2 = wind [m·s-1] at level z2 [m]
Sensible heat flux (gradient method)
Forms of Energy and Energy Transmission Convection
II THE CLIMATE SYSTEM Energy and Mass Exchange
2
1
2
12122
ln
zz
uuTTkCQ aH
Latent heat flux (gradient method)
QE = latent heat flux [W·m-2], Lv = latent heat of vaporization [J·kg-1], k = Karman’sconstant = 0.4, u1 = wind velocity [m·s-1] at level z1 [m], u2 = wind velocity [m·s-1] at levelz2 [m], a1 = absolute humidity [kg·m-3] at level z1 [m], a2 = absolute humidity [kg·m-3] atlevel z2 [m]
2
1
2
12122
ln
zz
aauukLQ vE
Q = net all-wave radiation balance [W·m-2], QS = short-wave radiation balance [W·m-2],QL = long-wave radiation balance [W·m-2], SI = direct solar radiation [W·m-2], SD =diffuse short-wave beam [W·m-2], SE = reflected short-wave radiation [W·m-2], α = albedo,LE = long-wave radiation of the earth’s surface [W·m-2], LA = downward atmospheric long-wave radiation [W·m-2]
Average annual radiation balance of the Earth‘s surface
Q = net all-wave radiation balance = energy budget [W·m-2], QH = sensible heat flux[W·m-2], QE = latent heat flux [W·m-2], QG = heat conduction to or from the underlyingground [W·m-2]
Energy balance of the Earth‘s surface
Radiation Balance and Energy Budget Equations
II THE CLIMATE SYSTEM Energy and Mass Exchange
GEH QQQQ
EADI
EALDIEDISLS
LLSSQLLQandSSSSSQwithQQQ
11

Examples of the diur-nal course of compo-nents of the energybudget (GEBHARDTet al. 2007)
a) Coniferous forestnear Freiburg/Br. –28.04 - 30.04.1976
b) Desert surface inthe Gobi Desert –11.05 - 31.05.1931
c) Tropical Atlanticwith cloudless sky(8°30'N/23°30'W) –06.07.1974
Energy Budget Examples
II THE CLIMATE SYSTEM Energy and Mass Exchange
Radiation Balance (Q)
Latent Heat (QE)
Sensible Heat (QH)
Storage (QG)