production of milk clotting enzyme from distiller’s sludge ... · ... namely initial substrate...
TRANSCRIPT
IOSR Journal of Engineering (IOSRJEN) www.iosrjen.org
ISSN (e): 2250-3021, ISSN (p): 2278-8719
Vol. 7, Issue 11 (November. 2017), ||V1|| PP 56-67
International organization of Scientific Research56 | P a g e
Production of Milk Clotting Enzyme from Distiller’s Sludge by
Penicillium camemberti using Response Surface Methodology
A. S. SanthalinShellomith1and B. Preetha
2
1,2Department of Chemical Engineering, Annamalai University, Annamalai Nagar – 608 002, Chidambaram
,Tamilnadu , India. [email protected],
Abstract: In this study, the production of milk clotting enzyme was carried out by the Distillers yeast sludge
using the fungal culture Penicillium camemberti. Effects of different substrates on the production of milk
clotting enzyme were studied under stationary and shaking conditions. Highest milk clotting activity was
observed in the medium containing casein under static conditions. Central composite design experiments
werecarried out to optimize the parameters that brings outhigh yield milk clotting enzyme. Maximum milk
clotting activity of 0.785units/mg was obtained at optimum process conditions namely initial substrate
concentration 15 g/l, initial pH 5.9, temperature 39ºC and biomass concentration 15g/l. The Logistic model for
cell growth and Leudeking-Piret model for product formation kinetics were evaluated for the prediction of
experimental data .
Keywords: Milk clotting enzyme, Distiller’s sludge, Response surface methodology, Cell growth and Product
formation kinetics.
----------------------------------------------------------------------------------------------------------------------------- ----------
Date of Submission: 24-11-2017 Date of acceptance: 07-12-2017
----------------------------------------------------------------------------------------------------------------------------- ----------
I. INTRODUCTION Enzyme utilization in the food, beverage, detergent, pharmaceutical, chemical, leather, paper, pulp,
feed, and silk industries is remarkable. Proteases are an important group of enzymes which constitutes a large
product segment in the global industrial enzymes market[1]. The use of enzymes in different industries
increased due to industrialization and the different types of protease and amylase are randomly used in
industries including food, textile, and paper[2].Proteases become important industrial enzymes because of their
characteristics of biotechnological interest .
The rapid developments of food technology leads to increase the applications of enzyme technology
create the availability of food grade enzymes. Enzymes for food applications are obtained from animal, plant
and microbial sources. The majority of microbial industrial enzymes are extracellular hydrolases. Milk clotting
enzymes produced by microorganisms have been developed industrially to replace calf rennet to improve the
ratio of milk-clotting activity to proteolytic activity .Milk clotting enzyme is an important Protease enzyme
plays vital role in the cheese manufacturing Industry. Traditional cheese production by using Bovine rennet is
the oldest method.The growing demand for natural milk coagulants led to the necessity for rennet substitutes,
promoting a search for new sources of milk clotting proteases [3]
In this paper, the fungal culture Penicilliumcamembertiis used for the milk clotting enzyme production
which is used for the cheese making. Fungal enzymes contribute the good flavour and texture formation of the
food products due to the enzymatic activities of protease and lipases[4] .The distillers yeast sludge is used as a
substrate for the submerged production. The majority of the distillers uses molasses (from sugarcane) as a feed
stock.[5] and disposes the yeast sludge as the waste which is mainly composed of the rich minerals proteins and
rich carbon source, there is scope for using it advantageously as a good source for the industrial production of
the valuable bioproducts[6].
Response surface methodology (RSM) is an empirical statistical method utilized for multiple
regression analysis of quantitative data obtained from statistically designed experiments by solving the
multivariate equations simultaneously. The response surfaces are the graphical representation of the quadratic
equations could be applied to explain the individual and cumulative effect of the test variable response surfaces
and to find out the interaction between the test variables.[7,8]
1.1 Kinetics and modelling
The performances of microbial systems in the fermentation process are stated by various kinetic models contain
kinetics of growth, substrate uptake and product formation.[9]

Production of Milk Clotting Enzyme from Distiller’s Sludge by Penicillium camemberti using..
International organization of Scientific Research57 | P a g e
1.1.1Logistic Growth Model
Logistic equation is a substrate independent model. The Logistic curve is sigmoidal and leads to a stationary
population of size . Rate of growth of cell is proportional to the cell mass concentration present at
that time. The rate will stop when the cell mass concentration reaches stationary phase. When the cell mass
concentration is near the stationary phase rate will slow down.
kt
o
kt
o
e1βx1
exx
… (1)
Where xo is the initial biomass concentration (g/l) and t is time (h). Monod and the other models predict
that the growth will stop only when the limiting substrate concentration is exhausted. In reality due to the
accumulation of toxic metabolites or due to inhibition, the growth may stop even when substrate is present.
These conditions are taken care of by the Logistic model. The advantage of this model that it provides the
exponential phase and endogenous metabolic phase accurately.
1.1.2 Leudeking-Piret Kinetic Model
This model was originally developed for the formation of lactic acid by Lactobacillus delbrucckii. In
fermentations, especially those involving secondary metabolites, significant product formation does not occur
during the log phase where product formation is proportional to the growth rate of cells. The product formation
occurs late in the log phase or in the stationary phase. One such behaviour is the Leudeking-piret kinetic model.
This model combines both growth-associated and non-growth-associated models and proved extremely useful
and versatile in fitting product formation data from much different fermentation.
oLP
kt
s
osLPo xtxe
x
x
k
xptp
11 … (2)
where P(t) = product concentration at any time t (g/l), Po = initial product concentration (g/l), Xs = the biomass
concentration in stationery phase (g/l), Xo = initial biomass concentration (g/l), X(t) = biomass concentration at
any time (g/l), and , & k = constants.
In the present study, three different medium namely basal medium, casein and lactose along with basal
medium were studied under stationary and shaking conditions for the production of milk clotting enzyme by
Penicillium camemberti. The aim of this study was to find out the optimum process conditions for the selected
operating variables namely initial substrate concentration, initial pH, temperature and biomass concentration for
the maximum production of milk clotting enzyme using dried distiller’s sludge as substrate.
II. MATERIALS AND METHODS 2.1 Microorganism and its culture conditions
The bacterial culture Penicillium camemberti(MTCC 418) was obtained from Chandigarh, India. The
microorganism was grown aerobically in enrichment media containing following composition in 1000 ml
distilled water: Czapek concentrate, 10 ml; K2HPO4, 1.0 g/l; Yeast extract, 5.0 g/l; Sucrose, 30.0 g/l. The
compositions of czapek concentrate in 100ml are: Sodium nitrite, 30.0 g; Potassium chloride, 5.0 g; Magnesium
sulphate.7H2O, 5.0 g; Ferrous sulphate.7H2O, 0.1 g. The pH of the medium was adjusted to 6.0 using dilute
Hydrochloric acid. This strain was incubated at 30oC for 5 days and stored at 4
oC.
2.2 Materials
Fermentation experiments were performed using distiller’s sludge as substrate, obtained from EID Parry India
Ltd, Nellikkuppam, Tamil Nadu, India. The substrate was sun dried, powdered and stored for further use in the
experiments.
2.3 Batch Submerged Fermentation Studies
Submerged fermentations were carried out in 250 ml Erlenmeyer flasks with 100 ml of production
medium.. Known volume of 5 day old culture of Penicilliumcamembertiwas transferred to each 100 ml of
production medium in sterile conditions.The production was carried by both static and shaking conditions at 120
rpm. Experiments were repeated at least twice. Samples were taken from the solution at regular time intervals
for the analysis of milk clotting activity, proteolytic activity, biomass concentration and protein content.
The effect of different medium components on milk clotting enzyme production was investigated using three
different fermentation medium components namely plain basal medium (S1), casein (S2) and lactose (S3) along
with the basal medium. The culture was incubated at 30oC for 7 days under shaking and stationary conditions.
All the experiments were carried out in duplicates.
2.4 Experimental Design and Statistical Analysis
The factors affecting the production of milk clotting enzyme from distiller’s sludge by Penicillium
camembertiwas studied using Central Composite Design (CCD) experiments. The initial substrate concentration
1sx
Production of Milk Clotting Enzyme from Distiller’s Sludge by Penicillium camemberti using..
International organization of Scientific Research58 | P a g e
(A) g/l, initial pH (B), temperature (C) °C and biomass concentration (D) g/l were chosen as the independent
variables as shown in Table 1. Milk clotting activity (Y) was chosen as the dependent output variable. An
orthogonal 24
full factorial central composite design with eight star points ( =2) and seven replication at the
centre point, all in duplicates, resulting in a total of 31 experiments were used to optimize the chosen key
variables for the production of Milk clotting enzyme in a batch reactor.
The experiments with various initial substrate concentrations namely 5,10,15,20 and 25g/l, different
initial pH values of 5.0, 5.5, 6.0, 6.5 and 7.0, different temperatures of 30, 35, 40, 45 and 50oC and five different
biomass concentrations of 3.0, 6.0, 9.0, 12.0 and 15.0 g/l were employed and varied simultaneously to cover the
combinations of variables in the design. The range and the levels of the experimental variables investigated in
this study were given in Table 1. The chosen independent variables used in this experiment were coded
according to Eq. (3):
x
XXx oi
i
… (3)
Where xi is the coded value of the ith
variable, Xi is the uncoded value of the ith
test variable
and Xo is the uncoded value of the ith
test variable at the centre point
The behaviour of the system is explained by the following second- degree polynomial Eq. (4):
k
i
k
i
k
i
k
j
jiijiiiiio XXXXY1 1
1
1 2
2
… (4)
Where Y is the predicted response, o is the offset term, iis the coefficient of linear effect, ii is the
coefficient of squared effect and ijis the coefficient of interaction effect. This regression model can be used to
estimate the elliptical contours of a constant surface.
A statistical design package, Minitab 16 was used for regression analysis of the data obtained and to
estimate the coefficients of the second-degree polynomial equation. The equations were validated by the
statistical tests called the analysis of variance (ANOVA), to determine the significance of each term in the
equation fitted and to estimate the goodness of fit in each case. Response surfaces were drawn to determine the
individual and interactive effects of test variables on milk clotting activity.
2.5 Preparation of the Crude enzyme
The fermented medium was filtered to separate the biomass from the culture filtrate using whatman no 40 filter
paper. The filtrate was centrifuged at 4oC for 10 min at 10000 rpm in the cooling centrifuge. Then the
supernatant was used for the enzyme assays.
2.6 Analysis of crude enzyme
2.6.1 Estimation of Milk clotting activity
Milk clotting activity was determined by the method explained by Arimaet al[10] and Balls et al.[11]
using 0.1 (w/v) of rennin std. The substrateconcentration is 10g of skimmed milk powder in 0.01 moles. calcium
chloride. The reaction mixture contains 5 ml of skim milk and 1ml of enzyme and kept at 37oC. The curd
formation was observed by manually rotating the test tube from time to time and the end point is the semi
liquefied film appears on the side of the test tube above the milk. The clotting time was noted.
gxWutesT
MmgMCU
min/
... (5)
Where M is the milk factor, T is the clotting time of sample (min) and Wis the grams of enzyme added to the
substrate in 2.0 ml aliquot (g wt. x 2)
2.6.2 Estimation of Proteolytic activity
Proteolytic activity was determined by the universal protease activity assay using casein as a substrate.
The reaction mixture containing 5 ml of 0.65% preincubated casein solution at37oC for 10min and 1ml of
enzyme added to standard and crude .The tubes were incubated for 10 min at 37oC. 5 ml of TCA was added to
stop the reaction and incubated at 37oC for 30 min. Tyrosine standard was set up (0.2mg/ml) in the range of 0.1-
0.5ml and made up to 2ml with distilled water. The test solutions were centrifuged at 4oC at 10000 rpm for 10
min and the 2ml of aliquots were used for finding Proteolytic activity. To all the tubes (including standard), 5 ml
of sodium carbonate, 1ml of Folin’s phenol was added and incubated at 37oC for 30 min and the optical density
was measured at 660 nm using UV-Biospectrophotometer, which directly expresses the Proteolytic
activity[12,13]
... (6) 2101
11releasedsequivalenttyrosineμmole/
XX
XenzymemlUnits

Production of Milk Clotting Enzyme from Distiller’s Sludge by Penicillium camemberti using..
International organization of Scientific Research59 | P a g e
Where 11 is the total volume of assay(ml), 10 is the time of assay as per the unit definition (min), 1is the volume
of enzyme used(ml) and 2is the volume used in colorimetric determination(ml).
2.6.3 Determination of Protein
Protein was estimated by Lowry method [14]using BSA (200µg per ml concentration) as a standard.
0.2 to 1.0 ml of the working standards and 0.2 ml of the unknown crude sample were taken in a series of test
tubes. The volume was made up to 1 ml with distilled water. 5 ml of the alkaline copper reagent was added to all
the tubes and incubated for 10 min at room temperature Then 0.5 ml of Folin ‘s phenol reagent was added to all
the tubes and incubated at dark room for 30 min and the optical density was measured for 660 nm.
2.6.4 Estimation of Biomass concentration
Samples from the production medium were filtered through whatmann no .40 filter paper to separate the
biomass. The settled biomass was collected and dried and expressing the dry weight as grams per litre of growth
medium.
III. RESULTS AND DISCUSSION
3.1Effect of different medium components on milk clotting enzyme production
In order to optimize the medium components and culture conditions capable of inducing high milk
clotting and low proteolytic activities, three different media were tested. It was found that static conditions
influenced the growth of Penicillium camemberti thereby increasing milk clotting enzyme production. Fig 1
shows the maximum biomass concentration of 40.5g/l was obtained in presence of casein, followed by 36g/l
culture in plain basal medium, while lactose had the least biomass yield of 35.3g/l culture medium under
staticconditions. Fig 2 clearly indicates that the addition of casein provided higher milk clotting activity than
lactose & plain basal medium andit was proved that the Distillers yeast sludge with casein is best medium for
maximum milk clotting enzyme production under static condition. The combination of casein with the substrates
is an enhancer for the enzyme coagulant[15]High milk clotting activity of 0.779units/mg and low proteolytic
activity of 0.60units/mg was observed in S2, presence of casein stimulates the milk clotting activity and
metabolism of the microorganism during the fermentation process.
Fig 1 Effect of different medium components on
biomass concentration by Penicillium camemberti
Fig 2 Effects of different medium components on
milk clotting enzyme production by
Penicillium camemberti
3.2 Central composite design and optimization using response surface methodology for the production of
milk clotting enzyme
The coded values of the independent variables along with observed responses in each case were given
in Table 2. By applying multiple regression analysis, a predictive quadratic model was fitted with experimental
results, and the equation for the production of milk clotting enzyme was in the form of the following equation:
Y=0.685-0.009A-0.037B-0.014C+0.022D-0.053A2-0.025B
2-0.106C
2+0.011D
2-0.024AB+0.011AC-
0.022AD+0.023BC+0.006BD-0.007CD ... (7)
where Y is the milk clotting activity (units/mg), A is the initial substrate concentration (g/l), B is the initial pH,
C is the temperature (oC) and D is the biomass concentration (g/l).. The milk clotting observation during enzyme
analysis for all 31 experimental run were given in Table 3. It was found that the milk clotting activity mainly
depends on clotting time and enzyme concentration. Complete settling with good texture was observed after 5
min when the pH was maintained at 6.0 and all other parameter values were low level. And the complete
clotting with fine texture was observed within 2 min .at slightly higher level of temperature and the other
Production of Milk Clotting Enzyme from Distiller’s Sludge by Penicillium camemberti using..
International organization of Scientific Research60 | P a g e
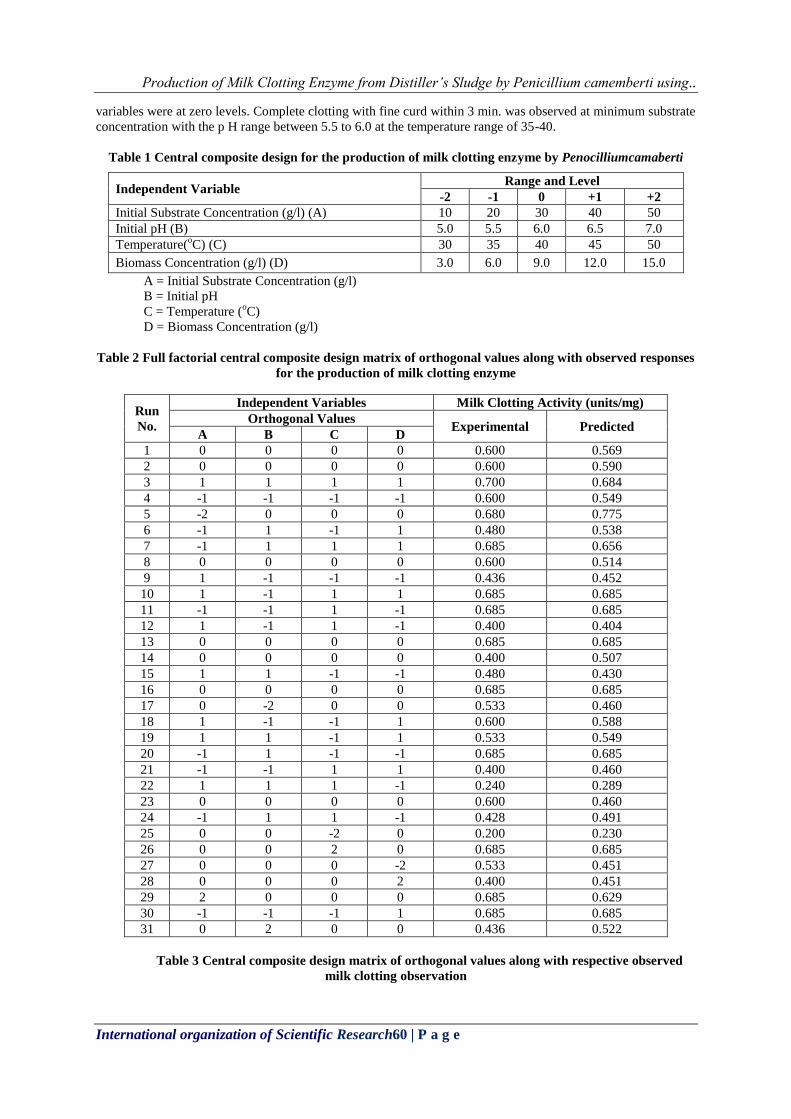
variables were at zero levels. Complete clotting with fine curd within 3 min. was observed at minimum substrate
concentration with the p H range between 5.5 to 6.0 at the temperature range of 35-40.
Table 1 Central composite design for the production of milk clotting enzyme by Penocilliumcamaberti
Independent Variable Range and Level
-2 -1 0 +1 +2
Initial Substrate Concentration (g/l) (A) 10 20 30 40 50
Initial pH (B) 5.0 5.5 6.0 6.5 7.0
Temperature(oC) (C) 30 35 40 45 50
Biomass Concentration (g/l) (D) 3.0 6.0 9.0 12.0 15.0
A = Initial Substrate Concentration (g/l)
B = Initial pH
C = Temperature (oC)
D = Biomass Concentration (g/l)
Table 2 Full factorial central composite design matrix of orthogonal values along with observed responses
for the production of milk clotting enzyme
Run
No.
Independent Variables Milk Clotting Activity (units/mg)
Orthogonal Values Experimental Predicted
A B C D
1 0 0 0 0 0.600 0.569
2 0 0 0 0 0.600 0.590
3 1 1 1 1 0.700 0.684
4 -1 -1 -1 -1 0.600 0.549
5 -2 0 0 0 0.680 0.775
6 -1 1 -1 1 0.480 0.538
7 -1 1 1 1 0.685 0.656
8 0 0 0 0 0.600 0.514
9 1 -1 -1 -1 0.436 0.452
10 1 -1 1 1 0.685 0.685
11 -1 -1 1 -1 0.685 0.685
12 1 -1 1 -1 0.400 0.404
13 0 0 0 0 0.685 0.685
14 0 0 0 0 0.400 0.507
15 1 1 -1 -1 0.480 0.430
16 0 0 0 0 0.685 0.685
17 0 -2 0 0 0.533 0.460
18 1 -1 -1 1 0.600 0.588
19 1 1 -1 1 0.533 0.549
20 -1 1 -1 -1 0.685 0.685
21 -1 -1 1 1 0.400 0.460
22 1 1 1 -1 0.240 0.289
23 0 0 0 0 0.600 0.460
24 -1 1 1 -1 0.428 0.491
25 0 0 -2 0 0.200 0.230
26 0 0 2 0 0.685 0.685
27 0 0 0 -2 0.533 0.451
28 0 0 0 2 0.400 0.451
29 2 0 0 0 0.685 0.629
30 -1 -1 -1 1 0.685 0.685
31 0 2 0 0 0.436 0.522
Table 3 Central composite design matrix of orthogonal values along with respective observed
milk clotting observation

Production of Milk Clotting Enzyme from Distiller’s Sludge by Penicillium camemberti using..
International organization of Scientific Research61 | P a g e
Table 4 Significance of regression coefficients for the production of milk clotting enzyme using Minitab
16 software
Model Term Parameter estimate
( Coefficients)
Constant 0.685 23.566 0.000
A -0.009 -0.616 0.541
B -0.037 -2.368 0.031
C -0.014 -0.945 0.359
D 0.022 1.455 0.165
A *A -0.053 -3.716 0.002
B * B -0.025 -1.795 0.092
C * C -0.106 -7.401 0.000
D * D 0.011 0.769 0.453
A * B -0.024 -1.268 0.223
A * C 0.011 0.611 0.550
A * D -0.022 -1.157 0.264
B * C 0.023 1.242 0.232
B * D 0.006 0.345 0.735
C * D -0.007 -0.377 0.711
A, B,C,D = Linear effects
A2, B
2, C
2, D
2 = Squared effects
Production of Milk Clotting Enzyme from Distiller’s Sludge by Penicillium camemberti using..
International organization of Scientific Research62 | P a g e
AB, AC, AD, BC, BD, CD = Interaction effects
B = Significant
A * A = Significant
B * B = Significant
C * C = Significant
Table 5Analysis of Variance (ANOVA) for the selected quadratic model for the Production of milk
clotting enzyme
Sources of
variation Sum of squares
Degrees of
Freedom Mean square F P
Regression
0.483 14 0.034 5.84 0.001
Linear
0.053 4 0.013 2.25 0.109
Square
0.400 4 0.100 16.93 0.000
Interaction 0.030 6 0.005 0.85 0.548
Residual error 0.094 16 0.005
Total 0.578 30
Square = Significant
The student t distribution and corresponding p values, along with the parameter estimate were given in Table
4.The linear effect of pH was found to be significant. The squared effects of theparameters(A*A,B
*B,C
*C)were
also found to be significant and the coefficient of the effect of temperature(p = 0.0001)was found to be highly
significant. The statistical significance of each term in the quadratic model was validated by the statistical tests
called the Analysis-of-variance (ANOVA) and the results were given in Table 5. ANOVA of the regression
model was highly significant and it was evident from the calculated F value (5.84) and a very low probability.
The coefficient for the squared effect was highly significant (p=0.0001) when compared with the linear and
interactive effects.
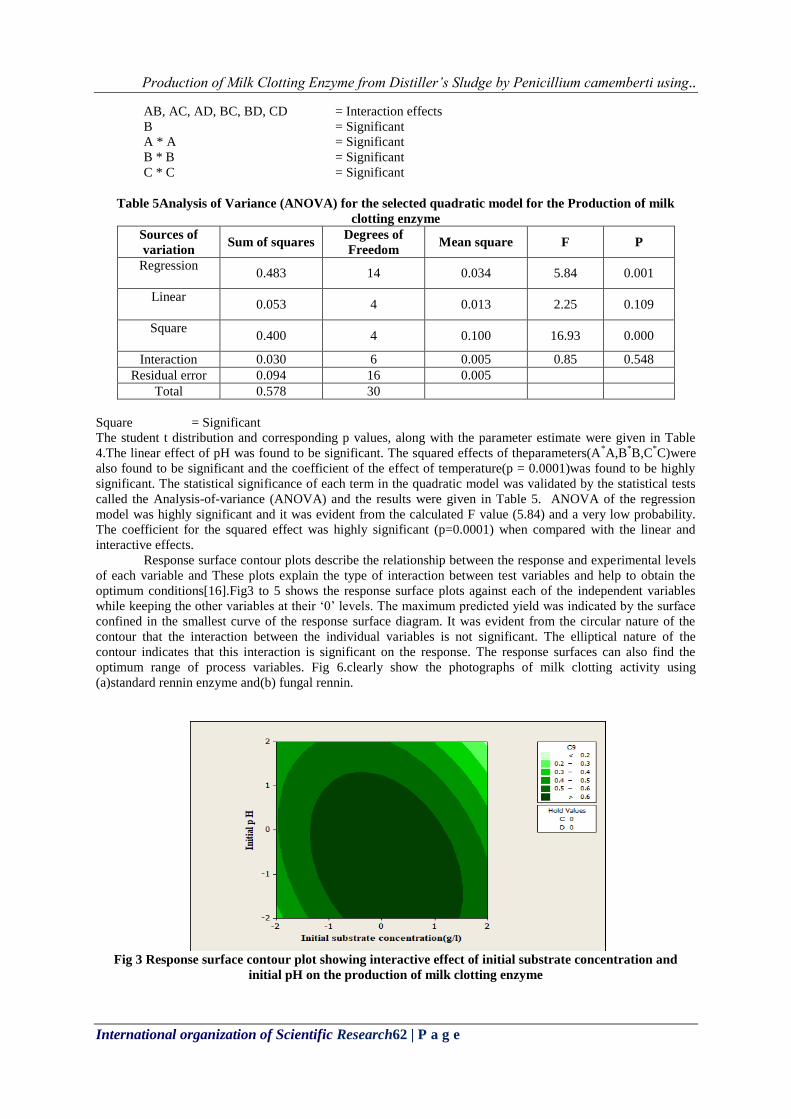
Response surface contour plots describe the relationship between the response and experimental levels
of each variable and These plots explain the type of interaction between test variables and help to obtain the
optimum conditions[16].Fig3 to 5 shows the response surface plots against each of the independent variables
while keeping the other variables at their ‘0’ levels. The maximum predicted yield was indicated by the surface
confined in the smallest curve of the response surface diagram. It was evident from the circular nature of the
contour that the interaction between the individual variables is not significant. The elliptical nature of the
contour indicates that this interaction is significant on the response. The response surfaces can also find the
optimum range of process variables. Fig 6.clearly show the photographs of milk clotting activity using
(a)standard rennin enzyme and(b) fungal rennin.
Fig 3 Response surface contour plot showing interactive effect of initial substrate concentration and
initial pH on the production of milk clotting enzyme

Production of Milk Clotting Enzyme from Distiller’s Sludge by Penicillium camemberti using..
International organization of Scientific Research63 | P a g e
Fig 4 Response surface contour plot showing interactive effect of initial pH and temperature on the
production of milk clotting enzyme
Fig 5 Response surface contour plot showing interactive effect of temperature and initial substrate
concentration on the production of milk clotting enzyme
(a) (b)
(a) Standard Rennin (b) Fungal Rennin
Fig 6 Milk clotting observation for the produced enzyme using distiller’s sludge and Standard
Rennin (Calf Chymosin)
Production of Milk Clotting Enzyme from Distiller’s Sludge by Penicillium camemberti using..
International organization of Scientific Research64 | P a g e
To validate the optimal parameters, confirmatory experiments were carried out by lab scale production.
The observed results were compared with the predicted results. The process conditions for the maximum
production of milk clotting enzyme by Penicillium camembertiunder optimized conditions were given in Table
6. Milk Clotting Activity 0.785units/mg(MCA), Proteolytic Activity0.610units/mg (PA), the ratio MCA/PA1.28
and protein content 0.882mg/ml were found under optimum conditions . These values agree with the values
from the response surface analysis (MCA=0.7941units/mg) confirming that the RSM using statistical design of
experiments can be effectively used to optimize the process parameters and to study the importance of
individual, cumulative and interactive effects of the test variables in milk clotting enzyme production.
Table 6 Optimum values of variables obtained from regression equations for the production of milk
clotting enzyme by Penicillium camemberti
Parameter Optimum value for milk clotting enzyme
production
Initial Substrate Concentration(g/l) 25g/l
Initial pH 5.9
Temperature(oC) 39
Biomass Concentration (g/l) 15g/l
Milk Clotting Activity (units/mg) 0.7941
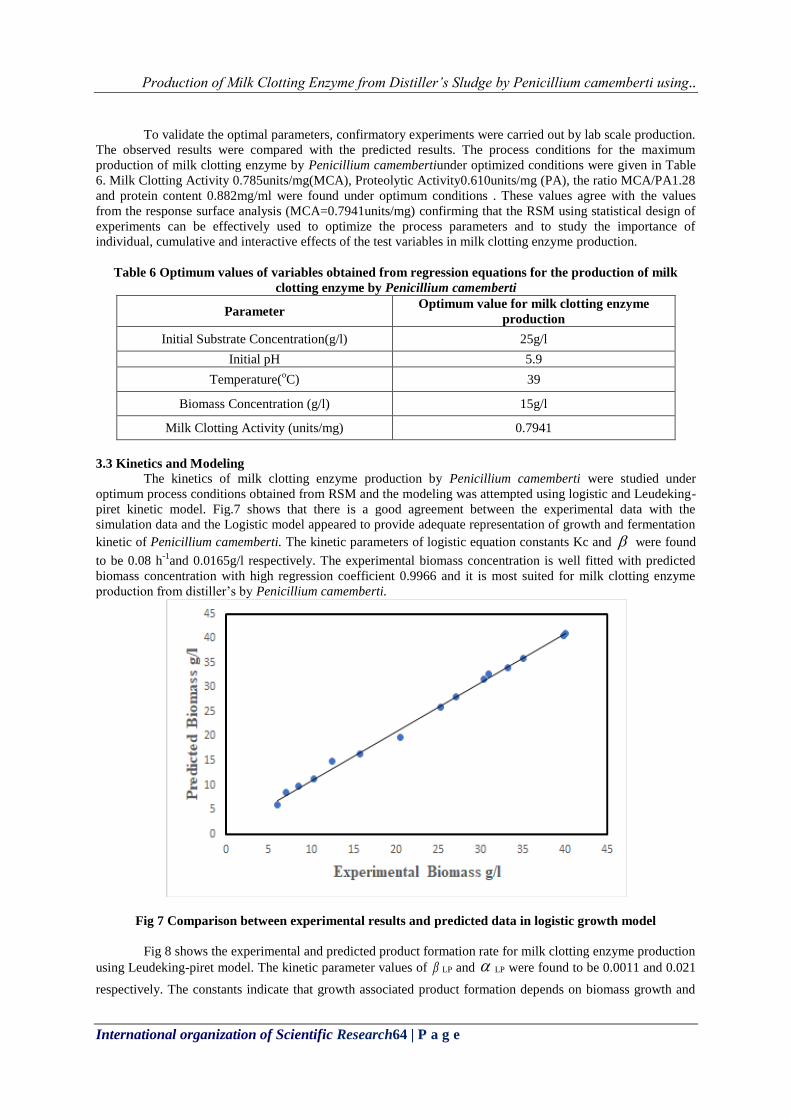
3.3 Kinetics and Modeling
The kinetics of milk clotting enzyme production by Penicillium camemberti were studied under
optimum process conditions obtained from RSM and the modeling was attempted using logistic and Leudeking-
piret kinetic model. Fig.7 shows that there is a good agreement between the experimental data with the
simulation data and the Logistic model appeared to provide adequate representation of growth and fermentation
kinetic of Penicillium camemberti. The kinetic parameters of logistic equation constants Kc and were found
to be 0.08 h-1
and 0.0165g/l respectively. The experimental biomass concentration is well fitted with predicted
biomass concentration with high regression coefficient 0.9966 and it is most suited for milk clotting enzyme
production from distiller’s by Penicillium camemberti.
Fig 7 Comparison between experimental results and predicted data in logistic growth model
Fig 8 shows the experimental and predicted product formation rate for milk clotting enzyme production
using Leudeking-piret model. The kinetic parameter values of LP and LP were found to be 0.0011 and 0.021
respectively. The constants indicate that growth associated product formation depends on biomass growth and
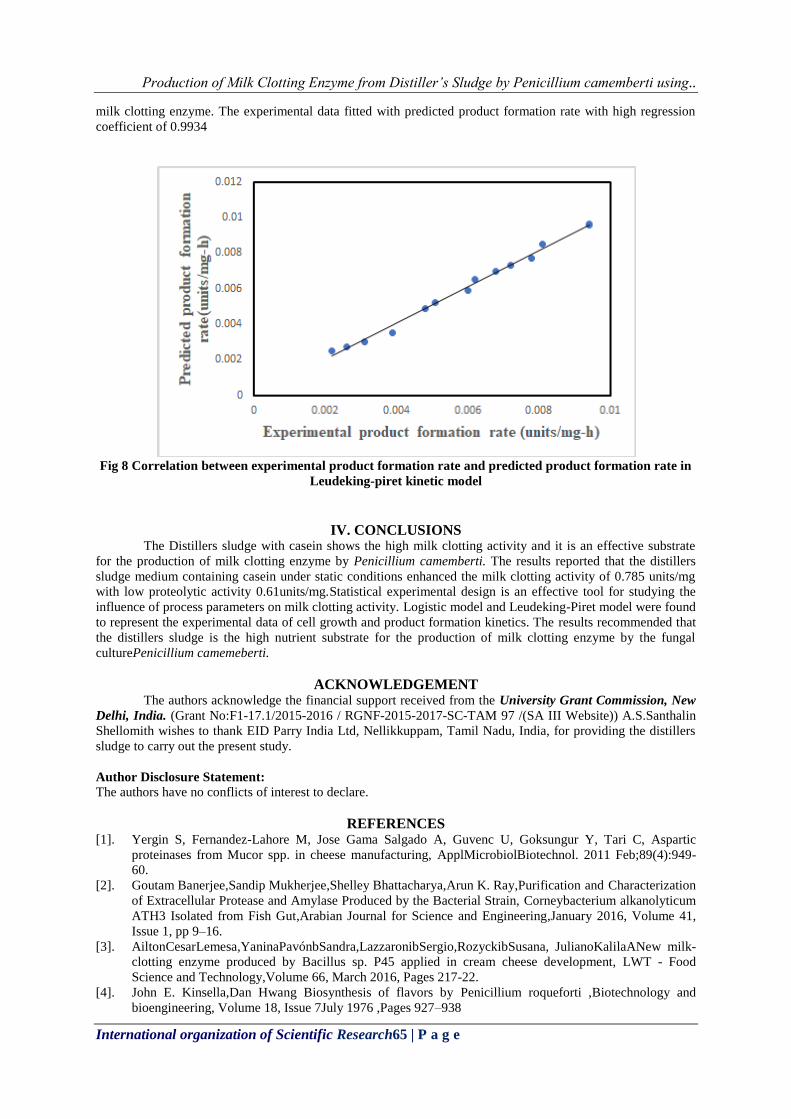
Production of Milk Clotting Enzyme from Distiller’s Sludge by Penicillium camemberti using..
International organization of Scientific Research65 | P a g e
milk clotting enzyme. The experimental data fitted with predicted product formation rate with high regression
coefficient of 0.9934
Fig 8 Correlation between experimental product formation rate and predicted product formation rate in
Leudeking-piret kinetic model
IV. CONCLUSIONS The Distillers sludge with casein shows the high milk clotting activity and it is an effective substrate
for the production of milk clotting enzyme by Penicillium camemberti. The results reported that the distillers
sludge medium containing casein under static conditions enhanced the milk clotting activity of 0.785 units/mg
with low proteolytic activity 0.61units/mg.Statistical experimental design is an effective tool for studying the
influence of process parameters on milk clotting activity. Logistic model and Leudeking-Piret model were found
to represent the experimental data of cell growth and product formation kinetics. The results recommended that
the distillers sludge is the high nutrient substrate for the production of milk clotting enzyme by the fungal
culturePenicillium camemeberti.
ACKNOWLEDGEMENT The authors acknowledge the financial support received from the University Grant Commission, New
Delhi, India. (Grant No:F1-17.1/2015-2016 / RGNF-2015-2017-SC-TAM 97 /(SA III Website)) A.S.Santhalin
Shellomith wishes to thank EID Parry India Ltd, Nellikkuppam, Tamil Nadu, India, for providing the distillers
sludge to carry out the present study.
Author Disclosure Statement:
The authors have no conflicts of interest to declare.
REFERENCES [1]. Yergin S, Fernandez-Lahore M, Jose Gama Salgado A, Guvenc U, Goksungur Y, Tari C, Aspartic
proteinases from Mucor spp. in cheese manufacturing, ApplMicrobiolBiotechnol. 2011 Feb;89(4):949-
60.
[2]. Goutam Banerjee,Sandip Mukherjee,Shelley Bhattacharya,Arun K. Ray,Purification and Characterization
of Extracellular Protease and Amylase Produced by the Bacterial Strain, Corneybacterium alkanolyticum
ATH3 Isolated from Fish Gut,Arabian Journal for Science and Engineering,January 2016, Volume 41,
Issue 1, pp 9–16.
[3]. AiltonCesarLemesa,YaninaPavónbSandra,LazzaronibSergio,RozyckibSusana, JulianoKalilaANew milk-
clotting enzyme produced by Bacillus sp. P45 applied in cream cheese development, LWT - Food
Science and Technology,Volume 66, March 2016, Pages 217-22.
[4]. John E. Kinsella,Dan Hwang Biosynthesis of flavors by Penicillium roqueforti ,Biotechnology and
bioengineering, Volume 18, Issue 7July 1976 ,Pages 927–938
Production of Milk Clotting Enzyme from Distiller’s Sludge by Penicillium camemberti using..
International organization of Scientific Research66 | P a g e
[5]. Yashpal Singh,Management of Spent Wash in Distilleries,Environment and Waste,
www.wealthywaste.com/management-of-spent-wash-in-distilleries
[6]. BaskarM, KayalvizhiC,and Subash Chandra Bose M, Eco-Friendly Utilisation Of Distillery Effluent In
Agriculture - A Review, Agric. Rev., 24 (1) : 16 - 30, 2003
[7]. Khuri, A. I and Cornell J.A. Response Surfaces: Design and Analysis. Marcel Dekker, New York. ,1982.
[8]. Montgomery, D. C. Design and Analysis of experiments.3rd edn, Wiley, New York,1981. 13.Anson,
M.L., J.Gen. Physiol,1938,22: p. 79-89,
[9]. Bailey, J. E., and D. F. Ollis, Biochemical Engineering Fundamentals. McGraw-Hill, New York,1986
[10]. Arima K Iwasaki,S.,Tamura,G..Milk clotting Enzyme from microorganisms, PartI: Screening test and
identification of the potent fungus. J AgrBiolChem, 1967.31: 540-543.
[11]. Balls A.K and Hoover, S.R., J.Biol, Chem. 1937,121, 737
[12]. Anson, M.L.,J.Gen.Phsiol,1938,22:p.79-89.
[13]. Chwen-Jen Shieh, Lan-Anh Phan Thi, Ing-Lung Shin, Milk clotting Enzyme Produced by culture of
Bacillus natto,.Biochemical engineering journal,2009,43: 85-91.
[14]. Lowry, O., Rosebrough, N.J. Farr, A.L., and Randal, R.J. Protein Measurement with folin phenol reagent.
J.Biol.Chem.1951.193:265
[15]. Silva,B.L.,The Production and Characterization of a Milk-clotting Protease Produced in Submerged
Fermentation by the Thermophilic Fungus Thermomucorindicae-seudaticae
N31‖,Appl.BiochemBiotechnol 172,2014
[16]. SilversteinR. M. Bassler G. C. Morrill.T. C. Spectrometric Identification of Organic Compounds. 4th Ed.
New York: Wiley,1981, Description of mass spectrometry, IR spectrometry, 1H NMR spectrometry, 13C
spectrometry, and UV spectrometry

Production of Milk Clotting Enzyme from Distiller’s Sludge by Penicillium camemberti using..
International organization of Scientific Research67 | P a g e
A. S. SanthalinShellomith "Production of Milk Clotting Enzyme from Distiller’s Sludge by
Penicillium camemberti using Response Surface Methodology.” IOSR Journal of Engineering
(IOSRJEN), vol. 07, no. 11, 2017, pp. 56-67.