procedure for layout tool demo: - taylor university · web viewthe developers will require a faster...
TRANSCRIPT
Performance Tuning: What Every WebFOCUS Customer Should Know
Part 1: WebFOCUS Reporting Server
Lori PieperInformation Builders
Information Builders Summit 2016 User ConferenceJune 13 - 17, 2016
Author: Lori Pieper
Company: Information BuildersPresentation Title: Performance Tuning: What Every WebFOCUS Customer Should Know – Part 1: WebFOCUS Reporting Server
Presentation Abstract: WebFOCUS depends upon many other systems and databases, so when things begin to slow down, how do you know where to start? This lab will walk you through an example of how to use tools in the WebFOCUS web console. These tools will prove invaluable in helping to identify bottlenecks in your environment. In Part 1 we concentrate on the performance of the WebFOCUS Reporting Server.
Business Need: Your developers and/or users come to you and say, “WebFOCUS is slow.” What do you do? Where do you begin? This will give you several steps you can take to identify the bottlenecks that customers experience most often; including some key investigative questions to ask the users. We’ll then look at how to use the tools available to you to identify several very common performance bottlenecks.
Performance Tuning Page 1 of 58 5/9/2023Copyright © 2015 Information Builders
Table of Contents
First Step: Do Some Investigative Work................................................................3Understanding the WebFOCUS Architecture........................................................4
Development and User Tier...............................................................................4Performance Considerations..........................................................................5
Web Tier............................................................................................................6Performance Considerations..........................................................................7
Data Access Tier...............................................................................................7Performance Considerations........................................................................10
WebFOCUS Reporting Server Performance Lab................................................11Step 1 – Set up the WFRS Web Console to monitor agent activity.................11Step 2 – Open a new browser window and sign in to the WebFOCUS Portal.20Step 3 – Run procedures and observe the activity to identify performance bottlenecks.......................................................................................................23
Example 1 – The report runs fine.................................................................23Example 2 – The report runs for a long time in the database.......................27Example 3 – The report does not take long in the database, but it takes a long time to transfer data to the browser......................................................30Example 4 – The report does not take a long time in the database, but WebFOCUS needs to do some additional work...........................................31Example 5 – Joining data from disparate databases....................................34Example 6 – Using SAMEDB.......................................................................36Example 7 – Running reports from the BI Portal..........................................38
In Conclusion: What’s Next?...............................................................................40Appendix – Miscellaneous Performance Tidbits..................................................43
View Generated SQL.......................................................................................43The SQL tracing option................................................................................43The Developer Studio/ App Studio Option...................................................44
On Demand Paging / Pages On Demand........................................................47WebFOCUS Stress Test Tool..........................................................................48Run Deferred Option........................................................................................49WebFOCUS Client Session Monitor................................................................50WebFOCUS Reporting Server Data Services Options....................................54WebFOCUS Hyperstage..................................................................................56
Performance Tuning Page 2 of 58 5/9/2023Copyright © 2015 Information Builders
First Step: Do Some Investigative Work
You will see that there are many aspects to the WebFOCUS architecture and there are many factors in the environment that can improve overall performance or hinder that performance. Your first step in identifying a performance bottleneck is to do some investigative work to narrow the scope. These are questions based upon examples of real life performance bottlenecks that I have seen at customer sites:
Is everyone having issues or is it a subset of users? If it is a subset of users:o Are the users who are experiencing issues accessing WebFOCUS from
inside the firewall or outside? This could indicate a network issue.
o Are they using wired internet access or wireless?This could indicate an issue between wired and wireless.
o Are they on location or off site in the field, maybe using VPN.This could indicate an issue with off-site networking.
o Is it just the developers?This could be an issue with the development environment, which is sometimes set up on a smaller, less robust machine.
o Is it just the advanced ad hoc users using web-based tools like InfoAssist?This could point to an issue on the WebFOCUS Client tier.
Are all reports running slow or is it just a few reports? If it is just a few reports:o Are the slow reports running against a specific data source?
This could indicate the data source needs tuning or maybe the data source is your transaction system and you need to set up a data mart.
o Are the reports being run at a specific time?Maybe they are running at peak periods and they need to run in deferred mode. Maybe they need to be scheduled using ReportCaster to run once overnight, and then distributed to all those users who need it.
o Is it the actual report running slowly or are the launch pages controlling the user-entered selection criteria slow?If it’s the launch pages, then the HTML pages need to be investigated, not the report itself.
o Is the individual report slow or is it only slow when running in the BI Portal?This could indicate a bottleneck in the design of the Portal or on the WebFOCUS Client tier.
Performance Tuning Page 3 of 58 5/9/2023Copyright © 2015 Information Builders
Once you have some basic information, you can narrow your search for the performance bottleneck, as we will see.
Understanding the WebFOCUS Architecture
Nothing we do in this lab will make sense without an understanding of the WebFOCUS architecture.
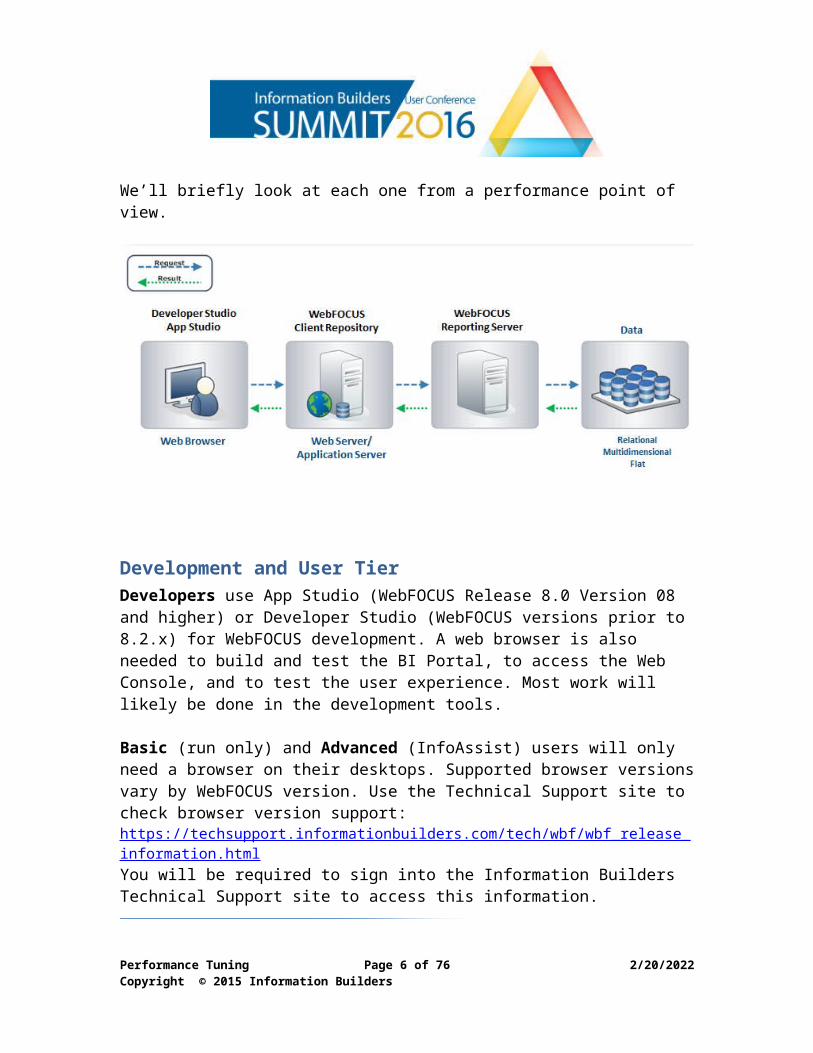
WebFOCUS has three main components:1) Development and User Tier:
a. For developers - App Studio or Developer Studiob. For all other users – web browser
2) Web Tier - WebFOCUS Client, web server (optional), and web application server
3) Data Access Tier - WebFOCUS Reporting Server (WFRS) and the data source
We’ll briefly look at each one from a performance point of view.
Development and User TierDevelopers use App Studio (WebFOCUS Release 8.0 Version 08 and higher) or Developer Studio (WebFOCUS versions prior to 8.2.x) for WebFOCUS development. A web browser is also needed to build and test the BI Portal, to
Performance Tuning Page 4 of 58 5/9/2023Copyright © 2015 Information Builders
access the Web Console, and to test the user experience. Most work will likely be done in the development tools.
Basic (run only) and Advanced (InfoAssist) users will only need a browser on their desktops. Supported browser versions vary by WebFOCUS version. Use the Technical Support site to check browser version support: https://techsupport.informationbuilders.com/tech/wbf/wbf_release_information.html You will be required to sign into the Information Builders Technical Support site to access this information.
Performance Considerations In general, on the development/user tier, the users’ machines will be a factor in performance, as will the network speed and capacity. The developers will require a faster machine with more CPU and memory than the basic or advanced users. Users using InfoAssist will need more memory than a basic user.
If the machine itself appears to have sufficient capacity, then look at the network for performance bottlenecks. Also compare wired internet performance to wireless internet; inside the firewall versus outside the firewall, etc. I have seen as large as a 30 second delay at some customer sites between the wired and the wireless network.
If a specific user is having performance issues, look at what else they are running on their machines when they experience slowness. Use tools like Task Manager on Windows® to see available machine capacity. The user/developer may have a high performance machine, but depending upon what else they are running on that machine, they may still have limited machine capacity available for reporting/development.
WebFOCUS allows you to create reports that will output to third-party tools, such as Excel®, PowerPoint®, and Adobe® PDF. These may require additional machine capacity. Even the browser itself may prove to be a bottleneck if the report returns excessive amounts of data, which we’ll talk more about later.
NOTE: I usually only look at the users’ machine capacity when the perceived performance issue is isolated to a couple of users. Similarly, if there are only a couple of users having issues, I usually look at their specific network connection for performance bottlenecks. If the overall network was slow, slow performance would be more widespread.
Performance Tuning Page 5 of 58 5/9/2023Copyright © 2015 Information Builders
Web TierWhen referring to the web tier here, I am referring to the web servers, the web application servers, as well as the WebFOCUS Client. There are many possible configurations with these components, including the use of reverse proxies and web servers outside the firewall, network routing, etc. Any one of these could be the source of a bottleneck. So in order to not rule anything out, I lump them all into the web tier.
The WebFOCUS Client, as the name infers, is a web application and is hosted in a web application server. The web and web application servers supported are varied, but we test and certify versions of IIS/Tomcat™, Tomcat stand-alone, WebLogic®, WebSphere®, and JBoss®. Please refer to the Information Builders Technical Support site for the latest information on web application server support for the various versions of WebFOCUS.
The WebFOCUS Client provides you with: Managed Reporting so you can easily organize your reporting content
into a folder structure and apply the necessary security that makes sense for your business. The environment is inherently secured. You cannot access it without some form of identity authentication. You have complete flexibility in defining the security policy you choose to use.
InfoAssist to provide a way for business users and advanced users to do their own ad hoc report development and information discovery.
BI Portal so you can organize your reporting content into a portal, making it easy for your users to find the information they need to do their day-to-day jobs.
ReportCaster to allow you to schedule your reports to run at developer/user defined intervals and be distributed to your users via email, ftp, printer, back to the Managed Reporting content, or to the Report Library.
Report Library provides a way to take the report output from ReportCaster and store it in the WebFOCUS repository for users to view. This can provide a more secure method of distributing report output than email. By default, the Library will retain multiple versions of the output. What you see in the Library is the way the data looked when the report was run, not as the data appears if the report were run again today. This is very useful for auditing purposes.
The WebFOCUS Client Repository contains the above content plus the security information. This is all stored in a relational database. The WebFOCUS Client Repository is accessed via a JDBC connection and is accessed directly by the
Performance Tuning Page 6 of 58 5/9/2023Copyright © 2015 Information Builders
WebFOCUS Client application. In other words, the connectivity between the WebFOCUS Client and the repository RDBMS is direct and does not go through WebFOCUS Reporting Server.
Other than the ReportCaster process, the WebFOCUS Client has no process that runs standalone. The WebFOCUS Client is a web application and is therefore deployed to, and runs under, your web application server. You start and stop the WebFOCUS Client application through the web application server.
Performance ConsiderationsThe web and web application server need to be tuned for maximum performance. Sluggish response time in the BI Portal, while running a report, and most notably in InfoAssist, can be an indication of a performance bottleneck in the web application server. It is often memory related. Work with your web application server administrator to tune the web application server to support the WebFOCUS usage at your site.
The RDBMS used for the WebFOCUS Repository should be able to return the WebFOCUS content quickly. Delays in WebFOCUS when you are retrieving content information from or saving content to the repository can be a reflection of database performance. Test the access from the WebFOCUS Client machine to the RDBMS machine independent of WebFOCUS to ensure sufficient response time. Slow response time between the WebFOCUS Client machine and the RDBMS may indicate a need for RDBMS tuning, or it could indicate a sluggish network.
It is not recommended that the RDBMS reside on the same machine as the web and web application servers, as they may compete for machine capacity. However, if the machine has been sufficiently sized to accommodate the needs of the RDBMS, as well as the web and web application server, then you may be okay.
Data Access TierWhen referring to the data access tier, I am including the WebFOCUS Reporting Server as well as the data source, as either of these could be the source of a performance bottleneck.
The WebFOCUS Reporting Server can reside on the same machine as the WebFOCUS Client or on a separate machine.
Performance Tuning Page 7 of 58 5/9/2023Copyright © 2015 Information Builders
The benefits of them residing on the same machine are: They can share the same APP folder structure. You have only one machine to maintain. This will eliminate any impact of poor performance because of network
latency between the WebFOCUS Client and Reporting Server machines.
The benefits of them residing on separate machines are: The needs of the WebFOCUS Client processing will not compete with the
needs of the WebFOCUS Reporting Server processing. The machines can be independently tuned and sized for the specific
needs of each component. The WebFOCUS Reporting Server may be licensed by machine cores.
You can reserve all core capacity for the Reporting Server if the components are on separate machines.
The WebFOCUS Client is not licensed by machine size, so you can add cores and memory as needed.
We will assume they are on separate machines for the purposes of this discussion.
The WebFOCUS Reporting Server (WFRS) accepts the request from the WebFOCUS Client, at which point an agent on the WebFOCUS Reporting Server is started or activated. Each agent requires machine capacity, in terms of CPU, memory, and disk space. The amount of CPU, memory, and disk space is dependent upon the report request itself. There is a minimum amount of memory required to simply start up the agent and this minimum will vary by platform and version of WebFOCUS, but it’s usually around 15MB per agent.
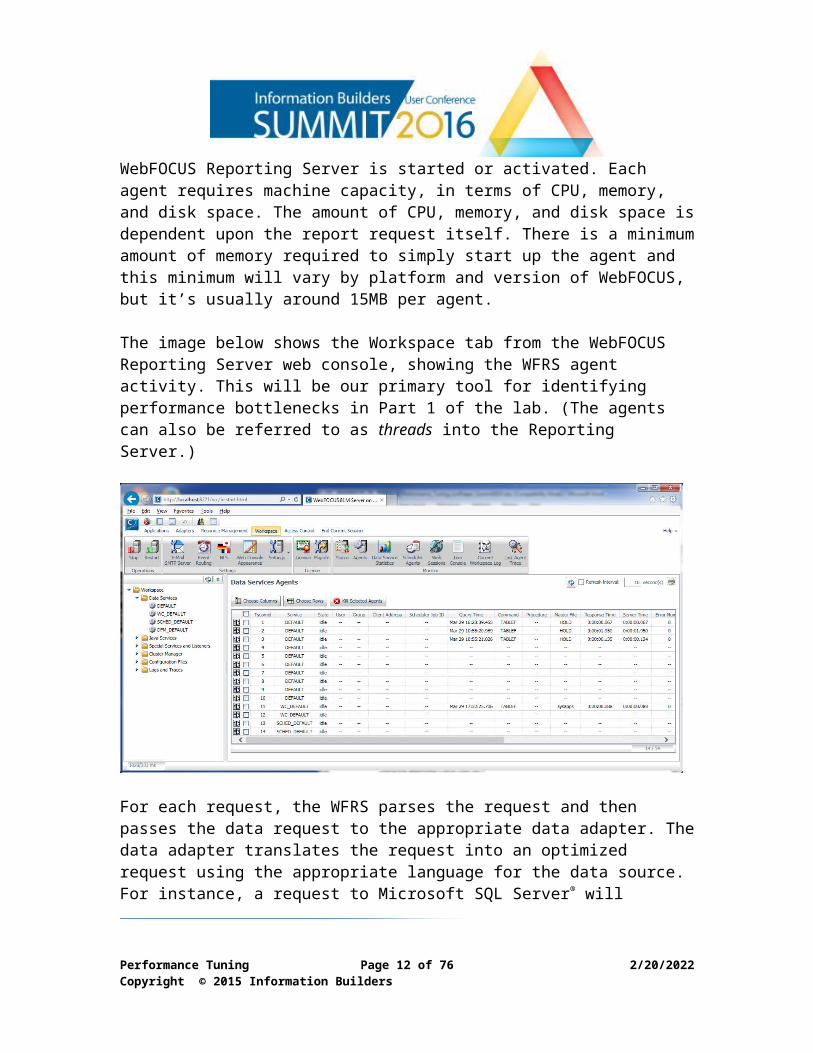
The image below shows the Workspace tab from the WebFOCUS Reporting Server web console, showing the WFRS agent activity. This will be our primary tool for identifying performance bottlenecks in Part 1 of the lab. (The agents can also be referred to as threads into the Reporting Server.)
Performance Tuning Page 8 of 58 5/9/2023Copyright © 2015 Information Builders
For each request, the WFRS parses the request and then passes the data request to the appropriate data adapter. The data adapter translates the request into an optimized request using the appropriate language for the data source. For instance, a request to Microsoft SQL Server® will generate SQL using any SQL extensions specific to Microsoft SQL Server, thus providing an optimized request for Microsoft SQL Server. Similarly, a request to SAP BW® will translate the data request into SAP certified MDX query requests, and a request to Salesforce.com® will create the appropriate Partner WSDL web service request, using the approved Salesforce.com API, etc.
Even just considering the primary RDBMS databases, like Microsoft SQL Server, Oracle®, and DB2®, you may see different SQL generated, because the WebFOCUS data adapters will take advantage of the database-specific SQL extensions in order to optimize the data request sent to the database.
Once data is returned from the data source, WebFOCUS will do any additional processing needed, like:
Adding additional business logic through creating virtual columns, creating a matrix report, applying totals and subtotals, etc.
Applying any sorting or selection criteria that the database couldn’t do. Adding styling, like headers, footers, titles, etc. Preparing the results to be viewed in the selected output format, e.g.,
HTML, Excel, PDF, etc.
Performance Tuning Page 9 of 58 5/9/2023Copyright © 2015 Information Builders
Once this is all complete, WebFOCUS will send the data back to the WebFOCUS Client application for presentation to the user.
Performance ConsiderationsThe primary area for overall WebFOCUS performance bottlenecks is in the data access tier, since it is usually doing the most work. There are many areas that can cause performance bottlenecks:
• WFRS may need to be tuned for optimal performance. Use a load/stress testing tool to determine the best reporting server settings (See the Appendix for more information on the WebFOCUS stress test tool.):
• Should you limit the maximum number of agents and allow queuing?• Do you need to set a separate service for long running reports and
give them a lower priority?• Can you allow more agents to run simultaneously?
• WFRS sends the data request to the data source. The data source itself may need tuning.
• The request provided to WebFOCUS by the developer/user may need to be tweaked to be more efficient.
• Excessive use of virtual columns can cause the data request to be slow.
• Requesting data from disparate data sources will cause WebFOCUS to manage the join instead of the database.
• Processes like ReportCaster jobs may be competing for resources and should be run overnight or during non-peak hours.
• Excessive use of WebFOCUS internal databases (HOLD files) may be competing for machine power. Consider holding the data to the data source itself, e.g., by using the SameDB output option.
• The WFRS itself may need more machine capacity, memory, and/or cores to support the reporting needs.
Since this is where performance bottlenecks can be significant, we will begin our hands-on lab here. Let’s look into how to identify bottlenecks on the WebFOCUS Reporting Server.
Performance Tuning Page 10 of 58 5/9/2023Copyright © 2015 Information Builders
WebFOCUS Reporting Server Performance Lab
Business Scenario: You have gotten feedback from users that WebFOCUS is slow. You have asked the Investigative questions to help you identify if this is user machine specific, web tier specific, server specific or report specific. The answers to these questions have pointed you to one or two reports that run from the portal. Since these are report specific, let’s start by looking at the WebFOCUS Reporting Server to see what happens there when the report runs.
Step 1 – Set up the WFRS Web Console to monitor agent activity.
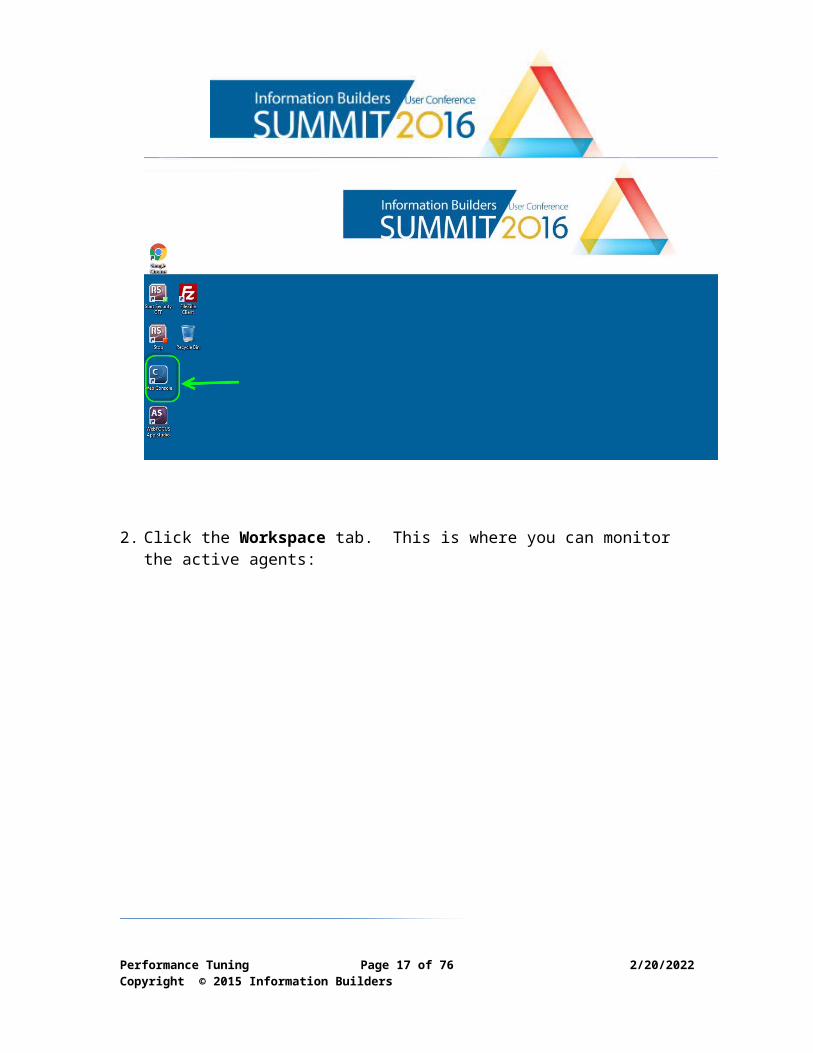
1. Double-click the icon on the desktop:
Performance Tuning Page 11 of 58 5/9/2023Copyright © 2015 Information Builders
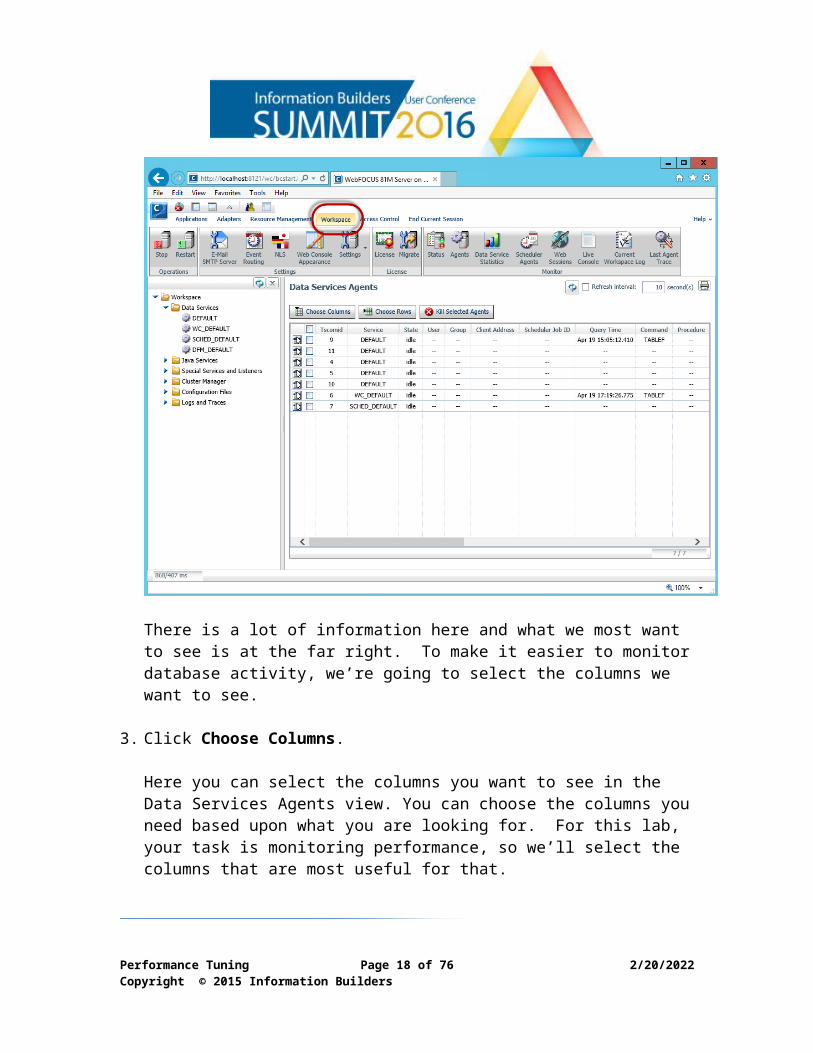
2. Click the Workspace tab. This is where you can monitor the active agents:
There is a lot of information here and what we most want to see is at the far right. To make it easier to monitor database activity, we’re going to select the columns we want to see.
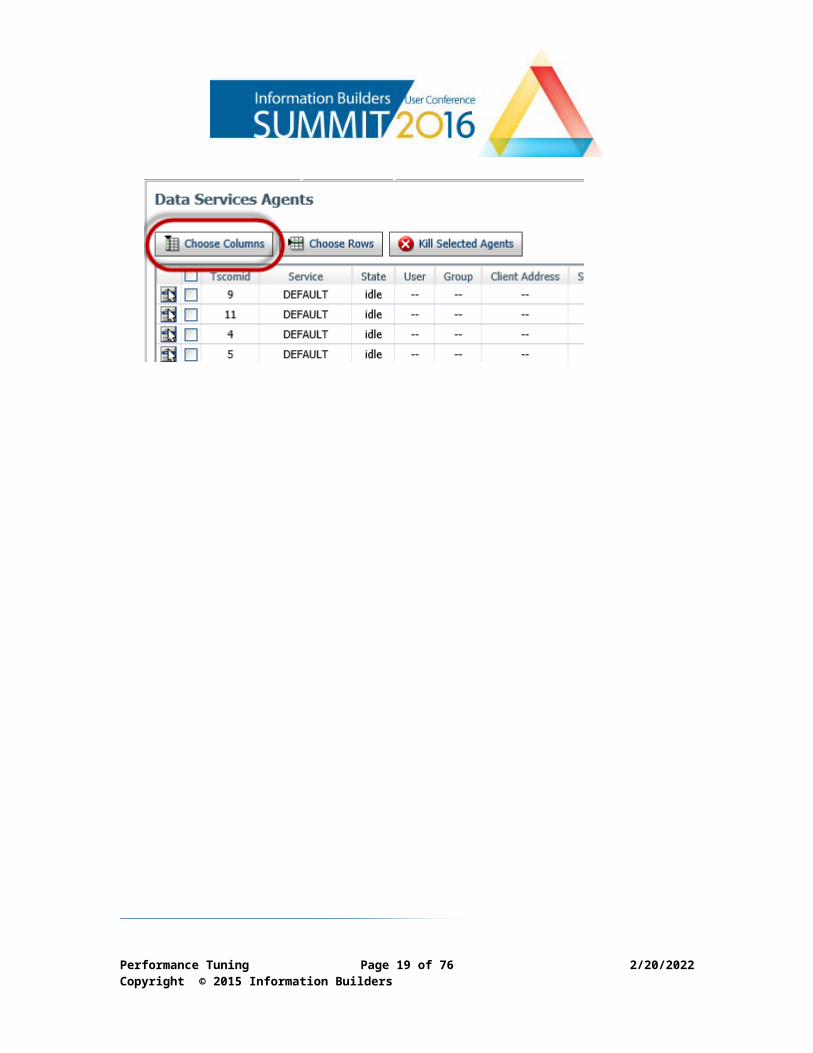
3. Click Choose Columns.
Here you can select the columns you want to see in the Data Services Agents view. You can choose the columns you need based upon what you are looking for. For this lab, your task is monitoring performance, so we’ll select the columns that are most useful for that.
Performance Tuning Page 12 of 58 5/9/2023Copyright © 2015 Information Builders
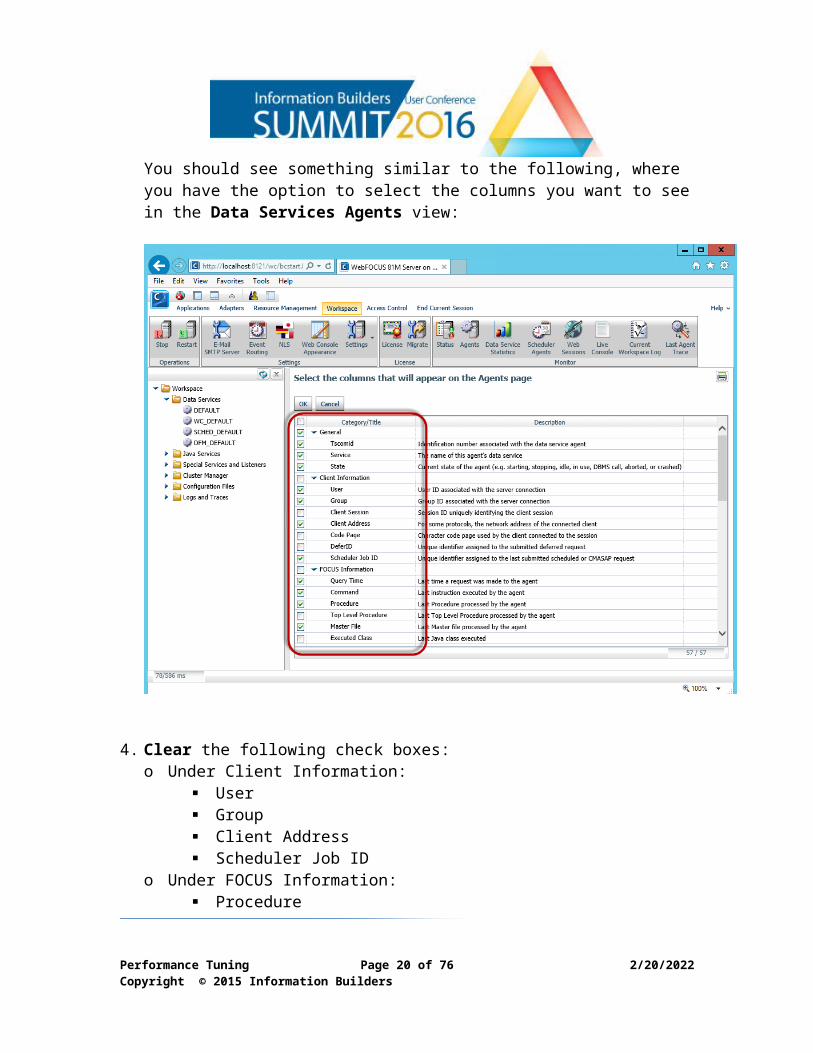
You should see something similar to the following, where you have the option to select the columns you want to see in the Data Services Agents view:
Performance Tuning Page 13 of 58 5/9/2023Copyright © 2015 Information Builders
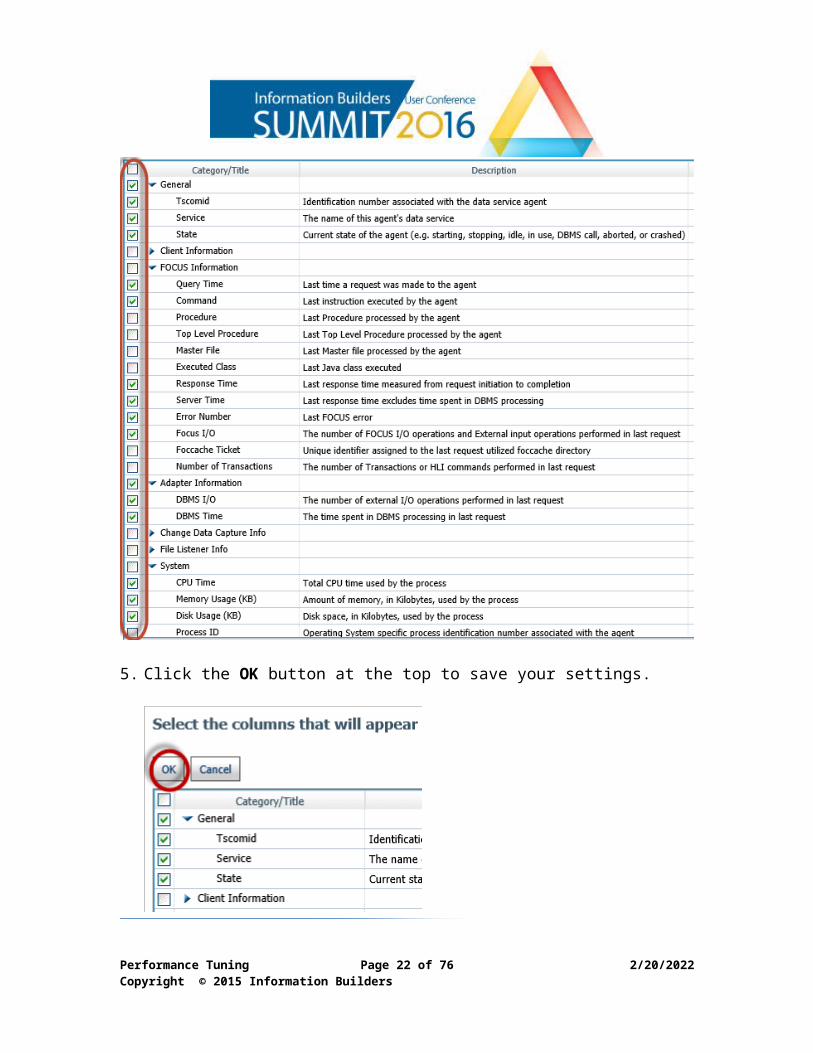
4. Clear the following check boxes: o Under Client Information:
User Group Client Address Scheduler Job ID
o Under FOCUS Information: Procedure Master File
o Under System: Process ID
NOTE: There are no columns selected under the Change Data Capture or File Listener Info sections.
The columns you ultimately choose when you do this at your site may be different depending upon the circumstances and what you are hoping to learn. For instance, you might not select Error Number if you already know an error is not being generated. Or you may want to select Master File if you suspect a specific data source issue.
Your final selections for this lab should look like the image below:
NOTE: I have collapsed the sections where there are no selections: Client Information, Change Data Capture, and File Listener Info.
Performance Tuning Page 14 of 58 5/9/2023Copyright © 2015 Information Builders
5. Click the OK button at the top to save your settings.
Performance Tuning Page 15 of 58 5/9/2023Copyright © 2015 Information Builders
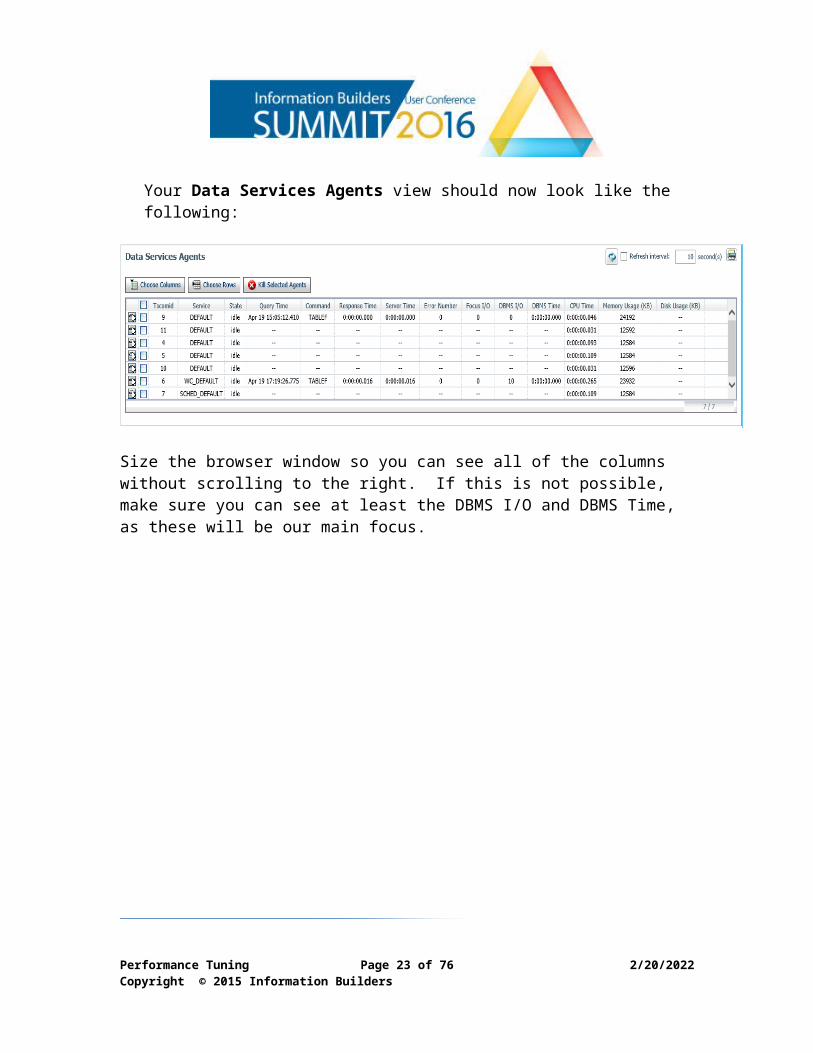
Your Data Services Agents view should now look like the following:
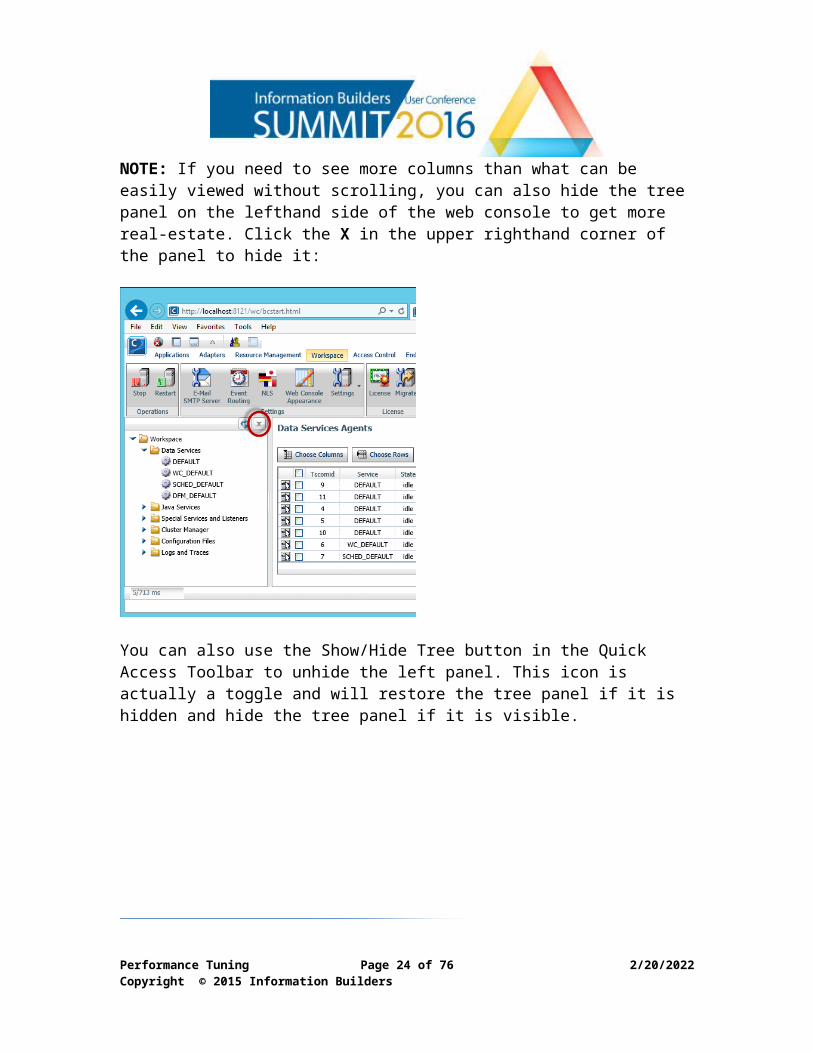
Size the browser window so you can see all of the columns without scrolling to the right. If this is not possible, make sure you can see at least the DBMS I/O and DBMS Time, as these will be our main focus.NOTE: If you need to see more columns than what can be easily viewed without scrolling, you can also hide the tree panel on the lefthand side of the web console to get more real-estate. Click the X in the upper righthand corner of the panel to hide it:
Performance Tuning Page 16 of 58 5/9/2023Copyright © 2015 Information Builders
You can also use the Show/Hide Tree button in the Quick Access Toolbar to unhide the left panel. This icon is actually a toggle and will restore the tree panel if it is hidden and hide the tree panel if it is visible.
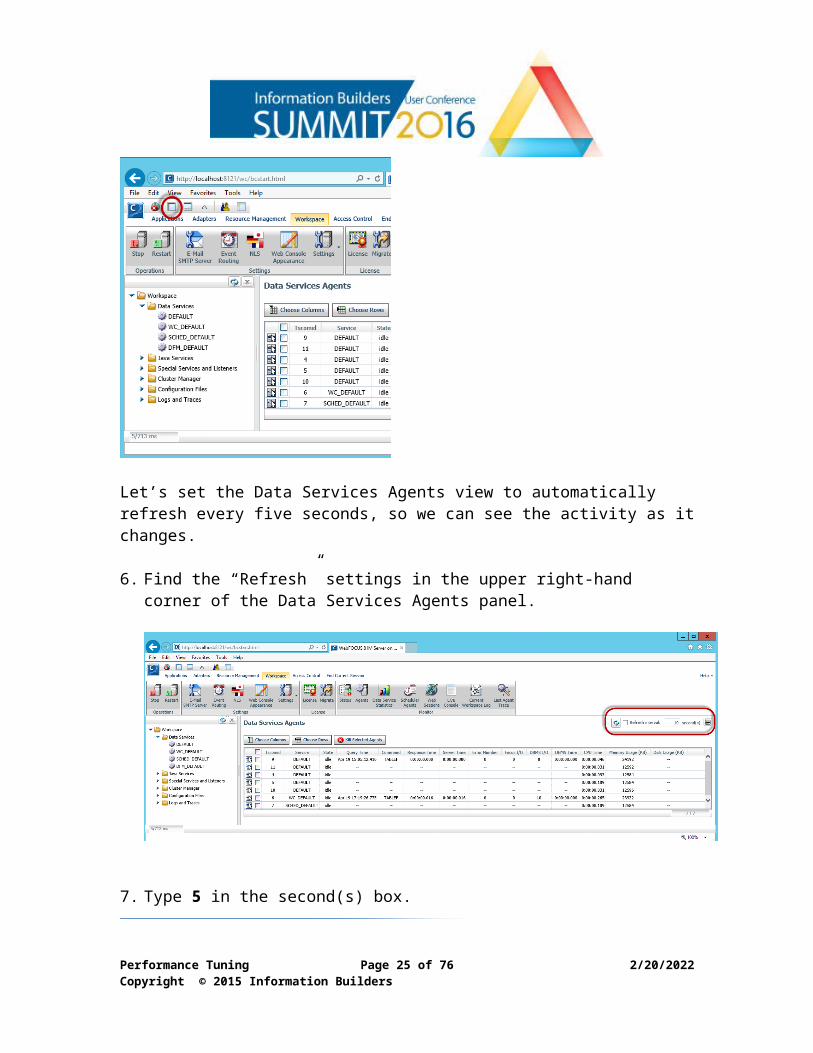
Let’s set the Data Services Agents view to automatically refresh every five seconds, so we can see the activity as it changes.
6. Find the “Refresh” settings in the upper right-hand corner of the Data Services Agents panel.
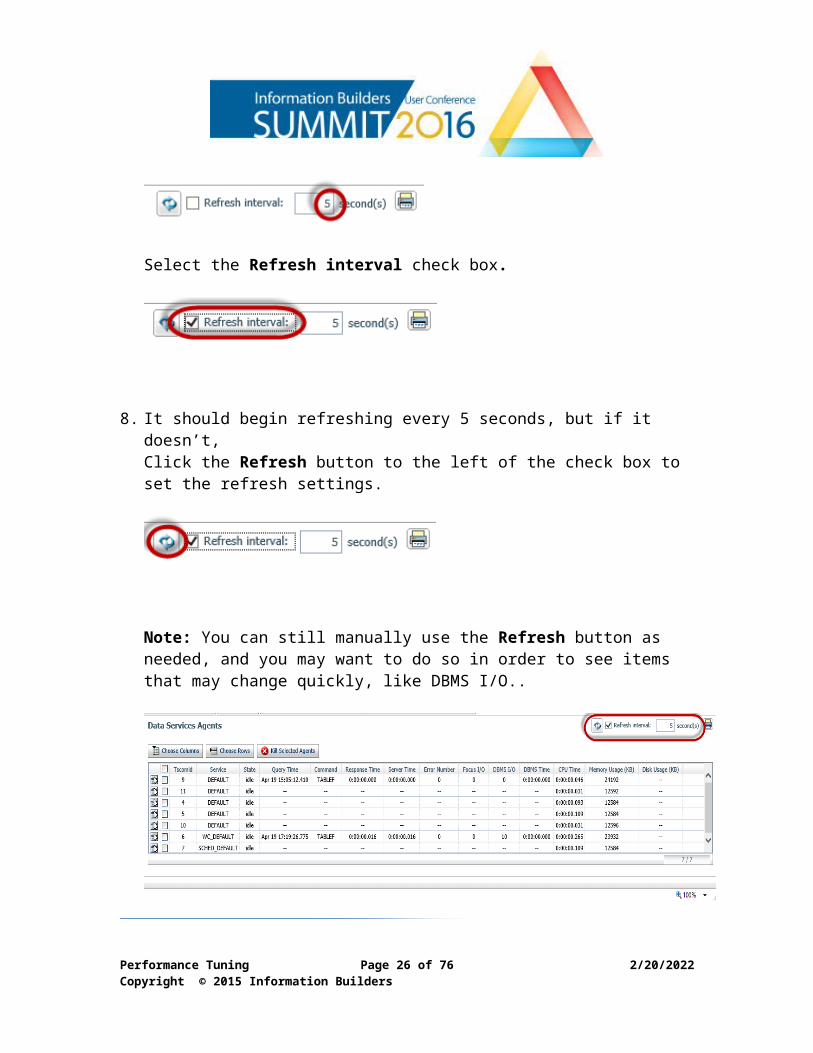
7. Type 5 in the second(s) box.
Performance Tuning Page 17 of 58 5/9/2023Copyright © 2015 Information Builders
Select the Refresh interval check box.
8. It should begin refreshing every 5 seconds, but if it doesn’t, Click the Refresh button to the left of the check box to set the refresh settings.
Note: You can still manually use the Refresh button as needed, and you may want to do so in order to see items that may change quickly, like DBMS I/O..
Now we can easily watch the server activity as the procedures run. The Data Services Agents monitoring view gives us a lot of information.
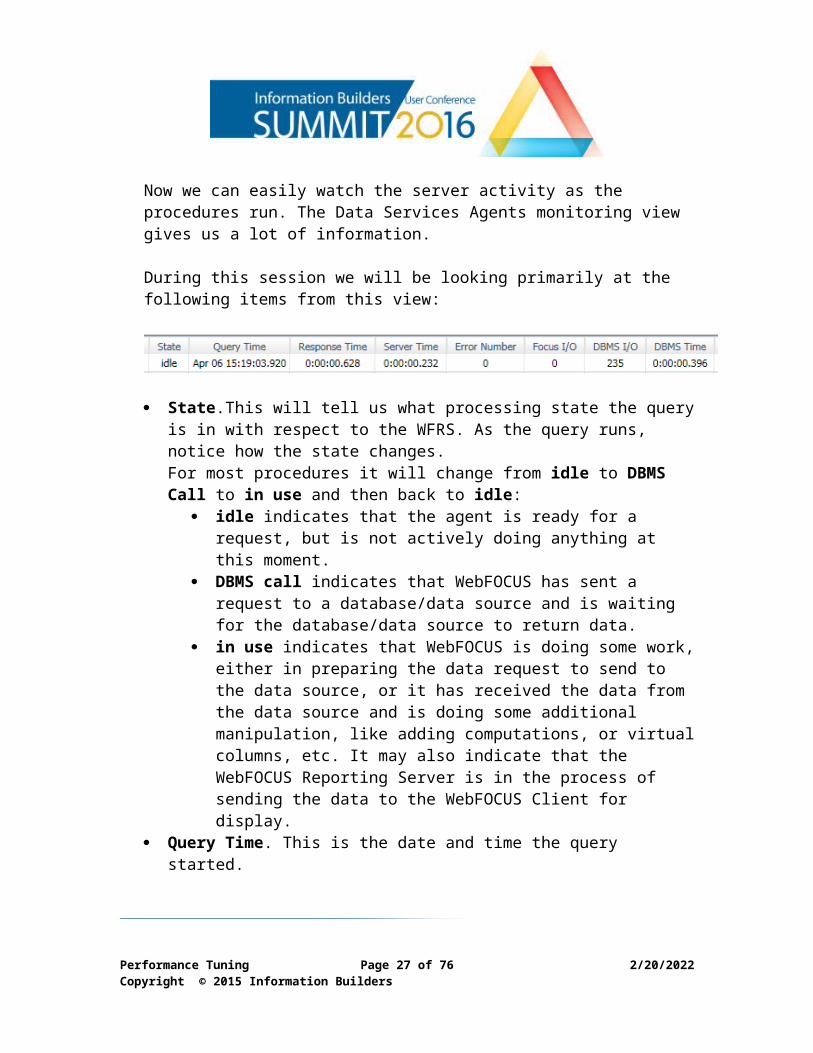
During this session we will be looking primarily at the following items from this view:
Performance Tuning Page 18 of 58 5/9/2023Copyright © 2015 Information Builders
State.This will tell us what processing state the query is in with respect to the WFRS. As the query runs, notice how the state changes.For most procedures it will change from idle to DBMS Call to in use and then back to idle:
idle indicates that the agent is ready for a request, but is not actively doing anything at this moment.
DBMS call indicates that WebFOCUS has sent a request to a database/data source and is waiting for the database/data source to return data.
in use indicates that WebFOCUS is doing some work, either in preparing the data request to send to the data source, or it has received the data from the data source and is doing some additional manipulation, like adding computations, or virtual columns, etc. It may also indicate that the WebFOCUS Reporting Server is in the process of sending the data to the WebFOCUS Client for display.
Query Time. This is the date and time the query started. Response Time. This is the total time the query was in the WebFOCUS
Reporting Server. Response Time = Server Time + DBMS Time. Server Time. This is the amount of time WebFOCUS spent doing its
processing outside of the data access step. Error Number. We won’t be needing this, but I feel it is important to be
visible when you are analyzing performance, because there may be errors ocurring behind the scenes that may explain performance bottlenecks.
FOCUS I/O. This is the amount of I/O used when reading FOCUS databases, which are often used for reporting data marts and intermediate work files to handle complicated data.
DBMS I/O. This is the I/O used when reading the DBMS data sources. DBMS Time. This is the time spent in the DBMS retrieving the data.
Depending upon the amount of data returned and how long it takes the database to return it to WFRS, if you refresh the agent activity view at regular intervals, you may see the number of rows being returned from the data source incrementing as the data is being sent to the WebFOCUS Reporting Server (DBMS I/O).
Let’s see how we use this information to identify performance bottlenecks.
Performance Tuning Page 19 of 58 5/9/2023Copyright © 2015 Information Builders
Step 2 – Open a new browser window and sign in to the WebFOCUS Portal
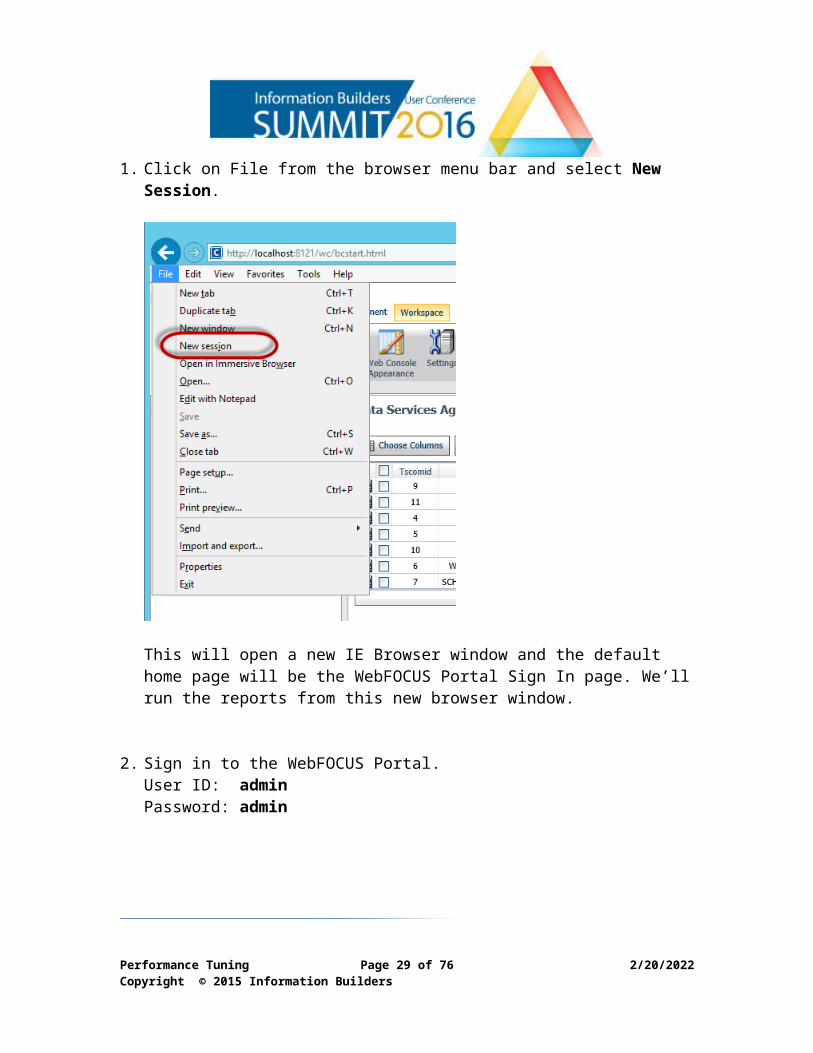
1. Click on File from the browser menu bar and select New Session.
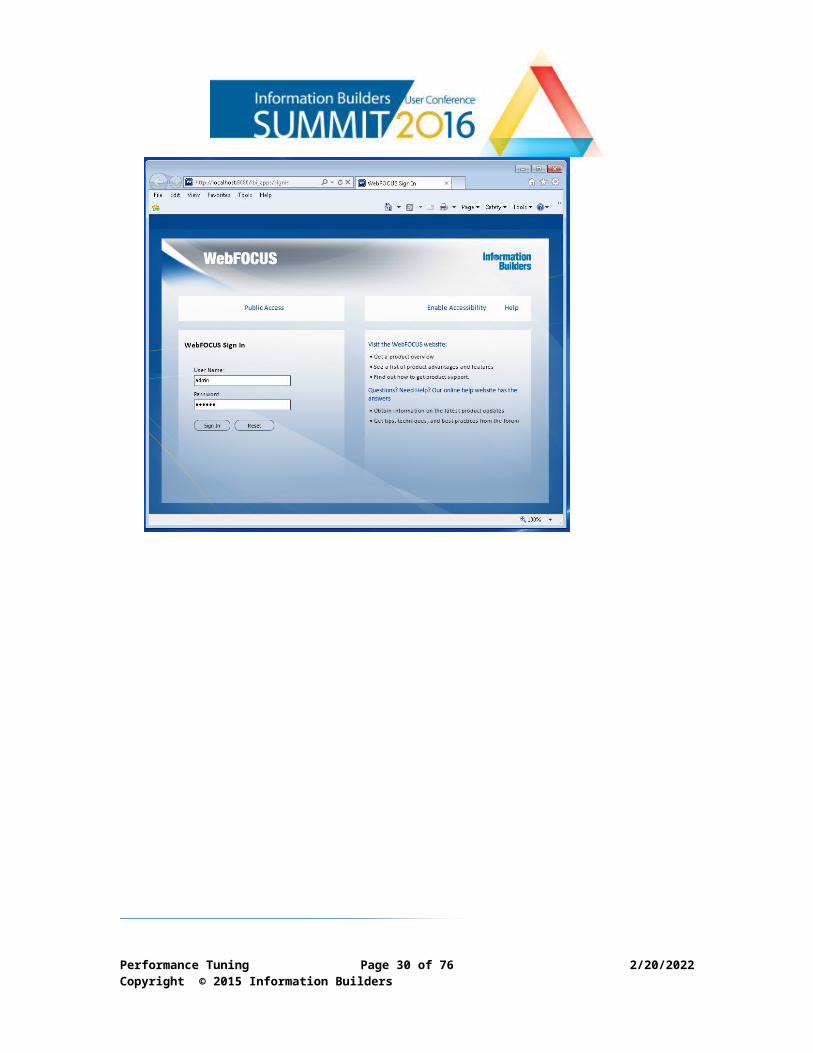
This will open a new IE Browser window and the default home page will be the WebFOCUS Portal Sign In page. We’ll run the reports from this new browser window.
2. Sign in to the WebFOCUS Portal. User ID: admin Password: admin
Performance Tuning Page 20 of 58 5/9/2023Copyright © 2015 Information Builders
Performance Tuning Page 21 of 58 5/9/2023Copyright © 2015 Information Builders
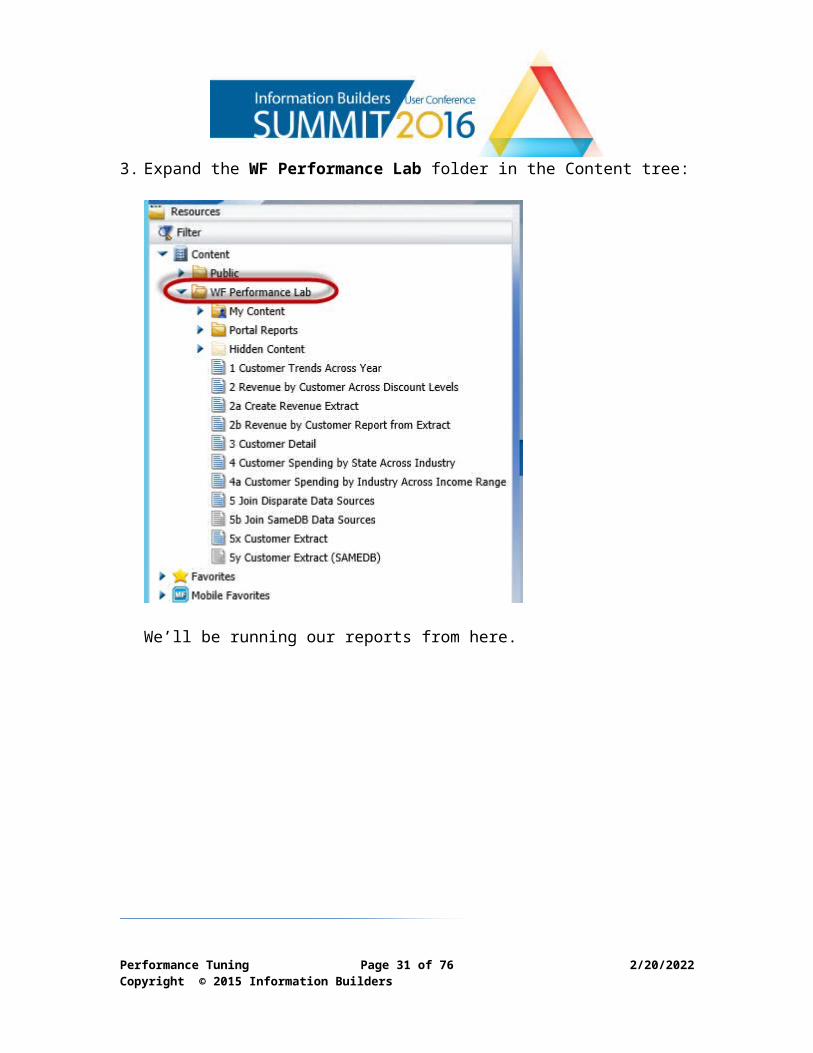
3. Expand the WF Performance Lab folder in the Content tree:
We’ll be running our reports from here.
Performance Tuning Page 22 of 58 5/9/2023Copyright © 2015 Information Builders
Step 3 – Run procedures and observe the activity to identify performance bottlenecks.
We’ll be using the WebFOCUS Reporting Server timings to identify bottlenecks in running the reports.
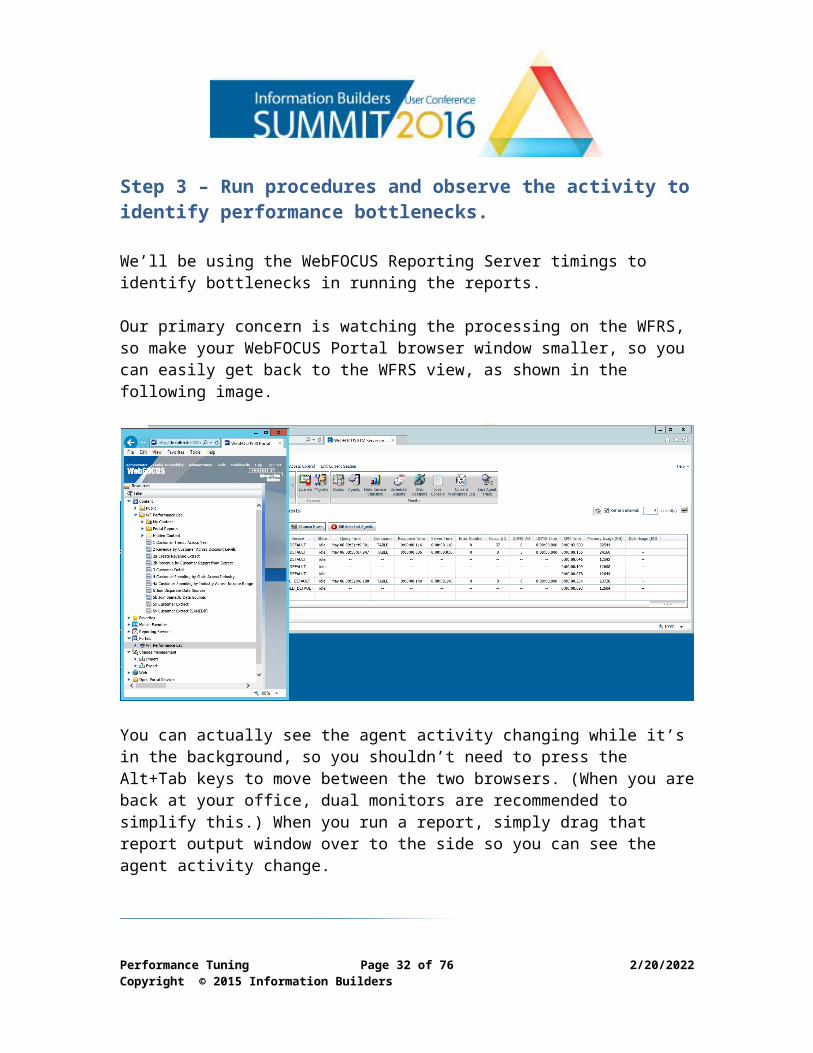
Our primary concern is watching the processing on the WFRS, so make your WebFOCUS Portal browser window smaller, so you can easily get back to the WFRS view, as shown in the following image.
You can actually see the agent activity changing while it’s in the background, so you shouldn’t need to press the Alt+Tab keys to move between the two browsers. (When you are back at your office, dual monitors are recommended to simplify this.) When you run a report, simply drag that report output window over to the side so you can see the agent activity change.
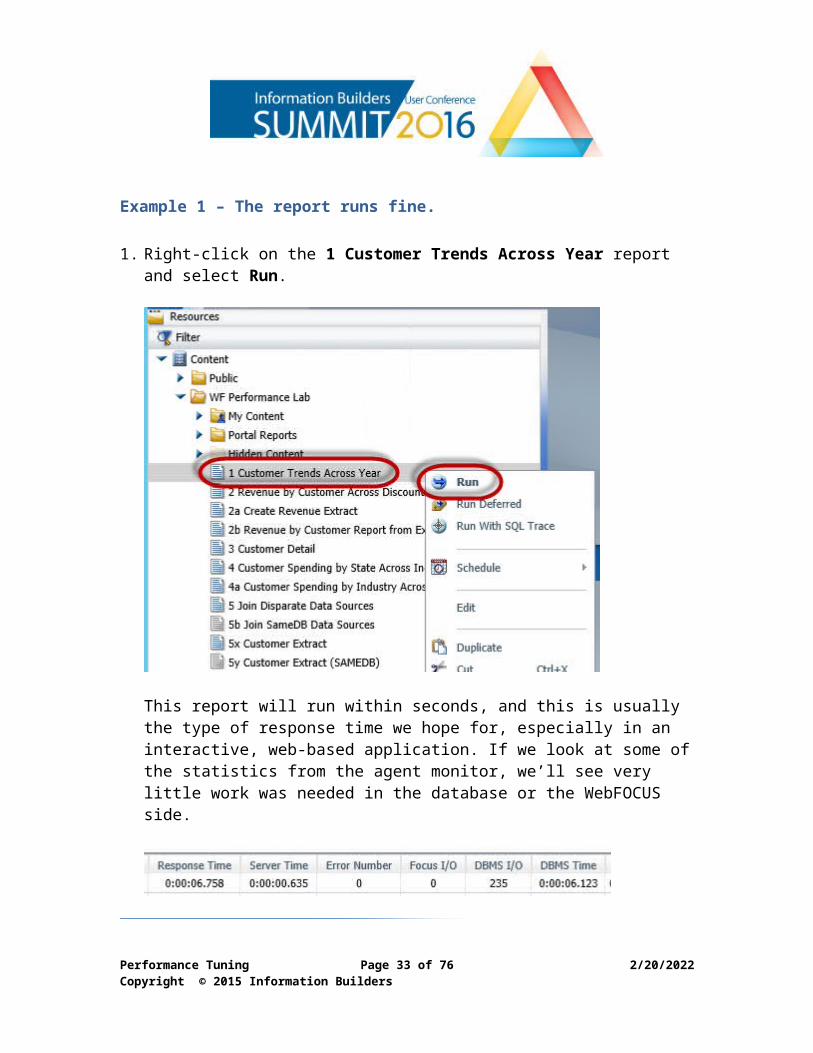
Example 1 – The report runs fine.
1. Right-click on the 1 Customer Trends Across Year report and select Run.
Performance Tuning Page 23 of 58 5/9/2023Copyright © 2015 Information Builders
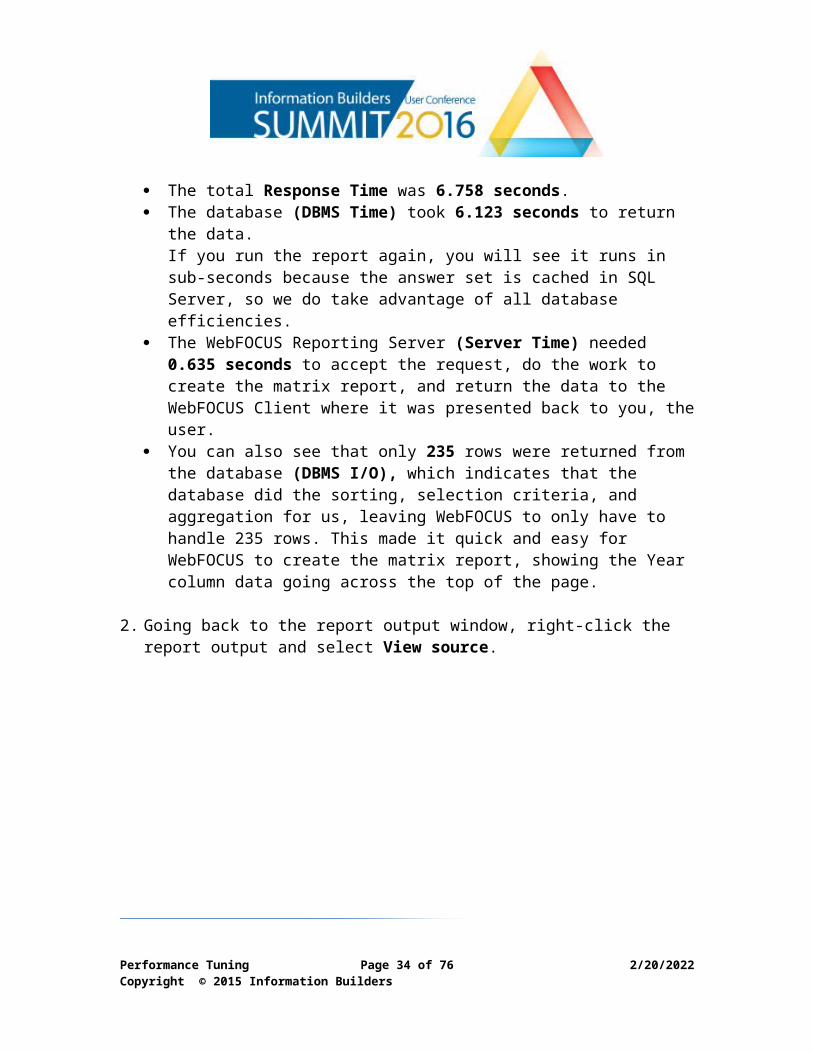
This report will run within seconds, and this is usually the type of response time we hope for, especially in an interactive, web-based application. If we look at some of the statistics from the agent monitor, we’ll see very little work was needed in the database or the WebFOCUS side.
The total Response Time was 6.758 seconds. The database (DBMS Time) took 6.123 seconds to return the data.
If you run the report again, you will see it runs in sub-seconds because the answer set is cached in SQL Server, so we do take advantage of all database efficiencies.
The WebFOCUS Reporting Server (Server Time) needed 0.635 seconds to accept the request, do the work to create the matrix report, and return the data to the WebFOCUS Client where it was presented back to you, the user.
You can also see that only 235 rows were returned from the database (DBMS I/O), which indicates that the database did the sorting, selection
Performance Tuning Page 24 of 58 5/9/2023Copyright © 2015 Information Builders
criteria, and aggregation for us, leaving WebFOCUS to only have to handle 235 rows. This made it quick and easy for WebFOCUS to create the matrix report, showing the Year column data going across the top of the page.
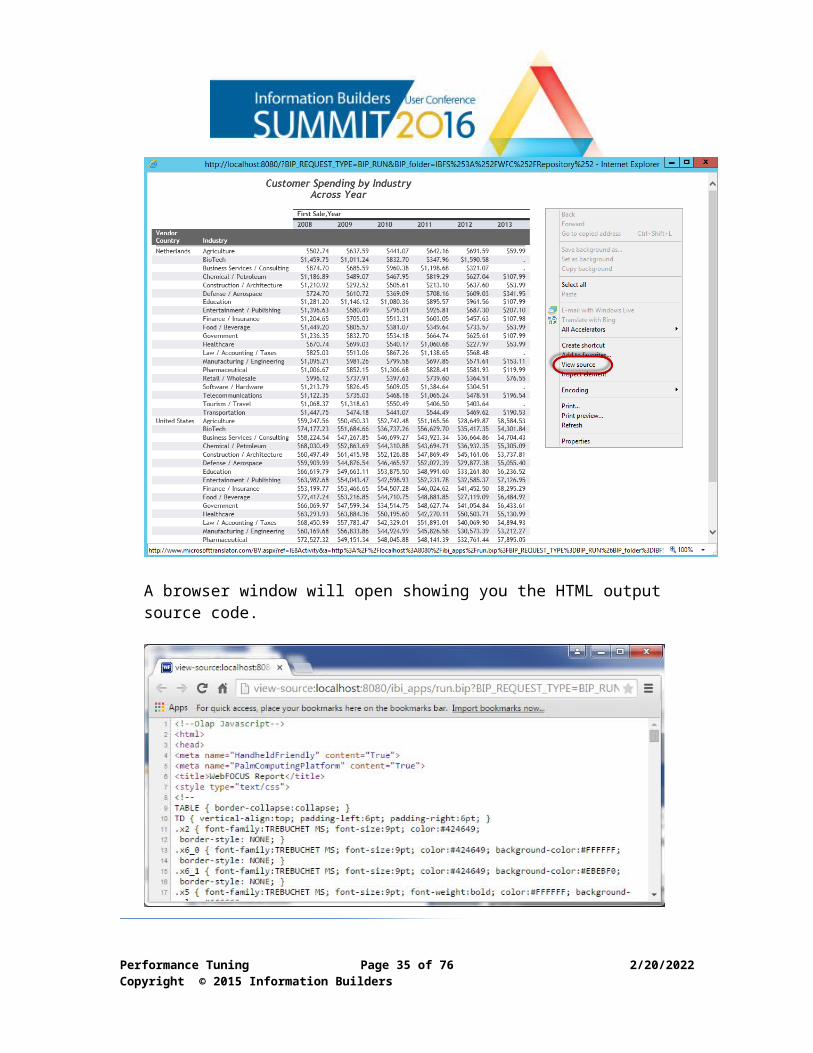
2. Going back to the report output window, right-click the report output and select View source.
Performance Tuning Page 25 of 58 5/9/2023Copyright © 2015 Information Builders
A browser window will open showing you the HTML output source code.
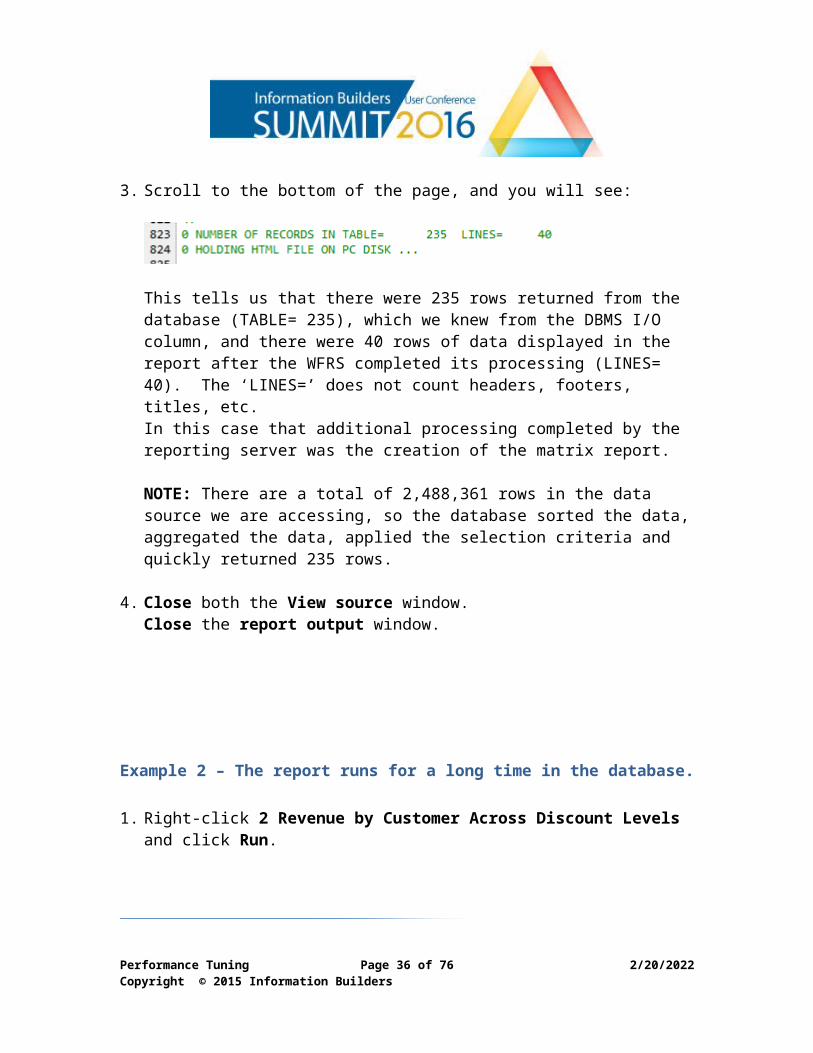
3. Scroll to the bottom of the page, and you will see:
This tells us that there were 235 rows returned from the database (TABLE= 235), which we knew from the DBMS I/O column, and there were 40 rows of data displayed in the report after the WFRS completed its processing (LINES= 40). The ‘LINES=’ does not count headers, footers, titles, etc. In this case that additional processing completed by the reporting server was the creation of the matrix report. NOTE: There are a total of 2,488,361 rows in the data source we are accessing, so the database sorted the data, aggregated the data, applied the selection criteria and quickly returned 235 rows.
4. Close both the View source window.Close the report output window.
Performance Tuning Page 26 of 58 5/9/2023Copyright © 2015 Information Builders
Example 2 – The report runs for a long time in the database.
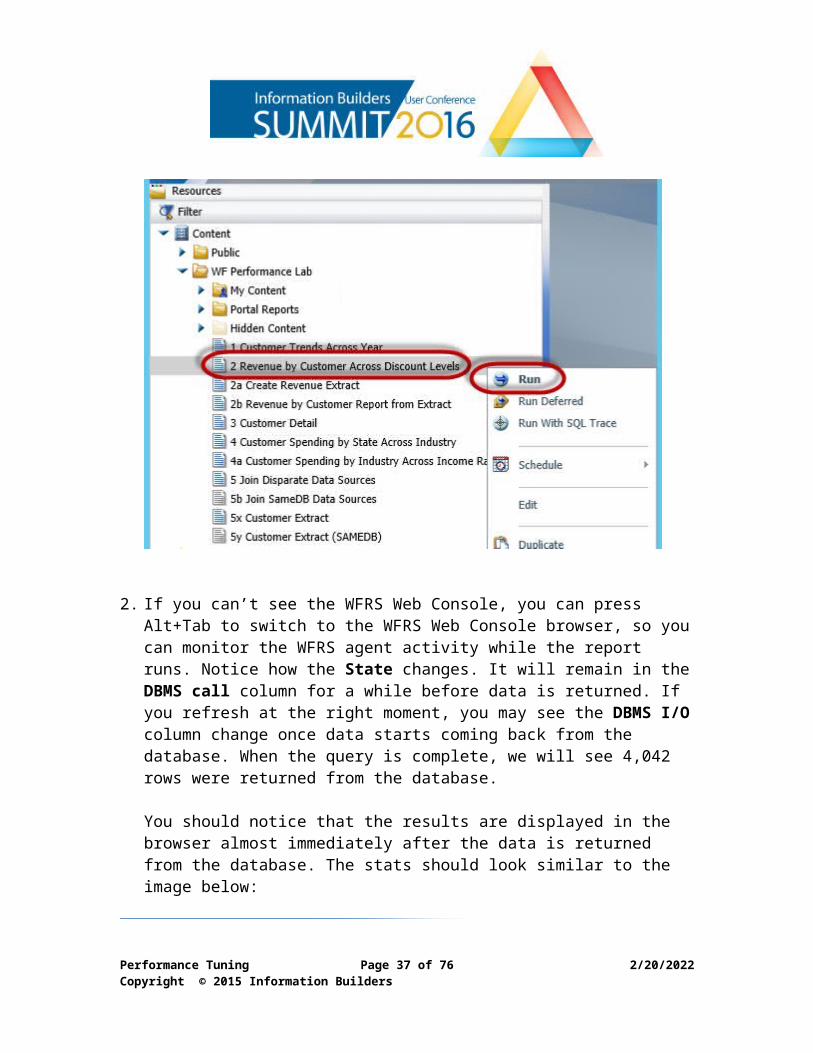
1. Right-click 2 Revenue by Customer Across Discount Levels and click Run.
2. If you can’t see the WFRS Web Console, you can press Alt+Tab to switch to the WFRS Web Console browser, so you can monitor the WFRS agent activity while the report runs. Notice how the State changes. It will remain in the DBMS call column for a while before data is returned. If you refresh at the right moment, you may see the DBMS I/O column change once data starts coming back from the database. When the query is complete, we will see 4,042 rows were returned from the database.
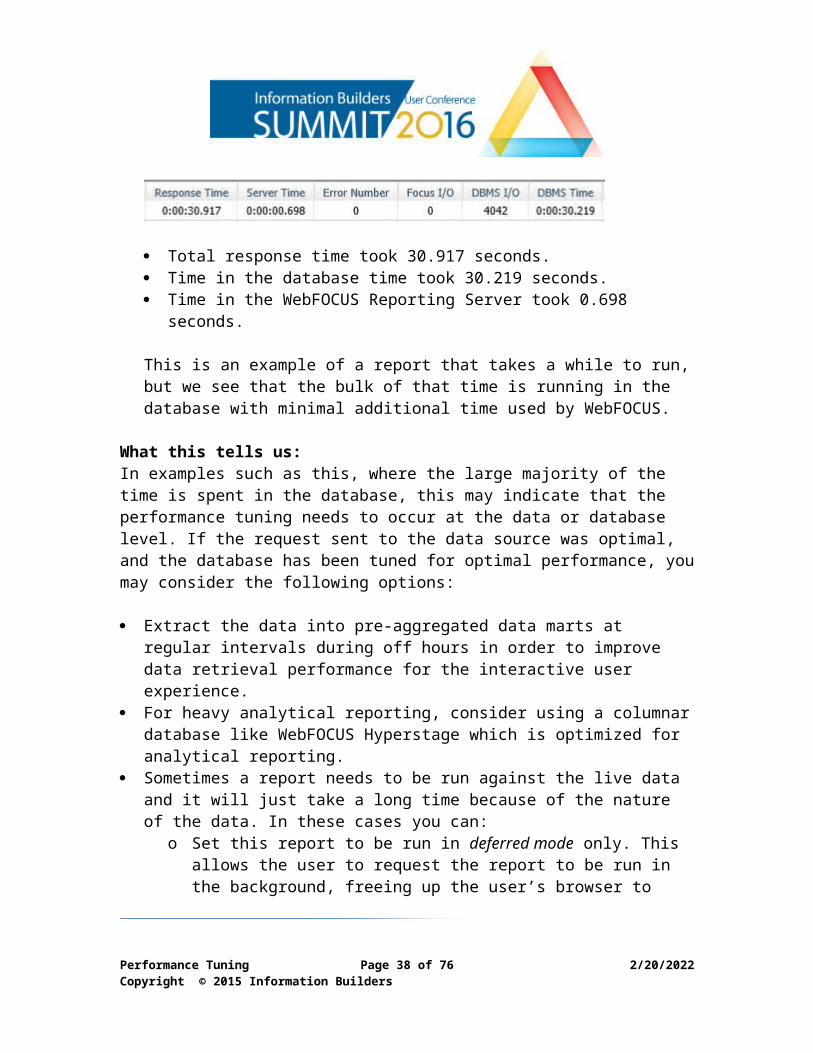
You should notice that the results are displayed in the browser almost immediately after the data is returned from the database. The stats should look similar to the image below:
Performance Tuning Page 27 of 58 5/9/2023Copyright © 2015 Information Builders
Total response time took 30.917 seconds. Time in the database time took 30.219 seconds. Time in the WebFOCUS Reporting Server took 0.698 seconds.
This is an example of a report that takes a while to run, but we see that the bulk of that time is running in the database with minimal additional time used by WebFOCUS.
What this tells us:In examples such as this, where the large majority of the time is spent in the database, this may indicate that the performance tuning needs to occur at the data or database level. If the request sent to the data source was optimal, and the database has been tuned for optimal performance, you may consider the following options:
Extract the data into pre-aggregated data marts at regular intervals during off hours in order to improve data retrieval performance for the interactive user experience.
For heavy analytical reporting, consider using a columnar database like WebFOCUS Hyperstage which is optimized for analytical reporting.
Sometimes a report needs to be run against the live data and it will just take a long time because of the nature of the data. In these cases you can:
o Set this report to be run in deferred mode only. This allows the user to request the report to be run in the background, freeing up the user’s browser to continue working. Meanwhile the report is being run and the user can go to their deferred output screen to view the report results once it has finished running.You can set the deferred agents at a lower priority than the interactive agents, since they are being run in the background.See the Appendix for screen shots of using the “run deferred” option.
o Set this report to be run via ReportCaster during off hours, and have the report delivered to the user when they need it, via email, the Report Library or directly into the WebFOCUS Portal.
Since this is a daily revenue report, this is a prime candidate for ReportCaster or for creating a data mart each evening with the prior day’s data to improve performance.
As an example, a WebFOCUS procedure was created to pre-aggregate the data and create a data mart. That procedure (2a Create Revenue Extract) is available for you to peruse but it has already been run for you.
Performance Tuning Page 28 of 58 5/9/2023Copyright © 2015 Information Builders
3. Close the current report output window.
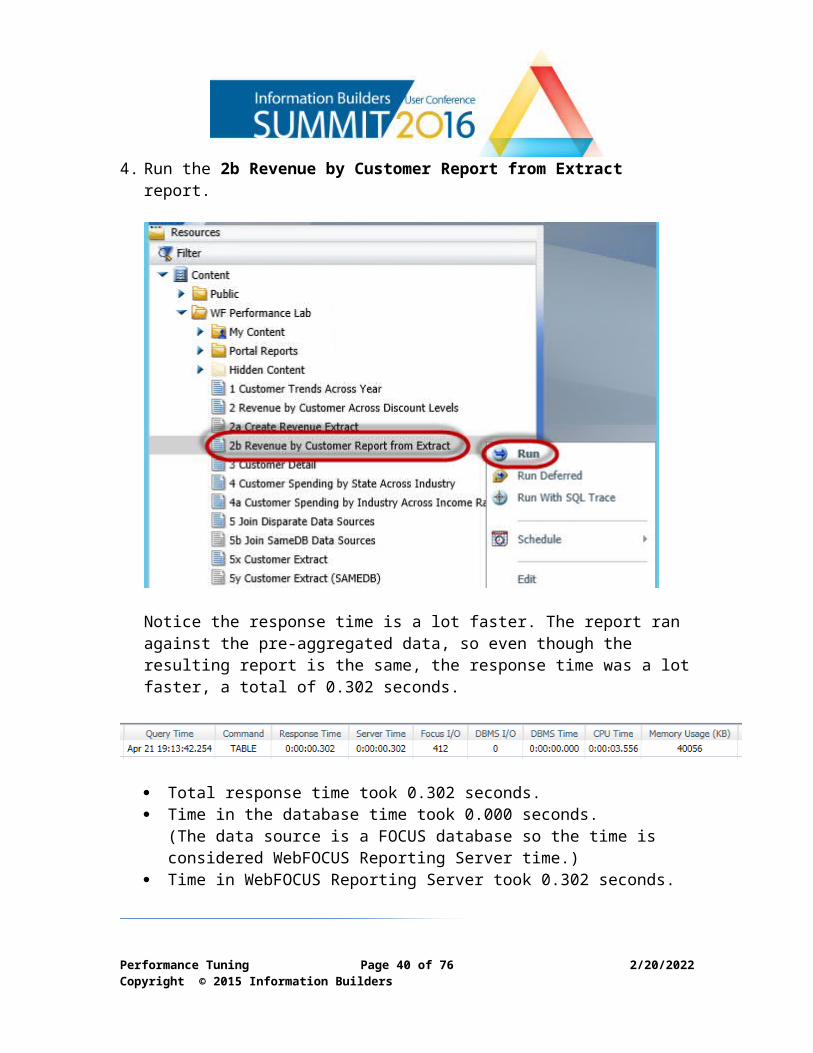
4. Run the 2b Revenue by Customer Report from Extract report.
Notice the response time is a lot faster. The report ran against the pre-aggregated data, so even though the resulting report is the same, the response time was a lot faster, a total of 0.302 seconds.
Total response time took 0.302 seconds. Time in the database time took 0.000 seconds.
(The data source is a FOCUS database so the time is considered WebFOCUS Reporting Server time.)
Time in WebFOCUS Reporting Server took 0.302 seconds.
5. Close the report output window.
Performance Tuning Page 29 of 58 5/9/2023Copyright © 2015 Information Builders
Example 3 – The report does not take long in the database, but it takes a long time to transfer data to the browser.
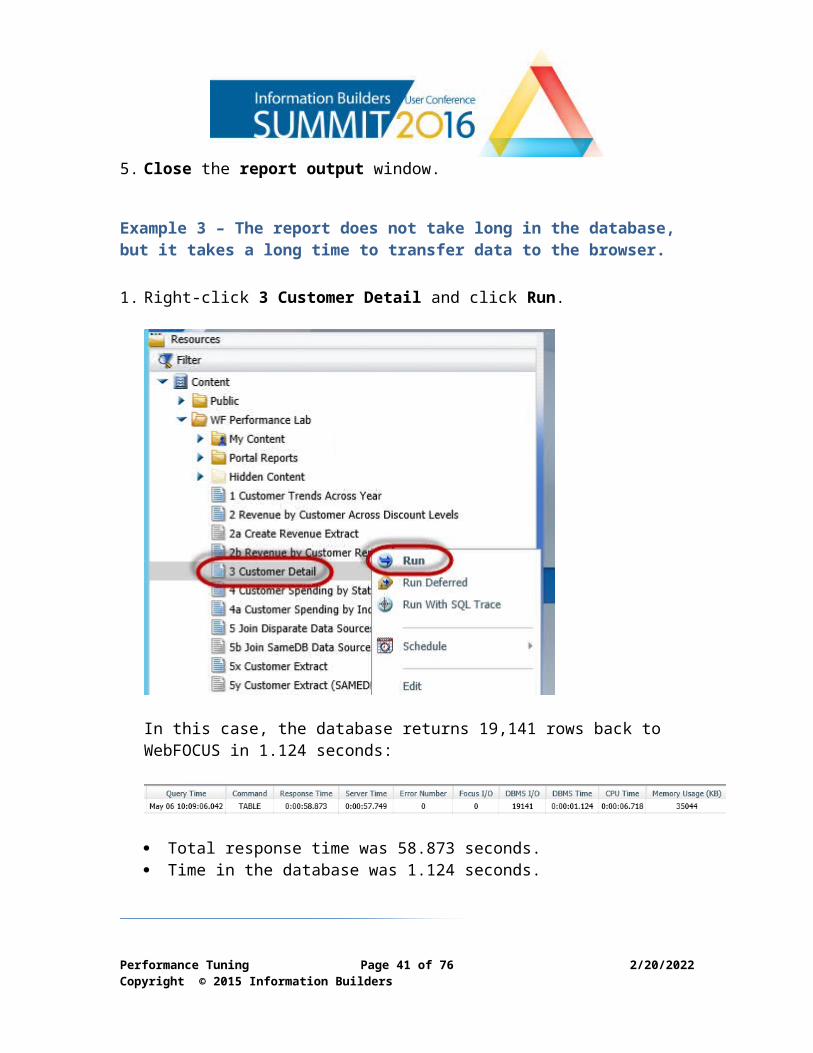
1. Right-click 3 Customer Detail and click Run.
In this case, the database returns 19,141 rows back to WebFOCUS in 1.124 seconds:
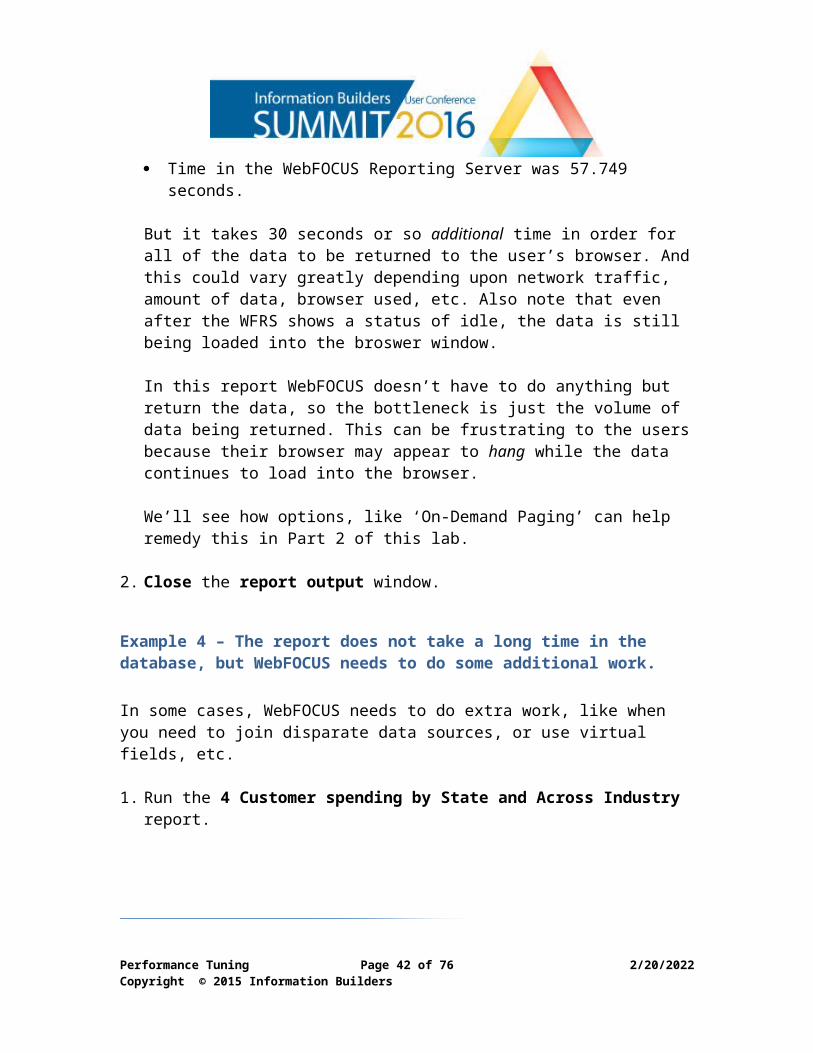
Total response time was 58.873 seconds. Time in the database was 1.124 seconds. Time in the WebFOCUS Reporting Server was 57.749 seconds.
But it takes 30 seconds or so additional time in order for all of the data to be returned to the user’s browser. And this could vary greatly depending upon network traffic, amount of data, browser used, etc. Also note that even after the WFRS shows a status of idle, the data is still being loaded into the broswer window.
Performance Tuning Page 30 of 58 5/9/2023Copyright © 2015 Information Builders
In this report WebFOCUS doesn’t have to do anything but return the data, so the bottleneck is just the volume of data being returned. This can be frustrating to the users because their browser may appear to hang while the data continues to load into the browser.
We’ll see how options, like ‘On-Demand Paging’ can help remedy this in Part 2 of this lab.
2. Close the report output window.
Example 4 – The report does not take a long time in the database, but WebFOCUS needs to do some additional work.
In some cases, WebFOCUS needs to do extra work, like when you need to join disparate data sources, or use virtual fields, etc.
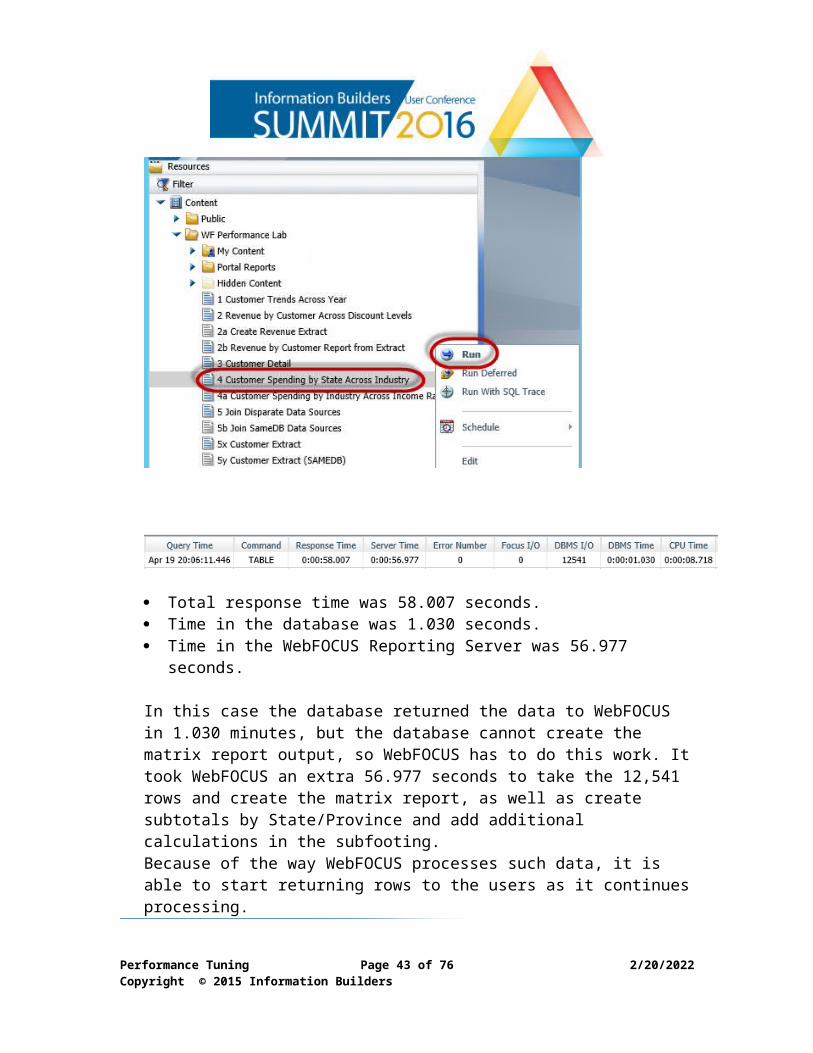
1. Run the 4 Customer spending by State and Across Industry report.
Performance Tuning Page 31 of 58 5/9/2023Copyright © 2015 Information Builders
Total response time was 58.007 seconds. Time in the database was 1.030 seconds. Time in the WebFOCUS Reporting Server was 56.977 seconds.
In this case the database returned the data to WebFOCUS in 1.030 minutes, but the database cannot create the matrix report output, so WebFOCUS has to do this work. It took WebFOCUS an extra 56.977 seconds to take the 12,541 rows and create the matrix report, as well as create subtotals by State/Province and add additional calculations in the subfooting. Because of the way WebFOCUS processes such data, it is able to start returning rows to the users as it continues processing.
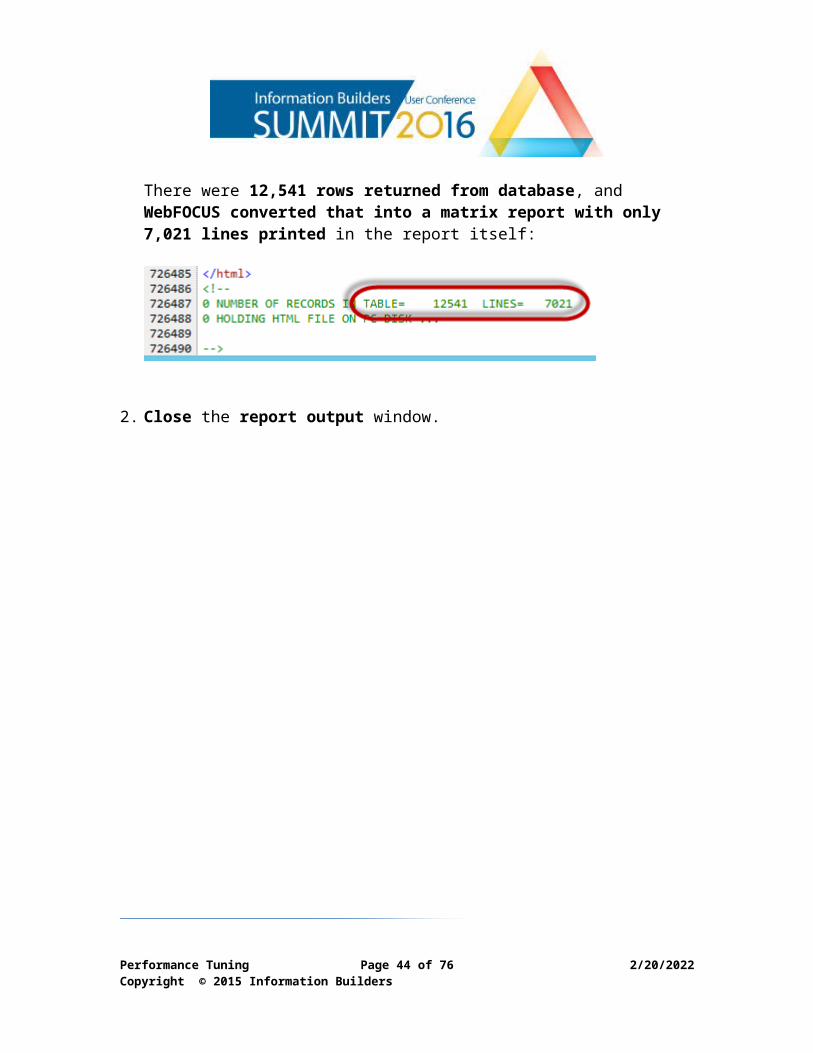
There were 12,541 rows returned from database, and WebFOCUS converted that into a matrix report with only 7,021 lines printed in the report itself:
2. Close the report output window.
Performance Tuning Page 32 of 58 5/9/2023Copyright © 2015 Information Builders
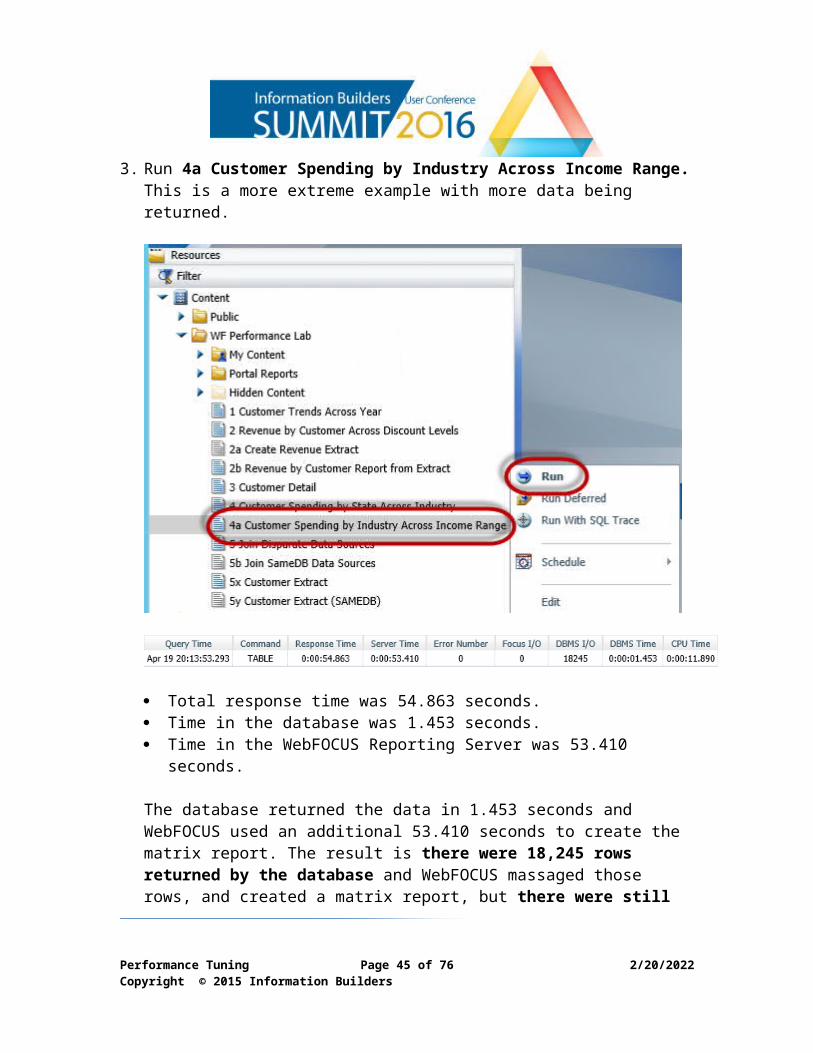
3. Run 4a Customer Spending by Industry Across Income Range. This is a more extreme example with more data being returned.
Total response time was 54.863 seconds. Time in the database was 1.453 seconds. Time in the WebFOCUS Reporting Server was 53.410 seconds.
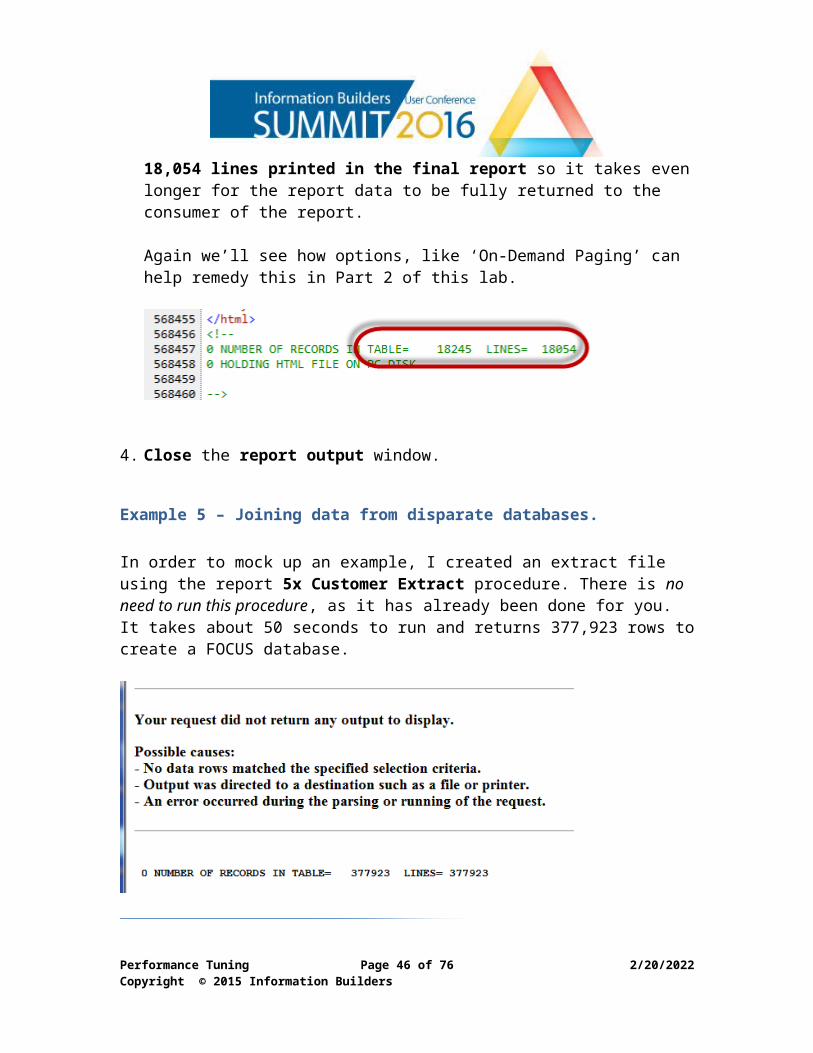
The database returned the data in 1.453 seconds and WebFOCUS used an additional 53.410 seconds to create the matrix report. The result is there were 18,245 rows returned by the database and WebFOCUS massaged those rows, and created a matrix report, but there were still 18,054 lines printed in the final report so it takes even longer for the report data to be fully returned to the consumer of the report.
Again we’ll see how options, like ‘On-Demand Paging’ can help remedy this in Part 2 of this lab.
Performance Tuning Page 33 of 58 5/9/2023Copyright © 2015 Information Builders
4. Close the report output window.
Example 5 – Joining data from disparate databases.
In order to mock up an example, I created an extract file using the report 5x Customer Extract procedure. There is no need to run this procedure, as it has already been done for you. It takes about 50 seconds to run and returns 377,923 rows to create a FOCUS database.
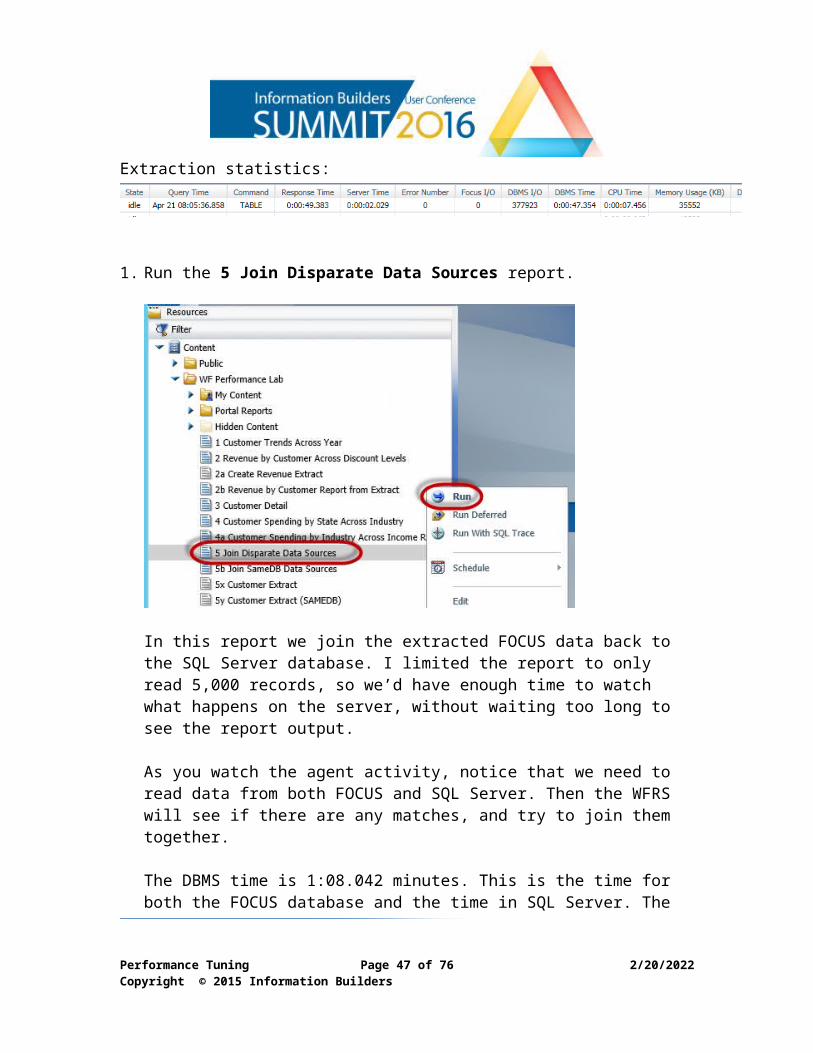
Extraction statistics:
1. Run the 5 Join Disparate Data Sources report.
Performance Tuning Page 34 of 58 5/9/2023Copyright © 2015 Information Builders
In this report we join the extracted FOCUS data back to the SQL Server database. I limited the report to only read 5,000 records, so we’d have enough time to watch what happens on the server, without waiting too long to see the report output.
As you watch the agent activity, notice that we need to read data from both FOCUS and SQL Server. Then the WFRS will see if there are any matches, and try to join them together.
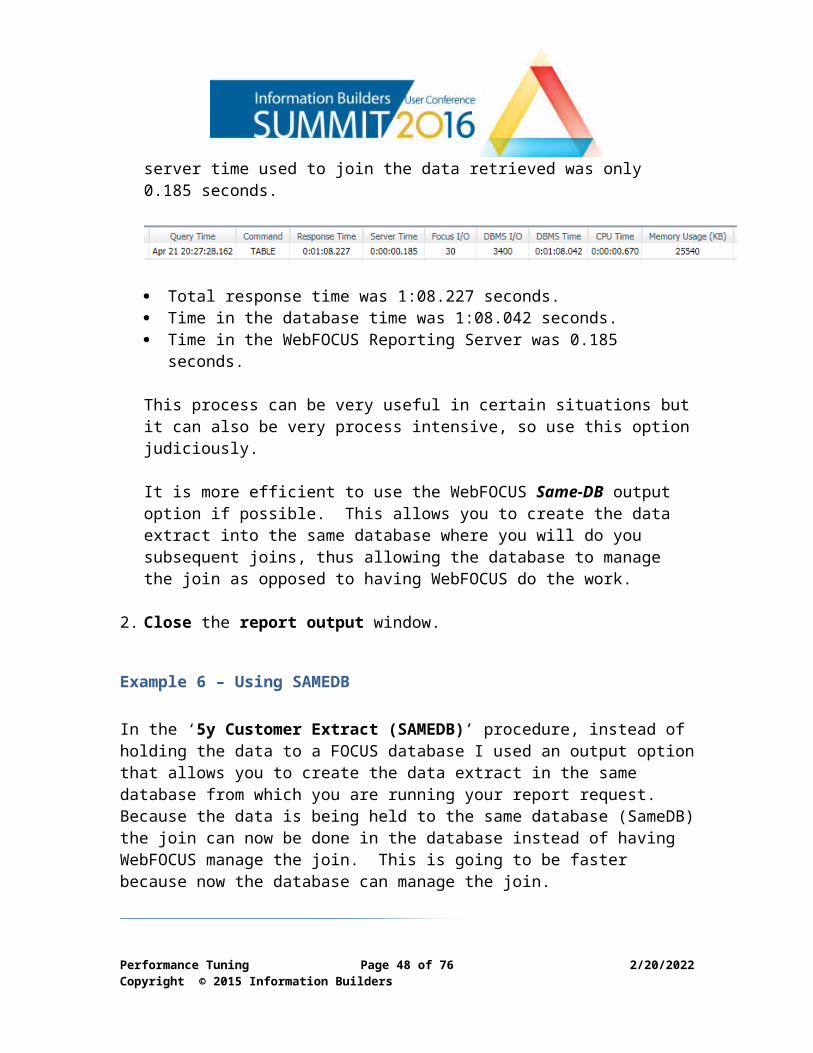
The DBMS time is 1:08.042 minutes. This is the time for both the FOCUS database and the time in SQL Server. The server time used to join the data retrieved was only 0.185 seconds.
Total response time was 1:08.227 seconds. Time in the database time was 1:08.042 seconds. Time in the WebFOCUS Reporting Server was 0.185 seconds.
This process can be very useful in certain situations but it can also be very process intensive, so use this option judiciously.
It is more efficient to use the WebFOCUS Same-DB output option if possible.
Performance Tuning Page 35 of 58 5/9/2023Copyright © 2015 Information Builders
This allows you to create the data extract into the same database where you will do you subsequent joins, thus allowing the database to manage the join as opposed to having WebFOCUS do the work.
2. Close the report output window.
Example 6 – Using SAMEDB
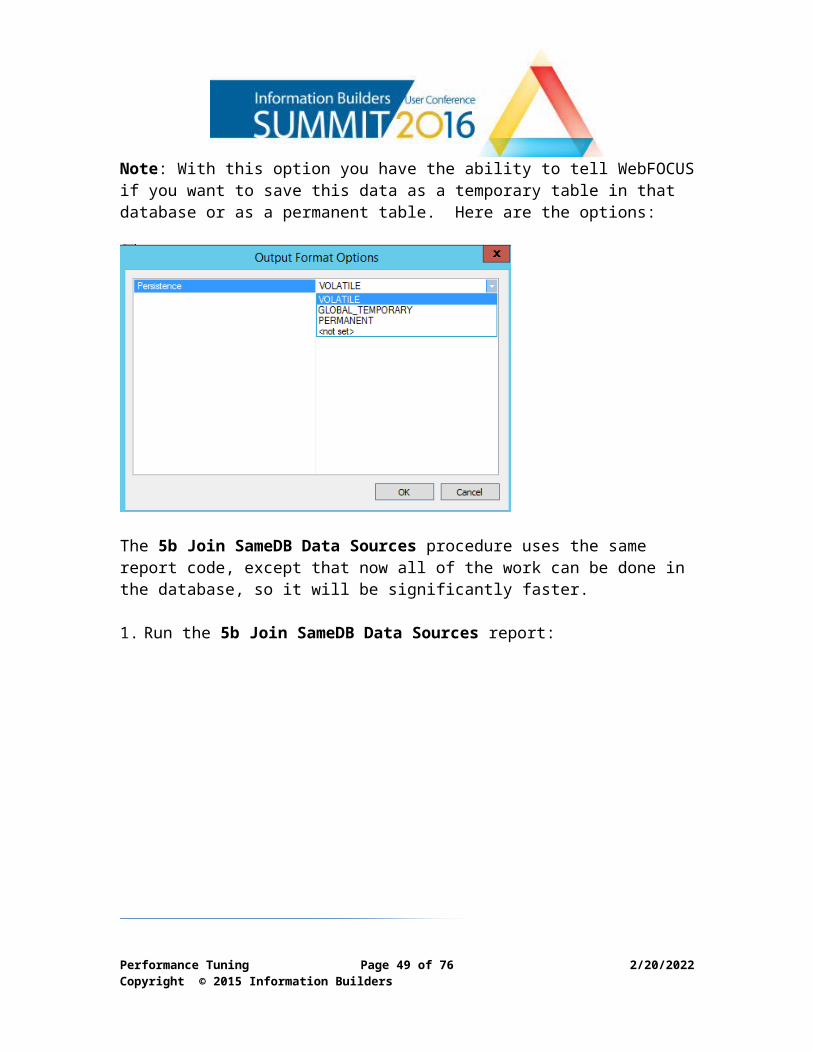
In the ‘5y Customer Extract (SAMEDB)’ procedure, instead of holding the data to a FOCUS database I used an output option that allows you to create the data extract in the same database from which you are running your report request. Because the data is being held to the same database (SameDB) the join can now be done in the database instead of having WebFOCUS manage the join. This is going to be faster because now the database can manage the join.
Note: With this option you have the ability to tell WebFOCUS if you want to save this data as a temporary table in that database or as a permanent table. Here are the options:
The 5b Join SameDB Data Sources procedure uses the same report code, except that now all of the work can be done in the database, so it will be significantly faster.
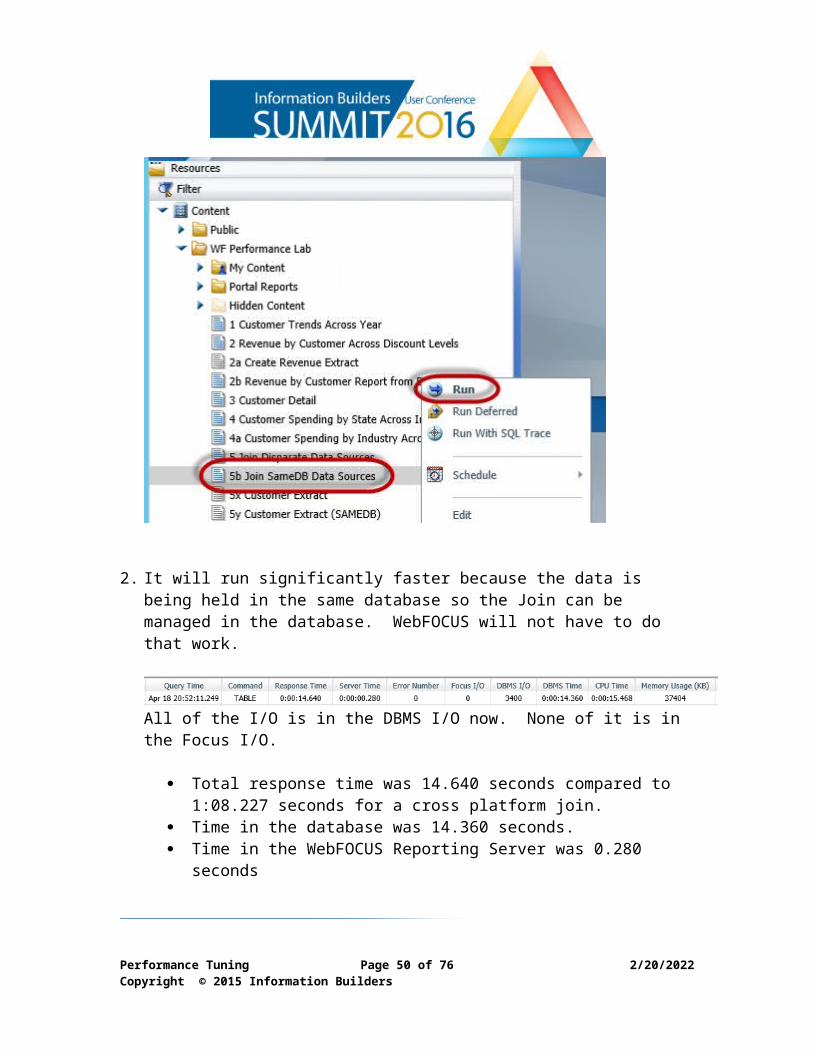
1. Run the 5b Join SameDB Data Sources report:
Performance Tuning Page 36 of 58 5/9/2023Copyright © 2015 Information Builders
2. It will run significantly faster because the data is being held in the same database so the Join can be managed in the database. WebFOCUS will not have to do that work.
All of the I/O is in the DBMS I/O now. None of it is in the Focus I/O.
Total response time was 14.640 seconds compared to 1:08.227 seconds for a cross platform join.
Time in the database was 14.360 seconds. Time in the WebFOCUS Reporting Server was 0.280 seconds
3. Close the report output window.
Performance Tuning Page 37 of 58 5/9/2023Copyright © 2015 Information Builders
Example 7 – Running reports from the BI Portal.In the above examples, we have looked at individual reports and how to gather information about the processing by observing the agents’ activities. If you are running an individual report, you will see only one agent become active as we have done today. What happens now when we run reports from the BI Portal? Portals often have multiple reports displaying per portal page. Let’s see how this impacts processing.
Performance Tuning Page 38 of 58 5/9/2023Copyright © 2015 Information Builders
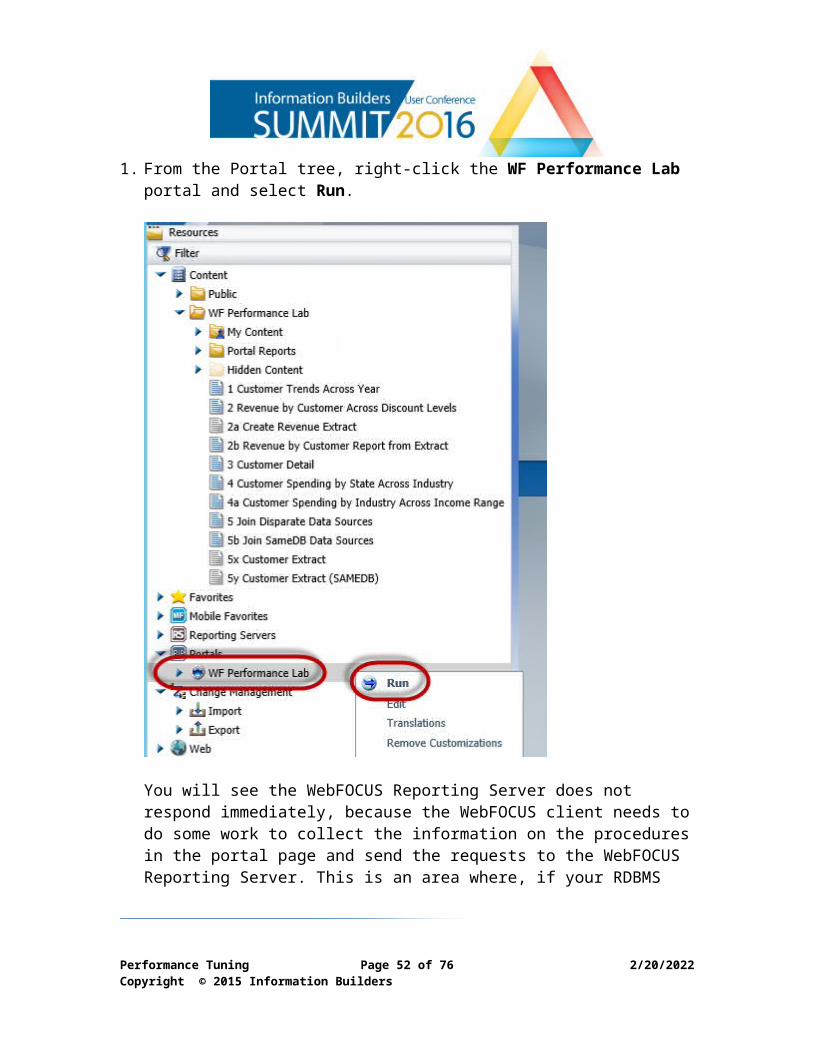
1. From the Portal tree, right-click the WF Performance Lab portal and select Run.
You will see the WebFOCUS Reporting Server does not respond immediately, because the WebFOCUS client needs to do some work to collect the information on the procedures in the portal page and send the requests to the WebFOCUS Reporting Server. This is an area where, if your RDBMS containing the WebFOCUS Client repository is not well tuned, you may experience a performance bottleneck.
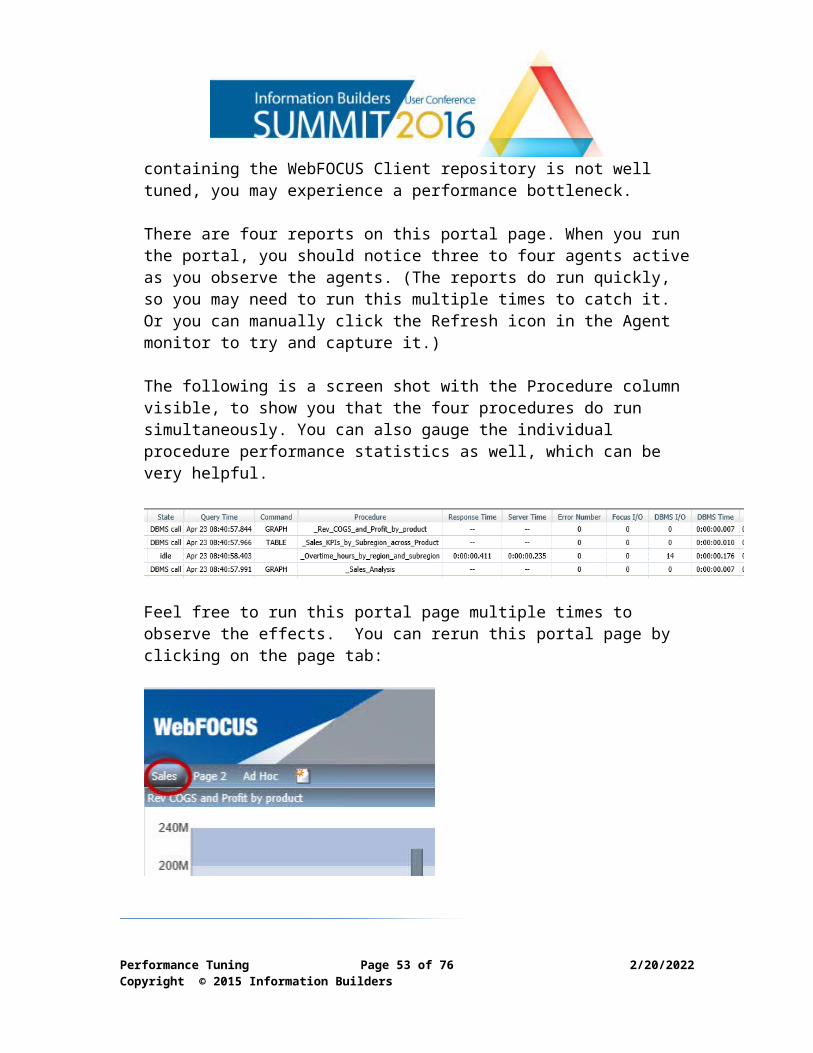
There are four reports on this portal page. When you run the portal, you should notice three to four agents active as you observe the agents. (The
Performance Tuning Page 39 of 58 5/9/2023Copyright © 2015 Information Builders
reports do run quickly, so you may need to run this multiple times to catch it. Or you can manually click the Refresh icon in the Agent monitor to try and capture it.)
The following is a screen shot with the Procedure column visible, to show you that the four procedures do run simultaneously. You can also gauge the individual procedure performance statistics as well, which can be very helpful.
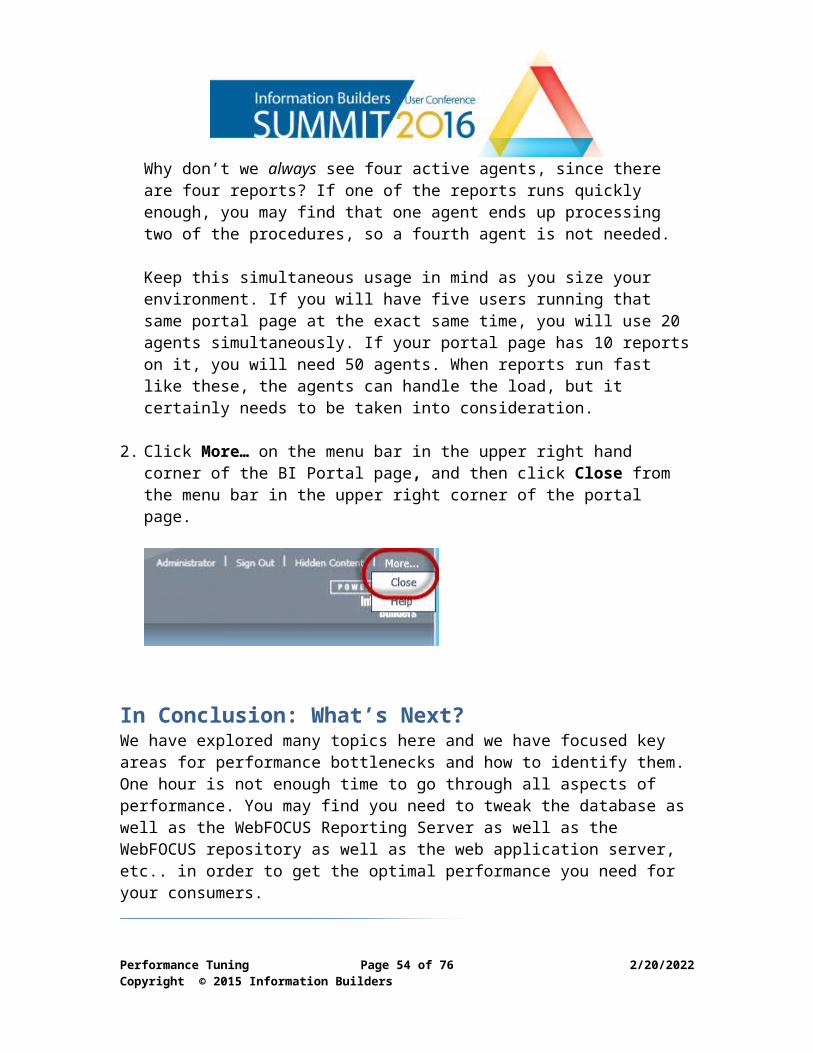
Feel free to run this portal page multiple times to observe the effects. You can rerun this portal page by clicking on the page tab:
Why don’t we always see four active agents, since there are four reports? If one of the reports runs quickly enough, you may find that one agent ends up processing two of the procedures, so a fourth agent is not needed.
Keep this simultaneous usage in mind as you size your environment. If you will have five users running that same portal page at the exact same time, you will use 20 agents simultaneously. If your portal page has 10 reports on it, you will need 50 agents. When reports run fast like these, the agents can handle the load, but it certainly needs to be taken into consideration.
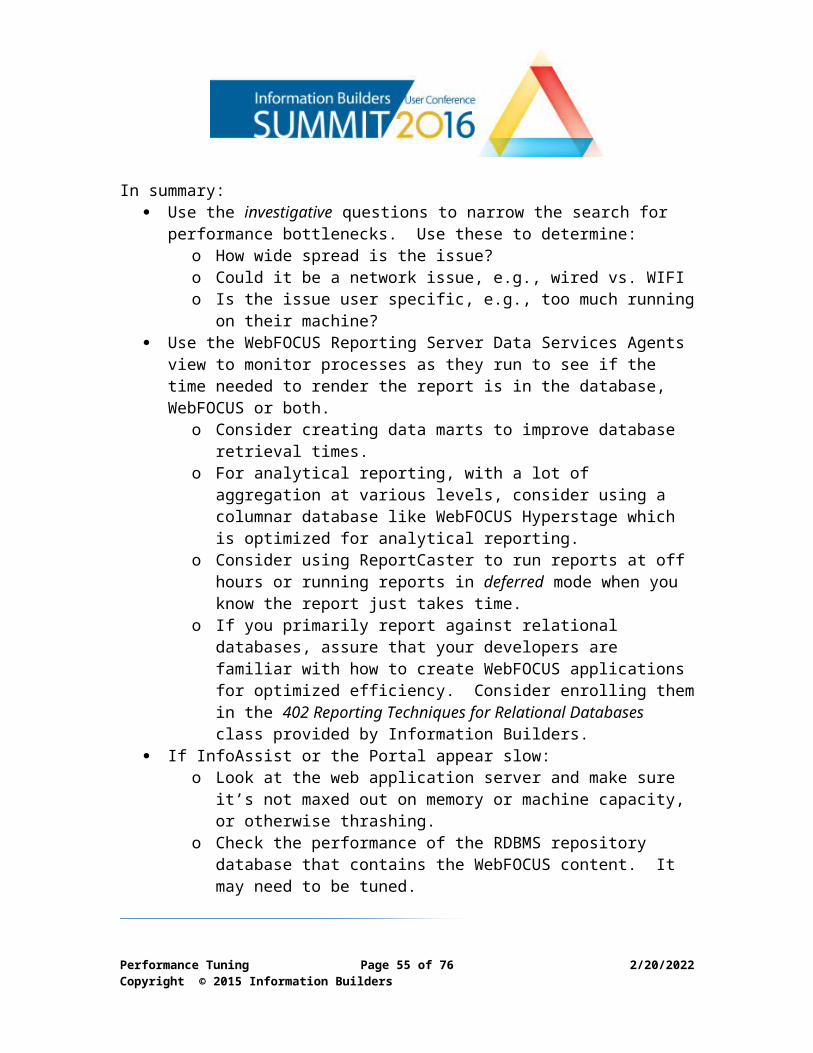
2. Click More… on the menu bar in the upper right hand corner of the BI Portal page, and then click Close from the menu bar in the upper right corner of the portal page.
Performance Tuning Page 40 of 58 5/9/2023Copyright © 2015 Information Builders
In Conclusion: What’s Next?We have explored many topics here and we have focused key areas for performance bottlenecks and how to identify them. One hour is not enough time to go through all aspects of performance. You may find you need to tweak the database as well as the WebFOCUS Reporting Server as well as the WebFOCUS repository as well as the web application server, etc.. in order to get the optimal performance you need for your consumers.
In summary: Use the investigative questions to narrow the search for performance
bottlenecks. Use these to determine:o How wide spread is the issue? o Could it be a network issue, e.g., wired vs. WIFIo Is the issue user specific, e.g., too much running on their machine?
Use the WebFOCUS Reporting Server Data Services Agents view to monitor processes as they run to see if the time needed to render the report is in the database, WebFOCUS or both.
o Consider creating data marts to improve database retrieval times.o For analytical reporting, with a lot of aggregation at various levels,
consider using a columnar database like WebFOCUS Hyperstage which is optimized for analytical reporting.
o Consider using ReportCaster to run reports at off hours or running reports in deferred mode when you know the report just takes time.
o If you primarily report against relational databases, assure that your developers are familiar with how to create WebFOCUS applications for optimized efficiency. Consider enrolling them in the 402 Reporting Techniques for Relational Databases class provided by Information Builders.
If InfoAssist or the Portal appear slow:o Look at the web application server and make sure it’s not maxed
out on memory or machine capacity, or otherwise thrashing.o Check the performance of the RDBMS repository database that
contains the WebFOCUS content. It may need to be tuned.
Performance Tuning Page 41 of 58 5/9/2023Copyright © 2015 Information Builders
If you have gone through everything you can think of and are still having performance challenges, Information Builders has many programs to help you. Please reach out to your local Information Builders office and see what option is the best for you.
Performance Tuning Page 42 of 58 5/9/2023Copyright © 2015 Information Builders
Congratulations! You’re done!
Q&A
Performance Tuning Page 43 of 58 5/9/2023Copyright © 2015 Information Builders
Appendix – Miscellaneous Performance Tidbits
View Generated SQLHow does a developer know if the SQL that WebFOCUS sends to the RDBMS is going to be optimized? There are two ways: They can include the below tracing commands. From within Developer Studio or App Studio they can click on the “Show
Generated SQL” option.
NOTE: Tracing the “generated SQL” only applies when the data request will actually generate SQL or MDX. This will not work for reports going against non-SQL/MDX databases, e.g., when going against FOCUS databases or flat files.
The SQL tracing option:Below is an example of the trace commands you can use, with a general description of what the command does:
SET TRACEOFF=ALL turns all current tracing settings offSET TRACEUSER=CLIENT sends tracing output to the screenSET TRACEON=SQLAGGR//CLIENT SQL aggregation traceSET TRACEON=STMTRACE//CLIENT SQL/MDX generated statements traceSET TRACESTAMP=OFF suppresses the display of the trace stampSET XRETRIEVAL=OFF translates the data request without retrieving data
Usually the above is added to a specific report that you want to trace. A technique I like to use is to put the above trace commands into a separate WebFOCUS procedure called “TraceSQL.fex” and then when I need this, I can simply add the below command to the top of my procedure in order to incorporate these trace statements into my report.
-INCLUDE TraceSQL
Performance Tuning Page 44 of 58 5/9/2023Copyright © 2015 Information Builders
The results of running a report with the above lines would be similar to:
It will explain why aggregation and/or optimization is or is not done.
The Developer Studio/ App Studio OptionIf you are using Developer Studio or App Studio, this is an option you can use from within these tools without having to manually include the trace statements above. The process is similar, but in Developer Studio you have the menu bars and in App Studio you have the ribbon bar.
Performance Tuning Page 45 of 58 5/9/2023Copyright © 2015 Information Builders
From within App Studio:
Results:
Performance Tuning Page 46 of 58 5/9/2023Copyright © 2015 Information Builders
From within Developer Studio:
Results:
Performance Tuning Page 47 of 58 5/9/2023Copyright © 2015 Information Builders
On Demand Paging / Pages On DemandWe can improve performance of reports with a lot of report output pages being sent back to the user by using “On-Demand Paging’. This option tells WebFOCUS to paginate the report output on the reporting server and send the user one page at a time. In App Studio it is accessed from the ‘Format’ tab in the ‘Navigation’ group:
You can do this in InfoAssist as well. Here it is called “Pages on Demand” and it is also accessed from the ‘Format’ tab in the ‘Navigation’ group:
Performance Tuning Page 48 of 58 5/9/2023Copyright © 2015 Information Builders
WebFOCUS Stress Test ToolThere are many tools on the market that allow you to mimic simultaneous usage against your application allowing you to see the results of the load on the system. WebFOCUS has an option that is accessible via the WebFOCUS Reporting Server web console. You can right mouse click on the procedure and select “Run Advanced” “Run Stress”:
For more information on how to utilize this tool, including how to test the load on procedures in the WebFOCUS Client, please see Tech Memo, “Simulating Request Processing on Clustered Servers”, DN4500778.0206.
Performance Tuning Page 49 of 58 5/9/2023Copyright © 2015 Information Builders
Run Deferred OptionWe mentioned “run deferred” as an option for running reports that you know will take a while to run. The “run deferred” option is available when you right mouse click a procedure from the WebFOCUS Client:
When choosing this option the user will be notified that the report has been submitted. Meanwhile their browser is free for them to do additioanl work.
The user can then go to the deferred output status view to see the status and to view the final report results.:
Performance Tuning Page 50 of 58 5/9/2023Copyright © 2015 Information Builders
The options on the far right are:
Click View to see the output:
WebFOCUS Client Session MonitorWe will cover the Session Monitor in Part 2 of this Performance lab series, but if you don’t attend Part 2, here is a brief overview.
Performance Tuning Page 51 of 58 5/9/2023Copyright © 2015 Information Builders
From the WebFOCUS Client Administration console:
Expand the “Diagnostics” folder and select “Session Monitor”:
Performance Tuning Page 52 of 58 5/9/2023Copyright © 2015 Information Builders
The session monitor will open:
Documentation can be found via the WebFOCUS Client online help. Go to the “Diagnostics and Utilities” :
Select “Monitoring WebFOCUS Sessions”:
Performance Tuning Page 53 of 58 5/9/2023Copyright © 2015 Information Builders
The help for the WebFOCUS Client Monitoring tool opens:
Performance Tuning Page 54 of 58 5/9/2023Copyright © 2015 Information Builders
WebFOCUS Reporting Server Data Services OptionsIf after your investigative work, it is determined that the WebFOCUS Reporting Server needs to be tuned, here are some of the options you have for adjusting values for the agents under each Data Service. The below options are documented in the WebFOCUS Reporting Server web console online help.
Right mouse click on the Data Service you wish to change and select “Properties”:
Performance Tuning Page 55 of 58 5/9/2023Copyright © 2015 Information Builders
I selected the “Default Data Service”:
Typical changes are adjusting the “maximum”, “number_ready” and “Queuing” options. The changes you make will be dependent upon your system and response time needs.
Performance Tuning Page 56 of 58 5/9/2023Copyright © 2015 Information Builders

WebFOCUS HyperstageWebFOCUS Hyperstage is an embedded data store that allows customers to dramatically improve the performance of their BI environment. Combining a column-oriented data store and Knowledge Grid architecture with Information Builders’ WebFOCUS BI platform, Hyperstage delivers a self-managing environment that is optimized for reporting and analytics.
WebFOCUS Hyperstage is an OLAP database replacement. Instead of creating a cube in a physical OLAP database, Hyperstage aggregates the answer without the time-consuming process of loading the cube.
WebFOCUS Hyperstage uses a hybrid approach that combines the I/O advantage of in-memory analytics with an intelligent architecture that allows data to be stored on disk without sacrificing performance. It eliminates the need to create, build, and maintain indexes; partition data; or perform manual tuning. Instead, the built-in Knowledge Grid creates and maintains information about the data as it is being loaded and as queries are run.
Sample performance results:
For more information contact your local Information Builders office, or go to: http://www.informationbuilders.com
Performance Tuning Page 57 of 58 5/9/2023Copyright © 2015 Information Builders
Performance Tuning Page 58 of 58 5/9/2023Copyright © 2015 Information Builders