problems with the use of the … · 2007; hiller et al., 2003; ... considered when preparing alkali...
TRANSCRIPT

The application of a new method of Fourier Transform InfraredSpectroscopy to the analysis of burned bone
TeesRep - Teesside'sResearch Repository
Item type Article
Authors Thompson, T. J. U. (Tim); Gauthier, M. (Marie); Islam, M.(Meezanul)
Citation Thompson, T. J. U., Gauthier, M. and Islam, M. (2009)'The application of a new method of Fourier TransformInfrared Spectroscopy to the analysis of burned bone',Journal of Archaeological Science, 36 (3), pp.910-914.
DOI 10.1016/j.jas.2008.11.013
Publisher Elsevier
Journal Journal of Archaeological Science
Rights Author can archive post-print (ie final draft post-refereeing). For full details seehttp://www.sherpa.ac.uk/romeo/ [Accessed 24/02/2010]
Downloaded 21-Aug-2018 09:51:15
Link to item http://hdl.handle.net/10149/92834
TeesRep - Teesside University's Research Repository - https://tees.openrepository.com/tees

TeesRep: Teesside University's Research Repository http://tees.openrepository.com/tees/
This full text version, available on TeesRep, is the post-print (final version prior to publication) of:
Thompson, T. J. U., Gauthier, M. and Islam, M. (2009) 'The application of a new
method of Fourier Transform Infrared Spectroscopy to the analysis of burned bone',
Journal of Archaeological Science, 36 (3), pp.910-914.
For details regarding the final published version please click on the following DOI link:
http://dx.doi.org/10.1016/j.jas.2008.11.013
When citing this source, please use the final published version as above.
This document was downloaded from http://tees.openrepository.com/tees/handle/10149/92834
Please do not use this version for citation purposes.
All items in TeesRep are protected by copyright, with all rights reserved, unless otherwise indicated.

THE APPLICATION OF A NEW METHOD OF FOURIER TRANSFORM
INFRARED SPECTROSCOPY TO THE ANALYSIS OF BURNED BONE
T.J.U. Thompson a, Marie Gauthier b, Meez Islam a
a School of Science & Technology, University of Teesside, Borough Road,
Middlesbrough, TS1 3BA, UK.
b University of Chemistry of Lille, France.
KEYWORDS: Burned bone; FTIR; Crystallinity Index; C/P; C/C. Abstract A new method of Fourier Transform Infrared Spectroscopy (FTIR) is applied to the analysis of burned bones. FTIR analyses were undertaken to examine changes in Crystallinity Index (CI), Ca/P and C/C ratios in bone experimentally burned to known, but varying, temperatures and durations. Three sample groups were used to assess the new FTIR method. Blind tests were performed to assess the use of the CI for predicting burning conditions. The results suggested that the new method of FTIR was preferable to the traditional approach, that CI is affected by factors other than temperature of burning and that predictions of burning conditions in archaeological material may not extend beyond that of ‘high’ or ‘low’ intensity of burning.
INTRODUCTION Burned bone forms a significant component of many archaeological contexts, yet the subject still lacks much focussed and cohesive research. The contribution of previous work examining the visible manifestations of burning, such as colour change (e.g.: Chandler, 1987; Grévin et al., 1998; Shipman et al., 1984; Stiner et al., 1995), fracture patterns (e.g.: Buikstra and Swegle, 1989; Stiner et al., 1995; Thurman and Willmore, 1981) and mechanical strength (e.g.: Kalsbeek and Richter, 2006; McKinley, 1993; McKinley, 1994), for our understanding of heat-induced changes in bone have recently been brought into question (Thompson, 2005). This is because these traditional and relatively straight-forward foci of study are actually manifestations of other, more fundamental changes within the bone. Current work must focus on the application of scientific techniques to the examination of microstructural osseous changes in a more robustly quantitative manner (e.g.: Enzo et al., 2007; Hiller et al., 2003; Munro et al., 2007; Rogers and Daniels, 2002; Thompson and Chudek, 2007). Such studies have provided much more information regarding the changes to the crystal and elemental structure of bone during the process of burning, and it is these changes (dubbed primary-level changes; Thompson, 2004) that have been shown statistically to provide the greatest chance of predicting the specifics of the archaeological burning event (such as, temperature of fire, duration of burning etc) from the remains themselves (Thompson, 2005). One such quantitative method has been the application of the Crystallinity Index. The Crystallinity Index (CI), or ‘splitting factor’, is a measure of the order of the crystal structure and composition within bone (Stiner et al., 2001). The CI values in modern unaltered bone typically lie around 2.50-3.25, but will increase as crystal structure becomes more ordered (Munro et al., 2007; Nagy et al., 2008; Nielsen-Marsh and Hedges, 1999; Shipman et al., 1984; Stiner et al., 2001). The crystal structure of bone can be seen to very slowly alter towards a more ordered composition with an associated increase in overall crystal size following death (Bartsiokas and Middleton, 1992; Munro et al., 2007; Olsen et al., 2008; Surovell and Stiner, 2001). The speed of this increase in crystal order can also be increased by weathering conditions (Stiner et al., 2001). Changes in bone porosity resulting from various other diagenetic pathways have also been associated with changes to CI (Nielsen-Marsh and Hedges, 1999). The CI is calculated by measuring the ratio of specific spectra peaks (discussed in more detail below), and changes to this ratio indicate a change in peak sharpness. Significantly these changes in CI have been shown to be the direct result of burning (Person et al., 1996; Stiner et al., 2001). It is argued that the heat-induced increase in CI is primarily the result of loss of the protective organic phase and structural carbonate (Person et al., 1996). CI has not been applied extensively in the literature, but it has nonetheless been argued to demonstrate good reproducibility of results (Person et al., 1996) and does seem to hold great potential for archaeological study, particularly for those attempting to distinguish between burned and non-burned bone (such as in Enzo et al., 2007; Shahack-Gross et al., 1997; Sillen and Hoering, 1993) – although it is not discriminating enough to distinguish boiled remains (Koon et al., 2003). Initial work began to assess the

potential of the CI in burned bone studies in the 1990s but its use tailed off (presumably as a result of its high technical requiements) until more recently, where it can be seen incorporated into studies alongside other quantitative methods. To date, the key problems with the CI have been (a) distinguishing between changes in the index due to burning and due to normal bone diagenesis (Bartsiokas and Middleton, 1992; although these are likely over the tens of millennia timescale), and that (b) it is an entirely arbitrary numerical construction (Piga et al., 2008).
The Crystallinity Index can be measured using X-ray Diffraction (XRD) or Fourier Transform Infra-red spectroscopy (FTIR). Both have been applied in the literature, with the former technique being marginally more popular. Here, we have used the FTIR approach in the mid infrared part of the electromagnetic spectrum, nominally the region from 4000 – 400 cm-1. One of the great advantages of infrared spectroscopy is that virtually any sample in any state may be studied – this is of great relevance considering the varying preservational and diagentic state of archaeological human remains. Infrared spectroscopy is a technique based on the vibrations of bonds within a molecule. An infrared spectrum is commonly obtained by passing infrared radiation through a sample and determining what fraction of the incident radiation is absorbed at a particular wavelength. The wavelength at which any peak in an absorption spectrum appears corresponds to the frequency of vibration of a specific part of a molecule.
FTIR analysis of solid phase samples can be typically performed using two different methodologies. The first, more traditional and widely used approach, FTIR-KBr, utilises a pellet of potassium bromide (KBr) which is transparent in the mid-infrared region, as a support medium for the sample. The mixture is usually ground with an agate mortar and pestle and subjected to a pressure of about 10 tonne in an evacuated die. This sinters the mixture and produces a clear transparent disc, which is then placed in the sample chamber of the spectrometer for direct absorption measurements. Certain factors need to be considered when preparing alkali halide discs. The ratio of the sample is important; little sample is needed and around 3 mg of sample with about 200 mg of halide is sufficient. The disc must be of the correct thickness; thin discs are fragile and difficult to handle, while thick discs transmit too little radiation. If the alkali halide is not perfectly dry, bands due to water appear in the spectrum. The alkali halide should be kept desiccated and warm prior to use in order to minimize the effect on results of water (Stuart, 2004).
The second, more recent approach is termed, FTIR-ATR. This utilises an attenuated total reflection (ATR) accessory which operates by measuring the changes that occurs in a totally internally reflected infrared beam when the beam comes into contact with a sample. An infrared beam is directed onto an optically dense crystal with a high refractive index at an angle greater than the critical angle for total internal reflection. This internal reflectance creates an evanescent wave that extends beyond the surface of the crystal into the sample held in contact with the crystal. This evanescent wave protrudes only a few microns beyond the crystal surface and into the sample. Consequently, there must be good contact between the sample and the crystal surface. In
regions of the infrared spectrum where the sample absorbs energy, the evanescent wave will be attenuated or altered. The absorption of the evanescent wave also results in a decrease in the intensity of the totally internally reflected beam, which is picked up by the IR detector in the FTIR spectrometer and manifests itself as absorption features in the IR spectrum. The depth of penetration in ATR spectroscopy is a function of the wavelength, the refractive index of the crystal, and the angle of the incident radiation. The crystals used in ATR cells are made from materials that have low solubility water and are of a very high refractive index. Such materials include zinc selenide, germanium, and diamond. FTIR-KBr has been used successfully in previous burned bone work (such as Munro et al., 2007, Olsen et al., 2008 and Shahack-Gross et al., 1997). None of the previous burned bone studies appear to have utilised FTIR-ATR. FTIR-ATR has advantages over FTIR-KBr in that sample preparation is quicker and less messy, user-to-user spectra variation is minimised and the impact of sample preparation on results is reduced (see Surovell and Stiner, 2001 for illustration). To date, there has been no comparison of the result produced by these two different approaches.
The use of FTIR also allows for the examination of other indices. The Carbonate to Phosphate ratio (C/P) has also been exploited in the study of burned bone (Olsen et al., 2008; Zapata et al., 2006) – the value decreases as a result of burning – as has the Carbon/Nitrogen ratio (Sillen and Hoering, 1993); while the Carbonyl to Carbonate ratio (C/C) should also be able to provide information regarding the structural composition of burned bone.
There were two main aims to this research: (i) to compare the use of the two FTIR techniques, FTIR-ATR and FTIR-KBr with regards to obtaining CI, C/P and C/C ratios of burned bone; (ii) to attempt a blind test to see if the CI, C/P ratio and C/C ratios could accurately predict the temperature of burning. METHOD AND MATERIALS Osteological Samples Three samples were used in this research. All samples were of modern sheep bones burned in an electric muffle furnace to known temperatures for specific periods of time following the protocol adopted in Hiller et al. (2003), Thompson (2004; 2005) and Thompson and Chudek (2007). Sample 1 was used to calculate the initial CI, C/P and C/C values for both FTIR-ATR and FTIR-KBr. Sample 2 was introduced to clarify some of the potential methodological issues raised during the analysis of Sample 1 (discussed below). Sample 3 was used for the blind testing of the CI values. FTIR Representative fractions from each bone were collected and ground with an agate mortar and pestle. For the FTIR-ATR method, automatic software correction of the spectra accounted for the variation of depth of penetration with wavelength. The ATR accessory used a diamond crystal which had an operational range from 30,000 to 200cm-1. For the FTIR-KBr discs, 1-3mg of
ground bone was mixed with around 100mg of KBr and a pellet was prepared using a press. These FTIR spectra were obtained using a Nicolet 5700 FTIR
Spectrometer controlled by OMNIC software. An expanded spectrum in the 2000-400 cm-1 range was used for measuring several factors with a spectral resolution of 4 cm-1. Each spectrum was the result of an average of 16 scans. Crystallinity Index The crystallinity is a function of the extent of splitting of the two absorption bands at 605 and 565 cm-1 (Olsen et al., 2008). CI was calculated according to Weiner et al. (1995) and as used in Nagy et al. (2008). For a baseline corrected spectrum the heights of the absorptions were added and then divided by the height of the minimum between them (Nagy et al., 2007; Weiner et al., 1995). C/P IR spectra of the bio-apatite bone fraction are represented by vibration band of mainly CO3 and PO4 giving absorption peaks at 710, 874 and 1415 cm-1 and 565, 605 and 1035 cm-1 respectively. The carbonate absorption peak at 710cm-1 is characteristic of CaCO3 and can therefore be used to detect absorbed CaCO3 contaminants. As the absorption peak height at 1415 cm-1 and 1035 cm-1 is proportional to the content of carbonate and phosphate, the carbonate content of the samples was estimated by the C/P ratio given as C/P = A1415/A1035 (Olsen et al., 2008). A new background was created for each run. C/C Changes in the C/C ratio, which is the ratio between the carbonyl (CO) peak (1455) and CO3 peak (1415) are also expected. This provides information on the ratio of organic to inorganic material present in the bone. The CO peak arises from the amide group present in collagen, which will begin to decompose at elevated temperatures. Blind Testing One of the arguments put forward for the use of CI is that it could provide evidence for the occurance of burning. Beyond that, it may indicate the intensity of burning. We tested 10 samples of bone (each was sampled four times) using both FTIR methods. The bones were burned by TJUT but the details of each were unknown to the FTIR operator (MG) until after the experiments. The temperature predictions were based on the regression equations created from Sample 2. As with Person et al. (1996) and Surovell and Stiner (2001) the relationship was non-linear. RESULTS Table 1 displays the changes in CI as a result of temperature and duration of burning, in addition to FTIR methodology. Surovell and Stiner (2001) have previously demonstrated that methodological practice and sample preparation can have an impact on CI values. It can been seen here that FTIR technique is just as important in terms of the actual CI values. Figures 1a and 1b,
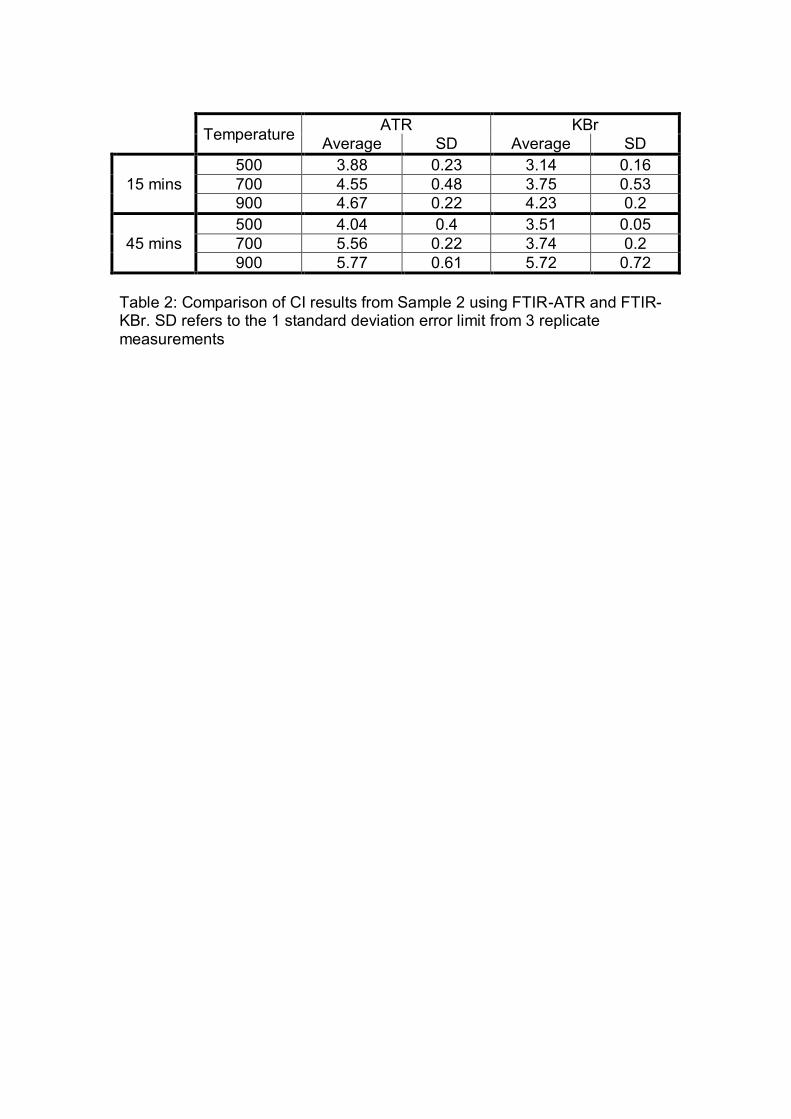
however, shows that the overall trend in CI remains constant regardless of FTIR method adopted (that is, CI increases with burning intensity). During the analysis of Sample 1, it became clear that there were unexpected differences between the CI values for each bone sample. To calculate CI with Sample 1, each bone was sampled three times, however the results often varied. Therefore a second, larger sample (18) was analysed whilst applying more stringent controls to the collection of background spectra. These results are presented in Table 2. Table 3 and Figure 3 present the results of the blind testing. This was attempted in order to determine the usefulness of CI as a means of providing more information than simply burned or unburned. As can be seen, with the exception of samples 1 and 10, the accuracy of our prediction equations is poor. At its worst, a difference of ~400oC is recorded. Mostly the differences are between 100 and 200 degrees C. The predictions from the FTIR-ATR method are marginally more accurate. DISCUSSION There is an unfortunate lack of comparable data in the literature (i.e. of known temperature burnings), however our FTIR-KBr CI values (Table 2) do compare reasonably favourably with Munro et al. (2007). Unfortunately it is not possible to compare the CI calculated using FTIR to that created using XRD (of which there is more data published). This is because of the methodological differences between the two, principally that FTIR is based on an area averaging approach while XRD is based on a volume averaging method (Rogers and Daniels, 2002). These differences even result in the creation of slightly different spectra for the same samples of bone (as in Chakraborty et al., 2006). Both Tables 1 and 2 demonstrate that there are differences in the CI values produced using the different FTIR approaches. Figure 2 highlights these differences with the spectra themselves. With both samples groups, FTIR-KBr produces lower CI values. It can also be seen that the larger sample size in Table 2 has greatly reduced the average CI values. We should be able to have more confidence in the results in Table 2 as they benefit from a larger sample size and greater control of the background spectra. However, extensive intra-bone variation can be seen in each (as evident from the general increase in standard deviations compared to Table 1). It is therefore clear that the sampling protocol used is critical, and that different sections of any one burned bone will produce different CI values. This has been suggested as a theoretical problem by Surovell and Stiner (2001), and has clear implications for the comparison of CI values within and between research projects. Figures 2a and 2b show typical spectra curves for low and high intensity burning. Spectra for all burning intensities are not provided as it is not possible
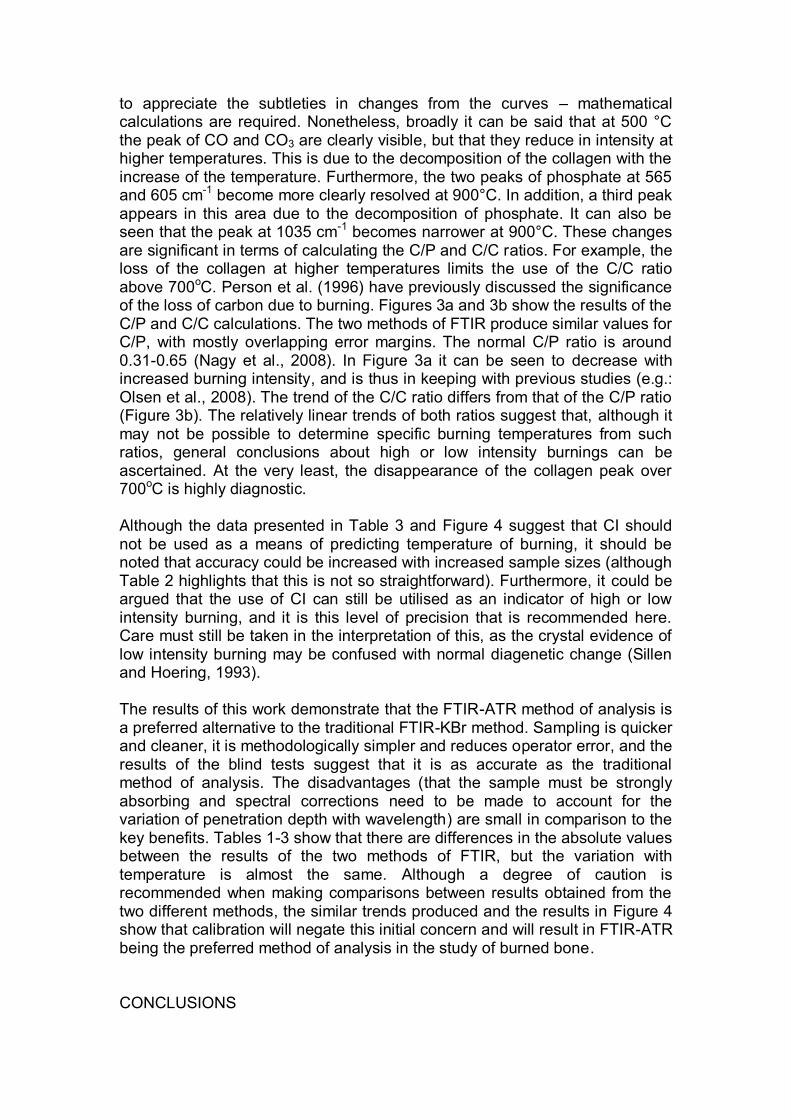
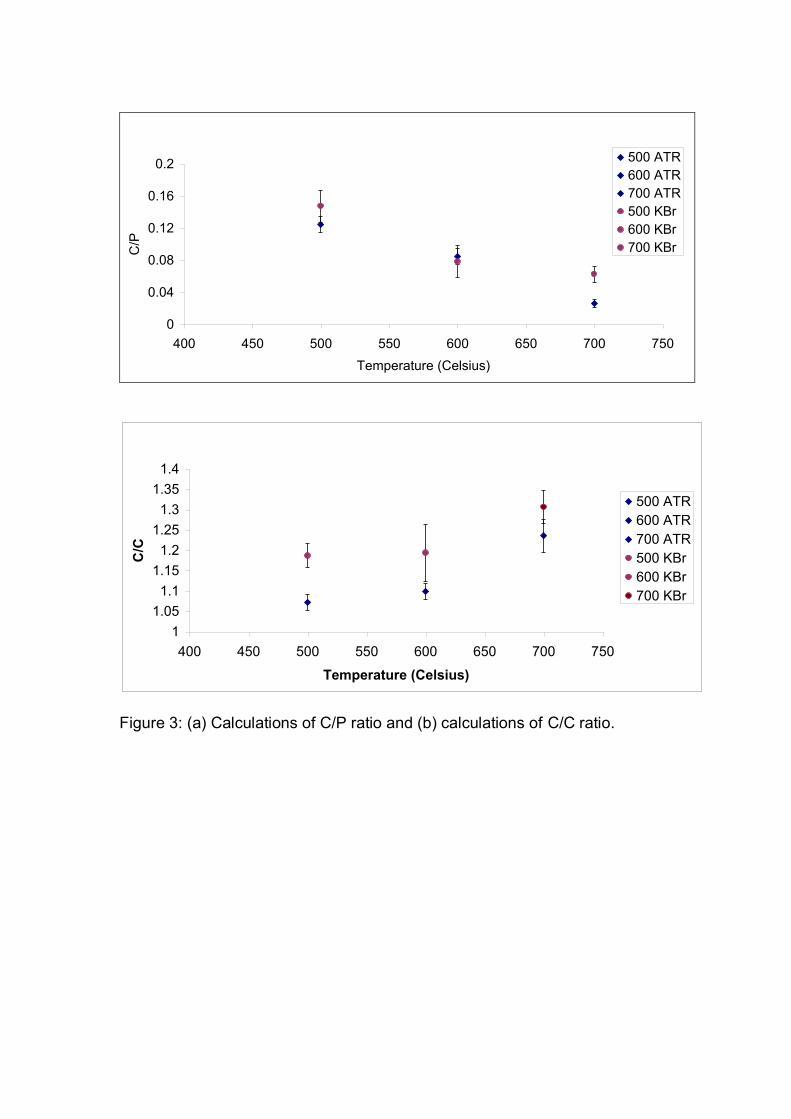
to appreciate the subtleties in changes from the curves – mathematical calculations are required. Nonetheless, broadly it can be said that at 500 °C the peak of CO and CO3 are clearly visible, but that they reduce in intensity at higher temperatures. This is due to the decomposition of the collagen with the increase of the temperature. Furthermore, the two peaks of phosphate at 565 and 605 cm-1 become more clearly resolved at 900°C. In addition, a third peak appears in this area due to the decomposition of phosphate. It can also be seen that the peak at 1035 cm-1 becomes narrower at 900°C. These changes are significant in terms of calculating the C/P and C/C ratios. For example, the loss of the collagen at higher temperatures limits the use of the C/C ratio above 700oC. Person et al. (1996) have previously discussed the significance of the loss of carbon due to burning. Figures 3a and 3b show the results of the C/P and C/C calculations. The two methods of FTIR produce similar values for C/P, with mostly overlapping error margins. The normal C/P ratio is around 0.31-0.65 (Nagy et al., 2008). In Figure 3a it can be seen to decrease with increased burning intensity, and is thus in keeping with previous studies (e.g.: Olsen et al., 2008). The trend of the C/C ratio differs from that of the C/P ratio (Figure 3b). The relatively linear trends of both ratios suggest that, although it may not be possible to determine specific burning temperatures from such ratios, general conclusions about high or low intensity burnings can be ascertained. At the very least, the disappearance of the collagen peak over 700oC is highly diagnostic. Although the data presented in Table 3 and Figure 4 suggest that CI should not be used as a means of predicting temperature of burning, it should be noted that accuracy could be increased with increased sample sizes (although Table 2 highlights that this is not so straightforward). Furthermore, it could be argued that the use of CI can still be utilised as an indicator of high or low intensity burning, and it is this level of precision that is recommended here. Care must still be taken in the interpretation of this, as the crystal evidence of low intensity burning may be confused with normal diagenetic change (Sillen and Hoering, 1993). The results of this work demonstrate that the FTIR-ATR method of analysis is a preferred alternative to the traditional FTIR-KBr method. Sampling is quicker and cleaner, it is methodologically simpler and reduces operator error, and the results of the blind tests suggest that it is as accurate as the traditional method of analysis. The disadvantages (that the sample must be strongly absorbing and spectral corrections need to be made to account for the variation of penetration depth with wavelength) are small in comparison to the key benefits. Tables 1-3 show that there are differences in the absolute values between the results of the two methods of FTIR, but the variation with temperature is almost the same. Although a degree of caution is recommended when making comparisons between results obtained from the two different methods, the similar trends produced and the results in Figure 4 show that calibration will negate this initial concern and will result in FTIR-ATR being the preferred method of analysis in the study of burned bone. CONCLUSIONS
The results and discussion here suggest four key conclusions: (1) that CI is greatly influenced by the region of bone that the sample originates; (2) that CI is influenced by method of FTIR used, and can be reliably measured by FTIR-ATR; (3) that CI might stabilise around the 700oC burning point (again, significant as much structural change occurs here); and (4) that FTIR can distinguish non-burned from low intensity and high intensity burning. Although it is clear that the Crystallinity Index can make a useful contribution to the study and interpretation of burned bones from archaeological contexts, these above considerations must be borne in mind if one is to avoid misinterpreting the osteological data. ACKNOWLEDGEMENTS We are very grateful to Helen Hogson and Doug Mclellan for their technical assistance during this research, and to Dr Becky Gowland (Department of Archaeology, Durham University) for providing, as ever, very useful comments and suggestions on earlier drafts of this paper. TJUT is supported by the Institute for Innovation & Development in Engineering and Applied Science, University of Teesside. MG was supported by an ERASMUS link between the Universities of Lille and Teesside.

REFERENCES Bartsiokas, A., Middleton, A.P. 1992. Characterization and dating of recent and fossil bone by X-ray Diffraction. Journal of Archaeological Science 19, 63-72. Buikstra, J.E., Swegle, M. 1989. Bone modification due to burning: Experimental evidence. In Bonnichsen, R., Sorg, M.H. (eds.) Peopling of the Americas, 247-258. Orono, Maine: Centre for the Studies of the First Americans. Chakraborty, S., Bag, S., Pal, S., Mukherjee, A.K. 2006. Structural and microstructural characterization of bioapatites and synthetic hydroxyapatite using X-ray powder diffraction and Fourier transform infrared techniques. Journal of Applied Crystallography 39, 385-390. Chandler, N.P. 1987. Cremated teeth. Archaeology Today August: 41-45. Enzo, S., Bazzoni, M., Mazzarello, V., Piga, G., Bandiera, P., Melis, P. 2007. A study by thermal treatment and X-ray powder diffraction on burnt fragmented bones from tombs II, IV and IX belonging to the hypogeic necropolis of « Sa Figu » near Ittiri, Sassari (Sardinia, Italy). Journal of Archaeological Science 34, 1731-1737. Grévin, G., Bailet, P., Quatrehomme, G., Ollier, A. 1998. Anatomical reconstruction of fragments of burned human bones: A necessary means for forensic identification. Forensic Science International 96, 129-134. Hiller, J.C., Thompson, T.J.U., Evison, M.P., Chamberlain, A.T., Wess, T.J. 2003. Bone mineral change during experimental heating: an X-ray scattering investigation. Biomaterials 24, 5091-5097. Kalsbeek, N., Richter, J. 2006. Preservation of burned bones: an investigation of the effects of temperature and pH on hardness. Studies in Conservation 51, 123-138. Koon, H.E.C., Nicholson, R.A., Collins, M.J. 2003. A practical approach to the identification of low temperature heated bone using TEM. Journal of Archaeological Science 30, 1393-1399. McKinley, J.I. 1993. Bone fragment size and weights of bone from modern British cremations and the implications for the interpretation of archaeological cremations. International Journal of Osteoarchaeology 3, 283–287. McKinley, J.I. 1994. Bone fragment size in British cremation burials and its implications for pyre technology and ritual. Journal of Archaeological Science 21, 339–342.

Munro, L.E., Longstaffe, F.J., White, C.D. 2007. Burning and boiling of modern deer bone: effects on crystallinity and oxygen isotope composition of bioapatite phosphate. Palaeogeography, Palaeoclimatology, Palaoecology 249, 90-102. Nagy, G., Lorand, T., Patonai, Z., Montsoko, G., Bajnoczky, I., Marcsik, A., Mark, L. 2007. Analysis of pathological and non-pathological human skeletal remains by FT-IR spectroscopy. Forensic Science International 175, 55-60. Nielsen-Marsh, C.M., Hedges, R.E.M. 1999. Bone porosity and the use of mercury intrusion porosimetry in bone diagenesis studies. Archaeometry 41(1), 165-174. Olsen, J., Heinemeier, J., Bennike, P., Krause, C., Hornstrup, K.M., Thrane, H. 2008. Characterisation and blind testing of radiocarbon dating of cremated bone. Journal of Archaeological Science 35, 791-800. Person, A., Bocherens, H., Mariotti, A., Renard, M. 1996. Diagenetic evolution and experimental heating of bone phosphate. Palaeogeography, Palaeoclimatology, Palaeoecology 126, 135-149. Piga, G., Malgosa, A., Thompson, T.J.U., Enzo, S. 2008. A new calibration of the XRD technique for the study of archaeological burned human remains. Journal of Arcaheological Science 35, 2171-2178. Rogers, K.K., Daniels, P. 2002. An X-ray diffraction study of the effects of heat treatment on bone mineral microstructure. Biomaterials 23, 2577-2585. Shahack-Gross, R., Bar-Yosef, O., Weiner, S. 1997. Black-coloured bones in Hayonim Case, Israel: differentiating between burning and oxide staining. Journal of Archaeological Science 24, 439-446. Shipman, P., Foster, G., Schoeninger, M. 1984. Burnt bones and teeth: an experimental study of color, morphology, crystal structure and shrinkage. Journal of Archaeological Science 11, 307-325. Sillen, A., Hoering, T. 1993. Chemical characterization of burnt bones from Swartkrans. In, Brain, C.K. (ed.). Swartkrans: a cave’s chronicle of early man. Transvaal Museum Monograph #8: Cape. pp243-249. Stiner, M.C., Kuhn, S.L., Weiner, S., Bar-Yosef, O. 1995. Differential burning, recrystallization, and fragmentation of archaeological bone. Journal of Archaeological Science 22, 223–237. Stiner, M.C., Kuhn, S.L., Surovell, T.A., Goldberg, P., Meignen, L., Weiner, S., Bar-Yosef, O. 2001. Bone preservation in Hayonim Cave (Isreal): a macroscopic and mineralogical study. Journal of Archaeological Science 28, 643-659.

Stuart, B. 2004. Infrared Spectroscopy: Fundamentals and applications. Analytical Techniques in the Sciences. Chichester: John Wiley & Sons. Surovell, T.A., Stiner, M.C. 2001. Standardizing infra-red measures of bone mineral crystallinity: an experimental approach. Journal of Archaeological Science 28, 633-642. Thompson, T.J.U. 2004. Recent advances in the study of burned bone and their implications for forensic anthropology. Forensic Science International 146S, S203-S205. Thompson, T.J.U. 2005. Heat-induced dimensional changes in bone and their consequences for forensic anthropology. Journal of Forensic Sciences 50(5), 1008-1015. Thompson, T.J.U., Chudek, J.A. 2007. A novel approach to the visualisation of heat-induced structural change in bone. Science & Justice 47, 99-104. Thurman, M.D., Willmore, L.J. 1981. A replicative cremation experiment, North American Archaeologist 2(4), 275–283. Weiner, S., Bar-Yosef, O., Stiner, M., Kuhn, S. 1995. Differential burning, recrystallization, and fragmentation of archaeological bone. Journal of Archaeological Science 22(2), 223-237. Zapata, J., Pérez-Sirvent, C., Martínez-Sánchez, M.J., Tovar, P. 2006. Diagenesis, not biogenesis: two late Roman skeletal examples. Science of the Total Environment 369, 357-368.

Temperature ATR KBr
Average SD Average SD
15 mins
500 4.11 0.13 3.44 0.06
600 4.44 0.17 3.68 0.1
700 5.95 0.46 5.00 0.43
900 6.34 0.4 5.14 0.35
45 mins
600 5.1 0.1 4.33 0.07
700 6.3 0.43 5.37 0.27
900 7.56 0.39 6.3 0.44
Table 1: Comparison of CI results from Sample 1 using FTIR-ATR and FTIR-KBr. SD refers to the 1 standard deviation error limit from 3 replicate measurements
Temperature ATR KBr
Average SD Average SD
15 mins
500 3.88 0.23 3.14 0.16
700 4.55 0.48 3.75 0.53
900 4.67 0.22 4.23 0.2
45 mins
500 4.04 0.4 3.51 0.05
700 5.56 0.22 3.74 0.2
900 5.77 0.61 5.72 0.72
Table 2: Comparison of CI results from Sample 2 using FTIR-ATR and FTIR-KBr. SD refers to the 1 standard deviation error limit from 3 replicate measurements

FTIR-ATR CI FTIR-KBr CI Burning Temperatures (oC)
Blind Sample Average SD Average SD ATR
Prediction KBr Prediction Actual
1 5.38 0.16 4.05 0.1 730 660 700
2 3.41 0.04 3.03 0.03 388 404 500
3 4.78 0.08 3.64 0.12 626 557 700
4 5.12 0.16 4.4 0.08 685 748 900
5 4.65 0.15 3.6 0.06 603 547 700
6 4.23 0.11 3.7 0.04 530 572 900
7 4.13 0.05 3.41 0.13 513 499 700
8 5.27 0.04 4.2 0.05 711 698 900
9 3.64 0.1 3.09 0.05 428 419 500
10 4.31 0.14 3.53 0.12 544 529 500
Table 3: Blind tests assessing the accuracy of CI as a predictor of temperature. SD refers to the 1 standard deviation error limit from 3 replicate measurements

Figure 1a: Sample 1 FTIR-ATR vs FTIR-KBr for 15 minutes duration of burning. The error bars refer to ± 1 standard deviation error limits on the measurements.
4
4.5
5
5.5
6
6.5
7
7.5
8
500 600 700 800 900 1000
Temperature (Celsius)
CI
600 ATR
700 ATR
900 ATR
600 KBr
700 KBr
900 KBr
Figure 1b: Sample 1 FTIR-ATR vs FTIR-KBr for 45 minutes duration of burning. The error bars refer to ± 1 standard deviation error limits on the measurements.
3
3.5
4
4.5
5
5.5
6
6.5
7
400 500 600 700 800 900
Temperature (Celsius)
CI
500 atr
600 atr
700 atr
900 atr
500 kbr
600 kbr
700 kbr
900 kbr

0.00
0.05
0.10
0.15
0.20
0.25
400 600 800 1000 1200 1400 1600 1800 2000
Wavelength
Ab
so
rban
ce
0.00
0.10
0.20
0.30
0.40
0.50
0.60
400 600 800 1000 1200 1400 1600 1800 2000
Wavelength
Ab
so
rban
ce
Figure 2: Comparison of (a) low intensity (500oC) burning and (b) high intensity (900oC) burning FTIR-ATR spectra.
0
0.04
0.08
0.12
0.16
0.2
400 450 500 550 600 650 700 750
Temperature (Celsius)
C/P
500 ATR
600 ATR
700 ATR
500 KBr
600 KBr
700 KBr
1
1.05
1.1
1.15
1.2
1.25
1.3
1.35
1.4
400 450 500 550 600 650 700 750
Temperature (Celsius)
C/C
500 ATR
600 ATR
700 ATR
500 KBr
600 KBr
700 KBr
Figure 3: (a) Calculations of C/P ratio and (b) calculations of C/C ratio.

300
400
500
600
700
800
900
0 1 2 3 4 5 6 7 8 9 10
Sample Number
Tem
pera
ture
(C
els
ius)
ATR
KBr
TRUE VALUES
Figure 4: Comparison of the blind testing results with actual burning temperatures.