problems of world agriculture - wydział nauk ekonomicznych
TRANSCRIPT

Scientifi c JournalWarsaw University of Life Sciences – SGGW
Volume 13 (XXVIII) 2013Number 4
PROBLEMSOF WORLD
AGRICULTURE PR
OB
LE
MS O
F WO
RL
D A
GR
ICU
LTU
RE
VO
LU
ME
13 (XX
VIII) 2013
2081 6960
ISSN 2081-6960

Scientifi c JournalWarsaw University of Life Sciences – SGGW
PROBLEMSOF WORLD
AGRICULTUREVolume 13 (XXVIII)
Number 4
Warsaw University of Life Sciences PressWarsaw 2013

EDITOR ADVISORY BOARD Wojciech Józwiak (Institute of Agricultural and Food Economics – National Research Institute), Bogdan Klepacki – president (WULS – SGGW), Marek K odzi ski (Institute of Rural Development, Polish Academy of Sciences), Ajaya Kumar Mishra (Mizoram University), Henryk Manteuffel Szoege (WULS –SGGW), Ludmila Pavlovskaya (State University of Agriculture and Ecology), Evert van der Sluis (South Dakota State University), Wallace E. Tyner (Purdue University), Stanis aw Urban (Wroc aw University of Economics), Harri Westermarck (University of Helsinki), Jerzy Wilkin (Warsaw University), Maria Bruna Zolin (Universita di Venezia C’a Foscari)
EDITORS Maria Parli ska (editor in chief, scientific editor), Henryk Manteuffel Szoege, MichaSznajder, Joanna Kisieli ska (quantitative methods editor), Stanis aw Sta ko (agricultural market editor), Jakub Kraciuk (structural transformation editor), El bieta Kacperska (international agricultural trade editor), Ewa Wasilewska (statistics editor), Anna Górska, Jan Kiryjow, Janusz Majewski (secretary), Teresa Sawicka (secretary), Agata Kropiwiec (Polish linguistic editor), Jacqueline Lescott (English linguistic editor)
REVIEWERSAlexander Boldak, Vicente M. Castañeda, Pawe Chmieli ski, Aija Eglite, Krzysztof Firlej, Renata Grochowska, Gunta Grinberga-Zalite, Janusz Gudowski, Mariusz Hamulczuk, Alina Hy , Elita Jermolajeva, Barbara Kie basa, Pawe Kobus, Agata Malak-Rawlikowska, Abdoulaye Niang, Modrite Pelse, Robert Pietrzykowski, Irina Pilvere, Jerzy Rembeza, Baiba Rivza, Olga Stefko, Sebastian St pie , Harun Uçak, Evert van der Sluis, Henri Wastermarck, Wioletta Wrzaszcz
Print version is the original version
ISSN 2081-6960 Warsaw University of Life Sciences Press 166 Nowoursynowska St., 02-787 Warsaw Phone (+48 22) 593 55 20, fax (+48 22) 593 55 21 e-mail: [email protected] home page: www.wydawnictwosggw.pl Printed by POLIMAX s.c., 161 L Nowoursynowska St., 02-787 Warsaw

3
TABLE OF CONTENTS
– Alexander BoldakFormation of small rural business in the Republic of Belarus ..................... 5
– Katarzyna CzechSpeculation in the agriculture commodity market ..................................... 10
– Anatolii Dibrova, Oksana Chan-khiPolicy analysis matrix: an analysis of effectiveness of state agricultural policy for the dairy sector of Ukraine ........................................................ 18
– Renata Grochowska, Katarzyna Kosior Agricultural policies in the context of regional and global food security concerns – the case of the Asian region ..................................................... 25
– Mariusz Hamulczuk, Wies aw opaciukPrice linkage between milling and feed wheat prices in Poland and Germany .............................................................................................. 34
– Sebastian Jarz bowskiEfficiency of meat processing enterprises in terms of supply chain organization ................................................................................................ 45
– El bieta Kacperska The influence of international trade with Germany, the agro-food trade in particular, on the Polish GDP size ......................................................... 56
– Pawe Kobus Modelling joint distribution of crop plant yields and prices with use of a copula function ........................................................................................... 66
– Karol Kociszewski Biodiversity protection in European Union agriculture ............................. 76
– Dorota Kozio -Kaczorek A combined muilticriteria procedure for agriculture real estate valuation ...... 87
– Monika Krukowska European investors and land acquisitions in Sub-Saharan Africa ............. 94

– Julian T. Krzy anowskiSmall, young, active – some new elements of the CAP reform ............... 105
– Szilvia Majóczki-Katona Institutional characteristics of the Hungarian grain sector – research methodology ............................................................................................. 115
– Kateryna Melnik The peculiarities of formation and development of agricultural holdings in Ukraine ................................................................................................. 122
– Karolina Pawlak The development and significance of foreign trade in agri-food products in selected preferential trade agreements ................................................. 131
– Iryna Petrovska The cut flower markets of Poland and Ukraine in the EU ....................... 140
– Krystyna Rejman, Sylwia Walkowska, Ewa Halicka Application of nutritional marketing tools in press advertisements ......... 149
– Micha Roman, Krzysztof Nuszkiewicz Changes in agricultural production in Poland after accession to the European Union ....................................................................................... 156
– Ludwig Theuvsen Risk and risk management in agriculture ................................................. 162
– Ewa Wasilewska Economic activity of older people in selected EU countries ................... 175

5
Alexander Boldak 1Faculty of Economics Grodno State Agrarian University, Republic of Belarus
Formation of small rural business in the republic of belarus
Abstract: The present article is devoted to the formation of small rural enterprises in the Republic of Belarus. An overview of the current state of small business is discussed, as well as its dynamic growth in the country is put forward. Next, this paper singles out the possibilities of state budget aid to the development of small-scale business in agriculture. In addition, the role of infrastructure as reliable support of small businesses in rural areas is highlighted. Finally, some prospective directions for the development of small business sector in agriculture at the national, provincial and local level are proposed.
Key words: entrepreneurship, small rural businesses, government support, agriculture, the Republic of Belarus.
Introduction
The modern program of rural development must take into account both the interests of the agrarian sector in totality and certain agricultural subsectors in particular. By means of appropriate economic efficiency measures, agricultural policy should seek to maintain the already-established split of production process and labor between small- and large-scale rural business units. The development of small rural entrepreneurship leads to economic stabilization, as its flexibility and mobility are of vital importance to market conditions.
In turn, in order to allow agrarian policy to influence the on-going processes in small rural businesses efficiently, and to regulate their development in a proper way, this economic sector requires relevant in-depth study. This need for thorough research is due to the fact that, even nowadays, small rural businesses are often undervalued.
Academic studies of development and improvement issues of small entrepreneurship have been abundantly covered in the research of many national and international economists [Myasnikovich 2008, Shimov 2009]. Still, the majority of scientific approaches are debatable [Zhudro 2004]. Many questions regarding improvement of small business development in the countryside are insufficiently researched [Gusakov 2007, Economical… 2005].
Moreover, Belarus has slightly moved up in the ranking of favorable business environment according to the World Bank report and the International Finance Corporation's study [Doing… 2012, p.3]. The findings of this research suggest that Belarus is ranked 58th among the 185 countries under the study, thereby enhancing its position last year by 2 rating points.
Nowadays, Belarus continues to be one of the most active reformers among its neighboring countries, having a significantly better position than Russia (112th) and Ukraine (137th) but slightly yielding to its Customs Union and Common Economic Space partner – Kazakhstan (49th) and to the nearest "Western" neighbor – Poland (55th).
1 PhD, Associate Professor, e-mail: [email protected]

6
Besides, Belarus has once again been named one of the leaders among 50 world countries (the permanent participants of "Doing Business" study). It has conducted major research into creating a more favorable regulatory environment for local entrepreneurs since 2005, and has retained third-place ranking.
That said, the acquired experience demonstrates that not all of the theoretical and practical problems of small business in general and in rural areas particularly are being solved. In this context, there is a need for research investigation into the viability and the objective necessity of forming small rural businesses in the Republic of Belarus.
The aim of the study
The main goal of this study is to analyze the formation of small business in agriculture. The focus of the paper is the emerging small business sector in rural areas under the framework of the transition process (2007-2013) in the Belarussian economy, and more generally, the overall study of challenges that small rural businesses face in the Republic of Belarus.
Material and methods
Materials and methods of investigation are based on the research results of foreign and national investigators into the formation and development of small business in particular, and agrarian economics in general, policy documents of government structures of the Republic of Belarus on economic and commercial issues, annual statistical report summaries on industries and sectors of the national economy.
In data collection and processing methods of dialectical logic, scientific abstraction, induction and deduction, analysis and synthesis, as well as comparative and other methods of economic analysis were used.
Problems
Recent years have shown a positive trend in the share of small business employment with regard to the total employment rate in the economy: it has grown from 28.6% in 2007 to 31.4% in 2012.
A universally recognized indicator of business activity in the country and its regions is represented through a number of small business entrepreneurs - legal persons, representing 1000 resident population of working age (on the basis of the annual calculation). The results of the author's research show that for the creation of a competitive environment in the market economy of the republic at least 100,000 business entrepreneurs are required. In addition, the positive experience of economically developed countries should be taken into account, where there is one private company for 100 residents.
In Belarus, the highest level of business activity can be observed in the Minsk region – 27 small business entrepreneurs - by 1000 resident population of working age (national average in the Republic – 16.6), while the lowest can be outlined in the Gomel region - only 11 [Small… 2011, p.56].

7
Over the last few years, certain work has been done in the liberalization of necessary conditions for economic activities, in eliminating unnecessary government intervention in business entities, and the abolition of administrative barriers for effective business development. The state, in its turn, also plans to support small and medium-sized business entrepreneurs by means of informative provision, as well as property, financial and other types of state aid.
Recently, the State Program for Small Business for 2013-2015 has been adopted in the country [State…2012]. The key actions for its realization presuppose, in particular:
improvement of legislative system regulating the activities of small businesses;
financial support for small entrepreneurship;
improving the efficiency of infrastructure as the core element in small business support;
expansion of industrial cooperation and partnership in industry between small and large enterprises, international cooperation and development of foreign trade in small business sector, etc.
It is planned that as a result, the growing index of employment in the business sector, including individual entrepreneurs, would attain 1.55 million people in 2013, in 2014 -1.68 million, and in 2015 1.8 million.
Unfortunately, due to lack of funding for the program, the planned number of indicators would be not an easy challenge to achieve. Thus, in 2013, for the program of business support the state budget will allocate 4.5 times less aid than for the maintenance of the Permanent Committee of the Russia-Belarus Union State.
On the basis of the Republican program a number of regional programs are outlined to support small business in 2013-2015. The majority of this money is directed at providing public financial support to small rural enterprises for investment projects by providing bank loans of budgetary funds, which had an interest rate of not higher than the refinancing rate established by the National Bank. Still, their size is below a percentage from the total income sum.
In accordance with the state support programs of small businesses, entrepreneurs can also get subsidies to compensate some part of the interest on bank loans. They are also able to recover some part of their cost leasing payments. Exhibition activity or organization of such events can also be provided with certain subsidies. But such cases are rather rare.
So far, the Grodno Oblast Executive Committee has allocated only 0.5 million USA dollars to support innovative business projects. This amount of money is directed to those priority projects that will be associated with the development of the service sector and the progressive transformation of the region. Appropriate changes have also been made to the regional budget. The following financial assistance can be obtained both by individual entrepreneurs and privately owned enterprises, in rural areas as well, if a valuable business projects is put forward. Applicants must subscribe to the Base Center for Small Business, where they can find help preparing a list of documents which are necessary for their project to be considered by the draft committee. If approved, the funds will be awarded in the form of soft loans in Belarusian rubles at the refinancing rate plus 0.5 walrus bank, which is significantly lower than on general conditions. Thus, the entrepreneur will be able to take a loan to buy equipment, to repair the leased premises, and to get some income, before

8
having to begin repaying the loan. However, the decision in view of the insignificance of the amount is unlikely to serve as a strong incentive to enhance entrepreneurship in the region.
Nowadays, a network of infrastructure units to support small and medium-sized businesses is widely spread all over the country. In 2012, 68.6 thousand people addressed the business support centers on various issues.
In the Stolin district, for example, a local fund "Support Center for Rural Development and Entrepreneurship of Stolin district" is successfully managed. The founders of the center also include rural residents, interested in the development of farms. Among the chief areas of activity of the center one can outline microcredit support for small producers, maintenance and support of the project proposals, organization of thematic information sessions, cooperation with small business holders. However, only four such institutions operate today in rural areas of the country.
In the framework of the State program of employment promotion, the state administration creates the necessary conditions and opportunities for unemployed citizens to disclose their business skills. Some entrepreneurs, being unemployed, were retrained within employment centers, received grants and loans and used preferential state credits as initial capital. Despite this, in 2012, less than 100 unemployed people set up their small businesses in rural areas with the help of the state budget fund social security.
In the business environment, entrepreneurship and business initiatives are largely due to the presence of available financial resources. Certain financial support to small and medium-sized businesses is made by the commercial banks, which in recent years have clearly stepped up their work in this direction. For example, BPS-Bank signed an agreement to open a line of credit to finance small and medium business for the amount of 25 million dollars with the Eurasian Development Bank, as well as an agreement with the European Bank for Reconstruction and Development - for 50 million dollars. These cases are not numerous and cannot testify about improving financial conditions for developing small businesses and enterprise business initiative.
An example of a business enterprise in the field of agricultural production with the use of bank loans is the farm "Fortune" Baranovichi district. In 1993, it had only 2 hectares of land. Now, together with the peasant (farm) "Fortune Agro" (both farms work as a single set), there are 397 hectares of land. Their base activity is growing vegetables. To stock the products, three vegetable storages for 3.5 tons of vegetables are built, including the vegetable storage total capacity of 800 tons equipped with refrigerators. The Executive Committee, on the instructions of the farm "Fortune", put 18% of the vegetables into the off-season storage in 2011-2012. In 2009, a processing plant was constructed, which is equipped with a line for cleaning and vacuuming of vegetables. The construction of a new center of the same type has been launched in Baranovichi, which should be completed in 2013.
However, such examples are not easy to find in the business environment. Thus, although small-scale businesses are considered to be the backbone of the whole agricultural production, they nevertheless fail to contribute fully to solving the common problems faced by the agrarian sector nowadays.

9
Proposals
Promising directions for small business development in the agricultural sector should be: 1. At the national level:
- create efficient state infrastructure with the aim of supporting small rural business; - determine the mechanism for realising the ground legislation; - improve financial, credit and property relations along with taxation.
2. At the regional level: - aim legislative activity in this field of the economy at creating a favorable business climate in order to boost entrepreneurship in agriculture; - remove unnecessary administrative barriers; - provide equal conditions for all rural businesses whose goal is to enter the market; - provide concessional loans for all forms of small rural businesses; - allocate subsidies to the formation of social and productive infrastructure in rural areas;- improve the system of business training for rural entrepreneurs; - coordinate all vital matters relating to the development of small business in the field of agriculture.
3. At the local government level: - establish in-depth control over the use of budget funds and provided benefits; - organizate information and advisory services; - provide property support in the form of allocation, sale and lease of property of bankrupt firms to small agricultural enterprises; - compile and disseminate best practices of agricultural production; - use performance as a guarantee in obtaining loans for small rural entrepreneurs.
Conclusions
To recapitulate, it is worth noting that many of the problems constraining the development of small rural businesses can be solved if the revitalization of business organizations were followed, if opportunities and methods of self-regulation were applied, and if authorities maintained a favorable attitude such endeavors. At the same time, state economic policies regarding small rural entrepreneurship should focus on improving the efficiency of institutional changes, forming a layer of real entrepreneurs, and creating an effective incentive mechanism to support the development of entrepreneurship.
References
Doing Business 2013 [2012]: Smarter Regulations for Small and Medium-Size Enterprises. The World Bank, Washington.
Economical Questions of Belarus Agriculture Development [2005]. Gusakov V.G. (ed.). NAS of Belarus, Minsk. Gusakov V.G. [2007]: Economy organizations and branches of agricultural complex. Belaruskaya Dumka, Minsk. Myasnikovich M.V. [2008]: Republic of Belarus and new economy. NAS of Belarus, Minsk. Shimov V.N. [2009]: The economic development of Belarus at the turn of the century. BSEU, Minsk. Small and
medium-sized business in the Republic of Belarus [2011]: Statistical book, Minsk. State program to support small and medium enterprises in the Republic of Belarus for 2013-2015. [2012]: Minsk. Zhudro M.K. [2004]: Basis agribusiness: a monograph. Law and Economics, Minsk.

10
Katarzyna Czech1
Department of Agricultural Economics and International Economic Relations Warsaw University of Life Sciences – SGGW
Speculation in the agricultural commodity market
Abstract: This paper studies the role of speculators in explaining agricultural commodity price movements. The spikes in global agricultural commodity prices in 2007-2008 and 2010-2011 have opened a debate on the contribution of speculation to recent food price volatility. Most academic literature does not support the idea that speculators drive commodity prices beyond fundamental levels. There are, however, some researchers who do find empirical evidence supporting the idea that the activity of speculators affects commodity prices. This paper concludes that the activity of speculators may temporarily overprice or underprice commodity values. It is assumed, however, that both fundamental and financial factors influence commodity prices. Nevertheless, it is difficult to indicate the extent to which each factor separately affects prices.
Key words: agricultural commodities, futures market, speculation, price
Introduction
The first decade of the 21st Century has brought on remarkable structural changes to the commodity futures market. Trading volumes and open interest have increased considerably. Significant changes have been observed in both trading and participants of the commodity markets. According to Domanski and Heath [2007] commodity markets have become more like financial markets. New financial participants have entered the commodity futures market. Investments in commodity indices have turned out to be attractive alternative investments for financial institutions and pension funds [Irwin and Sanders 2012]. Commodity futures are effective in diversifying equity and bond portfolios because commodity futures returns are generally negatively correlated with bond returns and share returns. Gorton and Rouwenhorst [2006] claim that commodity futures perform better in periods of unexpected inflation, when stocks and bonds do not provide a satisfactory return. The increasing presence of market participants investing in commodities derivatives initiated the so-called process of “financialization” of commodity markets [Falkowski 2011].
During 2007-2008 and 2010-2011, prices of commodities, including agricultural commodities, increased rapidly. Figure 1 presents the monthly International Monetary Fund Primary Commodities Price Index and Food Price Index from January 2005 to December 2012. The IMF’s Primary Commodities Price Index is a weighted average of prices for 51 primary commodities grouped into three main classes: energy, metals, food and beverages. The commodity weights are derived from their relative trade values. The weighted values in the commodity basket reflect the structure of trade in 2002-2004. Both the Primary Commodities Prices Index and the Food Price Index use 2005 as the base-year (average of 2005=100).
1 Msc, e-mail: [email protected]

11
Fig. 1. IMF Primary Commodities Price Index and Food Price Index during 2005-2012
Source: International Monetary Fund, Primary Commodity Price System.
Commodity prices, including food prices, rose dramatically from 2007 to the middle of 2008. In the second half of 2008 prices collapsed sharply, and they rose rapidly during 2010-2011 (Figure 1). Many academic economists suggest that fundamental factors provide the most consistent explanations of recent commodity price movements. However, other researchers claim that macro and microeconomic factors cannot fully explain the recent increase in commodity prices. They identify investor activity in the commodity futures market as a driving force behind the sharp price rise of many commodities. In their opinion, speculation has pushed up commodity prices beyond fundamental levels. Moreover, the growing interest of speculators in the commodity futures market increases price volatility in this market. It needs to be emphasized, however, that many research studies do not provide sufficient empirical support to confirm the impact of speculators on commodity price movements.
This paper examines the literature concerning the impact of speculation on commodity prices. The article is focused on wheat and maize markets. The aim of the paper is to provide a comprehensive assessment of the sharp increase in selected grain prices during 2007-2008 and 2010-2011. The remainder of the paper is organized as follows: section 2 reviews the relevant literature; section 3 explains the reasons for recent price surges in the wheat and corn markets; the last section provides concluding remarks.
Literature review
According to Working [1960], futures markets are primarily hedging markets and the amount of speculation in this market depends mainly on the number of hedging transactions. However, much has changed in the futures market since Working was published. During the last few years, a rapid increase in the level and volatility of commodity futures prices has been observed. Many researchers have attempted to identify

12
the factors that might have brought about the surge in commodity prices in 2007-2008 and 2010-2011. Some of them claim that fundamental factors are the main determinants of commodity prices. However, others argue that an increase in the activity of speculators leads to the price bubbles in commodity markets. The recent commodity price boom has been examined in a number of papers. The article is focused on works concerning mainly food commodities.
The fundamental causes of high agricultural commodity prices are divided into supply-side and demand-side factors. The most debatable cause of recent commodity price spikes is the conversion of land and crops from food production to biofuels production. Other commonly cited factors are high energy cost, crop failures, decelerated productivity growth in agriculture, trade policies, global growth in population and per capita incomes, etc. Moreover, prices of agricultural commodities are generally traded in US dollar currency. Hence, the recent spike in food prices in 2007-2008 would have been lower if the price had been adjusted for the depreciation of the US dollar in 2007-2008. [Cardwell and Barichello 2009] It needs to be emphasized that dollar depreciation also contributed to the 2010-2011 spike in commodity markets. Between July 2010 and April 2011, the U.S. dollar depreciated 12.9% against the euro [World Bank, 2011]. Plantier [2012] claims that since 2004 the movement of commodity prices has been driven mainly by US dollar depreciation, slow global supply growth and rapid growth in emerging markets such as China, Brazil, India and Russia.
The spikes in global agricultural commodity prices in 2007-2008 and 2010-2011 have opened a debate on the contribution of speculation to recent food price volatility. Most academic literature do not support the idea that speculators drive commodity prices beyond fundamental levels. Irwin et al. [2009] claim that economic fundamentals provide better explanations for commodity price movements. He argues, however, that the complexity of macro and microeconomic factors causes the difficulty of assessing in real-time the fundamental reasons for commodity price surges. Speculator activity provides a convenient explanation for rapidly rising or falling prices. Petzel [1981] has written “Futures market speculators have frequently been blamed for variations in grain prices. In periods of rising prices (e.g., the early 1920s, the Korean War, inflation, and the 1970s) grain speculators have been accused of increasing the prices of agricultural commodities artificially. During the early 1930s when agricultural prices were low, grain speculators were accused of depressing prices.” According to Irwin et al. [2009] whenever commodity prices have rapidly increased or decreased over the last 125 years, there were many attempts to impose limits on speculative positions and to control prices. However, there is little historical evidence proving that the regulation of speculation had the desired effect on market price.
There are some researchers who do find empirical evidence supporting the idea that speculators drive commodity prices beyond fundamental value. Baffes and Haniotis [2010] examined three main factors (speculation, higher demand for agricultural commodities by emerging economies and higher biofuels production) that may have caused the commodity price surge during 2006-2008. They have shown that speculation played a crucial role during the commodity price rise in 2008. Higher biofuels production had an impact on commodity price movements, however the influence was much lower than initially thought. They have found no evidence that stronger demand by emerging economies had any effects on commodity prices. According to Wahl [2009], speculation on agricultural prices played a decisive role in the commodity price bubble in 2007-2008. The FAO food price index increased by 71% between the end of 2006 and March 2008. He claims that fundamental
13
factors alone cannot explain such a high volatility in the agricultural commodity market during 2006-2008.
It needs to be emphasized that no single factor alone determines the market price. Speculation might have affected commodity prices. Many academic economists believe that speculators enhance market efficiency. Keynes [1930] argues that speculators provide market liquidity and underwrite the risk of high volatility in the spot market. Friedman [1953] claims that speculation stabilizes market prices. Some researchers claim, however, that speculation increases volatility and drives prices beyond fundamental level. Literature reports conflicting conclusions about the influence of speculators on commodity price [Zawojska 2011]. Moreover, it is hard to examine the relationship between speculation and commodity price movements. The problem results mainly from the lack of appropriate and comprehensive data which will allow assessment of the connection.
Wheat and maize price volatility
We can distinguish three fundamental groups of commodities with different characteristics and return drivers [Geman, 2005]:
Energy: oil, natural gas, coal, etc. Metals and minerals: iron, copper, gold, etc. Agricultural products: soybeans, wheat, maize, rice, etc.
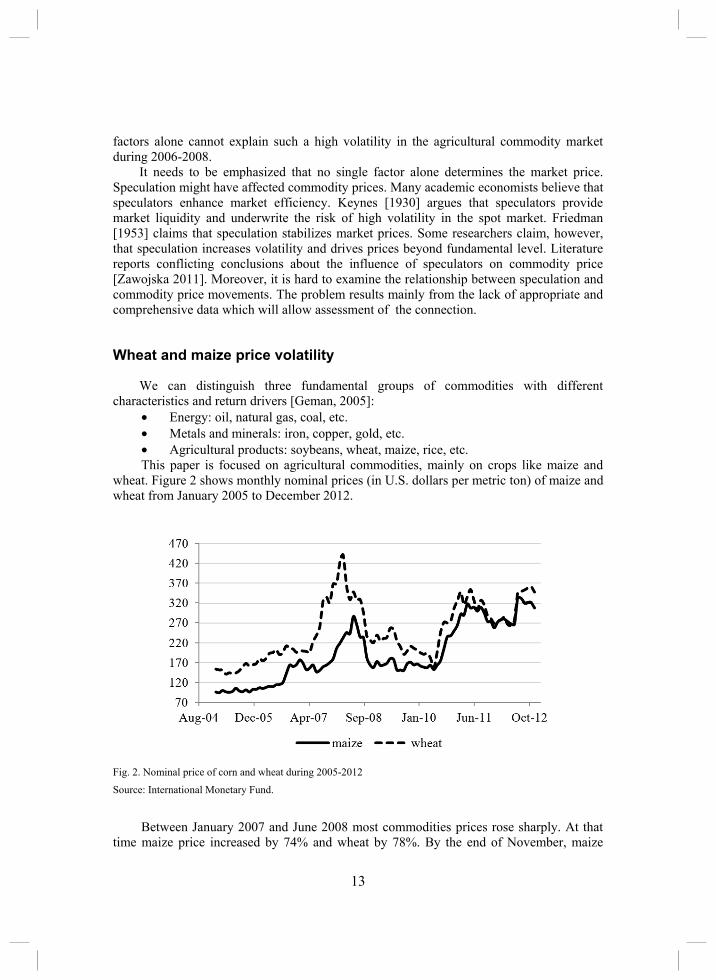
This paper is focused on agricultural commodities, mainly on crops like maize and wheat. Figure 2 shows monthly nominal prices (in U.S. dollars per metric ton) of maize and wheat from January 2005 to December 2012.
Fig. 2. Nominal price of corn and wheat during 2005-2012
Source: International Monetary Fund.
Between January 2007 and June 2008 most commodities prices rose sharply. At that time maize price increased by 74% and wheat by 78%. By the end of November, maize

14
stood at 43% of its peak level, wheat at 48%. A new surge was observed in 2010, with price peaking in the middle of 2011 and again in the middle of 2012. Such a high food price volatility arises from shocks that may come from a number of sources.
There are many researchers who claim that fundamental factors play a crucial role in explaining recent price movement in the grain market. The increase in biofuel demand is one of the strong explanations for the sharp rise in commodity prices. It concerns mainly the price of maize since the use of maize for ethanol has been rising rapidly over the last few years. The growth in biofuel production does not impact directly the price of wheat or soybean, however, the substitution effect may have occurred. The expansion of maize area has contributed to the decline in soybean and wheat areas [Mitchell, 2008]. Collins [2008] calculated that 60% of the increase in maize prices during 2006-2008 was brought about by the surge in usage of maize in biofuel production. Rising oil prices account for another explanation for rapidly increasing commodity prices. Oil prices have an important impact on the cost of agricultural production. Oil prices affect the price of fuel, fertilizers and other chemicals used in crop production. Heady and Fan [2008] estimated that the surge in oil prices increased the cost of US production of wheat, maize and soybeans by 30%-40% during 2001-2007 relative to the scenario in which oil-related prices increased only by the inflation of the US GDP deflator.
Some researchers claim that speculation has driven grain prices up to excessive levels. It concerns mainly grain futures prices. It needs to be stressed that future prices are the benchmark of spot prices. A popular method of monitoring speculator activity in futures markets is the analysis of open interests in the Commodity Futures Trading Commission’s (CFTC) Commitments of Traders Report (COT). The U.S. Commodity Futures Trading Commission distinguishes two main commodity markets participants: commercial traders (hedgers) and non-commercial traders (speculators). Commercial participants are physically involved with the production and consumption of commodities. They use derivatives markets to hedge against price fluctuations. Non-commercial participants want to improve or diversify their portfolios and do not take physical delivery of the underlying commodity. They want to generate profit from changes in prices. The Commodity Futures Trading Commission publishes the positions held by traders in the Commitment of Traders Report. There are two versions of the report. The Futures Only Commitment of Traders Report includes futures market open interest and the Futures and Options Combined Commitment of Traders Report which aggregates futures and options markets open interest. The weekly reports are released every Friday and provide data of each Tuesday’s open interest.
Since 2006, the CFTC has published the Commitments of Traders Commodity Index Trader Supplement. The Supplemental report provides information about futures and options markets open interest in selected agricultural markets. Moreover, it shows the positions of additional traders category, the so-called commodity index traders. Index traders are drawn from the non-commercial and commercial categories. From the one side their positions belong to the hedgers (commercial traders), from the other side their behavior is similar to the behavior of large hedge funds (non-commercial traders). Index traders are likely to be responsible for sharp falls and rises of commodities prices. Their positions are generally used as a proxy of speculative activity. The group of index speculators covers mainly institutional investors like pension funds, sovereign wealth funds, public and private foundations and life insurance companies. Index traders generally take long positions. This direction of investment decisions is favorable in the capital market. It is detrimental, however, to commodities markets. If index traders take both long
15
and short positions, then the commodity prices would both fall and rise. Index traders lean mainly toward long directions and as a result, they push commodity prices up. On the other hand, during turbulent days in the financial market, index traders withdraw their investment in the commodity market and it provokes a drop in prices. Moreover, it needs to be emphasized that index speculators buy commodity futures irrespective of the price and regardless of supply and demand fundamentals. Therefore, it pushes agricultural commodity prices beyond the level warranted by fundamental forces.
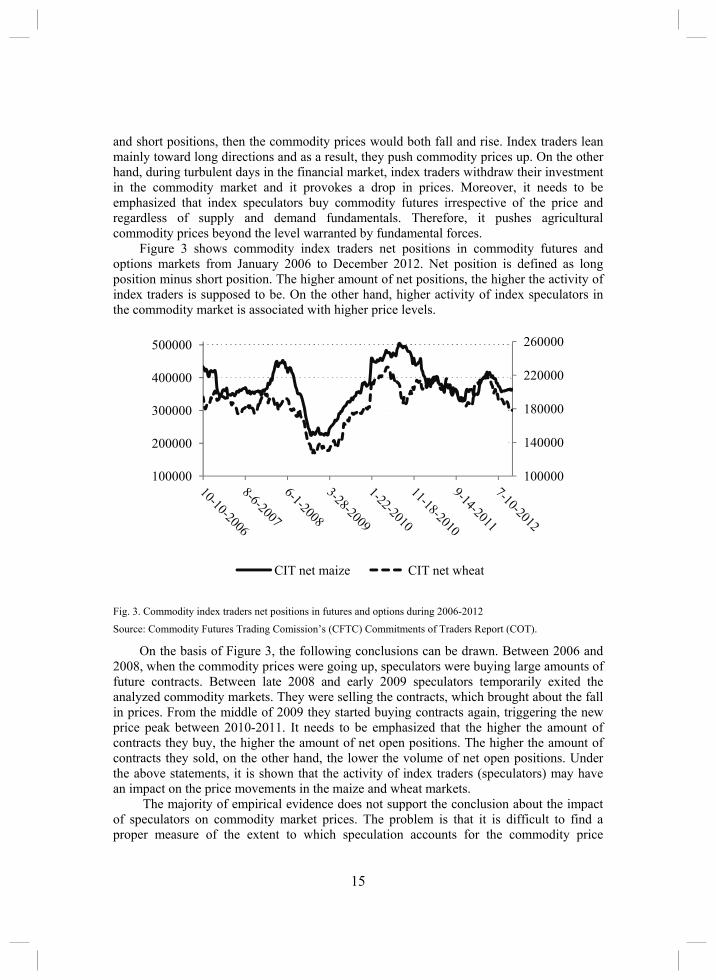
Figure 3 shows commodity index traders net positions in commodity futures and options markets from January 2006 to December 2012. Net position is defined as long position minus short position. The higher amount of net positions, the higher the activity of index traders is supposed to be. On the other hand, higher activity of index speculators in the commodity market is associated with higher price levels.
Fig. 3. Commodity index traders net positions in futures and options during 2006-2012
Source: Commodity Futures Trading Comission’s (CFTC) Commitments of Traders Report (COT).
On the basis of Figure 3, the following conclusions can be drawn. Between 2006 and 2008, when the commodity prices were going up, speculators were buying large amounts of future contracts. Between late 2008 and early 2009 speculators temporarily exited the analyzed commodity markets. They were selling the contracts, which brought about the fall in prices. From the middle of 2009 they started buying contracts again, triggering the new price peak between 2010-2011. It needs to be emphasized that the higher the amount of contracts they buy, the higher the amount of net open positions. The higher the amount of contracts they sold, on the other hand, the lower the volume of net open positions. Under the above statements, it is shown that the activity of index traders (speculators) may have an impact on the price movements in the maize and wheat markets.
The majority of empirical evidence does not support the conclusion about the impact of speculators on commodity market prices. The problem is that it is difficult to find a proper measure of the extent to which speculation accounts for the commodity price
100000
140000
180000
220000
260000
100000
200000
300000
400000
500000
CIT net maize CIT net wheat

16
volatility. The lack of sufficient information about the commodity derivatives market hampers the analysis of the above phenomenon. Data about net positions of each category of traders are available only for U.S. centralized exchange markets and only for the period from January 2006 till today. Moreover, the classification of commercial traders, non-commercial traders and index traders is not perfect, e.g. there is a possibility that some commercial traders also take speculative positions. Moreover, not only the futures contracts market but also the over-the-counter forward market constitute an important part of commodity market liquidity. Subject to these caveats, however, these data are the best publicly available data which reflect the activity of speculators in the agricultural commodity market.
Conclusions
The majority of empirical evidence does not support the conclusion about the impact of speculators on commodity market prices. Many researchers claim that only fundamental factors affect commodity prices. In their opinion recent surges in the agricultural commodities prices were driven mainly by rising oil prices, biofuels demand, crop shortfalls, U.S. dollar depreciation, etc. Some researchers believe, however, that speculation has driven commodities prices up to excessive levels. A popular method of monitoring the activity of speculators in the futures market is the analysis of open interests in the Commodity Futures Trading Commission’s (CFTC) Commitments of Traders Report (COT). It concerns mainly the open interests of index speculators. Index traders are likely to be responsible for sharp falls and rises of commodities prices. This group of traders covers mainly institutional investors like pension funds, sovereign wealth funds, public and private foundations and life insurance companies. The analysis of index traders’ net positions in maize and wheat markets from January 2006 to December 2012 has shown that the activity of index speculators might have had an impact on their price movements.
It is not clear what effects commodity index traders have on prices for agricultural products. According to Irwin and Sanders [2011], there is little evidence that index funds (index speculators) drove commodity prices up between 2007-2008. Girardi [2012] has shown, on the other hand, that commodity index traders have affected wheat prices, linking them to stock market volatility and to the price of oil. However, lack of sufficient information concerning the activity of speculators hampers support for the hypothesis that speculation, not the fundamental factors, caused commodity prices to rise so sharply in analyzed periods. Nevertheless, the activity of speculators is likely to temporarily overprice and underprice the commodity values. In general, both fundamental and financial factors may have an impact on commodity prices. It is difficult, however, to indicate the extent to which each of them affects prices.
References
Baffes J. and Haniotis T. [2010]: Placing the 2006/08 Commodity Price Boom into Perspective. The World Bank Policy Research Working Paper No. 5371, p. 1-40.
Cardwell R., Barichello R. [2009]: High Food Prices and Developing Countries: Policy responses at Home and Abroad. Canadian Agricultural Trade Policy and Competitiveness Research Network Commissioned Paper

No. 1. [Available at]: http://www.uoguelph.ca/catprn/PDF-CP/Commissioned_Paper_2009-1_Cardwell.pdf [January 2013].
Collins K. [2008]: The Role of Biofuels and Other Factors in Increasing Farm and Food Prices. A review of recent developments with a Focus on Feed Grain Markets and Market Prospects. [Available at]: http://www.globalbioenergy.org/uploads/media/0806_Keith_Collins_-_The_Role_of_Biofuels_and_Other_Factors.pdf [January 2013].
Domanski D., Heath A. [2007]: Financial Investors and Commodity Markets. Bank for International Settlements Quarterly Review March, p. 53-67.
Falkowski M. [2011]: Financialization of commodities. Contemporary Economics Vol. 5, No. 4, p. 4-17. Friedman M. [1953]: Essays in Positive Economics. American Economic Review Richard D. Irwin, Inc. Harvard
University Press, London, p. 157-203. Geman H. [2005]: Commodities and Commodity Derivatives. Modeling and Pricing for Agriculturals, Metals and
Energy. John Wiley & Sons Ltd, England. Girardi D. [2012]: Do financial investors affect the price of wheat? PSL Quarterly Review Vol. 65 No. 260,
p. 79-109. Gorton G., Rouwenhorst K. G. [2006]: Facts and Fantasies about Commodity Futures. Financial Analysts Journal
Vol. 62 No. 2, p. 47-68. Heady D., Fan S. [2008]: Anatomy of a Crisis. The Causes and Consequences of Surging Food Prices.
International Food Policy Research Institute Discussion Paper No. 00831, p.1-25. Irwin S. H., Sanders D. R., Merrin R. P. [2009]: Devil or Angel? The Role of Speculation in the Recent
Commodity Price Boom (and Bust). Journal of Agricultural and Applied Economics Vol. 41, p. 377-391. Irwin S. H., Sanders D. R. [2011]: Index Funds, Financialization, and Commodity Futures Markets. Applied
Economic Perspectives and Policy Vol. 33 No. 1, p.1-31. Irwin S. H., Sanders D. R. [2012]: Financialization and Structural Change in Commodity Futures Markets. Journal
of Agricultural and Applied Economics Vol. 44 No. 3, p. 371-396. Keynes J. M. [1930]: A Treatise on Money. Volume 2. The Applied Theory of Money. Macmillan, London. Mitchell D. [2008]: A Note on Rising Food Prices. Policy Research Working Paper No. 4682. The World Bank,
Washington, p. 1-20. Petzel T. E. [1981]: A New Look at some Old Evidence: the Wheat Market Scandal of 1925. Stanford University
Food Research Institute Studies Vol. 18 No. 1, p. 117-128. Plantier L. C. [2012]: Commodity Markets and Commodity Mutual Funds. Investment Company Institute
Research Perspective Vol. 18 No. 3, p. 1-32. Wahl P. [2009]: Food Speculation: The Main Factor of the Price Bubble in 2008. Briefing Paper. World Economy,
Ecology & Development. [Available at]: http://www2.weed-online.org/uploads/weed_food_speculation.pdf[January 2013].
World Bank [2011]: Global Commodity Markets Annex. Global Economic Prospects. Maintaining Progress and Turmoil. [Available at]: http://siteresources.worldbank.org/INTGEP/Resources/335315-1307471336123/ 7983902-1307479336019/Full-Report.pdf [December 2012].
Working H. [1960]: Speculation on Hedging Markets. Stanford University Food Research Institute Studies Vol.1 No. 2, p. 185-220.
Zawojska A. [2011]: Czy spekulacje finansowe wp ywaj na mi dzynarodowe ceny towarów rolno-ywno ciowych? Zeszyty Naukowe SGGW w Warszawie Problemy Rolnictwa wiatowego t. 11(26), p. 177-
192.

18
Anatolii Dibrova1
National University of Life and Environmental Sciences of Ukraine Kyiv, Ukraine Oksana Chan-khi2
National University of Life and Environmental Sciences of Ukraine Kyiv, Ukraine
Policy Analysis Matrix: An analysis of the effectiveness of state agricultural policy for the dairy sector in Ukraine
Abstract. Dairy production in Ukraine, as well as worldwide, is an important sector of the economy which ensures the food security of the country. The Ukrainian dairy sector has many unsolved systematic problems, foremost of which is the decrease in cow productivity and the number of cows. This directly influences the decrease of total milk production, and, as a result, a deficit on the food market. Today, the Ukrainian government has to focus on improving dairy sector support in order to ensure its effectiveness in the future.PAM-analysis was used to evaluate the effectiveness of state agricultural policy in the dairy sector. Research results show that the production system of Ukraine can ensure profitable milk production in private and social prices. But, while dairy producers benefit from cheap internal resources, state policy in the dairy sector impacts profitability of milk production by production trade factors.
Key words: dairy sector, agricultural policy, protection, effectiveness, state regulation, PAM, Ukraine.
Introduction
According to the example of developed countries, effectiveness of milk and dairy production as well as development of the dairy market under modern conditions of the agricultural sector depends on the effectiveness of state agricultural policy. State policy influences many areas: farm profitability; production volume and structure; inter-branch and inter-farm relationships aiming to create stable economic, legal, social and ecological conditions for the development of the dairy sub-sector; meeting population needs in food products; increase of dairy sector’s export potential and expansion of the export geography through different parts of the world.
Ukrainian agriculture and the dairy sector in particular, is one of the most regulated sectors of the Ukrainian economy. But often, the state policy has a conflicting character and doesn’t bring expected results. Today, the main task of state agricultural policy is to improve financial indicators of milk production. The aim of the research presented here is to evaluate the impact of state agricultural policy on the development of dairy production in Ukraine.
1 DrEc, professor, Heroyiv Oborony Str. 11, Kyiv, 03041, Ukraine, tel. (+38044) 527-86-48, email: [email protected] 2 PhD student, Generala Rodimtseva Str.1, Kyiv, 03041, Ukraine, tel. (+38097) 649-95-79, email: [email protected]

19
Dairy sector in Ukraine
During the last ten years, the dairy sector of Ukraine has faced a constant decrease of milk production primarily due to a decrease in the number of cows. Domestic agricultural enterprises often change their milk production orientation to milk-and-meat specialization, thus decreasing the number of milking cows. At the same time, milk production concentrates in private households with no sanitary and hygienic control and the raw material produced is often of doubtful quality. During many years private households remain the main milk producers with 79,7 % of general production in 2011,while in 1990, agricultural enterprises produced 76% of milk.
Another aspect of the problem is low cow productivity in Ukraine which is twice lower than in developed countries. Average milk production per cow in Ukraine is 3,5-4,5 thousand kilos/year while worldwide it is 6-9 thousand kilos/year. It is important to mention that positive dynamics are present in average yearly milk production, which can be explained by a decrease in the number of low-production animals.
Table 1. General indicators of milk production in Ukraine
Indicators Years Deviation
2011 to 2010, % 1990 1995 2000 2005 2010 2011
Milk production total, thousand tons: 24508 17274 12657 13714 11248 11085 98,5
including agricultural enterprises 18634 9443 3669 2582 2216 2246 101,3 including private households 5874 7831 8988 11132 9032 8839 97,8 Number of cows, thousands heads: 8378 7531 4958 3635 2631 2582 98,1
including agricultural enterprises 6195 4595 1851 866 589 584 99,1 including private households 2186 2963 3107 2769 2042 1998 97,8 Average milk production per cow, kg: 2863 2204 2359 3487 4082 4147 101,6
including agricultural enterprises 2941 1908 1588 2952 3975 4109 103,4 including private households 2637 2722 2960 3643 4110 4191 101,9
Source: own calculations by the State Statistics Service of Ukraine.
Constant yearly decreases of milk production have caused a deficit of dairy raw material (including available export markets). As a result, high competitiveness on the market influences purchasing prices. Between 2000 and 2005, milk purchasing price increased by 70%, and between 2006 and 2011 prices tripled, thus sometimes being higher than European prices.
Production cost is another important element in the production efficiency of agricultural enterprises. According to official statistics, forage costs and labor costs dominate the general structure of milk production costs 45,5-47,5% and 18-21% respectively. Thus, between 2006 and 2011 the above-mentioned costs grew 2,3 and 3,1 times respectively, which resulted in an increase of the milk production cost by 2,5 times.
But, despite decrease of milk production volumes, its profitability in agricultural enterprises increased by 3,4 % in 2011 when compared to 2010, and by 119 % when compared to the crisis in 2006. Such results are explained by increase of purchasing prices

20
and state agricultural policy. During a few years the governmental program for dairy sector support was very unstable and changed several times, which restrained sector development.
The government program includes: financial and credit mechanism of regulation (preferential loans, leasing support, credit interest rates subsidizing), tax mechanism of regulation (fixed agricultural tax and special VAT mechanism), price mechanism of regulation (intervention purchases, setting the minimum purchase price), support of insurance, governmental support for the dairy industry through appropriate programs ("Revival of cattle", State Program for Rural Development for the period by 2015) etc.
The main reasons of such instability are: imperfect state management in the dairy sector, ineffective financial and credit policy for the agricultural sector, absence or complicated access to cheap financing, use of old technologies and production means due to absence of financial resources.
In order to improve the actual situation, the Ukrainian government must: determine all advantages and disadvantages of its regulation policy; analyze level and mechanisms of state support for milk production which will afterwards allow evaluation of perspectives for the domestic dairy sector on the international market.
Improvement of the state support policy in milk production remains one of the most important and strategic priorities for the Ukrainian government.
Material and methods
The agricultural sector is very often a target of state regulations. Government usually pursues different objectives: increase in production, securing of farm income, supplying of the population with cheep foodstuff, etc. Besides, in our opinion, present state agricultural policy should be aimed at supporting milk producers, the formation of regulatory policy to provide a stable income for dairy producers, fair and rational allocation of available resources and supporting enterprises that really need help.
Most European countries have a wide system of agricultural policies which affect agricultural production. The impact of a single policy on the profitability of production could be either positive or negative.
We suggested use of the The Policy Analysis Matrix ( , developed by Monke and Pearson in 1989) used as an instrument of analysis for the entire production system. This matrix will help analyze effectiveness of agriculture sector regulation and the role of the state in this regulation. State policy effects are evaluated while observing profit change of agricultural producers [Monke and Pearson 1989].
The main idea of the PAM is the comparison of private and social prices for inputs used in production and also for the produced goods. Private prices are prices observed in a current situation, while social prices conform to the situation without any intervention of the government or market distortions [Yao 1997].
In practice, PAM, presented in Table 2, contains costs and revenues in private and social prices. Total production costs are separated to tradable inputs and domestic factors to produce one unit of output. Tradable inputs are goods traded internationally. Domestic factors refer to land, labour and capital. The prices of domestic inputs are mainly determined by local markets. In contrary, prices of tradable inputs are determined by international markets.

21
Table 2. Structure of the Policy Analysis Matrix (PAM)
Revenues Costs
ProfitsTradable inputs Domestic factors
Private price B C D=A-B-C
Social price E F G H=E-F-G
Effects of divergences and efficient policy I=A-E J=B-F K=C-G L=G-H=I-J-K
Profitability coefficient (PC) PC = D/H
Domestic cost ratio (DRC) DRC = G/(E-F)
Private cost ratio (PCR) PCR = C/(A-B)
Social cost benefit ratio (SCBR) SCBR = (F+G)/E
Nominal protection coefficient (NPC) NPR = A/E
Effective protection coefficient (EPC) EPR = (A-B)/(E-F) where is: (A) revenue based on private price, (E) revenue based on social price, (I) output transfers, (B) tradable input cost based on private price, (F) tradable input cost based on social price, (J) input transfers, (C) domestic input cost based on market price, (G) domestic input cost based on social price, (K) factor transfers, (D) private profits, (H) social profits, (L) net transfers.
Source: [Monke and Pearson 1989].
The structure of the PAM allows a double calculation in the table. On the first line of the PAM is the calculation of private profitability (D), defined
revenue (A) minus total costs (B+C). Where, B and C are tradable and domestic inputs, respectively. In other words, the first line of the PAM contains the value for the accounting identity measured at private prices, which is the price actually used by different agents to purchase their inputs and sell their outputs.
The second line of the PAM calculates the social profit which reflects social opportunity costs. Social profits measure efficiency and comparative advantage. Social profitability (H) measures revenue valued at social prices less value of tradable and domestic input both valued at social price.
The third line of the matrix represents transfers that come into changes in government policy.
The differences between revenues, costs and profits in private and social prices can be both negative and positive. A negative output transfers (I<0) or positive input (J>0) and factor transfers (K>0) means worsening of the situation in a sector through state policies. Transfers by costs and revenues can equilibrate each other. Net transfers (L) show an impact of government influence on a farm income [Ramanovich 2005].
A few additional indices can be calculated from the PAM. The most used are: • The Profitability coefficient (PC) shows the impact of all transfers on profitability.
The index is calculated as a ratio of private profit to social profit. • The Domestic cost ratio (DRC) measures the efficiency of utilisation of domestic
factors in the analyses of production systems. The DRC is widely used as an indicator of competitiveness. The index calculated is a ratio of social costs for domestic factors to their value added. If the DRC<1, the production in a country is competitive. If the DRC>1 it signifies that the country has a disadvantage in production of the analysed goods.

22
• The Private cost ratio (PCR) is almost identical to the DRC. The difference is that for the PCR the values in private prices are used.
• An alternative for DRC in measuring comparative advantage is Social cost benefit ratio (SCBR). The SCBR is defined by the ratio of total resources cost to the revenue. The SCBR provides more accurate rankings of the comparative advantage of alternative activities. In this study only one activity is investigated. So, the result of DRC is similar to using SCBR.
• The Nominal protection coefficient (NPC), which is defined by the ratio of domestic price to the social price can be calculated for both output and input. NPC greater than 1 indicates implicit nominal protection or subsidy by producers, and implicit nominal tax, when NPC is less than 1.
•The Effective protection coefficient (EPC) another coefficient of incentives, is the ratio of value added in private prices to value added in social prices. This coefficient measures the degree of policy transfer from product market-output and tradable-input-policies. EPC value greater than 1 indicates positive protection of value added by producers, while effective taxation of value added by producers is indicated when EPC is less than 1.
Results
To investigate the influence of policy on the Ukraine dairy sector, milk production at the level of agricultural enterprises was analyzed. For the calculation of social prices of inputs and outputs, world prices were used. The world prices are adjusted for transportation and other costs. For importing inputs, social prices are calculated by adding marketing costs by CIF prices. In addition, FOB export prices are used for exportable inputs. The major outcomes of the analysis are presented on Table 3.
Table 3. Results of the PAM-analysis for dairy production enterprises
Revenues, UAN/t
Costs, UAN/t Profits, UAN/t
Tradable inputs Domestic factors
Private price 2735 656,65 1586,75 491
Social price 3309 786,17 1620,23 903
Effects of divergencesand efficient
policy
-574 -33,48 -129,55 -411
PC 0,54
DRC 0,64
PCR 0,76
SCBR 0,73
NPR 0,83
EPR 0,82
Source: own calculations by the State Statistics Service of Ukraine.

23
In the given PAM structure, calculation of the difference between revenues and expenses in private prices shows that, on average, dairy enterprises gained 491 UAH/t of profit in milk production. However, the difference between private and social prices means that domestic enterprises, functioning in the conditions of the existing market and state policy, receive on 411 UAH/t less of profit. In the other words, social revenue of 903 UAH/t of milk is an indicator of efficiency and competitiveness advantages, and the difference between private and social revenue reflects net transfers (incomings) resulting from the change of the state policy.
In general, results of the PAM-analysis show both positive and negative impact of the existing policy on the market situation. On the one hand, milk producers in Ukraine benefit from cheap internal resources. Currently, expenses on the internal production factors are 1586,75 UAH/t, which is lower than the level of social prices (1620,23 UAH/t). The same situation is observed with tradable production factors, but it is important to mention that the current imperfect economic system makes tradable resource costs more expensive. However, analysis results are also influenced by state policy which partially compensates costs related to herd renovation compensation of 50 % of the cost of purchased cows and heifers. Currently, tradable resource costs paid by milk producers are of 656,65 UAH/t, in social prices 786,17 UAH/t.
Also, the price policy in enterprises caused a decrease of the agricultural revenues from 3309 to 2735 UAH/t. In general, the production system in Ukraine allows profitable milk production in private and social prices. However, due to governmental policy regarding market production factors in then dairy sector, the profit from milk production decreased by 46 % (PC = 54).
DRC (0,64) and PCR (0,76) demonstrate active exploitation of internal resources in milk production. In both cases (in current situation as well as in case of social prices), milk production in Ukraine can be considered competitive. Nevertheless, approximation of the given indicators to 1 means a decrease of competitive advantages in the dairy sector.
The SCBR indicator is another competitiveness indicator, as it is more sensitive to errors and helps determine whether production is really competitive and creates net social revenue for the country. Thus, SCB for Ukrainian milk producers is 0,73, which means that domestic milk producers in Ukraine are competitive. In other words, their expenses on 1 ton of produced milk are 73% of revenue.
NPC (0,83) is another important indicator, which shows the effectiveness of state regulation and level of support of the Ukrainian milk market. Its value testifies to the invisible nominal tax for producers. The value of the EPR (0,82) indicator confirms the imperfectness of the support system for milk producers and the presence of invisible taxation of the added value, which creates additional barriers for domestic products when entering the world market.
Conclusions
Analysis of the internal support of Ukrainian milk producers was performed on the basis of the conducted calculations. Obtained results affirm that the internal support mechanism of the Ukrainian dairy sector needs to be improved and partly changed. The current mechanism of dairy sector state support doesn’t favor an increase in the sector’s efficiency. Absence of support on entering international markets and immoderate taxation

weakens the competitive positions of domestic dairy products. In our opinion, in order to determine the qualitative level of state support of the dairy sector, it is necessary to review governmental policy regarding accessibility of production resources needed in milk production, making them less expensive and accessible for producers. Such measures will favor milk production cost decreases, and as a final result – improvement of efficiency.
References
Monke E., Pearson S. [1989]: Policy analysis matrix for agricultural development, Cornell University Press, Ithaca, NY.
Morris M. [1990]: Determining Comparative Advantage through DRC Analysis: Guidelines Emerging from CIMMYT’s Experience. CIMMYT Economics Paper No. 1. Mexico City, Mexico.
Nelson G., Panggabean M. [1991]: The Costs of Indonesian Sugar Policy: A Policy Analysis Matrix Approach. American Journal of Agricultural Economics 73, p. 704-712.
Ramanovich M. [2005]: Policy Analysis Matrix: an analysis of dairy sector in Belarus, IFCN Dairy research center, Kiel, Germany.
State Statistics Service of Ukraine [2011]: Statistical yearbook of Ukraine, Kiev [Available at]: http://www.ukrstat.gov.ua
Yao, S. [1997]: Comparative Advantage and Crop Diversification: A Policy Analysis Matrix for Thai Agriculture, J. Agri. Econ., 48, p. 211-222.

25
Renata Grochowska1
Institute of Agricultural and Food Economics – State Research Institute in Warsaw Katarzyna Kosior2
Tischner European University in Cracow
Agricultural policies in the context of regional and global food security concerns – the case of the Asian region
Abstract.The paper discusses the effects of changes in Asian agricultural policies on regional and global food security. It also takes account of the consequences of the “rise of Asia” for the European Union food sector. The Asian region is vitally important for future world food security. On the one hand, it suffers from volatility of agricultural commodity prices; on the other hand, individual countries introduce export barriers reducing supply in the global market as was the case during the 2007-08 food crisis. Therefore, the key question arises as to whether regional integration agreements like ASEAN (Association of South-East Asian Nations) or ASEAN+China can shape agricultural policies of these countries and their food self-sufficiency status. Despite ASEAN’s intention to establish an ASEAN Economic Community by 2015, there was a lack of solidarity during the 2006-08 crisis to ensure food security in the region. Yet, given increasing demands from economic, demographic and climatic pressures, more intense regional cooperation can be expected in the near future. Thus, it is of interest to explore possible common solutions for food security policy in the region as well as their impact on national, regional and global food policies. It is still uncertain whether the Asian countries will adopt outward- or inward-looking policy strategies. There were some initiatives set up, however, due to many controversies between net rice exporters and importers, they failed. Therefore, in what direction will agricultural policies in Asian countries be heading in the foreseeable future? Will Asian countries further develop market mechanisms supporting agricultural prices like export quotas and bans, or will they shift to more “green” and trade-neutral policy instruments consistent with the World Trade Organization’s requirements?
Key words: agricultural policy, food security, Asian region
Introduction
Economically, Asia belongs to one of the most dynamic developing regions of the world. The current financial and economic crisis has not affected the Asian economies as strongly as it has affected the economies in the US and Europe. Prognoses indicate that this region will play a leading economic and political role in the world in the coming years.
Despite economic growth there are still a huge number of people in the Asian countries that live below the poverty line. Rising food prices have hit the poorest most severely, causing protests and riots. Political and economic instability in such an important region negatively affects the situation in the whole world.
The latest food crisis of 2007-2008 led to an increase in protectionism in many countries of Asia. Numerous trade restrictions and programs have been introduced to support domestic markets and own citizens at home. This in turn has adversely affected the functioning of the global agricultural markets.
1 Assistant Professor, e-mail: [email protected] 2 Ph. D., e-mail: [email protected]

26
Rapid population growth in developing countries, including Asian countries, as well as the increasing fluctuation of food prices will intensify the problem of access to food at a reasonable price in the Asian region. Thus the paper attempts to answer the question of what impact the activities for the preservation of food security in the Asian region will have on regional and global food security situations. For this purpose, actions taken by Asian countries during the 2007-2008 food crisis as well as Asian agricultural, trade and food security policies were analyzed.
Changes in agricultural policies in Asian countries
The optimal strategy for maintaining national food security is a combination of increasing agricultural productivity and properly conducted agricultural policy and trade. Predictable policies not only reduce the negative impacts of measures taken by other countries, but also reduce food insecurity and domestic price volatility at home [FAO 2011].
In the countries of the Asian region ensuring food security is tantamount to striving for self-sufficiency. This is due to two reasons. Firstly, the region’s diets are based on rice, therefore any instability in the price of this commodity has prompted Southeast Asia governments to protect the domestic rice price from the international price through the exclusion from countries’ tariff systems. Secondly, weak domestic infrastructure in some Asian countries has made imports expensive and difficult, thus governments have implemented policies that ensure sufficient domestic production and the stability of food prices accordingly [Chandra & Lontoh 2010].
Support for agriculture is quite differentiated in the Asian countries. Farm support levels in Japan and South Korea are among the highest in the Organization for Economic Co-operation and Development (OECD) countries. However, a clear downward trend has been observed, as in the case of all OECD countries [OECD 2011]. In turn, support for agriculture in developing countries is quite low when compared to OECD countries (Fig. 1).
The decrease in agricultural support in OECD countries is due to the GATT (General Agreement on Tariffs and Trade) agreements adopted under the Uruguay Round. Agreement on agriculture includes a commitment to reduce domestic support, import barriers and export subsidies that distort international trade. But commitment to lower support levels does not concern individual farm products. Thus reduction of trade distorting instruments refers to very high, historically developed support levels, with which many countries, while reducing the level of support, still have a large margin for negotiation.

27
Fig. 1. NRA1 to agriculture in Asian countries, 1993-95, 2003-2005, 2007-20092 1NRA=percentage by which domestic prices for farm products exceed those in international markets, 2For China, Japan and Korea years 2008-2010, 3Data for Vietnam do not include the years 2007-2009.
Source: Data extracted from Anderson K., Nelgen S., 2012. Updated National and Global Estimates of Distortions to Agricultural Incentives, 1955 to 2010. Spreadsheet at www.worldbank.org/agdistortions, World Bank, Washington DC, March.
Traditional trade instruments (tariffs, import quotas, export subsidies) and producer support (regulation of market prices, direct output and input subsidies) have played and still play a dominant role in agricultural policies of the Asian countries. As mentioned above, these instruments belong to one of the most trade-distorting instruments (and are classified as amber box). Analyses conducted by the OECD show that there is a chance to reduce their negative impact without reducing the size of income transferred to producers [Martini 2011]. However, achieving this in practice would require a change in the forms of support.
Agreements concluded under the World Trade Organization (WTO) lead to a gradual change in agricultural policy instruments. Especially in the OECD countries less is spent to support the volume of production (commodity outputs) or the means of agricultural production (input use). On the other hand, support based on other parameters, such as agricultural land or number of livestock, with reference to historical or fixed levels for these parameters, has been increasing (instruments included in the green box according to the WTO nomenclature). These changes have been observed in Australia, the U.S., Mexico, the EU, Norway and Switzerland. In turn, Iceland, Turkey, Korea and Japan - countries with the highest level of agricultural protection – still rely on traditional market support measures. They do not give up either of price regulation on domestic markets or trade barriers (high duties and import tariffs).
-40%-20%
0%20%40%60%80%
100%120%140%160%180%
1993-95 2003-2005 2007-2009

28
In crisis years, however, the phasing out of traditional agricultural policy instruments has been stopped in many countries. In the situation of extremely high prices, border protection measures and various instruments of domestic support are simply activated. These activities further aggravate instability in global agricultural markets.
Problems of price fluctuations on world markets and high food prices were particularly evident in the years 2007-2008 in developing countries. Policy responses to the crisis, however, were varied, depending on whether the country was an exporter or importer of food. The net rice exporting countries have mainly built up rice reserves or stockpiles and have imposed export restrictions (Thailand, Vietnam). The net importing countries have chosen reduction of import duties, building up of extra reserves and price controls through subsidies. They have also promoted self-sufficiency (Indonesia, Malaysia, Philippines) [Chandra & Lontoh 2010].
The food security in the Asian region mainly depends on domestic agricultural production. Interestingly, despite doubling the volume of imports during the last decade, Asia remains insufficient in food. Most of government interventions focus on short term measures (reducing domestic food prices through trade or price control) and disregard risks of long term food insecurity [Chang & Hsu 2011].
Regional integration in Asia: cooperation in agricultural and food security matters
In the crucial area of agriculture, the Asian region can hardly be seen as a unitary actor with a single interest. A common approach to food and agriculture is, however, badly needed since Asia remains particularly susceptible to natural disasters, climate change and other calamities that jeopardize regional food security. Asian countries are quite diverse both in terms of economic development and agricultural structures [Bergsten et al. 2011]. On the one hand there are countries with quite inefficient and highly subsidized agricultural sectors like Japan and South Korea. On the other hand there are countries belonging to the Cairns Group of agricultural exporters such as Indonesia, Philippines, Malaysia and Thailand. There are also Least Developed Countries in the region (Cambodia, Laos, and Myanmar) that continue to depend on external food aid.
These differences do not ease integration, but at the same time call for relevant mechanisms and measures that would address the existing challenges. Asian countries endeavor to advance cooperation in agricultural and food security matters both under ASEAN’s cooperation and with other countries of the region (ASEAN - Association of South-East Asian Nations). The key issue for all countries of the region is to ensure adequate and stable supplies of rice as it plays a fundamental role in the diet of Asian populations.
Already in 1979, the ASEAN member countries signed the Food Security Reserve Agreement that established the ASEAN Emergency Rice Reserve (AERR). The reserve has been based on rice stocks voluntarily earmarked by the member states to address food emergencies. The ASEAN member states also committed to strengthening the food production base in the region, establishing a food information and early warning system, developing post-harvest technologies, adopting effective national stock holding policies and to promoting price stability [Agreement…1979].

29
However, the system that was adopted has proven ineffective. Firstly, the size of the regional emergency rice reserve was too small to meet food emergency requirements in the region. The earmarked stocks of 87 thousand tons could suffice for only a half-day's supply for populations of the ten ASEAN member countries [Arnst 2009]3. In addition, releases from the AERR required bilateral negotiations between a country in an emergency situation and a country providing its earmarked reserve. Not surprisingly, the reserve has never been used, even during serious crisis situations like in 1997 in the Philippines. Countries in need were reluctant to deal bilaterally with the provider-country. They were also afraid that declaring a state of national food emergency could worsen their position and deepen the crisis [Daño & Peria 2006].
Recently, Asian countries have undertaken various initiatives to strengthen regional food security architecture. The ten ASEAN member states, Japan, South Korea and China (under the ASEAN Plus Three cooperation) established the East Asia Emergence Rice Reserve (EAERR). The initiative has been seen as a way for overcoming the inefficiencies of the AERR. It was first proposed as a pilot project for the years 2003-2010. Basically, it aimed to test various mechanisms for releasing rice stocks. The new mechanism received strong support and funding from Japan as well as in-kind contributions from ASEAN member countries, particularly from Thailand [Briones 2011]. Unlike the AERR, the EAERR has been based both on earmarked stocks and physical stocks stored at various locations across the region. The earmarked stocks increased tremendously from the 87 thousand tons under the AERR to 787 thousand tons under the EAERR. Nonetheless, Asian countries failed to develop a common response during the 2007-2008 food crisis. Thus the projected emergency mechanisms proved to be of little value. What was lacking was the coordination between national trade policies to avoid supply and demand shocks in agricultural markets [Headey 2011].
Following the 2007-2008 food crisis, the ASEAN member states adopted an Integrated Food Security Framework and a Strategic Plan of Action on ASEAN Food Security for the years 2009-2013. The framework and the plan aim at strengthening the food security arrangements by focusing on trade and long-term development of agricultural production in the region. The plan also stresses the need for regular consultations, timely and reliable information on regional food security situations and stabilization of food supply in the global markets. The ASEAN member states also adopted a special Multi-Sectoral Framework on Climate Change which addresses the needs of agriculture and forestry sectors in the context of global warming and food security challenges. Most importantly, it has been decided that the EAERR will be converted into the ASEAN Plus Three Emergency Rice Reserve (APTERR) and that it will become a permanent structure for managing food security risks in the region, not only at times of crises. The agreement on the APTERR was reached in October 2011, however, institutional arrangements and trigger mechanisms have not yet been decided [Briones 2011].
It is not clear whether the new framework and the APTERR will yield expected results. Formally, the APTERR stresses the need for strengthening trade linkages among countries of the region and with the rest of the world. However, some also view it as a way for overcoming the WTO commitments, particularly by wealthier countries such as Japan 3 The initial amount of earmarked stocks was set at 50 thousand for Philippines, Indonesia, Thailand, Malaysia, Singapore and Brunei. After the accession of four new member states in the 1990s (Vietnam, Laos, Myanmar, Cambodia) it was augmented to 87 thousand tons [Bello 2005].

30
that find it difficult to lower domestic subsidies linked with production. Physical rice stocks located in other countries of the region, to be resorted to in case of need, could offer a convenient means for sheltering domestic farmers against losses caused by opening markets to imports [Daño & Peria 2006].
Undoubtedly, further development of international trade is the most important step towards ensuring food security in Asia and in the world. Greater liberalization of farm trade increases agricultural competitiveness and productivity. Yet, regional integration in the agriculture sector has never been easy in the Asian region. The agreement on free trade area among the ASEAN member states (AFTA agreement) was signed in 1992, more than twenty years after the formation of the ASEAN. The agreement included inter alia the commitment to strengthen agricultural competitiveness and intra-and extra-ASEAN trade in agriculture, fishery and forest products. Nonetheless, although primary and processed agricultural products were covered with gradual tariff reductions (like all other goods, but at a slower pace), the member states still kept the right to the so called temporary exclusion lists and exception lists. E.g. the crucial rice and sugar sectors are still protected by high tariffs and other barriers. In addition, the four member states that acceded to the ASEAN in the 1990s (Vietnam, Laos, Myanmar and Cambodia) have been given the right to use “opt out” from preferential market access for a large number of products [Korinek & Melatos 2009].
Relatively high levels of protectionism in the strategic sector of rice do not foster a stable and predictable system of food security in the region and thus in the world. Although the ASEAN is currently seen as a “hub” for a number of regional Free Trade Agreements (FTAs), there are also concerns that multiplication of the FTAs4, which all require the corresponding Rules of Origin, will distort regional markets and paradoxically restrict the free movement of goods.
The 2007-2008 crisis showed a lack of coordination and a lack of solidarity among the Asian nations. Thus it can be expected that deeper integration in the region will be rather an arduous task. In addition, institutional arrangements within the ASEAN do not promote structured cooperation in the Asian region. Unlike the EU, the ASEAN is based solely on intergovernmental modes of decision-making. Yet, the ASEAN member countries do not give up their plans for deeper economic and political integration. There are plans to establish an ASEAN Economic Community by 2015.
Taking into account the problems of the EU, which has become a conglomerate of highly diverse countries and nowadays experiences serious integration problems, one can wonder how such integration would proceed in the Asian region which is similarly diverse. A change of approach to integration may occur along with the increasing levels of wealth among the Asian countries. But also a reverse process is possible – the increasing levels of prosperity may awaken nationalist tendencies and a desire to dominate over other countries.
4 These include the ASEAN-China Free Trade Area signed in 2002, the ASEAN- India Free Trade Area signed in 2003, ASEAN-Republic of Korea Free Trade Area signed in 2005, ASEAN-Japan Comprehensive Economic Partnership signed in 2008, ASEAN – Australia – New Zealand Free Trade Area signed in 2010.

31
Asian food security in regional and global dimensions
According to forecasts the Asian region will be one of the fastest growing regions in the world in the coming years [Hawksworth & Cookson 2011]. The Chinese economy will trump the US economy by 2025, and India will move closer to the US economy in 2050. The Indonesian economy will be bigger than German, French and British economies in 2050. Also, Asian countries such as Vietnam, the Philippines, Bangladesh, Pakistan, Malaysia, and Thailand may dramatically increase by 2050. Unfortunately, economic growth will not go hand in hand with the reduction of hunger. For the 75% of people in developing countries who live in rural areas, income is derived directly or indirectly from agriculture. Even taking into account the growth of urbanization in these countries, it is difficult to expect significant changes in the food security situation of the poorest.
It should be expected that price volatility in agricultural markets will become more and more frequent, inter alia due to tighter links between food and energy prices. Population growth in the Asian region and an increasing demand for food quantity and quality will cause significant pressure on food production. Another factor is the increasing demand for raw materials for biofuel production.
The growing demand for food in China and India, whose populations increasingly prefer diets containing more meat, will play a crucial role. The second element is the increase in energy demand in these rapidly developing economies (one of the major reasons behind the increase in world energy prices). With depleting domestic grain stocks, China and India alone may affect international food prices. For example, cereals stocks in India declined to such an extent that the country decided to limit exports of rice in November 2007, which certainly had an impact on prices of rice in international markets. Asian economies are now interdependent with each other and with the rest of the world. Thus, food security decisions taken in the region will be felt throughout the world.
Rapid depletion of natural resources and the increasing frequency of natural disasters will be the major challenge for the Asian region. These processes contribute to a declining productivity of some agricultural products. Global arable land per person decreased to 0.25ha by 1997 and according to prognoses it will decline to 0.15ha by 2050 [Ewing 2011]. Asian countries are no longer able to increase their agricultural land, potential and limited opportunities are still present in East Asia. Some countries already seek to maximize food production through the use of high doses of mineral fertilizers. Extremely high doses are used for example in China, causing environmental harm and limiting production capacity for crops. An even more severe problem concerns the access to water, particularly in South Asia which is particularly affected by climate change [FAO 2009]. However, one should not expect a decline in food production in Asia in the coming years. In contrast to the EU, these countries apply new technologies such as GMOs and nanotechnology without resistance. Therefore they will become ever greater competitors for the current major food exporters (US, EU).
As already mentioned, many Asian countries will seek to increase their food production to achieve self-sufficiency. However, the question arises as to whether this idea is correct. Some believe that it is better to invest in those areas in which a country performs the best, acquiring thereby the missing funds to buy food. Others still prefer to invest in local production so as to attain self-sufficiency. However, in the era of globalization, each country becomes vulnerable to turmoil in global markets. Therefore, it seems more

32
appropriate to look for regional or even global solutions that would be helpful in overcoming problems. Unfortunately, special interests of individual countries still dominate the decision-making process. The food crisis of 2007-2008 has clearly demonstrated this problem.
Despite aspirations for self-sufficiency, many Asian countries will be still dependent on food imports. Hence, the global trading system, fair and competitive, is crucially important. The reform of the WTO, which limits the use of trade-distorting instruments (amber box) in favor of the green box measures, goes in the right direction. However, Asian countries are reluctant to phase out traditional instruments of agricultural support and border protection. Thus, it is difficult to expect significant changes in this regard in the coming years.
This leads to some paradoxes, particularly when we compare the priorities and actions of the EU, China and India. While the EU reduces the level of support to agriculture and converts agricultural policy instruments into non-distorting measures, Asian countries, conversely, increase agricultural support and consistently apply trade distorting policy tools. In this context one can think about the EU's ambitious carbon reduction commitments and the lack of support for the CO2 cuts from the part of the world's largest emitters, including China and India.
Despite significant differences in interests between countries, common policy instruments and coordinated aid actions should be developed to fight with food crises in the future. Actions are needed at the global level. First, further trade liberalization in agricultural products is necessary. Secondly, long-term strategies should take into account the risks to agricultural productivity caused by climate change and degradation of natural resources. Thirdly, effective aid systems for populations lacking food and agricultural productivity growth in countries dependent on food imports are needed [Headey & Fan 2010].
Conclusions
The food crisis of 2007-2008 appeared to be more a crisis of confidence (closing of borders, renationalization of policies) than a real physical crisis (the lack of food). Effects of trade restrictions are only short term. With increasing demand for the quantity and quality of food, the Asian region will not be able to ensure food security for the growing population in the longer term.
Asia’s abilities to feed itself are important not only for the region, but also for the whole world [Glickman & Swaminathan 2010]. Therefore it is necessary to coordinate joint actions on a regional and global scale. Real reforms of the global food security system are necessary given increasing agricultural price fluctuations and climate changes that affect agricultural productivity.
The question arises as to which global institution could undertake this task. The question is all the more important since we can observe a decreasing relevance and lack of effectiveness of all major international organizations. This also concerns the WTO. Without breaking the deadlock in multilateral trade negotiations and without the adoption of a comprehensive agreement on agriculture the organization of an effective global food security system will not be possible in the longer run. The adoption of a new and comprehensive WTO agreement on agriculture is the best possible solution. However,

experience to date raises doubts as to whether it will be possible to achieve substantial progress on agricultural issues in the near future in an organization consisting of 156 countries. Hence, one can assume that actions taken at a regional level will become more and more important. Asian countries are able to create a very strong region of the world, competitive in relation to existing economic powers like the United States or the European Union.
References
Agreement [1979]: Agreement On The ASEAN Food Security Reserve. New York, 4 October 1979, available at http://www.aseansec.org/6170.htm
Anderson K., Nelgen S. [2012]: Updated National and Global Estimates of Distortions to Agricultural Incentives, 1955 to 2010, Spreadsheet at www.worldbank.org/agdistortions, World Bank, Washington DC, March 2012.
Arnst R. [2009]: Business as Usual: Responses within ASEAN to the Food Crisis. A Report for Focus on the Global South, Occasional Papers 4, February 2009, available at http://focusweb.org/pdf/occasionalpaper4.pdf.
Bello A.L. [2005]: Ensuring Food Security – A Case for ASEAN Integration, Asian Journal of Agriculture and Development 2(1&2), 87-108.
Bergsten C.F., Noland M., Schott J.J. [2011]: The Free Trade Area Of The Asia-Pacific: A Constructive Approach To Multilateralizing Asian Regionalism, ADBI Working Paper Series 336, December 2011.
Briones R.M. [2011]: Regional Cooperation for Food Security: The Case of Emergency Rice Reserves in the ASEAN Plus Three, ADB Sustainable Development Working Paper Series 18, November 2011.
Chandra A.C., Lontoh L.A. [2010]: Regional Food Security and Trade Policy in Southeast Asia: The Role of ASEAN, Trade Knowledge Network Policy Brief, Series on Trade and Food Security, Policy Report 3, June 2010.
Chang Ch-Ch., Hsu S.-H. [2011]: Food security – Global Trends and Region Perspective with Reference to East Asia, AAEA&NAREA Joint Annual Meeting, Pittsburgh, Pennsylvania, July 24-26, 2011.
Daño E., Peria E. [2006]: Emergency or Expediency? A Study of Emergency Rice Reserve Schemes in Asia, A Joint Publication of AFA and Asia, DHRRA.
Ewing J.J. [2011]: Food production and Environmental health in Southeast Asia: The Search for Complementary Strategies, Policy Brief 11, Centre for Non-traditional Security Studies, May 2011.
FAO [2009]: How to Feed the World in 2050, Expert paper, available at http://www.fao.org/fileadmin/templates/wsfs/docs/expert_paper/How_to_Feed_the_World_in_2050.pdf
FAO [2011]: The State of Insecurity in the World, How does international price volatility affect domestic economies and food security, FAO, available at http://www.fao.org/docrep/014/i2330e/i2330e.pdf.
Glickman D., Swaminathan M.S. [2010]: Never an Empty Bowl: Sustaining Food Security in Asia, Asia Society and International Rice Research Institute, Task Force Report, September 2010.
Hawksworth J., Cookson G. [2011]: The World in 2050. Beyond the BRICs: a broader look at emerging market growth prospects, PriceWaterHouseCoopers’ Report.
Headey D. [2011]: Rethinking the global food crisis: The role of trade shocks, Food Policy 36(2), 136-146. Headey D., Fan S. [2010]: Reflections on the Global Food Crisis, How did it happen? How has it hurt? And how
can we prevent the next one?, Research Monograph 165, IFPRI. Korinek J., Melatos M. [2009]: Trade Impacts of Selected Regional Trade Agreements in Agriculture, OECD,
Trade Policy Working Papers 87, OECD Publishing. Martini R. [2011]: Long Term Trends in Agricultural Policy Impacts, Working Paper 46, OECD Publishing. OECD [2011]: Agricultural Policy Monitoring and Evaluation 2011. OECD countries and emerging economies.
OECD Publishing, available at http://dx.doi.org/10.1787/agr-pol-2011-en.

34
Mariusz Hamulczuk1
Department of Agricultural Economics and International Economic Relations Warsaw University of Life Sciences – SGGW Wies aw opaciuk2
Department of Market Research Institute of Agricultural and Food Economics – National Research Institute
Price linkage between milling and feed wheat prices in Poland and Germany
Abstract. The aim of the paper was to analyse spatial price transmission in the wheat market in Poland and Germany. The analysis was conducted with the use of weekly milling and feed wheat price series and cointegration framework. The results confirm high linkage between prices in Poland and Germany as well as allow us to identify Germany as the price-leading market. However, as the self-sufficiency in the German wheat market has deteriorated, there are signals of growing importance of the Polish market in the milling wheat price formation.
Key words: wheat prices, price transmission, cointegration, VECM models
Introduction
Prices, being to certain extent a factor responsible for output (production) and consumption (use), are of key importance in economic theory. Over time agricultural prices have been much more volatile than the prices of non-agricultural goods and services, especially for the previous 10 years. Such a situation adversely affects both economic and social spheres in every country.
The prices of agricultural commodities are an exceptional field for research on price drivers. The prices of agricultural commodities, in particular the prices of cereals, result from a wide variety of systems ranging from almost entirely based upon administrative regulations to classic examples of free market [Tomek and Robinson 2001].
Poland after the accession to the EU became a part of common market – a large and well-organised market, directly linked with world markets. Since then the position of Poland as regards grain trade has changed significantly, which implies certain changes in cereal price setting mechanisms. Therefore, there is a need to investigate the direction of price transmission, the price factors and the pattern of price adjustments on the cereal market.
Vertical price transmission illustrates linkages along a supply chain, while horizontal transmission, which is our focus in the paper, refers to linkages between different markets at the same level of the food chain. Most often it refers to price relationships across markets, i.e. to spatial price transmission as well as the transmission between various agricultural commodities (cross-commodity price transmission) [Esposti and Listorti 2011], and non-agricultural versus agricultural commodities (namely, energy versus agricultural prices) [Serra and Hassouneh 2011], and finally between different contracts for the same
1 Assistant Professor, e-mail: [email protected] 2 Senior Research Fellow, e-mail: [email protected]

35
commodity (usually, futures versus spot markets and vice versa) [Baldi et al. 2011]. From an economic point of view, the crucial issue here is spatial arbitrage and the Law of One Price (LOP). Unlike in the case of cross-commodity price transmission, the changes in linked prices in most cases reflect the possibilities of substitution and also complementary interactions between the products [Ardeni 1989; Saadi 2011] or, as it is the case here, pure price differentials.
A great part of the research on market integration and price transmission, both spatially and vertically, has been done with the use of different quantitative techniques and has underlined several factors hampering the transmission of price signals. Distortions imposed by administrative regulations, i.e. policies such as border restrictions and price support mechanisms, impeded linkages between particular markets. The instruments of agricultural policies, namely intervention, import tariffs, tariff rate quotas, export subsidies or taxes and macro tools such as exchange rate policies, insulate domestic markets and considerably slow down and reduce the transmission of international price signals through the impact on excess demand or supply schedules within internal commodity markets [Gardner 1975; Mundlak and Larson 1992; Quiroz and Soto 1996; Baffes and Ajwad 2000; Abdulai 2000; Sharma 2002].
Taking into account the above, this paper is focused on statistical investigation of the linkages between wheat prices on Polish and German markets. The analysis is conducted on the basis of weekly price series of consumption and feed wheat, and takes into account the possibility of the existence of two regimes connected with the impact of biofuel policy, which differentiates this search from other examinations concerning the Polish wheat market [vide Rembeza 2010].
Wheat market characteristics
Assuring approximately 20% of the world’s calorie supply [Mitchell and Mielke 2005], wheat is considered one of the crucial food crops. It is produced in numerous countries (ca 120) under a variety of climatic conditions with the use of a broad range of technologies. Roughly 60% of wheat is produced in developing countries. Since that output has been growing faster than in developed countries, this proportion has increased over time. Over the last 5 decades, world wheat production has been increasing steadily, although there have been minor fluctuations in trends. Recently wheat output has roughly been 3 times higher than at the beginning of 1960s.
The wheat market is very well concentrated; however, a few new producers have recently emerged. Since the early sixties, a group of five countries (China, India, USA, Russia and EU) has accounted for more than two-thirds of the world’s wheat output. But presently there are new competitors, such as Canada, Australia, Pakistan, Turkey and Argentina in first turn and Russia, Ukraine and Kazakhstan as the most recent newcomers. All the above-mentioned countries account for much more than 80% of the world wheat production. Therefore one can assume without any doubt that any shift in the market fundamentals in these countries has a certain impact on world prices. Apart from that, there is another division of the big players in respect to self-sufficiency. On one side, there are big exporters – Argentina, Australia, Canada EU, USA and recently Russia, Ukraine and Kazakhstan, as well as big importers like China, India and Japan.

36
Simultaneously, the consumption of wheat over the concerned period increased more than 2.5 times, significantly exceeding 600 tonnes. The increase reflects the following:
wheat is a staple food for humans, and can be replaced by very few other products; accelerating population growth, particularly in developing countries; migration from rural to urban areas where wheat is more common in diets; growing food aid from developed to poor countries; growing non-food uses (particularly biofuels).
Growing demand overlapping with poor crop and low inventories as well as with the influence of capital markets triggered recent price rises (2007-2008 and from 2010 to 2013) and induced price volatility.
Neighbouring Poland and Germany are two of the largest wheat producers in the EU, occupying 2nd and 4th place respectively. However, the markets in these countries are considerably different, beginning from the structure of producers (extremely fragmented in Poland) and ending up with farm size which in Germany is more than two times bigger than in Poland. The Polish share in the European cereal market is much lower than the German one (especially in the case of wheat). Both countries account for ca 25% of the EU cereal market.
About 2/3 to 3/4 of the output in Germany is traded while in Poland the proportion rarely exceeds 50%. Since the accession Polish cereal exports, particularly wheat, have considerably increased. The bulk of the growth has been sold on the German market as the situation for the German balance sheet of wheat has apparently deteriorated since 2009. Such a situation in Germany reflects growing cereal use in the biofuel sector. So the deficit in the German market is at least partly fed with Polish wheat. At the same time Germany is an active exporter to third countries so world prices to a certain extent are reflected there, especially in the Western part of the country.
The above implies at least a couple of questions with the most important for the purpose of the paper: how Polish prices reflect the situation on the German market and what is the direction of price signals. There are also issues of price transmission which have recently drawn considerable attention. No doubt the attractiveness of this topic has grown since the first food crisis (the price rise in 2007-2008) was observed on international agricultural markets which were under the turmoil of rising volatility of prices with a possibility of the change in the long-term downward trend of agricultural prices [European Commission 2008, 2011; Irwin and Good 2009].
Methods applied
To analyse different aspects of price linkage between the German and Polish wheat market several methods were applied. The price series (yt) were decomposed into long-term trend (TCt), seasonal (St) and random fluctuations (It) using multiplicative model: yt=TCtStIt. Seasonality effect was identified using regression model with seasonal dummy variables (0/1). The long-term trend was estimated through smoothing using Hodrick- -Prescott filters. This part of the analysis allowed us to evaluate the share of seasonal and long-term fluctuations in the total variance of the price series.

37
Price series usually behave as non-stationary processes, so in order to verify this presumption each of the series was tested for unit root using the Augmented Dickey-Fuller (ADF) test. Null hypothesis states that time series is non-stationary (has unit root) against the alternative of stationarity. ADF test statistic is based on t-statistic of coefficient from OLS estimation of the following formula [Lütkepohl, Krätzig 2007]:
p
i titittt yyy11
(1)
where: yt – analysed price series, t – deterministic term (constant, trend), p – the number of lags ensuring white noise properties of random component t, i – coefficients describing the short-run persistence of ty . The number of lags p was determined with the use of Akaike’s Information Criterion (AIC).
Evaluating the nature of the relation between wheat prices, the concept of Granger causality was employed. A variable x is said to Granger-cause y if we can better forecast yusing lagged values of x than we can without them [Kuside 2000, Lütkepohl and Krätzig 2007]. Applied Granger causality test formula is presented below:
k
j
k
jtjtjjtjt xyay
1 10
(2)
where a0, j, j, are model parameters, y and x are analysed variables, k – the greatest lag length, t – white noise. Null hypothesis, stating no Granger causality, assumes that 1= 2=…= k=0 against alternative of these coefficients statistically significant. Determining the number of lag length we applied Vector Autoregression Model (VAR) and AIC.
Vector Autoregression Model consists of regression of every non-lagged variable on all lagged variables. Its formula is presented below [Kuside 2000; Tsay 2010]:
tptptttt uYAYAYADY ....2211 (3)
where Yt – stochastic processes collected in n×1 vector, Dt – deterministic variables vector, – matrix of deterministic variables parameters, Ai are (n×n) coefficient matrices, p means
order of VAR model. To test the existence of the long-term relationship of series a Johansen cointegration
framework based on Vector Error Correction Model was applied. The nonstationary time series are cointegrated if there is a linear combination of them that is stationary I(0). The linear combination of two series is referred to as a long-run equilibrium relationship. The VECM can be presented in a form [Tsay 2010]:
titp
i ittt uYYDY 1
11 (4)
where: = A1+…+ Ap–In and i =p
ijj
1
, i= 1,…, p-1. The matrix is called the long-
-run impact matrix and i are the short-run impact matrices. Matrix can be decomposed

38
= ’, where – matrix of parameters expressing adjustment to the long-run relationship, – matrix of cointegration vectors expressing long-run relationship [Kuside 2000; Tsay
2010]. Since the rank of the long-run impact matrix gives the number of cointegrating
relationships in Yt, Johansen formulates likelihood ratio (LR) statistics for the number of cointegrating relationships as LR statistics for determining the rank of . The trace statistic LRtrace is as follows:
n
riitrace TLR
1)1ln( (5)
where: T is the sample size and i is the i-th largest canonical correlation (eigenvalues of the matrix ). The trace test tests the null hypothesis of r cointegrating vectors against the alternative hypothesis of n cointegrating vectors.
Data and preliminary analysis
Empirical analysis of price linkage between Polish and German markets was conducted on the basis of weekly procurement prices of milling (M) and feed (F) wheat (Fig. 1). Source of the statistical information was European Commission. The price series consisted of 439 observations and covered the period from January 2005 to May 2013.
Fig. 1. Weakly procurement milling (M) and feed (F) wheat prices in Poland and Germany denominated in euro/tonne
Source: own calculation based on European Commission data.
A cursory analysis of the chart indicates the upward trend of all price series and the existence of high correlation between them. To analyse the patterns existing in the data, decomposition of price series was applied. Obtained long-term tendency patterns are similar in Poland and Germany. There is no substantial time lag between price cycles in Poland and Germany. The cross-correlation coefficients for corresponding price series (seasonally adjusted and smoothed) are the highest for the lag of one week.
50
100
150
200
250
300
Jan-05 Jan-07 Dec-08 Dec-10 Dec-12
Germany M
Poland M50
100
150
200
250
300
Jan-05 Jan-07 Dec-08 Dec-10 Dec-12
Germany F
Poland F

39
The analysis allowed us also to evaluate the share of seasonality in the total variance of the price series (Fig. 2). According to the results obtained, seasonality is not important as the long term tendency part of the price series variation. Seasonality is responsible for 0.3-1.3% of the total variation of prices. Seasonality patterns in Poland are lagged a few weeks in comparison to seasonality observed in Germany. Such a shift (more visible in the case of feed prices) is due to time lag in harvest in Poland and the impact of earlier time of harvest in southern European countries on German market (geographical location of Germany).
Fig. 2. Seasonal indices for wheat price series (multiplicative model)
Source: own calculation.
One of the most important features of price series that influence the choice of method applied is the order of integration of such series. Price series usually behave as non-stationary (unit root) processes. In order to verify this presumption each of the series (in natural logs) was tested for existence of unit root using the Augmented Dickey Fuller test (ADF). Null hypothesis stating that a given price series follows unit root processes cannot be rejected for procedures: with constant as well as with constant and linear trend. When applying the considered test for the first differences of price series the null hypothesis was rejected, which leads us to the conclusion that all price series are integrated in order one I(1). Use of the ADF test for seasonally adjusted data does not change the final outcomes.
Price transmission analysis
In this chapter the issue of linkage between corresponding wheat prices in Poland is considered. As there are some premises which may suggest different behaviour of relationships till 2008 and since 2009, some of the analyses were conducted for two separate sub-periods.
One of the most important questions in economics concerns the direction of causality. In other words, we are interested in answering the question: what are the causal mechanisms between the wheat prices in Poland and the wheat prices in Germany. To test it a Granger causality test in the framework of VAR model was applied. As all price series are integrated in order one and the seasonality effect is negligible, all price series were in first differences of their logs (d_l). All lags were chosen according to AIC criterion.
9092949698
100102104106108110
1 8 15 22 29 36 43 50
Germany M
Poland M
9092949698
100102104106108110
1 8 15 22 29 36 43 50
Germany F
Poland F

40
Results presented in Table 1 indicate that in most cases there are two-way relationships. However, the impact of German prices on Polish ones is much stronger than vice versa. Most research done on the basis of monthly data suggests one-way Granger-causality. When going into details some changes of direction of causality are observed. In the case of milling wheat prices in 2005-2008 there was no impact of Polish prices on German ones. In line with the deterioration the self-sufficiency ratio in Germany, the impact of conditions in the Polish market on German milling wheat prices seems to be higher (period 2009-2013). The situation is the opposite in the case of feed wheat prices. After 2009, Polish feed prices are not the cause in the Granger sense for Germans ones. The reasoning of such a change might be decrease of demand for feeders due to dramatic drop of pig population in Poland after 2008.
Table 1. Granger causality test results
Independent variable
Dependent variable
Milling wheat prices Feed wheat prices
F-statistic P-value F-statistic P-value
2005-2013
d_l_Poland d_l_Germany 3.23 0.012 2.72 0.020
d_l_Germany d_l_Poland 17.42 0.000 9.77 0.000
2005-2008
d_l_Poland d_l_Germany 0.72 0.610 3.49 0.017
d_l_Germany d_l_Poland 7.85 0.000 5.87 0.001
2009-2013
d_l_Poland d_l_Germany 3.16 0.015 1.41 0.236
d_l_Germany d_l_Poland 9.17 0.000 11.12 0.001
Source: own calculation.
Even though there are short-run relationships between prices there might also be a long-run relationship implying the fact that prices follow the same trends. Figure 1 and the graph presenting the percentage differences between corresponding German and Polish wheat prices (Fig. 3) suggest the existence of such long-run association. Let’s start from analysing that, over the analysed period Polish prices have been by 4.4% (milling) and 5.7% (feed) on average lower than German prices. However, there were quite considerable short-term divergences between corresponding prices (+/-25%). There might be different reasons for price differential (market fundamentals, delayed adjustment of prices due to market imperfections, etc.).

41
Fig. 3. Percentage difference between German and Polish wheat prices
Source: own calculation based on European Commission data.
To test the presence of a long-run relationship the Johansen procedure for a pair of price series was applied. Results obtained (Table 2) indicate the existence of one cointegration vector which is evidence of a long-run equilibrium relationship between Polish and German prices. In other words, they follow the same trends and if any discrepancies (Fig. 3) occur there are forces which push them to long-run equilibrium. If there is a linear relationship between two data series, there must also be a causal relationship. Granger [1969] introduced the concept of causality and noted that cointegration implies causality. Accordingly, finding prices to be cointegrated can be regarded as evidence of causality, although it need not be bi-directional.
Table 2. Johansen cointegration test (LR trace) results between logs of corresponding wheat prices in Poland and in Germany (model with unrestricted constant)
H0Milling wheat prices (lag 5) Feed wheat prices (lag 4)
Eigenvalue Statistic P-value Eigenvalue Statistic P-value
r=0 0.042 21.665 0.004 0,055 27.290 0.001
r 1 0.007 2.9525 0.086 0.006 2.457 0.117
Source: own calculation based on European Commission data.
Table 3 presents selected results of VECM models estimation. For all cases beta coefficients are close to 1 so the shape of Error Correction Term (ECT) is analogous to the price differences presented in Figure 3. The values of vector (close to 1) suggest the presence of LOP and its strengthening over time. Coefficient (called speed-of-adjustment coefficient) expresses the response of prices to the previous period’s deviation from long-run equilibrium. For the whole period and both types of wheat prices we can observe that adjustment to the long-run equilibrium is mostly on the Polish side. The speed-of-adjustment coefficients for German prices are not statistically significant which leads us to the conclusion that German price series are weakly exogenous in the system of prices. In the case of milling wheat we can note the increase of speed-of-adjustment coefficients for Polish as well as for German prices over the examined period. In the second period (2009-
-30
-20
-10
0
10
20
30
40
Jan-05 Jan-06 Jan-07 Dec-07 Dec-08 Dec-09 Dec-10 Dec-11 Dec-12
%
Miling wheat Feed wheat

42
2013) there German side
Table 3. Estima( ) – model wi
BetaDependent v
vector
l_Poland B
l_Germany B
vector
l_Poland F
l_Germany F
Source: own ca
Assumof price trandecompositiindicates themodel. Accfactors on thweeks. In thwheat priceimportance
Fig. 4. Varianc
Source: own ca
are some noe too ( =0.08
ation of VECM mth unrestricted co
/variable
alculation based o
ing (accordingnsmission is frion of forecae amount of iording to thehe Polish pric
he long perspee variance. Iof domestic fa
e decomposition
alculation based o
oticeable sign83, p=0.069) w
models– cointegraonstant
2005-2013
p
M
1; -1.051
-0.068 <
0.021
F
1; -1.056
-0.081
-0.008
on European Com
g to the resultfrom German ast error variinformation ea results preseces prevails oective, internalIt is worth nactors in the P
of forecast errors
on European Com
2005-2008
ns of adjustmewhich confirm
ation relationship
p-value
Milling wheat price
<0.001 -0.0
0.302 0.0
Feed wheat prices
0.000 -0.0
0.590 -0.0
mmission data.
ts of Granger (which represiance was caach variable cented in Figurover the foreigl factors are renoticing that Polish market
s for Polish millin
mmission data.
8
ent to the lonm results from
p ( ) and coefficie
2005-2008
p-value
es
1; -1.145
060 0.008
012 0.553
s
1; -1.107
084 <0.001
011 0.570
test and VECsent foreign malculated. Thecontributes tores 4 and 5, tgn market facesponsible forthe analysis
of milling wh
ng wheat prices
ng run-equilibGranger-caus
ents of the long-ru
2009
e
1; -
-0.111
0.083
1; -
1 -0.085
0.001
M) that the mmarkets) to Poe variance de the other varthe influence
ctors in the hor 7-20% of thes indicates anheat (Fig. 4).
200
brium on the sality test.
un convergence
9-2013
p-value
-0.979
<0.001
0.069
-1.018
<0.001
0.966
main direction olish prices, a ecomposition riables in the of domestic
orizon of 6-8 e total Polish n increasing
9-2013

43
Fig. 5. Variance decomposition of forecast errors for Polish feed wheat prices
Source: own calculation based on European Commission data.
Summary
Over time there were numerous developments on the cereal market such as changes in the structure of production and demand resulting in an increase of prices and their volatility. The recent development of biofuel policies is regarded as one of the most important drivers of wheat prices.
Over the period of 2005-2013 price cycles in Poland and Germany were overlapping. The share of seasonal fluctuations in the total variance of the price series is of minor importance.
The analysis indicated an existence of a long-run equilibrium relationship between Polish and German price series. A great majority of adjustments to the long-run equilibrium take place on the Polish side which is also confirmed by the Granger causality test. After 2009, along with the deterioration of self-sufficiency in the German wheat market, there have been signals of a growing importance of domestic factors in respect to milling wheat price formation in Poland.
Analytical work conducted in this paper can be extended further in the field of asymmetric adjustments testing as well as in respect to regional analysis within the concerned countries. It also may be supplemented with more detailed testing of LOP.
References
Abdulai A. [2000]: Spatial price transmission and asymmetry in the Ghanaian maize market. Journal of Development Studies, 63, 327-349.
Ardeni P.G. [1989]: Does the Law of One Price really hold for commodity prices? American Journal of Agricultural Economics, 71, 303-328.
Baffes J., Ajwad M. [2001]: Identifying price linkages: a review of the literature and an application to the world market of cotton, Applied Economics, 33, 1927-1941.
2005-2008 2009-2013

Baffes J. [1991]: Some further evidence on the Law of One Price. American Journal of Agricultural Economics, 4, 21-37.
Baldi L., Peri M., Vandone D. [2011]: Price Discovery in Agricultural Commodities: the Shifting Relationship between Spot and Futures Prices. Paper Presented at the EAAE 2011 Congress, Change and Uncertainty Challenges for Agriculture, Food and Natural Resources, August 30-September 2, Zurich.
Esposti R., Listorti G. [2011]: Agricultural Price Transmission Across Space and Commodities During Price Bubbles. Paper presented at the EAAE 2011 Congress, Change and Uncertainty Challenges for Agriculture, Food and Natural Resources, August 30 September 2, Zurich.
European Commission [2008]: High Prices on Agricultural Commodity Markets: Situation and Prospects. A Review of Causes of High Prices and Outlook for World Agricultural Markets. European Commission, Directorate General for Agriculture and Rural Development, Brussels.
European Commission [2011]: High Commodity Prices and Volatility. What Lies Behind the Roller Coaster Ride? Agricultural Markets Brief, n.1/June, Directorate General for Agriculture and Rural Development, Agricultural Trade Policy Analysis Unit, Brussels.
Gardner B.L. [1975]: The Farm-Retail Price Spread in a Competitive Food Industry. American Journal of Agricultural Economics, 59, 399-409.
Hassouneh I., Serra T., Gil J.M. [2011]: Non-Parametric and Parametric Modeling of Biodiesel - Sunflower Oil - Crude Oil Price Relationships. Paper presented at the EAAE 2011 Congress, Change and Uncertainty Challenges for Agriculture, Food and Natural Resources, August 30-September 2, Zurich.
Irwin S.H., Good D.L. [2009]: Market Instability in a New Era of Corn, Soybean, and Wheat Prices. Choices, 24 (1), 6-11
Kuside E. [2000]: Modelowanie wektorowo-autoregresyjne VAR. Metodologia i zastosowanie w badaniach ekonomicznych [in:] Dane panelowe i modelowanie wielowymiarowe w badaniach ekonomicznych. Absolwent, ód .
L tkepohl H., Krätzig M. [2007]: Applied Time Series Econometrics. Cambridge University Press. New York. Mitchell D. O., Mielke M. [2005]: Wheat: The Global Market, Policies and Priorities, in Global Agricultural Trade
and Developing Countries, World Bank, Washington D.C. Mundlak Y., Larson D.F. [1992]: On the transmission of world agricultural prices. World Bank Economic Review,
6, 399-422. Quiroz J.A., Soto R. [1996]: International Price signals in agricultural markets: do governments care? Unpublished
mimeo, GERENS and ILADES/Georgetown University. Rembeza J. [2010]: Transmisja cen w gospodarce polskiej, Wydawnictwo Uczelnianie PK, Koszalin. Saadi H. [2011]: Price Co-movements in International Markets and Their Impacts on Price Dynamics [in:] Piot-
Lepetit, I. and M’Barek, R., Methods to Analyse Agricultural Commodity Price Volatility. Berlin: Springer Verlag, p. 149-164.
Sharma R. [2002]: The transmission of world price signals: concepts, issues and some evidence from Asian cereal markets. Paper submitted to the OECD Global Forum on Agriculture, OECD CCNM/GF/AGR(2002)10.
Tomek W.G., Robinson K.L. [2001]: Kreowanie cen artyku ów rolnych, PWN, Warszawa. Tsay R.S. [2010]: Analysis of Financial Time Series. John Wiley & Sons, New Jersey. Von Cramon-Taubadel S., Meyer J. [2001]: Asymmetric Price Transmission: Fact or Artefact? Paper for the 71th
EAAE Seminar: The food consumer in the early 21st century, in Zaragoza, Spain, 19-20 April 2001.

45
Sebastian Jarz bowski1
Department of Economics and Organisation of Enterprises Warsaw University of Life Sciences – SGGW
Efficiency of meat processing enterprises in terms of supply chain organization2
Abstract. Within the framework of the paper, the supply chain participants of meat products were identified and analyzed in terms of the structure. The assessment of the efficiency of meat processing enterprises, which play the role of the chain’s integrator, was carried out using the SFA method (Sto-chastic Frontier Approach). The supply chain integration degree, showing the strength of relationships of individual enterprises with business partners, was identified. The results obtained show high corre-lation between the integration degree and the efficiency level.
Key words: supply chain, meat products, efficiency
Introduction
The aim of the article was, in the first step, to identify the meat supply chain links and to analyze them in terms of the structure. Secondly, the efficiency assessment of the meat processing enterprises, which play the role of the chain’s integrator, was carried out using the SFA method (Stochastic Frontier Approach) and the integration degree within the chain was determined. The integration degree reflects the strength of relationship with trading partners. The supply chain with respect to food products can be defined as "cooperation in different functional areas of agricultural producers, intermediary companies (trade), pro-cessing companies, manufacturing, services and their customers, between which flow streams of agri-food products, information, and funds" [Jarz bowski and Klepacki 2013]
The assumptions about the exchange of goods, resulting from the division of labor and specialization were the basis of the analysis conducted within the framework of the paper. As these processes take place on the market (a place where demand meets supply), the analysis of the theoretical base should concern market equilibrium theory, which is a core of the classical theory of economy. During the discussion on the theory, questions regard-ing the adopted assumptions arose. In theory, it is assumed that consumers have full infor-mation on purchased goods, prices and technologies, which essentially precludes the exist-ence of information asymmetry. The prevailing belief is that all actors perfectly fit good quantities, without bearing any transactional costs, the existence of which was presented by R.H. Coase and O.E. Williamson [Coase 1937, 1960; Williamson 1990].
Since the assumptions of market equilibrium theory are not satisfied in economic reali-ty, the functional weaknesses of the market may appear, first of all, as an information asymmetry. The existence of the information asymmetry has been confirmed among others in the theory of market processes (representatives of the Austrian School pointed out the
1 PhD, e-mail: [email protected] 2 Research granted by National Science Centre from the funds for science in years 2011-2013 as a scientific pro-ject no 2011/01/B/HS4/02612 „Stopie integracji w a cuchu dostaw a efektywno przedsi biorstw przetwórstwa rolno-spo ywczego” ("Degree of integration in supply chain and efficiency of food processing enterprises").

46
unequal distribution of knowledge in society), in the theory of economic development, in which the possibilities to benefit from the advantages of knowledge were highlighted, and in principal - agent theory, which focuses on the problem of entering into agreements under asymmetric information [por. Noga 2009]. Secondly, the existence of transactional costs are classified as market weaknesses, established in the theory by R.H. Coase and O.E. Wil-liamson, who claim that transactional costs affect the evaluation and selection of organiza-tional solutions (integration forms). Moreover, another weakness of the market is the exist-ence of property rights, whose allocation influences the economic system, and their distri-bution and specification (due to external effects) are associated with increasing transaction-al costs. Also, the existence of increasing returns to scale is a weakness affecting the possi-bility of not reaching competitive equilibrium, as it results from the law of large numbers. Based on the literature review, practices that are used in order to counteract the functional weaknesses on the market include, among others: creating relationships with external part-ners, cooperating with subcontracting third parties, several integration forms, cooperation, collaboration and organization, long-term agreements or creating symbiotic partnerships. These various forms of cooperation occur within the supply chains.
The structure of the meat processing supply chain
In order to indicate the place of meat processing enterprises in the supply chain an analysis of the chain’s structure has been carried out. The meat market is one of the largest segments of the food market. Its value (in basic prices at the manufacturer’s level) is esti-mated at about 38 billion zlotys, which is equal to ¼ of the whole food market [Dro d2009]. Both red and white meat production and manufacturing is characterized by fragmen-tation of resource base and the processing [Dro d 2009]. The Polish meat sector is charac-terized by low concentration. The following factors determined the meat industry fragmen-tation [Rycombel 2004]:
low concentration of pork and beef supply being a result of fragmented agricultur-al structure, an increase in number of enterprises in the meat industry, particularly in the area of slaughter, characterizing by low technical condition and sanitary standards, an increasing role of companies intermediating in livestock procurement.
The structure of the meat supply chain includes farmers (suppliers of livestock), pur-chase and sales, the food processing industry producing meat products, wholesale traders (sale of processed meat to other companies), retail (retail networks, traditional trade) providing meat product for final customers (Figure 1).

47
Fig. 1. The stru
Source: own w
In the processing,
Primary pro
In 2010zlotys. Pouland 2797 mmarginal sig
Fig. 2. Dynami
Source: own w
0,60
0,70
0,80
0,90
1,00
1,10
1,20
ucture of the supp
work.
next part of tdistribution) w
oduction
0 the largest sltry and cattle
mln zlotys (16gnificance [GU
ics of pork produc
work based on [Ma
0
0
0
0
0
0
0
2006
ply chain of meat
the paper, thewere presented
share in purche took the nex6,4%). PurchaUS 2012].
ction in thousand
a kowski et al. 20
2007
Poland
products
e individual sd for pork and
hase value (45xt positions wase of calves,
ds tonnes of carca
012] and [Ma kow
2008
Germany
stages of the d beef.
,4%) was obswith values of
horses and s
ass weight (year 2
wski et al. 2010].
2009
France
supply chain
served for pigsf 6246 mln zlosheep (togethe
2006 = 100)
2010 2
UE-25/27
(production,
s – 7732 mln otys (36,7%) er 1,4%) had
2011

48
The dynamics of production of pork and beef in EU-27, including Poland, Germany3
and France4 was presented in Figures 2 and 3. The decrease in production was caused by a decline in stock in recent years [Ma kowski et al. 2012]. High grain and feed prices were the reason for the decrease in pig population.
In Poland, there has been a stagnation in both population and beef production since a few years. This situation was caused by low domestic demand conditioned by a low-income population, and consequently, poor quality of the offer. The stagnation in beef production was a result of the fact that it is basically a by-product of milk production (which is a lead-ing production) [Ma kowski et al. 2012].
Fig. 3. Dynamics of beef production in thousands tonnes of carcass weight (year 2006 = 100)
Source: own work based on [Ma kowski et al. 2012] and [Ma kowski et al. 2010].
The purchase of both pork and beef livestock by the processing enterprises is equal to about 80% of production, self-supply in case of pork and beef amounts to respectively 14,5% and 5,5% [GUS 2012].
Processing
In 2009 there were around 3,6 thousand companies (including micro companies) oper-ating in the meat industry (including poultry industry). About 1,1 thousand companies are authorized to trade within the EU market, while others operate only on local and regional markets [Dro d 2009].
Despite the decrease in farm production levels, there was an increase in the turnover of companies of the meat industry. In 2011 the total revenues of companies reporting financial statements and employing over 9 persons amounted to 32986 mln zlotys and were 5% higher (in current prices) than in the previous year (Figure 4). The source of the increased turnover was not only an increase in sales prices but also an increased processing of im-ported pork (12,5%) and fast growing trade in foreign goods [Ma kowski et al. 2012]. The improvement of results and financial situation of the meat companies allowed them to in-
3 European leader in pork production. 4 European leader in beef production.
0,920,940,960,981,001,021,041,061,081,10
2006 2007 2008 2009 2010 2011
Poland Germany France UE-25/27

49
crease their investment activity. Nevertheless, the technological level of the meat industry is diverse. The production capacity of the industry is used, on average, 50-70% [Rycombel 2004].
The Polish meat industry is highly diverse. The companies range from small local en-terprises to large companies, which are part of national or international groups. With strong market fragmentation there is also a lack of sufficient specialization and capacity of some plants. Competition is accompanied by low margins and low profitability, in comparison with the entire food sector [Górnicka 2005]. However, the economic and financial state of the sector generally does not pose a threat for the existence of most meat processing com-panies.
Fig. 4. Total revenues and expenditures in the meat industry (million z )
Source: own work based on [Ma kowski et al. 2012] and [Ma kowski et al. 2010].
On the other hand, the expected further decline in the supply of pig livestock and in-creasing commodity prices may temporarily worsen the financial results of companies [Ma kowski et al. 2012].
Distribution
Wholesale trade is a link in the supply chain impending food producers to retailers and consumers. Table 1 shows the characteristics of wholesale companies of food products (including meat products) due to the scale of activity.
Table 1. Changes in the structure of revolutions in wholesale trade enterprises by. employment size
Number of Employees 2002 2005 2007
1 5,7 5,6 5,2
2 - 9 28,1 23,9 21,7
10 - 19 9,2 11,5 7,6
20 - 49 19,7 15,9 14,7
50 - 249 25,4 27,3 31,2
250 and more 11,9 15,7 19,6
Source: Own work based on Annual detailed enterprise statistics on trade, Eurostat.
32986
804
500
600
700
800
900
1000
1100
1200
15000
20000
25000
30000
35000
2006 2007 2008 2009 2010 2011
Inve
stm
ents
Tota
l rev
enue
total revenue investments

50
The presented information shows that there was an increase in importance of the turn-over of large and medium enterprises (employing more than 50 persons). In 2007, their share in turnover approached 50%. However, the fact is that wholesale trade in Poland is fragmented.
Retail trade is the last link in the food chain, which is responsible for supplying the fi-nal consumer. Analyzing the institutional forms of retailing, it should be highlighted: de-partment stores, trading houses, supermarkets and hypermarkets. Table 2 shows changes in the structure of retail trade in Poland.
Table 2. Changes in the structure of retail trade in Poland by organizational forms
The structure of retail trade – Number of stores Specification 2000 2005 2006 2007 2008
Total 431991 385990 395458 371364 385663
Department stores 135 95 91 76 63
Trading houses 500 462 431 372 312
Supermarkets 1602 2716 3003 3506 3629
Hypermarkets 99 374 410 396 463
Petrol stations 7744 10086 10159 9831 10073
Source: Own work based on Rynek wewn trzny w 2008 r., Informacje i Opracowania Statystyczne, GUS, War-szawa 2008 .
Analysis of the structure and understanding of the competitive behavior of retail re-quires attention to the development of supermarkets (sales area from 400 to 2500 m2) and hypermarkets (sales area is over 2500 m2). Their number is increasing significantly in the last years.
Evaluation of efficiency of the meat processing companies
The study included companies engaged in meat processing. The analyzed period covered 2006-2011. The sample included 195 to 210 companies, depending on the analyzed years. In order to evaluate the efficiency of the companies, the SFA method (Stochastic Frontier Ap-proach) was applied, the variables used to construct the model include on the side of inputs: fixed assets (x1) and operational costs (x2), and on the side of outputs: sales revenues (y)expressed in zlotys.
The model specification – SFA
Using the SFA method, the a priori identification of a functional form determining the relationship between input(s) and output, is required [Coelli et al. 2005]. In the literature on the efficiency determined based on production function it may be observed that the Cobb-Douglas function is one of the most widely used functional forms in empirical research. As it is shown by J. Piesse and C. Thirtle, the adequacy of the Cobb-Douglas model is tested with respect to a less restrictive form – the translog form [Piesse and Thirtle 2000, pp. 474]. To evaluate efficiency in the meat processing industry within the period 2006-2011, the SFA method was applied based on functions well-established in theory and practice: Cobb-

51
Douglas and translog. The Cobb-Douglas function was presented in equation (1), and the translog function in equation (2) [Coelli et al. 2005]:
01
ln lnk
i j ij i ij
y x v u (1)
and
01 1 1
1ln ln ln ln2
k k k
i j ij jl ij il i ij j l
y x x x v u (2)
where: i – index indicating the next object i=1,…,I, where I is the number of objects in the sample, j – index indicating the next input j=1,…,l,k – number of inputs, yi – effect of an object i,xij – input j in an object i,
– parameters to be estimated, vi – random variable representing the random component, ui – positive random component associated with inefficiency (TE).
The comparison of the functional form was made based on the likelihood ratio statis-tics test (LR), which takes the following form
(3)
where: – logarithm of the maximum likelihood value of the model with restrictions,
– logarithm of the maximum likelihood value of the model without restrictions. Based on the results of hypothesis verification concerning the choice of the functional
form, it was stated that the proper form describing relations between the adopted inputs and outputs is the Cobb-Douglas model in each of the sectors in all the analyzed periods (at the significance level of less than 0,1). The efficiency was assessed on the basis of the quotient of the observed output (y; equation 1) and the maximum output to be achieved character-ized by exp(vi), denoted by y* (this value assumes no inefficiency - ui=0), thus the efficien-cy ratio may be written as [Coelli et al. 2005]:
01
*
01
exp( ln )exp( )
exp( ln )
k
j ij i iji
i iki
j ij ij
x v uyTE uy x v
(4)
ˆ ˆ2[ln ( ) ln ( )]R NLR L L
ˆln ( )RLˆln ( )NL

52
Table 3. Hypothesis verification for the selection of model's functional form M
eatt
proc
essi
ng
year LR result(1) model
2006 -324,69 -322,25 4,88** No reason for rejecting H0 Cobb-Douglas
2007 -346,47 -344,33 4,28** No reason for rejecting H0 Cobb-Douglas
2008 -329,28 -326,27 6,00** No reason for rejecting H0 Cobb-Douglas
2009 -346,17 -341,15 10,04* No reason for rejecting H0 Cobb-Douglas
2010 -348,03 -342,38 11,30* No reason for rejecting H0 Cobb-Douglas
2011 -327,77 -322,37 10,80* No reason for rejecting H0 Cobb-Douglas (1) The value of 2 distribution for 35 degrees of freedom and at the significance level of 0,05 (**) was equal to 7,82; at the significance level of 0,1 (*) was equal to 11,34. If LR*< 2(3), there is no reason for rejecting H0.
Source: Own calculation, see also [Jarz bowski 2013a].
The efficiency frontier was determined on the basis of the estimation (using the maxi-mum likelihood method6) of parameters of production function adopted in the SFA method, i.e. the Cobb-Douglas function.
Efficiency of enterprises and integration within the supply chain
The integration with environment (external organizations) of the system is highlighted (a company is understood as the system). Cooperation is here the main element of the or-ganizational integration of a company with environment [Steffen & Born 1987, pp. 210]. The need for integration between an enterprise and its environment increases with the de-gree of intensification of global competition. In this context, the concept of integration, considered as a key factor in achieving better results by an enterprise, is one of the most important topics in the scientific literature. N. Fabbe-Costes and M. Jahre, in their literature review, argue that authors generally agree that stronger relationships and higher degrees of integration lead to better business performance [Fabbe-Costes and Jahre 2008]. The effi-ciency ratios obtained by using the SFA method are presented for empirical illustration for all size groups (Table 4).
On the basis of the results presented in Table 4 one can state that in the analyzed sector in each year the average efficiency ratio increases together with an increase of a company’s size7. The micro enterprises achieved the efficiency ratio ranging from 0,24 to 0,33; the average ratio for small enterprises ranged from 0,34 to 0,42; the efficiency ratio for medium
5 The number of the degrees of freedom is equal to the difference in the number of parameters in the model with-out restrictions (here the translog model) and in the model with restrictions (here the Cobb-Douglas model). 6 The least squares method and its derivates are the other methods for estimation of the parameters of the produc-tion function while determining the efficiency frontier [Coelli et al. 2005]. 7 Due to the fact that the relative efficiency is determined using the SFA method, there is no possibility of comparing the results achieved in the different models. Within the framework of the SFA method, one of the approaches to assess efficiency between years is the creation of a dynamic model for balanced panel data, see. Bezat A. (2011) Estimation of technical efficiency by application of the SFA method for panel data, Scientific Journal Warsaw University of Life Sciences – SGGW, Problems of World Agriculture 2011, Vol. 11, No. 3, pp. 5-13.
ˆln ( )RL ˆln ( )NL

53
enterprises took values from the range 0,40-0,5; in the case of the large enterprises the lowest ratio was equal to 0,48 and the highest – 0,59.
Table 4. Average efficiency ratio calculated by using the SFA method in size groups of enterprises in period 2006-2011
Year/company’s size 2006 2007 2008 2009 2010 2011
micro 0,239 0,326 0,266 0,271 0,300 0,307
small 0,378 0,423 0,344 0,362 0,378 0,397
medium 0,493 0,483 0,404 0,494 0,499 0,488
large 0,507 0,483 0,480 0,559 0,564 0,592
Source: Own work.
In the literature, there are studies in which the statement that integration in both direc-tions (upstream and downstream) is more preferable than the integration only with custom-ers or only with suppliers is highlighted. [Frohlich & Westbrook 2001; Rosenzweig et al. 2003]. In order to determine the integration degree in the supply chain reflecting the strength of relations between trading partners, the SCIDM ratio of integration level was applied (Supply Chain Integration’s Degree Measure) that includes integration with both suppliers and customers8.
Table 5. Integration’s degree ratio SCIDM in size groups of enterprises within period 2006-2011
Year/company’s size 2006 2007 2008 2009 2010 2011
micro 53,2 60,2 59,0 66,3 64,1 63,5 small 82,4 86,0 80,6 85,7 82,0 84,5
medium 105,8 88,9 92,0 110,5 97,8 90,0 large 115,3 101,0 88,1 95,7 104,4 110,8
Source: Own calculation.
Based on the ratio it may be noticed that the average SCIDM ratio increases together with the increase of the company size in each of the analyzed years, i.e. 2006-2011. The Pearson correlation coefficients were determined between the integration degree and the efficiency level. The coefficients ranged from 0,73 in 2008 to 0,79 in 2009. High correla-tion between two analyzed variables shows that integration (through creation of various form of cooperation) with its environment - so other participant (stages) of meat supply chain, presented in this paper, can lead to better efficiency of meat processing companies.
8 Due to the size limitations of the paper, the synthetic results were presented. The detailed description of the SCIDM ratio may be find in Jarz bowski S. (2013): Integracja a cucha dostaw jako element kszta towania efek-tywno ci sektora przetwórstwa rolno-spo ywczego, Wydawnictwo SGGW, Warsaw.

54
Summary and conclusions
The basis of the undertaken analyses were the assumptions about the exchange of goods resulting from the division of labor and specialization. Since these processes take place on the market (a place where demand meets supply), the analysis of the theoretical base should concern the market equilibrium theory, which is a core of the classical theory of economy. Since the assumptions of the market equilibrium theory are not satisfied in economic reality, the functional weaknesses of the market may appear, e.g. information asymmetry, transactional costs, the existence of property rights and increasing returns to scale. Practices that are used in order to counteract the functional weaknesses on the market include among others: creating relationships with external partners, cooperating with sub-contracting third parties, different integration forms, cooperation, collaboration, organiza-tion, long-term agreements or creating symbiotic partnerships. These various forms of co-operation occur within the supply chains. In the paper, the links of the supply chain were identified and analyzed in terms of the structure to indicate the place of analyzed companies in the chain.
In the analytical part of the article, the efficiency of the companies has been assessed by using the SFA method (Stochastic Frontier Approach) and the integration degree in the supply chain has been determined, showing the strength of relations between trading part-ners. On the basis of the conducted analysis, it was stated that the largest enterprises are characterized by the highest integration degree, these enterprises are also the most efficient ones. This means that mainly large enterprises of the meat processing industry undertake actions aimed at creating relations with external partners, in order to counteract the func-tional markets weaknesses and to achieve the highest level of efficiency.
References
Arrow K.J. [1969]: The Organization of Economic Activity: Issues Pertinent to the Choice of Market versus Nonmarket Allocation, [w:] Joint Economic Committee (red.): The Analysis and Evaluation of Public Ex-penditures, The PBB-System, Washington, p. 47-63.
Bezat A. [2011]: Estimation of technical efficiency by application of the SFA method for panel data, Scientific Journal Warsaw University of Life Sciences – SGGW, Problems of World Agriculture 2011, Vol. 11, No. 3, p. 5-13.
Coase R.H. [1937]: The Nature of the Firm, Economica New Series, 4, p. 386-405. Coase R.H. [1960]: The Problem of Social Cost, Journal of Law and Economics, 3, p. 1-44. Coelli T.J., Rao D.S.P., O`Donnell Ch.J., Battese G.E. (2005) An introduction to efficiency and productivity
analysis, 2. Edition, Springer, New York. Dro d J. [2009]: Liderzy przetwórstwa produktów zwierz cych, Warszawa. Fabbe-Costes N., Jahre M. [2008]: Supply Chain Integration Improves Performance. A review of the Evidence.
The International Journal of Logistics Management, 19:2, p. 130-154. Frohlich M.T., Westbrook R. [2001]: Arcs of integration: an international study of supply chain strategies. Journal
of Operations Management, 19:2, p. 185-200. Górnicka A. [2005]: Tradycyjnie a nowocze nie, Cool Biznes, nr 6. GUS [2012]: Niepublikowane dane naliczane na podstawie kwartalnego sprawozdania statystycznego F-01/I-01,
sporz dzonego przez podmioty gospodarcze prowadz ce ksi gi rachunkowe, w których liczba pracuj cychwynosi 10 i wi cej. Przedsi biorstwa z grupy PKD 14.27, Warszawa.
Jarz bowski S. [2013]: Integracja a cucha dostaw jako element kszta towania efektywno ci sektora przetwórstwa rolno-spo ywczego, Wydawnictwo SGGW, Warszawa.
Jarz bowski S. [2013a]:Wp yw integracji w a cuchu dostaw na efektywno sektora przetwórstwa rolno-spo ywczego, Zagadnienia ekonomiki rolnej, nr 3, Warszawa.

Jarz bowski S., Klepacki B. [2013]: a cuchy dostaw w gospodarce ywno ciowej, Zeszyty Naukowe SGGW Ekonomika i Organizacja Gospodarki ywno ciowej, 103, p. 107 – 117.
Ma kowski J., Kossakowska J., Rycombel D., wietlik K., Urban R., Zawadzka D., Mieszkowska L. [2012]: Rynek mi sa. Stan i perspektywy, Wyd. IERiG -PIB, Warszawa.
Ma kowski J., Kossakowska J., Rycombel D., wietlik K., Urban R., Zawadzka D., Mieszkowska L. [2010]: Rynek mi sa. Stan i perspektywy, Wyd. IERiG -PIB, Warszawa.
Noga A. [2009]: Teorie przedsi biorstw. [Enterprises' theories], Polskie Wydawnictwo Ekonomiczne, Warszawa. Piesse J., Thirtle C. [2000]: A Stochastic Frontier Approach to Firm Level Efficiency, Technological Change and
Productivity during the Early Transition in Hungary, Journal of Comparative Economics, Vol. 28, No. 3, p. 473-501.
Rosenzweig E.D., Roth A.V, Dean J.W. Jr [2003]: The influence of an integration strategy on competitive capabil-ities and business performance: an exploratory study of consumer products manufacturers, Journal of Opera-tions Management, Vol. 21 No. 3, p. 437-56.
Rycombel D. [2004]: Przemys mi sny – mi so czerwone, Wyd. IERiG -PIB, Warszawa. Steffen G., Born D. [1987]: Betriebs- und Unternehmensführung in der Landwirtschaft [Farms and enterprises
management in agriculture], UTB für Wissenschaft, Stuttgart. Williamson O.E. [1990] (Ed.): Organization theory: From Chester Barnard to present and beyond, Oxford Press
University, New York.

56
El bieta Kacperska1
Department of Agricultural Economics and International Economic Relations Warsaw University of Life Sciences – SGGW
The influence of international trade with Germany, the agro-food trade in particular, on the Polish GDP size
Abstract. The influence of international trade on the growth of GDP has undergone some changes over time. The paper presents national trade between Poland and Germany with special emphasis on the agro food trade. The paper includes the estimation of the effects of Polish income obtained through trade with Germany, including the agro-food trade.
Key words: agro-food products, Polish international trade, multiplier effect, Germany
Introduction
The relationship between foreign trade and economic development is the subject of research of many economists. The subject was analyzed in detail by J. Viner [Misala 2005] later, it was criticized by the classics, among others Adam Smith and David Ricardo. Adam Smith believed that foreign trade plays an important role as a factor in opening up new markets for production surplus in the country and thus contribute to the growth and development of the national economy [Smith 2012]. D. Ricardo emphasized the possibility of increasing the income of the country by improving the terms of trade [Kamecki, So daczuk & Sierpi ski 1971]. Neoclassicals, including A. Marshall similarly presented the role of trade in economic development. J. M. Keynes presented a new perspective on the impact of foreign trade on changes in national income and employment. He pointed out that the foreign trade multiplier effects start affecting national income. J. M. Keynes and his followers argued that a positive trade balance can work toward economic recovery in the country and the negative trade balance can contribute to the deepening economic depression [Keynes 1931; Kamecki, So daczuk & Sierpi ski 1971].
In the postwar period, R. F. Harrod took up the issue of long-term economic development and its relation to international trade [Kamecki, So daczuk & Sierpi ski1971].
The current trends of research both criticize, as well as develop earlier theories, as well as recognize and explore new phenomena and relationships occurring between international trade, the domestic economy and the global economy.
For many years Germany has been the main trading partner with Poland. The importance of the German economy is evident from the Polish marketization. In the 1980s and 1990’s, relationships were strengthening in the exchange of goods, including agricultural and food products. Polish integration with the European Union in 2004 led to the opening of markets and standardization of methods of mutual exchange. Since 2003 the mutual trade was characterized by a increased tendency for Germany's share in Polish international trade, which accounted for over a quarter of all sales, both in exports and
1 PhD, e-mail: [email protected]

57
imports. The German economy in the years 2004-2012 remained the most important recipient of agro-food products and their exchange was beneficial for Poland. Therefore it is important to know the impact of international trade with Germany on the size of Polish GDP.
Research methodology
The aim of the study was to present the volume of trade between Poland and Germany with particular emphasis on agro-food trade and to estimate the effects of income derived from the Polish-German trade, including the agro-food trade, taking into account the multiplier response from the demand side. The analysis covered the years 2004-2012 and was related to the impact of exports and imports on the size of GDP.
In the analysis indicators of the impact of exports and imports to national income were used, ie: the rate of export, import rate, the marginal rate of export, the marginal rate of import, income elasticity of exports, the income elasticity of imports, international trade multiplier.
The rates of exports and imports indicate the importance of foreign trade in the country. Export rate shows the percentage share of exports in national income at a given time. It is written using the following formula:
100i
ie Y
Exs (1)
where: se – the rate of export, Exi – global export value of the country i,Yi – the national income of the country i.
The rate of import shows the percentage share of imports in national income at a given time. It is written using the following formula:
100Im
i
iim Y
s (2)
where: sim – the rate of import, Imi – global value of import of the country i,Yi – the national income of the country i.
Further indicators in the analysis are the marginal rates of export and import. They depend on the structures of production and level of living. High marginal rate of export will attest to the fact that the country's economic growth is largely based on export expansion, while high marginal rate of import indicates a high absorption capacity of the economy associated with an increase of GDP. Marginal rate of export determines the growth of export with the individual’s national income and it takes the form:

58
skex = i
i
YEx (3)
where: skex – marginal rate of export,
Exi – the country's i export growth i,Yi – increase of the national income of the country i.
Marginal rate of import defines the change in import of a particular country with an increase in the national income of the individual. This indicator takes the form:
skim = i
i
YIm (4)
where: skim – marginal rate of import,
Imi – increase in import of the country i,Yi – increase the national income of the country i.
Indicators of income elasticity of export and import determine the impact of export and import on economic growth. Ratio of export income elasticity informs about relative changes of export in relation to the relative changes of national income, it takes the form:
i
i
i
ieex Y
YExEx
d (5)
where: eexd – income elasticity of export,
other symbols as above. Ratio of import’s income elasticity indicates the relative changes in import in relation
to relative changes in national income, it takes the form:
i
i
i
ieim Y
Yd
ImIm (6)
where: eimd – income elasticity of import,
other symbols as above. If the coefficients of income elasticity of export or import take the values above unity,
it means that the export/import is a key factor of economic growth in the country and its share in the national income grows. These values can be smaller than unity and the export/import inhibit the economy and their share in national income reduces [Misala 2005]. Another instrument used in the study is the international trade multiplier. Multiplier (investment, export) is a factor determining the increase in national income due to

59
economic growth (increase in investment, exports) [Bo yk 2008]. This concept was introduced by R. F. Kahna and developed by J. M. Keynes [Keynes 1956]. The multiplier is only present in a market economy, in which there are production reserves and it is activated by certain impulses of economic growth (increase in investment, export growth) which create additional demand [Bo yk 2008]. It takes the form:
YYS
kIm
10
(7)
where: ko – the multiplier in an open economy,
S/ Y – marginal propensity to save (accumulate), Im/ Y – marginal propensity to import.
It can be concluded that the foreign trade multiplier is the inverse of the marginal propensity to save plus the marginal propensity to import . The growth of national income induced by multiplier reaction is determined by the following formula [Guzek 2004]:
og kExY (8)
where: gY – increase of the national income generated by the growth of export from the
multiplier reaction, Ex – increase export.
The growth in export is treated as equivalent to the so-called, autonomous investments and the degree of its impact on national income depends on the impact of the marginal propensity to import on the multiplier level. The greater inclination the lower multiplier, which means lower impact of export growth on national income [Guzek 2004]. Form of multiplier for the practical analysis in an open economy must be verified due to the fact that it is not subject to decomposition, i.e. that the effect calculated for the international trade of the particular country is not the total sum of income effects calculated separately for each of its partners [Guzek 2004]:
n
iiio wkk
1
(9)
where: ko – overall multiplier of international trade of the particular country, i- 1,2…n – number of the country-partner; ki – individual international trade multiplier of the tested country with the country i,wi – weight in the form of participation of the country in the overall increase of export in a tested country to all partners.
Individual multiplier takes the form:
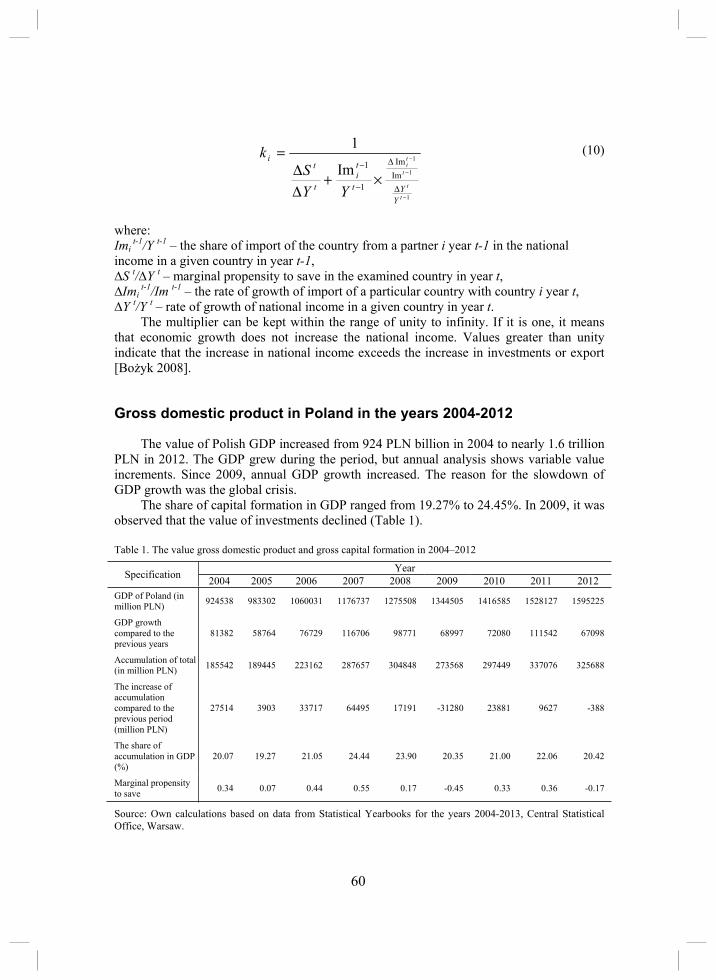
60
1
1
1
ImIm
1
1Im
1
t
t
t
ti
YYt
ti
t
ti
YYS
k (10)
where: Imi
t-1/Y t-1 – the share of import of the country from a partner i year t-1 in the national income in a given country in year t-1,
S t/ Y t – marginal propensity to save in the examined country in year t,Imi
t-1/Im t-1 – the rate of growth of import of a particular country with country i year t,Y t/Y t – rate of growth of national income in a given country in year t.
The multiplier can be kept within the range of unity to infinity. If it is one, it means that economic growth does not increase the national income. Values greater than unity indicate that the increase in national income exceeds the increase in investments or export [Bo yk 2008].
Gross domestic product in Poland in the years 2004-2012
The value of Polish GDP increased from 924 PLN billion in 2004 to nearly 1.6 trillion PLN in 2012. The GDP grew during the period, but annual analysis shows variable value increments. Since 2009, annual GDP growth increased. The reason for the slowdown of GDP growth was the global crisis.
The share of capital formation in GDP ranged from 19.27% to 24.45%. In 2009, it was observed that the value of investments declined (Table 1).
Table 1. The value gross domestic product and gross capital formation in 2004–2012
Specification Year 2004 2005 2006 2007 2008 2009 2010 2011 2012
GDP of Poland (in million PLN) 924538 983302 1060031 1176737 1275508 1344505 1416585 1528127 1595225
GDP growth compared to the previous years
81382 58764 76729 116706 98771 68997 72080 111542 67098
Accumulation of total (in million PLN) 185542 189445 223162 287657 304848 273568 297449 337076 325688
The increase of accumulation compared to the previous period (million PLN)
27514 3903 33717 64495 17191 -31280 23881 9627 -388
The share of accumulation in GDP (%)
20.07 19.27 21.05 24.44 23.90 20.35 21.00 22.06 20.42
Marginal propensity to save 0.34 0.07 0.44 0.55 0.17 -0.45 0.33 0.36 -0.17
Source: Own calculations based on data from Statistical Yearbooks for the years 2004-2013, Central Statistical Office, Warsaw.

61
Polish International trade in the period 2004-2012
Polish foreign trade in the period 2004-2012 showed increasing trends in export and import. Export in the analyzed period doubled, reaching a value of 744.7 billion PLN in 2012; the account balance was negative except for 2009 and 2012. Increase in export analyzed year on year showed high variability, especially the decrease in growth occurred in 2008 and 2009, which was a result of the global financial crisis. Between 2010 and 2011 export definitely improved in increments of 90 billion PLN in 2011, but in 2012, the growing trend weakened rapidly.
A similar tendency was observed in import. In 2009 there was a decline in the value of import, but in subsequent years, there was a rapid growth (Table 2). Indicators of export and import’s rate were quite high and ranged at 37-45%.
Marginal rate of export has shown considerable volatility during the period. However, its value was greatly improved in the years 2010-2011 (Table 2).
Table 2. Polish international trade and main indicators of international trade in 2004-2012
Specification Year
2004 2005 2006 2007 2008 2009 2010 2011 2012
Export (in million PLN) 346631 364658 427776 479606 508887 530278 598369 688738 744748
Import (in milion PLN) 368365 371946 446927 513425 559521 529269 615470 706326 739947
Increase of export (in million PLN) 65743 18027 63118 51830 29281 21391 68091 90369 56010
Increase of import (in million PLN) 64790 3581 74981 66498 46096 -30252 86201 90856 33621
Export range 37.49 37.09 40.36 40.76 39.90 39.44 42.24 45.07 46.69
Import range 39.84 37.83 42.16 43.63 43.87 39.37 43.45 46.22 46.39
Marginal export range 0.81 0.31 0.82 0.44 0.30 0.31 0.94 0.81 0.83
Marginal import range 0.80 0.06 0.98 0.57 0.47 -0.44 1.20 0.81 0.50
Source: as in Table 1.
Marginal propensity to save in Poland and to import from Germany
Polish-German trade relations from the beginning of the transition are characterized by a positive trend. This trend was observed until 2009, in that period the financial and economic crisis has weakened the mutual trade. After a period of weakening of the exchange from 2010 a growing trend returned.
Polish trade with Germany in the years 2004-2012 showed a negative balance of deepening trend. The value of import in 2004 amounted to 79.3 billion PLN and increased to 138.2 billion PLN in 2012, particularly large increases in imports was observed in 2010 and 2011, in 2012 there was a decline in the value of import (Table 3).

62
In the analyzed period, the marginal propensity to save in Poland significantly changed. In the years 2006–2007 it was relatively high, both in relative terms and absolute terms. The negative impact on the growth of savings was the economic crisis in 2009 (Table 1). Years 2008 to 2009 were characterized by a slowdown of the Polish economy, despite its further development. During this period, most of the indicators declined.
Polish marginal propensity to import from Germany in the period was rather low. This indicator was characterized by high volatility; in 2012, it was negative (Table 3).
Table 3. The value of import from Germany and its main indicators in 2005-2012
Specification Year
2005 2006 2007 2008 2009 2010 2011 2012
Import from Germany (in million PLN)
80994.3 94645.7 109873.9 114166.3 103672.5 117305.9 139088.6 138180.0
Import growth (in million PLN)
1602.7 13651.4 15228.2 4292.4 -10493.8 13633.4 21782.7 -908.6
Poland’s marginal propensity to import from Germany
0.03 0.18 0.13 0.04 -0.15 0.19 0.20 -0.01
Source: as in Table 1.
Polish income effects generated by trade with Germany
Polish exports to Germany in the analyzed period increased from 81.7 billion PLN in 2004 to 151.7 billion PLN in 2012. In the analyzed period there was a slowdown in export in 2005 and 2008. In the analyzed period, the international trade multiplier clearly deteriorated. In 2005, it amounted to 7.85 % and was the highest in the period. In later years, it hesitated in the range of 0.65 - 1.56%; in 2009 it was the lowest. In 2012, the Polish international trade multiplier reached a value of 3.02 and was the best since 2005. Low multiplier values point to a slow growth of national income but if the upward trend continues, an increase in national income will generate (Table 4).
Table 4. The value Polish of export to Germany and its main indicators in 2005-2012
Specification Year
2005 2006 2007 2008 2009 2010 2011 2012
Export to Germany (in million PLN) 81449.4 93337.8 100120.0 101520.0 110679.9 125550.6 145764.2 151747.7
Export growth (in million PLN) -324.2 11888.3 6782.2 1400.0 9159.9 14870.7 20213.6 5983.6
International trade multiplier 7.85 0.71 0.89 1.56 -1.12 0.65 0.85 3.02
Poland’s income effect arising from trade with Germany (in million PLN)
-2545.4 8391.9 6042.5 2184.9 -10271.2 9737.1 17279.4 18058.0
Source: as in Table 1.

63
The combined effect of income on account of Polish trade with Germany for the period 2005-2012 amounted to 49.6 billion PLN. This amount is very low, taking intoaccount the value of total export of 991.9 billion PLN and import 977.3 billion PLN for thisperiod. Years 2010-2012 showed an increase in the multiplier effects (Table 4).
Indicators of income elasticity of total export to Germany showed a high variability in the considered period. Only the years 2010-2012 show a positive impact of export on GDP. Indicator of income elasticity of export to Germany in the years 2005-2008 and 2012 was significantly lower than the total index. In 2009-2011 the rate was higher, which means trade with Germany generates additional revenue. Indicators of income elasticity of import to Germany showed similar trends (Table 5).
Table 5. The index of income elasticity of export and import in general and to Germany together with export multiplier to Germany in 2005-2012
Specification Year
2005 2006 2007 2008 2009 2010 2011 2012
Income elasticity of export 0.83 2.04 1.09 0.74 0.79 2.24 1.80 1.79
Income elasticity of import 0.16 2.32 1.31 1.06 -1.11 2.75 1.76 1.08
Income elasticity of export to Germany -0.07 1.76 0.68 0.18 1.61 2.33 1.90 0.94
Income elasticity of import to Germany 0.33 1.99 1.40 0.49 -1.97 2.28 2.15 -0.16
Multiplier export to Germany -3460 19257 9928 6436 -15129 28573 36715 -32650
Source: as in Table 1.
Trade in agro-food products between Poland and Germany in the years 2004-2012
The most important recipient of Polish agro-food products is Germany. In 2012, about 22% of Polish agro-food export products was sold on this market. In the analyzed period, the mutual exchange of agro-food products between Poland and Germany proceeded successfully and was characterized by an upward trend, both in terms of export as well as import. Account balance showed a surplus in the considered period. Sale of food and agriculture, despite the crisis was characterized by a rapid increase, and the agro-food industry was one of the sectors with the highest growth rates. Although in the years 2010-2012 the German market recorded a decline in domestic demand, the turnover in the agro -food did not decrease but even increased [Kacperska 2012].
Polish agro-food products for many years have been becoming increasingly important in international trade. This is the effect of using high quality raw materials, modern technology and manufacturing original products with unique recipes. Polish products are highly appreciated on the international market and gain a growing number of customers [Kacperska 2012].

64
Marginal propensity of Poland to import agro-food from Germany
Agro-food import from Germany to Poland is on high level. Its value in the analyzed period increased from 3.6 billion PLN in 2005 to 12.2 billion PLN in 2012. The share of import from Germany in Polish agro-food trade has stood since 2007 at over 20%. Marginal propensity of Poland to import agro-food products from Germany was at a low level, pointing to its marginal significance (Table 6).
Table 6. The value of agro-food import from Germany and its main indicators in 2005-2012
Specification Year
2005 2006 2007 2008 2009 2010 2011 2012
Agro-food import (in million PLN) 3610.8 4212.1 5702.3 7707.8 8937.1 9493.1 12020.7 12274.4
Agro-food import’s growth (in million PLN) 666.3 601.3 1490.1 2005.6 1229.3 556.0 2527.6 253.7
Marginal propensity of Poland to import agro-food from Russia
0.011 0.008 0.013 0.020 0.018 0.008 0.023 0.004
Source: as in Table 1.
The effect of Poland’s income on account of Polish agro-food trade with Germany
Agro-food export to Germany pointed to a growing trend. In 2012, reached 16.4 billion PLN. The share of agro-food export to Germany in total stood at 22-25%. Commodity structure of Polish export to Germany in the analyzed period has changed quite significantly. This was the reason for the change that occurred in Poland in the period of transition and the adjustment period to the requirements of the European Union.
The total income generated by the agro-food trade with Germany in the years 2005-2011 was 3.1 billion PLN and was relatively low in relation to total export to Germany 9.5 billion PLN (Table 7).
Table 7. The value of agro-food export to Germany and its main indicators in 2005-2012
Specification Year
2005 2006 2007 2008 2009 2010 2011 2012
Agro-food export (in million PLN) 7342.1 8233.4 9707.9 10036.9 11314.9 12317.0 14209.5 16455.5
Agro-food export’s growth (in million PLN) 1255.7 891.2 1474.6 328.9 1278.0 1002.2 1892.4 2246.0
The effect of Poland’s income on account of Polish agro-food trade with Germany
13402.8 1443.6 2158.6 1512.2 -2110.9 1925.5 3437.3 -12255.7
Source: as in Table 1.

65
Summary
For many years Poland has been developing cooperation with Germany. Good neighborly relations and membership to the European Union strengthen cooperation and contribute to increasing trade. Germany is the most important recipient of Polish agro-food products. About 24% of Polish agro-food export gets on this market. In 2012, the value of exported agro-food products amounted to EUR 3.8 billion. Processed products of plant and animal origin dominated in the commodity structure.
From Germany, every year we import more food products. In 2012, the value of import amounted to 3.0 billion EUR. Processed products have dominant position in import to Poland.
The balance of mutual exchange in the period was positive. The value of exported products has grown 4 times and the value of imports over 6-times during the surveyed years, indicating a faster rate of growth of import, which may be detrimental for our country.
In the analyzed period, Poland reached a total income effect of trade with Germany in the amount of 49.6 billion PLN - including the agro-food trade 3.1 billion PLN. Analysis of the impact of foreign trade with Germany on Poland's GDP growth indicates that it is small, but with an upward trend for the years 2010-2011.
References
Bo yk P. [2008]: Mi dzynarodowe stosunki ekonomiczne. Polskie Wydawnictwo Ekonomiczne, Warszawa, pp. 64-88.
Guzek M. [2006]: Mi dzynarodowe stosunki gospodarcze. Zarys teorii i polityki handlowej. Polskie Wydawnictwo Ekonomiczne, Warszawa, pp. 97-110.
Misala J. [2005]: Wymiana mi dzynarodowa i gospodarka wiatowa. Teoria i mechanizmy funkcjonowania. Szko a G ówna Handlowa w Warszawie, Warszawa pp. 239-255.
Kamecki Z., So daczuk J., Sierpi ski W. [1971]: Mi dzynarodowe stosunki ekonomiczne. PWE, Warszawa, pp. 249-271.
Kacperska E. M. [2013]: Stosunki handlowe Polski z Niemcami w latach 2003-2012 ze szczególnym uwzgl dnieniem handlu artyku ami rolno-spo ywczymi. Zeszyty Naukowe SGGW Problemy Rolnictwa
wiatowego, Wydawnictwo SGGW, Tom 13, Zeszyt 3, Warszawa, pp. 104-116. Keynes J. M. [1956]: Ogólna teoria zatrudnienia, procentu i pieni dza. Warszawa. Rocznik Statystyczny Handlu Zagranicznego 2003 [2004]. GUS, Warszawa. Rocznik Statystyczny Handlu Zagranicznego 2004 [2005]. GUS, Warszawa. Rocznik Statystyczny Handlu Zagranicznego 2005 [2006]. GUS, Warszawa. Rocznik Statystyczny Handlu Zagranicznego 2006 [2007]. GUS, Warszawa. Rocznik Statystyczny Handlu Zagranicznego 2007 [2008]. GUS, Warszawa. Rocznik Statystyczny Handlu Zagranicznego 2008 [2009]. GUS, Warszawa. Rocznik Statystyczny Handlu Zagranicznego 2009 [2010]. GUS, Warszawa. Rocznik Statystyczny Handlu Zagranicznego 2010 [2011]. GUS, Warszawa. Rocznik Statystyczny Handlu Zagranicznego 2011 [2012]. GUS, Warszawa. Rocznik Statystyczny Handlu Zagranicznego 2012 [2013]. GUS, Warszawa. Smith A. [2012]: Bogactwo narodów. Wydawnictwo Studio Emka, Warszawa.

66
Pawe Kobus1
Department of Agricultural Economics and International Economic Relations Warsaw University of Life Sciences – SGGW
Modelling joint distribution of crop plant yields and prices with use of a copula function
Abstract. The paper constitutes an attempt at modelling the joint distribution of crop plant yields and prices in Poland. The main objective of the paper was to examine the usefulness of the copula function for the task and the selection of suitable marginal distributions. The fit of a joint distribution based copula function was compared with multivariate normal distribution. It was revealed that the multivariate normal distribution is outperformed by a Gaussian copula with the following marginal distribution: yields of both crop plants – normal distribution, price of wheat – Burr distribution (type XII) and price of rapeseeds – lognormal distribution. The main advantages of the copula function were: the possibility to use different marginal distributions and ability to model non-elliptical two-dimensional distributions. The practical implications of choosing the right joint distribution is demonstrated by comparing empirical quantiles of income for a given crop structure with theoretical quantiles based on the proposed joint distributions.
Key words: joint distribution, yields and prices, income risk, copula function
Introduction
Income risk in agriculture is most strongly affected by crop plant yields and prices. To properly evaluate the income risk of the crop structures examined, one should calculate at least the first two moments of the income generated by this crop structure, that is, a sum of yield-price products. The calculation of income distribution moments must be preceded by an estimation of the joint multi-dimensional distribution of crop plant yields and prices.
It has so far been assumed that the relation between yields and prices of the entire group of the plants being examined is explained sufficiently well enough by a correlation matrix. Consequently, it was believed that the multidimensional distribution of yields and prices can be sufficiently approximated by a multivariate normal distribution.
Regrettably, this strong assumption is not justified even in case of a marginal distribution [Tejeda and Goodwin 2008]. It cannot be expected that each of the examined variables follows normal distribution or even in fact, the same distribution. Therefore, it is reasonable to look for such a tool that will allow to incorporate various marginal distributions into one joint distribution of yields and prices [Zhu et al. 2008, Schulte-Geers and Berg 2011].
This paper aims at verifying the usefulness of a copula function for modelling joint distribution of crop plant yields and prices in Poland and for the selection of suitable marginal distributions.
1 PhD, e-mail: [email protected]

67
Data
This analysis uses farm level data from the Polish Farm Accountancy Data Network (FADN). The process of data selection was as follows: samples from years 2004 – 2009 were screened for farms which were present in the samples in all the years, and for which yields and transaction data for winter wheat and rape were available for all the years examined. In the end, a sample consisting of 378 farms was selected.
Observations of the following variables were available for each farm: X1 – winter wheat yield [dt/ha]; X2 – rape yield [dt/ha]; X3 –wheat price [PLN/dt]; X4 – rapeseeds price [PLN/dt]. Observations from all the farms and from all years were analysed together. Thus, 2268
repetitions were obtained for each variable.
Fig. 1. Marginal distributions of yields and prices for winter wheat and rape
Source: own calculations, based on FADN data
The histograms in the Fig. 1 confirm that the shape of the distribution is relatively close to normal distribution only for yields (X1 and X2). The prices, especially those of wheat (X3), manifest a positive skew which is too high for a normal distribution. The values of descriptive statistics in Table 1 also support the first impression about yield and price distributions. For the yields (X1 and X2), kurtosis is very close to 3 and the skewness coefficient is close to 0, while for wheat prices (X3) skewness is 1.03 and for rapeseed (X4)it is 0.65.

68
Table 1. Basic characteristics of the yield and price distributions
Descriptive statistics X1 X2 X3 X4
Average 55.88 31.79 51.13 92.86
Standard deviation 12.29 7.86 14.25 16.85
Variation coefficient 0.220 0.247 0.279 0.182
Median 55.00 32.00 47.15 90.94
Kurtosis 2.99 3.26 3.81 3.15
Skewness 0.15 -0.18 1.03 0.65
Source: own calculations, based on FADN data
On the basis of the results from Table 1, it was decided to consider 3 marginal distributions: normal, lognormal and Burr (type XII), the last one allows for extreme right skewness and is a good candidate for X3 and X4.
Methods
We start the process of searching for an appropriate joint distribution of yields and prices by considering options for marginal distributions, than we estimated dependence structure of joint distribution using Gaussian copula function. To compare various distribution Voung test [Voung 1989] was applied.
Density function of normal distribution 2( , )N :
2
221( ) e2
x
f x . (1)
Density function of lognormal distribution 2( , )LN :
2
2(ln )
21 , 02
( )x
efx
x x . (2)
Density function of three-parameter Burr2 (type XII) distribution ( , , )Burr :
1
, 0, 0, 0,( 1 0) xx xf x x . (3)
2 See [Tadikamalla 1980] for a friendly introduction to Burr distribution.

69
For modelling the joint distribution copula function was applied, where p-dimensional copula C(F1(x1), F2(x2), …, Fp(xp)) is defined as multi-dimensional distribution on [0, 1]p
space, with marginal distributions following standard uniform distribution U(0,1). It was proved in [Sklar 1959] that any multi-dimensional distribution F(x1, x2,…, xp) with marginal distributions functions F1, F2, …, Fp can be written as follows:
1 2 1 1 2 2( , , , ) ( ), ( ), , ( );p p pF x x x C F x F x F x (4)
where is copula function parameters vector. In this paper, the multi-dimensional distribution was estimated as follows: first, the
marginal distribution was estimated using the maximum likelihood method, then next, for the selected type of copula function, i.e., Gaussian copula, dependency parameters were estimated using the maximum pseudo-likelihood method. In case of Gaussian copula, the parameters vector is a vector of correlations 1 2[ , , , ]k , where 21
2k p p .When we consider two or more models for describing the distribution of an observed
variable, we need a procedure for choosing this model, which is significantly better. One popular approach is to use the likelihood ratio (LR) test. However, the LR test can be used only when the models being compared are nested. Using the Kullback-Leibler information criterion, Voung proposed the closeness likelihood ratio based test for non-nested models [Voung 1989]:
ˆ ˆ
2
log( )2
ˆ
A BBA
V
p pLL LL Nz
N (5)
where ALL and BLL are log-likelihoods of estimated models A and B, Ap and Bpare numbers of their parameters, N is the number of observations and 2ˆ is sample variance of the pointwise log-likelihood ratios. According to theorem 5.1 in [Voung 1989]:
under the H0 (the null hypothesis about both models being equally close or distant from the true model), the Vz statistic follows standard normal distribution N(0,1); under the HA, that is, the alternative hypothesis that model A is closer to the true model, Vz ;and under the HB, that is, the alternative hypothesis that model B is closer to the true model, Vz .
This theorem provides a simple rule for deciding which model is better: if Vz c then
model A is significantly better than model B, and if the value of Vz c then model B is the better one, where c is a critical value from standard normal distribution of a chosen significance level.

70
The calculations for all models were performed in R, a statistical computing environment [R Core Team 2013] with help of the ‘copula’ package [Hofert et al. 2013] and the ‘actuar’ package [Dutang et al. 2008].
Results
As already mentioned, in this paper there are 3 distributions: normal, lognormal and Burr (type XII), which are considered as options for marginal distributions. All three were fitted for each of variables: X1, X2, X3 and X4. Next, Voung test was used for selecting the best one in each case.
Table 2. Results of Voung test for the yield and price distributions
Compared distributions Values of Vz statistics
X1 X2 X3 X4
Burr v. Normal -1.319 -1.368 8.927 6.012
Burr v. Log-normal 3.757 5.252 1.756 -1.742
Normal v. Log-normal 3.836 5.092 -16.032 -10.385
Source: own calculations, based on FADN data
The interpretation of values in Table 2 need some clarification. For example, in the first line, when comparing Burr and normal distributions, we see 6.012 in the last column, which means that for variable X4, the Burr distribution is closer to the true model than normal distribution. What it is more, the value 6.012 compared with the 95% quantile of the standard normal distribution (1.6448) proves that this is a significant difference. But if we look at the second row where Burr and log-normal distribution are being compared, we see the Vz statistic with the value of -1.742, meaning that the Burr distribution is significantly farther from the true one than the log-normal distribution.
Fig. 2a. Fitted marginal distributions of yields for winter wheat and rape
Source: own calculations, based on FADN data
X1
Density
20 40 60 80 100
0.000
0.015
0.030
X2
Density
0 10 20 30 40 50 60 70
0.00
0.02
0.04

71
In the end, following distributions were selected: X1 ~ N(55.880, 12.295), X2 ~ N(31.792, 7.857), X3 ~ Burr(0.305, 12.530, 39.234), X4 ~ logN(4.515, 0.178), the values given in parentheses being maximum likelihood estimators of distribution parameters.
Fig. 2b. Fitted marginal distributions of prices for winter wheat and rape
Source: own calculations, based on FADN data
In Fig. 2a and Fig. 2b we can see, that except for the price of rapeseed (X4), all other density functions seem to fit the empirical data rather well. Nevertheless, these were only marginal distributions. It is not possible to depict on paper a distribution above a dimension of 2. Fig. 3 shows the scatterplots for each combination of variables, which at least makes it possible to see the 2-dimensional relation between variables
Fig. 3. Two-dimensional scatterplots for joint distribution of yields and prices for winter wheat and rape
Source: own calculations, based on FADN data
X3
Density
20 40 60 80 100 120
0.00
0.02
0.04
X4
Density
60 80 100 120 140
0.00
0.02

72
It was evident that only scatterplots for the 2-dimensional distribution of X1 and X2have the typical elliptical shape of a bivariate normal distribution (see graphs in Fig. 3: first row, second column or second row, first column). In the remaining cases, especially for X3and X4, the shape is non-elliptical.
Table 3. Estimated parameters of Gaussian copula function
Parameters Estimate Std. Error z value Pr(>|z|)
rho1 0.42444 0.01695 25.042 <2.00E-16
rho2 0.02134 0.02183 0.977 0.32836
rho3 0.06535 0.02213 2.953 0.00314
rho4 -0.03431 0.02114 -1.623 0.10466
rho5 0.0408 0.02130 1.915 0.05544
rho6 0.53365 0.01344 39.711 <2.00E-16
Source: own calculations, based on FADN data
To allow for a different marginal distribution and non-elliptical shape of the 2-dimensional distribution, the Gaussian copula function was estimated with such parameter values as given in Table 3. The correlations from Table 3 show the fairly strong positive relation between yields of wheat and rape, and between prices of wheat and rape. All other correlations are very weak and not significant at a typical 5% significance level in most cases.
As mentioned in the introduction, the main aim of this paper was to investigate whether a copula function will outperform the multivariate normal distribution in modelling the joint distribution of crop plant yields and prices. For that purpose, the Voung test was used. Since this is a test relatively little known to the majority of agriculture economists, an example of a calculation is given below:
15 14( 34702.76) ( 35179.8) log(2268)2 14.03
2268 0.5013Vz (6)
Comparing the Vz statistic with quantiles of the standard normal distribution N(0, 1), we can see that the hypothesis of equidistance from the true model must be rejected on a arbitrarily low level of significance, i.e., p-value is below 2.00E-16. Therefore, it must be concluded that modelling joint distribution of crop plant yields and prices on the basis of a copula function is definitely a better choice than using the multivariate normal distribution.
Figures 4 and 5 show scatterplots for the samples generated from joint distribution of crop plant yields and prices based on a copula function and on the estimated multivariate normal distribution, respectively. It is clear that only the first one allows for the non-elliptical 2-dimensional distribution observed in the empirical data. It is a visual confirmation of the above tests, which show that the multivariate normal distribution is not suitable for modelling the joint distribution of crop plants yields and prices.

73
Fig. 4. Sample data generated with the model based on the estimated Gaussian copula function
Source: own calculations
Fig. 5. Sample data generated with the estimated multivariate normal distribution
Source: own calculations
X1
10 30 50 40 80 140
2060
1030
50
X2
X3
50150
20 60
40100160
50 150
X4
X1
10 30 50 40 80 12020
60100
1030
50
X2
X3
-20
40100
20 60 100
4080
140
-20 20 60 100
X4

74
The results so far indicate the clear advantage of using the copula based joint distribution, but to demonstrate how important it could be in practice to choose the right distribution, quantiles of income for a given crop structure were calculated.
Table 4. The relative discrepancies between empirical income quantiles for a given crop structure and the theoretical income quantiles (based on estimated join distributions)
Probability Empirical [PLN] Copula f. Normal distribution
Crop structure - 10% winter wheat, 90% rape
0.01 1290 4.4% -4.3%
0.02 1461 1.6% -4.9%
0.05 1727 -1.4% -4.2%
0.10 1939 -0.9% -2.1%
0.50 2820 -0.5% 1.4%
Crop structure - 90% winter wheat, 10% rape
0.01 1250 -3.0% -24.5%
0.02 1357 -1.0% -17.7%
0.05 1629 -3.6% -13.9%
0.10 1808 -1.4% -7.0%
0.50 2701 -1.0% 3.7%
Source: own calculations, based on FADN data
It can be noted, on the basis of table 4, that for the {10% wheat, 90% rape} structure, both the joint distributions behave quite well, with the relative difference being less than 5%. But for the {90% wheat, 10% rape} structure, only the copula based distribution performs just as well as for the previous structure. The multivariate normal distribution gives differences of up to 25%. The reason for that could be the marginal distribution of wheat prices. The share of wheat in the first structure is too small for the wheat prices to be really of any importance when an inappropriate distribution is selected, but in the second case, when the share of wheat is so high, then choosing the inappropriate distribution clearly distorts the arguments which follow.
Conclusions
The ability of incorporating different marginal distributions by a copula function is vital for joint modelling of crop plant yields and prices.
Joint distribution of crop plant yields and prices modelled with the use of a Gaussian copula function constitutes a significant improvement over the multivariate normal distribution, i.e., it has a significantly better fit to empirical data.
In the case of high-skew variables, such as the price of wheat, the Burr distribution has a significantly better fit than a log-normal distribution which is traditionally used to model the distribution of prices.
Using an inappropriate joint distribution of crop plants yields and prices results in the unreliable estimation of income distribution for the crop structures being analysed.

References
Dutang C., Goulet V., Pigeon M. [2008]: actuar: An R Package for Actuarial Science. Journal of Statistical Software, vol. 25, no. 7, pp. 1-37. URL http://www.jstatsoft.org/v25/i07.
Hofert M., Kojadinovic I., Maechler M., Yan J., [2013]: copula: Multivariate Dependence with Copulas. R package version 0.999-7. URL http://CRAN.R-project.org/package=copula.
R Core Team [2013]: R: A language and environment for statistical computing. R Foundation for Statistical Computing, Vienna, Austria. URL http://www.R-project.org/.
Schulte-Geers M., Berg E. [2011]: Modelling farm production risk with copulae instead of correlations. Paper prepared for presentation at the EAAE 2011 Congress Change and Uncertainty Challenges for Agriculture, Food and Natural Resources August 30 to September 2, Zurich.
Sklar A. [1959]: Fonctions de répartition à n dimensions et leurs marges. Publ. Inst. Statist. Univ. Paris 8, pp. 229-231.
Tadikamalla P. R. [1980]: A look at the Burr and related distributions. International Statistical Review, Vol. 48, Number 3, pp. 337–344.
Tejeda H.A., Goodwin B.K. [2008]: Modeling Crop prices through a Burr distribution and Analysis of Correlation between Crop Prices and Yields using a Copula method. Selected Paper prepared for presentation at the American Agricultural Economics Association Annual Meeting, Orlando, July 27-29.
Voung Q.H. [1989]: Likelihood Ratio Tests for Model Selection and Non-Nested Hypotheses. Econometrica,Vol. 57, No. 2, pp. 307-333. Zhu Y., Ghosh S.K., Goodwin B.K. [2008]: Modeling Dependence in the Design of Whole Farm Insurance
Contract, |A Copula-Based Model Approach. Selected Paper prepared for presentation at the American Agricultural Economics Association Annual Meeting, Orlando, July 27-29.

76
Karol Kociszewski1
Wroc aw University of Economics
Biodiversity protection in European Union agriculture
Abstract. Biodiversity conservation is an important element of EU environmental policy and it influences certain instruments of the Common Agricultural Policy (agri-environmental programmes, cross–compliance rules, organic farming support). These play an increasingly important role in this policy. However, in some Member States they are insufficiently directed to nature conservation. Direct payments affect an increase in threats to biological diversity, although this impact was restricted in the course of the CAP reform (implementation of a regional system combined with cross-compliance rules). Moreover, the withdrawal or significant reduction of the instrument would result in even greater losses. Low effectiveness of existing activities contributes to the continuous degradation of biological diversity in European rural areas: the specialized payments for farmers in the Natura 2000 network are implemented to a limited extent, specialised support directed for High Nature Values (HNV) farming has not yet been introduced in practice, execution of cross-compliance rules was insufficient. In years 2014-2020 nature conservation within the CAP will grow in importance and it will implicate improvement of the effectiveness of actions implemented in the Member States.
Key words: environmental protection in agriculture, biodiversity, sustainable development of agriculture.
Introduction
The impact of European agriculture on biodiversity is multi-faceted. On one hand, the intensification of production poses a threat to nature (enormous use of chemicals, mechanization, monocultures, deleting the landscape elements, which are essential for fauna and flora habitats). On the other hand, extensive agriculture enables the maintenance of a semi-natural rural landscape with its natural wealth. In that context, the threats to biodiversity appear when the abandonment of production and agricultural land takes place. Usually, the reason for this phenomenon is deterioration of farmers’ economic and social situations as a result of competitive pressure from industrial farms and agricultural product imports. In such cases, utilized agricultural areas (UAA) are deprived of conservation, are a subject of uncontrolled planting, forestation and the invasion of undesirable plant species (especially in the areas of semi-natural grasslands). The EU is an important actor in constructing nature conservation policy on a global scale and, at the same time, implementing adequate internal solutions. Indirectly, this applies to sector policies such as the Common Agricultural Policy (CAP).
This paper’s aim is a synthetic characteristic of the influence of biodiversity protection policy on the CAP instrumental changes. It refers to actions related to the Natura 2000, to the support of agriculture in other high natural value areas as well as to regulations limiting the negative agricultural impact on the environment (including the use of pesticides). The research material includes: EU statistical data, information from official EU documents connected with environmental and agricultural policies as well as the studies and expertise concerning environmental issues of rural areas.
1 PhD, e-mail: [email protected]

77
The implications of environmental policy
Along with the development of environmental law and policy, the EU has gradually projected and implemented activities related to biodiversity protection. In accordance with the important principle of environmental policy, these activities have contributed to changes of the CAP instruments (according to the principle, sectoral policies should be integrated with environmental policy). The first four action programmes (which are the base for implementation of the EU’s environmental policy) did not contain references initially that were directly formulated to agriculture. They were involved in the Fifth Environmental Action Programme (Towards Sustainability), which covered the period 1993-2001. It referred to the damage caused by intensive agriculture and assigned objectives to this sector: the protection of biodiversity and natural habitats, the essential restriction of the use of pesticides, afforestation of agricultural land and stabilization or reduction of ground and surface water pollution with nitrates. In the Sixth Environmental Action Programme (Our future, our choice), projected for years 2002-2012, four priorities were set out. Among them were nature and biodiversity. The most important instrument for its implementation is the Natura 2000 network. A considerable part of the areas it includes are located in rural areas, therefore – according to the programme – the implementation of agri-environmental programmes (AEP) and other activities of the CAP Pillar II should be extended there.
All Member States are obliged to designate the Natura 2000 network on the basis of harmonized procedures and methods of organization. Agricultural activity cannot negatively affect habitats and species of plants and animals, in accordance with the requirements of cross-compliance rules (described later in the paper). The Natura 2000 consists of two kinds of areas:
Special Protection Area (SPA), which are subjected to the provisions of the “bird” directive [Directive 2009/147/EC]. Until the end of 2011, total SPA covered 59,3 million hectares, including 42,1 million hectares of land area (12,1% of the EU-27 land territory) [Rural development… 2012]. The largest share of SPA in total area of a particular country occurs in the new Member States: Cyprus (25,6%), Slovakia (25,1%), Slovenia (23,0%) and Bulgaria (20,4%) [Natura 2000 barometer… 2010]. In the EU-15 the largest share is in Greece (20,9%) and in Spain (20.6%). In Poland the share is 15,6%. Special Areas of Conservation (SAC), on which the “habitats” are implemented [Council directive 92/43/EEC]. Until 2011 total SAC covered 71,9 million hectares, including 58,6 million hectares of land area – 13,7% of the EU-27 land territory. The largest shares occur in Slovenia (31,4%), in Spain (24,5%), and in Portugal (17,4%). In Poland the share is 11,0%.
SPA and SAC partly overlap and altogether cover 95 million hectares, including 77,1 million hectares of land territory, which represent 17,9% of EU-27 area, 17,5% of the EU-15 area and 18,6% of the EU-12 area. The largest area is located in Spain (13,7 million hectares) and in France (6,8 million hectares). Poland is in third place with territory of 6,2 million hectares. Species and habitats in the Natura 2000 are much better protected than in other areas, where a greater reduction of biological diversity is observed [Environmental statistics… 2010].
In conjunction with the 6th Action Programme, in 2001 the Biodiversity Protection Plan for Agriculture was adopted. The implications of the plan are: the promotion and

78
support of environmentally friendly agricultural practices, support of farms in areas of high nature value, the improvement of infrastructures in the field of agriculture, as well as traditional breeds of cattle and agricultural plant species cultivation. The 6th Action Programme is also linked to the Thematic Strategy on the Sustainable Use of Pesticides from 2006. It covers, inter alia, issues related to the impact of agriculture on biodiversity (harm to plants and animals, disruption to ecosystems) [A Thematic Strategy… 2006]. The need to implement the strategy stemmed mainly from the incomplete – so far – scope of the intervention, which focused on the terms of placing plant protection products on the market. Existing measures do not limit pesticide consumption and do not influence a reduction of threats to health and the environment. According to EU regulations, all pesticides placed on the market must be safe for health and the environment, but this is verified by tests based on standards created 20 years ago [Which Common… 2010]. Some products are allowed for sale as the result of political decisions without full consideration of their harmfulness. This strategy aims to minimise these threats, to improve the monitoring and control of their use, to reduce contents of harmful active substances and to encourage the reduction of doses used. The main legal instrument of the strategy is directive 2009/128/EC establishing a framework for Community action in favour of the sustainable use of pesticides [Directive 2009/128/EC]. According to its provisions, Member States were obliged to implement (by December 2012) national action programmes in order to reduce the risks associated with the use of pesticides (including the designation of zones where the use of pesticides is banned – for example, the Natura 2000 areas). These programs have to be linked with national rural development programmes and they should be coordinated with Integrated Pest Management (IPM) – obligatory from 2014. IPM is the system based on techniques with limited or withdrawn use of chemical agents, including biological plant protection (inter alia, through the use of species that are natural enemies of pests), special forms of crop rotation, methods of deterrence, the pitfalls of pests. The use of these systems will become one of the cross-compliance requirements. It can be concluded that the requirements of the directive are a step in the direction toward reducing damage caused by pesticides. However, it should be noted that a number of shortcomings associated with policy regulating the use of these substances have not been eliminated:
There are no ceilings specified in the reduction of pesticide consumption. This was argued by the lack of their direct impact on health and the environment, and the lack of reliable data on consumption volume in Member States. The first of these arguments seems to be heavily controversial and hardly believable, even more so, that at the same time, EU institutions expressed hope that implemented measures will reduce pesticide use by 11-16%. It could be asked: if the harmfulness of pesticides was not found, then why is there hope to limit their consumption? There is no implementation of fees charged for the use of plant protection products. This was argued by the difficulty in assessing the dangers of individual pesticides in conjunction with particular methods of their application. Member states have a sizable range of freedom in constructing their national action programmes. It enables the implementation of soft, inefficient regulations in countries where the agricultural lobby has high bargaining power.
We can only guess that the "soft" nature of directive 2009/128/EC is the result of pressure from the agricultural and chemical industry lobbies, which seek to increase the revenue of farmers and producers of pesticides. Tightening the regulations would result in

79
an increase in costs incurred by agricultural holdings and would reduce the demand for plant protection products.
The latest strategic document of nature conservation is the EU biodiversity strategy to 2020, which was implemented in 2011 [Our life insurance… 2011]. It is an integral part of the Europe 2020 strategy. The main objective is to stop the loss of biodiversity by 2020, and its restoration to the greatest extent possible, as well as to increase EU participation in international policy aimed at preventing the loss of biodiversity in the world. Among the six detailed objectives there is the increase in the number of habitats (by 100%) and the number of species (by 50%) with improved protection under “habitats” and “bird” directives. In the environmental assessment of the strategy, it was found that 60% of European areas used for agriculture require a management favourable for biological diversity. This applies both to areas of intensive and extensive production. The reversibility of nature degradation is followed not only by loss of intrinsic value of the environment, but also by measurable economic losses. In EU agriculture, 80% of crops depend on the population size of pollinators. The value of production from these crops is estimated at 15 billion EUR per year. Among the 20 measures – specified in the strategy – there are the ones which are related to agriculture and rural areas:
Completion of works on the Natura 2000 network establishment in all Member States and ensuring a steady source of their funding. Leading in new direct payments or increasing existing CAP direct payments (beyond cross-compliance) for activities related to the provision of environmental public goods (permanent pasture and meadow maintenance, crop rotation, the Natura 2000, ecological set-asides, water ecosystems improvement). Better targeting of rural development policy for biological diversity protection and for landscape feature maintenance. The European Commission, in cooperation with the Member States, would introduce measurable objectives within rural development programmes (especially in AEP). These objectives would be adjusted to regional and local conditions and circumstances. The designation of HNV (High Nature Value) areas, implementation of financial support for HNV farms within national RDPs and monitoring developments in this matter.
HNV is the second (next to the Nature 2000) category of nature conservation areas in agriculture. It is defined with farming as the main method of land utilisation and as meets three basic features. These features are the basis for classification of three types of HNV areas:1.Areas with a high proportion of semi-natural vegetation (semi-natural meadows, pastures
and other grassland, which are characteristic for village landscapes, woodlands, bushes, marginal farmlands, water bodies, baulks) with diversified land use (crops, set-asides, various vegetation, specific features of the landscape) [Beaufoy, Cooper 2009].
2.Areas with many farms conducting extensive agricultural production, often associated with breeding (less than 1 Livestock Unit/ha).
3.Agricultural areas favourable for diversity of habitats and species, including those protected within European and global nature conservation policy.
HNV areas may partly overlap with the Natura 2000 network, but are designed to cover a larger territory – it was considered that to preserve Europe’s natural heritage it is not enough to protect only the most valuable habitats.

80
In accordance with the integration principle, instructions addressed to agriculture clearly implicate the CAP changes. Consequently, biodiversity actions are closely linked with already functioning instruments (cross-compliance, agri-environmental programmes (AEP), payments for farms in the Natura 2000 areas) and are determinants of changes planned in the reform of this policy for years 2014-2020 (Pillar I and II measures proposed for HNV farming support).
The measures implemented within the Common Agricultural Policy
Nature conservation-related activities were gradually introduced into the CAP together with consecutive steps towards greening that policy. For the first time this came along with the 1992 reform (so-called Mac-Sharry package), when the AEPs were introduced in practice to all Member States (the programmes are based on payments for environmental services which bring environmental benefits; among others, for nature and landscape). Furthermore, most of the price of support instruments has been replaced by direct payments, which has limited incentives for negative externalities. In addition, for this purpose, obligatory set asides have been introduced. Initiated changes were reinforced in the next stages of reform: in Agenda 2000 (1999), in the so-called Fischler Package (2003) and in Health Check (2008).
It is worth underlining the modification of direct payments, which became decoupled from production volume. From 2005, Member States could choose one of three basic systems: historical, regional and hybrid. Regional system is most favourable for biodiversity because in it the payments are granted not only for areas directly used for agricultural production, but also for so-called "open landscape". It is a part of farmland, which is not used for economic reasons but is naturally valuable [Evaluation of environmental impact of the CMO… 2007]. Payment value – per farm – depends on number of hectares but not on production volume per hectare. Consequently, for farmers, it is beneficial to declare “open landscape” area as a basis for direct payments’ calculation. Thanks to that, the subsidies are suitable for extensive farms (including HNV), contribute to agricultural maintenance and – together with cross-compliance – help to preserve the nature of rural areas.
In the remainder of direct payment systems, subsidy rates depend on past (historical) production volume in the farm (per hectare). They generate weaker incentives to maintain non-productive (but environmentally valuable) areas. Nevertheless, it should be noted that without application of direct payments (and thus without cross-compliance requirements), the number of smaller, extensive holdings (public goods providers) would be greatly reduced. This process would also limit the number of Pillar II beneficiaries, and consequently, would lower effectiveness of rural development programmes. In areas (regions) where economic conditions are unfavourable but farm functioning is desirable for environmental reasons, agricultural activities would be abandoned. Rural areas would be neglected, which would be detrimental to conservation of biodiversity and landscape. This would reduce external benefits from agriculture.
Among the cross-compliance standards that must be met by the CAP payments, recipients are those that relate to biodiversity. They are included in two groups of requirements:

81
Good Agricultural and Environmental Conditions (GAEC), which include permanent grassland protection2, preservation of landscape, prevention against expansion of undesirable animal and plant species, the maintenance of olive orchards in good condition. Statutory Management Requirements (SMR), consisting of – among the others – standards from “habitats” and “birds” directives, which are obligatory on the Natura 2000 agricultural areas.
Despite the significant contribution of cross-compliance to biodiversity protection, there are some deficiencies in its implementation: - no provision for compulsory measures preventing monocultures (such regulations were
implemented only in Austria and Finland), - no requirements referring to obligatory share of biodiversity important areas in UAA, in
particular farms, - no restrictions on withdrawal from animal breeding on permanent grassland. - "mechanical" requirement to maintain permanent grasslands, without reference to places
where it is most desirable. This can potentially allow a reduction in an area with high biodiversity.
- the effectiveness of the instrument is also impaired as a result of leaving Member States a range of freedom in setting of mandatory requirements for farmers.
According to the CAP reform plans for 2014-2020, direct payments will be increasingly directed towards environmental protection. 30% of their value will be obligatorily granted as so called greening3, inter alia, for crop rotation and the mandatory assignment of Ecological Focus Areas (EFAs) with landscaping elements (set-asides, forests, wooded areas, bushes, water bodies, terraces, buffer zones). They should cover at least 7% of the agricultural area for each holding (excluding existing grasslands). All these activities will be favourable for biodiversity but (on the other hand) will create new burdens for farmers. They will have to care for bio-diversity, otherwise they will have problems with direct payment absorption. The requirements of greening comply with part of the existing standards in organic farming and in the Natura 2000 network. It means that farms connected with these institutions will be "automatically" granted this part of direct payments. In addition, Member States may allocate up to 5% of their direct payments envelope for farmers in Areas Facing Specific Natural Constraints (AFSNC). This will be a favourable instrument for HNV. The methodology enabling areas to be assigned with this type of agriculture has not yet been codified, so there is no plan of implementation of specialized support for HNV. In spite of this, it is planned to introduce simplified programs supporting small farms, in order to maintain extensive farming in areas where it is relevant in the light of public good provisions. Every country could allocate for this aim up to 10% of the value of the “basic” direct payment component.
Allocation for AEP – the most important environment protection instrument in the CAP – is the biggest among all measures in Pillar II (23,1% of its value in the years 2007-
2 Member States should maintain permanent grassland area not less than specified in reference period, however in practice, in some cases that territory area could be a little diminished. In Poland, for example, farmers can reduce the area by 5% without additional consent and if they want to reduce more (up to 8%), the permission of the local officer of the rural development agency is required.3 The rest (70%) – “basic” direct payments (“basic component”) would be granted under the same rules as today.

82
2013) [Kociszewski 2013]. In 2011, their physical area accounted for 14,8% of EU’s UAA (17,4% in the EU-15 and 8,8% in the EU-12). The number of AEP participants was equal to 14,7% of total number of farmers [Agriculture in... 2012]. The subsidies are granted for extensive production methods use or additional environmental services provided by farmers. These services are favourable both for wildlife (e.g. special Natura 2000 packages, changes in seasons of grasslands swath in a way to be suitable for bird breeding periods), and for maintenance of rare farm animals (e.g. local breeds of cattle and plant species). Studies have shown that AEP in practice contributes to an improvement of life conditions of fauna and flora wild species [Agri-environment… 2005]. This is due to lower consumption of plant protection products as well as to preservation of permanent grasslands and rural landscape. An important direction of AEP support is organic agriculture (its methods in essence are to promote the protection of nature). So far, this support is effectively applied. In 2010, 3,2% of EU-15 farms are organic. They occupy 5,9% of UAA [Kociszewski 2013]. At the EU-27 level, these indicators are as follows: 1,6% and 5,1% (they are decreased by EU-12 countries, where organic farming is at an early stage of development). According to the CAP reform plan (mentioned above), support for organic farming will be excluded from the Agri-environment-climate payments (AECP), which will be a new version of AEP. The subsidies for organic farms will be granted within the new instrument, but the rules of implementation remain similar. The allocation for these measures will depend on the shape of the CAP budget in years 2014-2020. According to the EU budget plans agreed in February 2013, Pillar II value will be reduced by about 20% in comparison to years 2007-2013. Consequently, a support for its instruments will be diminished.
In the context of growing support for nature protection within the CAP, it is worth paying attention to the value of rural landscape. According to available estimates (from 2009), willingness to pay (WTP)4 for conservation of landscape as a whole is equal 142 EUR/hectare, 189 EUR/hectare for grasslands and permanent crops, and 113 EUR/ hectare for arable land [Impact… 2011]. The total value of the EU's rural landscape is estimated at 25,8 billion EUR, representing 7,5% of total agricultural production value and 44% of total CAP expenditure per year.
Directly targeted nature protection measures in agricultural policy are implemented in relation to two categories of areas: the Natura 2000 network and HNV. The Natura 2000 area is 10,6% of UAA in the EU-27, 10% in the EU-15 and 12,2% in the EU-12 [Rural development… 2012]. Unfortunately, conservation status of habitats in agricultural areas is worse than in the rest of the network areas (status in 52% of habitats is assessed as bad, in 7% as good) [Environmental statistics… 2010]. This is due to overly intensive production in some areas and extensive production cessation in others. Farmers in the Natura 2000 areas must comply with cross-compliance requirements, and even more, they can participate in additional nature conservation measures in the II pillar. In most countries (e.g. Poland) this occurs within the AEP. Additionally, in the period 2007-2013 the Natura 2000 payments and payments linked to Directive 2000/60/EC were led in, but in practice, allocation for this action is scarce - 0,1% of total Pillar II expenditure [Rural development… 2012].
4 WTP is a basis for one of the leading methods used for environmental valuation [Fiedor 2002].

83
HNV Farmland methodology is still in the development phase and is not yet fully unified [Situation… 2010]. As a result, assignment of HNV areas has not yet been completed. Incomplete available estimates show that they occupy approximately one-third of UAA in the EU-27. 20% of its regions are characterized by high (over 48%) or very high (more than 71%) HNV share in UAA [Nowicki et al. 2009]. According to other studies, based on FADN (Farm Accountancy Data Network) data base, the criteria for HNV meets 12,5% of farms in the EU-15, on an area of 20% UAA. According to the European Environmental Agency (EEA) estimates [Report "High… 2012], 31,9% UAA in the EU-27, 32,6% UAA in the EU-15 and 28,7% UAA in the EU-12 should be classified as HNV. HNV farms have relatively low income and rely on their own labour resources (their existence is based on low-cost-strategy). Consequently, they absorb fewer external production factors and put less pressure on the environment than other farms. They also receive lower (about half) direct payments than the others [Konecny 2004]. Because of threats to nature that result from abandonment of agricultural activities, it is reasonable to use financial assistance for farm owners. However, so far, HNV farming has not been supported in a targeted way; neither by agricultural policy nor by market mechanism. Pillar II payments were insufficiently directed to the regions with the highest concentration of this type of agriculture. Rules for AEP subsidy rate calculations are based on the value of extra costs and lost revenue due to ecological services. They do not allow for long-term, broad-based support for HNV because its essence is to provide public goods in connection with the continuation of extensive production but not with new "surplus" environmental services.
The main objective of the EU's biodiversity protection policy (stopping its loss for 2010) was not reached and threats to European nature continue to get worse [The Assessment… 2010]. It refers, among other things, to changes in farm structure and in the way of land management. Between 1990 and 2000, the EU-15 intensification of agriculture resulted in grassland reduction by about 0,5 million hectares (through their conversion into arable land or permanent crops) [Osterburg et al. 2008]. In years 2000-2007 they decreased by a further 2,3 million hectares, mainly due to expansion of infrastructure and urbanization, but also by an increase in specialization of agriculture (concentration of arable land at the expense of pastures and meadows), especially on lowland areas [Environmental statistics… 2010]. Despite restrictions on pesticide consumption, it is still excessive. In addition, plant protection products are often improperly used. Consequently, their concentrations in the environment are over permitted limits. It is estimated that they threaten 26% of animal species [Which Common… 2010]. To assess changes in rural area biodiversity Farmland Bird Index 23 (FBI 23) is used. It characterises changes in the population of 23 bird species specific to rural areas. In years 1980-1996 its value in the EU-15 fell to 54% of the reference value [Beaufoy, Marsden 2010], which is the effect of agriculture intensification. In the mid-1990s, beneficial effects of the 1992 reform appeared and the index value began to increase. In 2000, the FBI 23 reached 60% of reference value and, with some temporary fluctuations, stayed at this level until 2008. [Rural development… 2012]. Another index used to assess the impact of the CAP on biodiversity is European Grassland Butterfly Indicator. In years 1990-2009 its value decreased by 70% [Beaufoy, Marsden 2010], but it is worth noting that the value from the base year was already at a low level after a few decades of European agriculture intensification.

84
Conclusions
Development of the EU nature conservation policy increasingly affects the CAP changes, which aim to limit agriculture’s impact on biodiversity impoverishment. Designation of the Natura 2000 network in rural areas in the general outline is effective (they involve 10,6% of EU-27 UAA, 10% of EU-15 UAA and 12,2% of EU-12 UAA). On the contrary, due to a lack of appropriate tools, agricultural policy related to other areas was ineffective (table 1).
Table 1. Implementation of biodiversity protection policy in CAP measures.
Implications Current CAP instruments Future CAP instruments (2014-2020)
Pillar I Pillar II Pillar I Pillar II
More restricted nature conservation requirements for farmers.
Cross-compliance rules are insufficientlydirected to nature conservation*.
Cross-compliance rules are insufficiently directed to nature conservation*.
_ _
More restricted policy on pesticides use – including IPM (so far policy isdisadvantageous*).
Cross-compliance rules insufficientlyprotect from risks connected with pesticides use.
Ban on pesticides use in organic farming,
IPM will be obligatory within cross-compliance rules (from 2014).
_
Requirements connected with Natura 2000 sites: -increasing existing CAP direct payments related to biodiversity protection, -implementation of new direct payments related to biodiversity protection -better targeting of Pillar II measures for biological diversity protection.
Regional system is more favourable for nature conservation than the other ones,
No direct financial support.
Allocation for AEP is the biggest among all measures in Pillar II (23,1% of its value in years 2007-2013) but isinsufficiently directed to nature conservation, Low value of Natura 2000 payments (0,1% of total Pillar II expenditure) implemented in years 2007-2020. Support for organic agriculture is effectively applied (in 2010, 3,2% of farms and 5,9% of UAA in the EU-15 were organic) but is insufficiently directed to nature conservation.
30% of direct payments will be obligatorily granted as “greening”. Theduties connected with nature conservation will cover at least 7% UAA in each holding
Farms connected with organic agriculture or located in the Natura 2000 sites will be granted by these payments.
According to the EU budget plans, Pillar II value will be reduced by about 20% in comparison to years 2007-2013, The subsidies for organic farms will be granted within the newinstrument excludedfrom the AEPs.

85
Designation of HNV areas: -implementation of financial support for HNV farms within current national RDPs,-changes in the CAP reform for years 2014-2020 (targeted support within Pillars I and II).
Designation of HNV areas is not completed (different estimates are presented in the text),
No direct financial support.
No measure directly oriented to HNV farms,
Support in the framework of AEP is not fully relevant for HNV farming.
Member States may allocate up to 5% of their direct payment envelope for farmers in AFSNC, Simplified programs supporting small farms (with allocation up to 10% of the value of “basic” direct payments.)
No measure directlyoriented to farmers in these areas.
* the problem is described in the text
Source: Author’s own elaboration based on: [Nowicki et al. 2009], [Report "High… 2012], [Kociszewski 2013], [Situation… 2010], [Rural development… 2012].
Changes to the CAP in years 2014-2020 will target their instruments towards nature conservation. Pillar II allocations will be reduced so nature conservation measures will be enforced within Pillar I. This implies a rise in effectiveness of the actions implemented in the Member States – mainly referring to the greening component of direct payments and to support for AFSNC.
Literature
Agriculture in the EU. Statistical and economic information 2011. [2012]. European Union, DG Agri, Publications Office of the European Union, Luxembourg, pp. 204.
Agri-environment Measures, Overview on General Principles, Types of Measures, and Application. Unit G-4;Evaluation of Measures applied to Agriculture, Studies. [2005]. European Commission DG Agri, Brussels, pp. 7.
Beaufoy G., Cooper T. [2009]: Guidance document, The Application of High Nature Value Impact Indicator. The programming period 2007-2013, European Commission, DG Agri, Brussels, pp. 7.
Beaufoy G., Marsden K. [2010]: CAP after 2013, last chance to stop the decline of Europe’s High Nature Value farming?, European Forum on Nature Conservation and Pastoralism, BirdLife International, Butterfly Conservation Europe, WWF, pp. 9-22.
Directive 2009/147/EC of the European Parliament and of the Council of 30 November 2009 on the conservation of wild birds (O. J. L 20/7 26.1.2010).
Directive 2009/128/EC establishing a framework for Community action in favour of the sustainable use of pesticides (O. J. L 309, 24/11/2009).
Council Directive 92/43/EEC of 21 May 1992 on the conservation of natural habitats and of wild fauna and flora (O. J. L 206, 22/07/1992 P. 0007 – 0050).
Environmental statistics and accounts in Europe. Eurostat statistical books, 2010 edition. [2010]. Publication Office of European Union, Luxembourg, pp. 203-266.
Evaluation of environmental impact of the CMO and direct support measures of the CAP for arable crops. [2007]. Alliance Environment, Auzeville-London, pp. 200-225.
Fiedor B. (ed.) [2002]: Podstawy ekonomii rodowiska i zasobów naturalnych, Wyd. C. H. Beck, Warszawa, pp. 170–195.
Impact Assessment, Common Agricultural Policy towards 2020 Annex 2: Greening the CAP. [2011]. European Commission, Commission Staff working document, Brussels, pp. 6-25.
Konecny M. [2004]: EU Enlargement and Agriculture: Risks and Opportunities. Friends of Earth Europe, Brussels, p. 40.

Kociszewski K. [2013]: Ekologizacja polskiego rolnictwa a jego zrównowa ony rozwój w warunkach cz onkostwa w Unii Europejskiej, Wyd. Uniwersytetu Ekonomicznego we Wroc awiu, Wroc aw, pp. 154.
Natura 2000 barometer. Natura 2000. [2010]. European Commission, Nature and Biodiversity Newsletter, no 29. Nowicki P., Goba V., Knierim A., van Mieijl H., Banse M., Dalbaere B., Helming J., Hunke P., Jansson K.,
Jansson T., Jones-Walters L., Mikos V., Sattler C. Schlaefke N., Terluin I., Verhoog D. [2009]: Scenar 2020 II – Apdate of Analysis of Prospects in the Scenar 2020 Study – Contract no 30 – CE – 0200286/00-21, European Commission, DG Agri, Brussels, pp. 8.
Our life insurance, our natural capital: an EU biodiversity strategy to 2020. [2011]. European Commission, Communication from the Commission to the European Parliament, the Council, the Economic and Social Committee and the Committee of the Regions, COM(2011) 244 final, Brussels.
Osterburg B., Nitsch H., Laggner A., Wagner S. [2008]: Analysis of policy measures for greenhouse abatement and compliance with the Convention Biodiversity, Institute of Rural Studies of the vTI Johann Heinrich von Thünen-Institute, Federal Research Institute of Rural Studies Forestry and Fisheries, pp. 90.
Report "High Nature Value Farmland in Europe – 2012 update". [2012]. European Environment Agency, Copenhagen, pp. 2-20.
Rural Development in the European Union, Statistical and Economic Information. Report 2012. [2012]. European Union, DG Agri, Brussels, pp. 154-308.
Situation and Prospects of Agriculture and rural areas. [2010]. European Commission DG Agri, Brussels December pp. 12-19.
The Assessment of Implementing the EU Biodiversity Action Plan. [2010]. European Commission, Report from the Commission to the Council and the European Parliament COM(2010) 548 final Brussels, pp. 2-7.
A Thematic Strategy on the Sustainable Use of Pesticides. [2006]. Commission of the European Communities, Communication from the Commission to the Council, the European Parliament, the European Economic and Social Committee and the Committee of the Regions COM(2006) 372 final, Brussels.
Which Common Agricultural Policy for Europe after 2013? [2010]. PAN Europe Position Paper. PAN Europe, pp. 2.

87
Dorota Kozio -Kaczorek1
Department of Agricultural Economics and International Economic Relations Warsaw University of Life Sciences – SGGW
A combined muilticriteria procedure for agriculture real estate valuation
Abstract. Let us consider a problem of valuation of agricultural real estate. It is important to properly indentify their market value, which is determined by many factors. A detailed set of data on the properties that were the subject of the transaction is needed to accomplish this task. It is quite confusing in the case of agricultural land because the number of transactions in the local market is often not sufficient. The purpose of this paper is to present some method for multicriteria valuation of agriculture real estate. This technique is specifically created for situation in which limited information are available. It is a combination in valuation field of the Analytic Hierarchy Process (AHP) and Goal Programming (GP).
Key words: agricultural real estate, value of the agricultural real estate, Analytic Hierarchy Process (AHP), Goal Programming (GP), multicriteria agricultural valuation (MAVAM)
Introduction
Let us consider a problem of valuation of agricultural real estate. Suppose further definitions of valuation and the market value of the real estate taken in Poland are based on recommendations of The International Valuation Standards, European Valuation Standards and EU directives [Trojanek 2010]. The valuation is defined as the process of estimating value. The market value is defined as the price most likely to be concluded by buyers and sellers of a property that is available for purchase [Aznar et al. 2011]. Valuation of property (including agricultural property) is made within the local market and on the basis of information and transactions on the market. Therefore characteristics also have a local nature. Unfortunately, there are not always sufficient number of transactions that can be used for this purpose. This problem does not occur, of course, exclusively on the Polish agricultural real estate market. Appraisers in Spain are dealing with the same. It means, that on the agricultural real estate market in Spain there is also not always sufficient number of transactions that can be used for example for the valuation of property or for an analysis of prices on this market.
The purpose of this paper is to present method of valuation of agricultural land based on a combination of two multicriteria decision-making methods (i.e. the Analytic Hierarchy Process – AHP and Goal Programming – GP). This solution was created by J. Aznar, F. Guijarro, J.M. Moreno-Jimenez during the research projects of the Spanish Ministry of Education and Science. Proposed by them mixed AHP and GP procedure for multicriteria agriculture valuation has been designed especially for valuation in situation in which information are limited. The main objective of this technique is to extract the knowledge underlying the valuation process from specific characteristics. It could be used with intangible and scarce information. Authors illustrate proposed methodology by its
1 PhD, e-mail: [email protected]

88
applications to a valuation of a peach plantation in the La Riberta district in Valencia in Spain. They have only five comparable plantations which have been involved in recent transactions. It means, that it was not possible to use the comparative methods as they require quantitative information that was not available in this situation. Proposed methodology allowed them to work with tangible and intangible factors to determine the value of the subject peach plantation.
In the paper, the Spanish experience will be used for the valuation of an agricultural real estate located on Masovian voivodeship.
The Analytic Hierarchy Process (AHP)
The Analytic Hierarchy Process is the heuristic method which was developed by T. L. Saaty. It combines elements of decision theory and mathematics in its structure. This method is used to determine the weights of criteria and characteristics and to make optimal choices in multicriteria decision problems. It reduces complex decision problems to a series of pairwise comparisons. Those comparisons are made by experts to determine a numerical measure of the validity of the analyzed variants. It is important that these criteria and features may be in the form of both metric and non-metric (ordinal). AHP algorithm can be divided into six stages:
1. definition of the problem, 2. construction the hierarchical model, 3. pairwise comparison of the validity of decision elements at each level of the
hierarchy, 4. construction of vector of priorities for analyzed decision elements, 5. verification of the consistency of comparisons at each level of the hierarchy, 6. analysis of the results. The first stage includes a general definition of the problem, i.e. a determination
of a main goal and determination of a main criteria and a partial criteria. It also lays out what variants of these criteria will be analyzed. The main goal in the analysis of real estate is to prioritize aspects of the property, which affect its market value. The main criteria are properties that were traded on the local market with their prices. The sub-criteria are characteristics of properties and their values [Kozio – Kaczorek et al. 2011, Kozio – Kaczorek 2012].
The second stage includes construction of a multicriteria hierarchical tree structure. Main criterion is always at the top of the hierarchy. It consists of at least two but not more than seven sub-criteria. This principle is based on the fact that a man can compare with no mistakes, no more than 7 ± 2 objects [Kozio – Kaczorek et al. 2011, Kozio – Kaczorek 2012, Wysocki 2010].
In the third stage, following Saaty’s fundamental scale (Table 1) the expert incorporates their judgments through pairwise comparison of decision elements. A positive, reciprocal pairwise matrix is provided for each node of the hierarchy.
The fourth stage includes construction of a vector of priorities for analyzed decision elements.
The two last stages include the verification of the consistency of comparisons at each level of the hierarchy and the result analysis [Aznar et al. 2011, Kozio – Kaczorek et al. 2011, Kozio – Kaczorek 2012].

89
Table 1. Saaty’s fundamental scale
Numerical scale Verbal scale
1 Same importance
3 One item moderately more import ant than another
5 One item significantly more import ant than another
7 One item moderately much more import ant than another
9 One item moderately very much more import ant than another
2, 4, 6, 8 Intermediate situations
Source: own study based on literature [Kozio – Kaczorek et al. 2011, Kozio – Kaczorek 2012].
AHP enable to incorporate the tangible aspect with the intangible by means of using paired comparisons in an agricultural valuation procedure [Aznar et al. 2011].
Goal programming (GP)
The Goal Programming (GP) is an extension of linear programming. It is mathematical nonlinear programming which can be easy linearized. It focuses on the idea of achieving a number of goals at the same time. Decision-maker formulates its objectives by specifying the desired values of the analyzed criteria. The main task of goal programming is to find a best solution. The ideal solution is a solution in which all the conditions are satisfied. A lot of variants of GP exist in literature. In this paper two of them are applied: Weighted Goal Programming and MinMax.
The form of the basic model for WGP is:
,0,0,0
,,1,0)(
,,1ˆ)( ,
1]1[
jj
i
jjjj
r
jjjjix
ddx
mixg
rjzddxz
ddzMin
(1)
where and denotes, respectively, the negative and positive deviations with respect to the j-th goal ( ). Let be a normalisation factor. The model includes m strong constrains that determine feasible region i.e. and r weak constrains for the goals considered ( . The valuation of real estate adopted as the goal vector with the price observed for each of agricultural estate comparable to the subject one. The form of the valuation function is:
,,,1,)(1
0 rjxaaxzn
l
jll
j (2)

90
where denotes the relative value in the -th criterion of the -th agricultural real estate, and denotes estimated parameters of the model. The contribution of each criterion is in additive form. Note that, since the values are already normalised in the distribution mode, there is no need for normalisation factor, so is taken [Aznar et al. 2011].
The basic model for MinMax uses L - metric to obtain the best solution. The form of this model (symbols are the same as in WGP) is:
.0,0,0
,,1,0)(
,,1,
,,1ˆ)(
max
max
,
max]1[
jj
i
jj
jjjj
jjjx
ddx
mixg
rjddd
rjzddxz
dddzMin
(3)
GP enable to include both the scarce information available (objective) and the individual appraiser’s attitude with regards to the valuation process (subjective) [Aznar et al. 2011].
Multicriteria agricultural valuation method (MAVAM)
The multicriteria agricultural valuation method (MAVAM) is a combination if the AHP’s hierarchical modelling and Goal Programming (GP). It is their combination in the valuation field, particularly, in the estimation of the linear regression model used to obtain the monetary values of agricultural real estate. MAVAM algorithm can be divided into three stages [Aznar et al. 2011].
The first stage involves the use of AHP to quantify the subjective information about the elements being compared. The appraiser defines the set of factors that determine the value of agricultural real estate in the local market. The main goal is to prioritize this factors. Using pairwise comparison matrices and Saaty’s fundamental scale [Aznar et al. 2011, Kozio – Kaczorek at al. 2011, Kozio – Kaczorek 2012], the expert measure the importance of the explicative variables in the set of comparative assets.
The second stage involves the use of a relative regression model (2) to obtain the market value of agricultural real estate. This relativity of the models derived from relative values assigned by AHP for the explicative variables. The GP is used to estimate the regression parameters in two different cases. First one is a L1 norm, which is the Manhattan norm. This norm incorporates the scarce information available into the model. The second one is a L norm, which is the Tchebychef norm. This norm captures the subjective attitude with respect to the valuation process. That is, the greater the distance between the compared elements contribute to the greater subjectivity of the assessment. Furthermore, they “allows consideration of the proximity of the subject asset to one of the comparable sets of assets that does not follow common or majority behaviour”. These norms are used to determine the objective function to be optimised [Aznar et al. 2011].

91
The last stage involves the final valuation of the agricultural real estate. The market value is as a result of a convex combination of two values obtained in stages two and three for the L1 and L norms [Aznar et al. 2011]. The formula of the market value is:
]1,0[),()()1()( 1 XVXVXMAVAM (4)
where )(1 XV and )(XV are the L1 and L values. The choice of level of depends on the expert. If = 1, it means that the valuated property is very similar to the properties of a fixed set of comparable properties. On the other hand, if = 0, this means that the valuated properties is significant different from the properties of a fixed set of comparable properties [Aznar et al. 2011].
Valuation of agricultural real estate
The above described methodology was applied to the valuation of agricultural real estate from Masovian voivodeship. This property is located in the rural part of the municipality of Ostrow Mazowiecka and it is undeveloped farmland. The date used in previous analysis were obtained from local real estate market on the municipality of Ostrow Mazowiecka and they related of property that were the object of market transaction. The set of data contained information about transaction price, area, localization, the position as regards the habitat parcels, the shape of the plot, the bonitation and production capacity, the variety of types of soil area and the quality of the access road. Analysis carried out is described below.
The first stage of valuation process was application of AHP to determine the weights of characteristics of property. A detailed description of the analysis presented in the publication Kozio – Kaczorek et al. 2011. The main aim of this paper was hierarchisation of characteristics of the property.The main criteria were properties that were traded on the local market with their prices. The set of real estate on this market, which were comparable with valuated one (X), included four objects: a real estate with a minimum price (A), a real estate with a price somewhat below average (B), a real estate with a price somewhat above average (C), a real estate with a maximum price (D). All of them were undeveloped agricultural land with the similar area. The sub – criteria were characteristics of property and their values. The set of features relevant to the value of the property there were included: the position as regards the habitat parcels, the shape of the plot, the bonitation and production capacity, the variety of types of soil area, the quality of the access road. It was established by analysis of the local market and the appraiser knowledge. Weights obtained as a result of the analysis are presented in the Table 2. (for the details of the analysis see Kozio – Kaczorek et al. 2011.
Table 2. Weights of characteristics of property
Characterisctics A B C D X
the position as regards the habitat parcels 0,305 0,290 0,295 0,296 0,297
the shape of the plot 0,160 0,155 0,157 0,153 0,156
the bonitation and production capacity 0,276 0,280 0,278 0,278 0,278

92
the variety of types of soil area 0,116 0,124 0,122 0,124 0,121
the quality of the access road 0,143 0,151 0,148 0,148 0,147
Source: Kozio – Kaczorek et al. 2011
The next stage contains WGP and MinMax applications for estimating the regression (2) parameter. In the current analysis, the form of the regression model is:
4,3,2,1)( 55443322110 jxaxaxaxaxaaxz jjjjjj (5)
where denotes weight of -th characteristics of -th agricultural real estate and )( jxzdenotes their prices. Obtained parameters are used to calculate the values of assessed property by:
WGP: V[1](X) = 11 526,18 PLN Ha-1,MinMax: V[ ](X) = 10 602,48 PLN Ha-1.
This means that, the value of the valuated agricultural real estate (X) is within the range (10 502,48; 11 526,18) PLN Ha-1 defined by the expression (4). The obtained value is similar to the average value of 1 Ha on the considered local agricultural real estate market.
Conclusions
Some result of valuation of agricultural real estate, located on Masovian voivodeship, is presented in the paper. Because of the problem with insufficient number of transactions on this local agricultural real estate market it was not possible to use usual valuation method. Therefore, described above method (MAVAM) was used in the process of valuation. It is the appropriate solution for situations with a lack of information and a limited number of transactions. This technique is a mixed method that combines two multicriteria methodologies i.e. Analytic Hierarchy Process (AHP) and Goal Programming (GP). The AHP enables to quantify qualitative variables and include the weight of the importance of preferences. The GP captures the information from the limited information and the attitude of the appraiser in the valuation process. The comparable data have been quantified in the mixed valuation method itself and in such a way that the value obtained is a function of all the data used and it is also a function of their importance or weighting. The calculated value range enables the expert to define the final value. It is depending on whether the comparable data of valuated properties are the average of the reference values or are closer to the distant asset. Aznar et al. [2011] proposed it for Spanish agricultural real estate market, but this procedure suits also for Polish real estate market. The obtained value of the valuated agricultural real estate (X) is within the range (10 502,48; 11 526,18) PLN Ha-1. The market value is close to the average value from considered local market.
References
Aznar J., Guijaro F., Moreno-Jiménes J.M. [2011]: Mixed valuation methods: a combined AHP-GP procedure for individual and group multicriteria agricultural valuation. Annals of Operations Research, 190.01, 221–238;

Kozio –Kaczorek D., Parli ska M. [2011]: Zmienne decyduj ce o warto ci rynkowej nieruchomo ci rolnej z zastosowaniem AHP. Roczniki Naukowe Stowarzyszenia Ekonomistów Rolnictwa i Agrobiznesu, 13.2, 236-239;
Kozio –Kaczorek D. [2012]: Hierarchizacja cech nieruchomo ci z zastosowaniem Analitycznego Procesu Hierarchicznego. Journal Of The Polish Real Estate Scientific Society, 20.1, 165–174;
Trojanek M. [2010]: Methodic of estate valuation In Poland – actual status. Economics and sociology, 3.1, 66–75; Wysocki F. [2010]: Metody taksonomiczne w rozpoznawaniu typów ekonomicznych rolnictwa i obszarów
wiejskich. Uniwersytet Przyrodniczy w Poznaniu, Pozna .

94
Monika Krukowska1
Department of Political Studies Warsaw School of Economics
European Investors and Land Acquisitions in Sub-Saharan Africa
Abstract. The article examines the European share in large-scale land acquisitions in Sub-Saharan Africa. The paper aims to identify correlation between biofuels policy and large-scale land acquisitions in Sub-Saharan Africa and the consequences of this phenomenon. It first identifies the backgrounds that caused the increased interest in biofuel production and, consequently, African land acquisition in recent years. Then, it examines growth in the number of land transactions that take place on the continent. Finally, the paper investigates the share of European capital in land transactions. The last section outlines the consequences of this phenomenon and provides a set of recommendations to address land policies in African developing countries.
Key words: European Union, Africa, large-scale land acquisitions, agriculture, investment, biofuels
Introduction
Within the last decade Sub-Saharan Africa has witnessed numerous large-scale land acquisitions. Foreign investors, attracted by cheap and fertile land, simple and short acquisition procedures, high political risk notwithstanding, have been buying huge land areas in developing states of Sub-Saharan Africa. The land acquired is used to cultivate food and industry crops, depending on investors’ needs. The largest buyers come from the European Union, the United States, as well as from the Gulf States of the Middle East. Though there are many reports and analyses of the issue, the exact scale of this activity remains unknown due to lack of information and aggregate data.
Within the last decades rising oil prices combined with shrinking resources of fossil fuels, as well as policies of promoting biofuel use, have led to growing demand and consumption of biofuels (esp. ethanol and biodiesel), which is projected to increase in the next decade. Due to limited land conversion possibilities in Europe, this expansion in demand may be covered only by considerable biofuels feedstock imports.
Large-scale land transactions in developing countries have attracted widespread attention. According to the World Bank estimates, in 2009 foreign investors acquired 32 million hectares (ha) of land in Africa, out of the total of 45 million ha purchased worldwide [Rising... 2011]. The International Food Policy Research Institute (IFPRI) evaluated in 2008, that from 15 to 20 million ha had been involved in purchases and lease transactions in recent years [Land... 2009]. Estimates of the Worldwatch Institute posit, that in the period of 2000-2012 about 70.2 million ha of agricultural land worldwide was sold or leased by public or private investors [Scherer 2012]. According to the Land Matrix, the most complete public database existing, in 2012 the number of land transactions made by foreign investors reached 1,217 deals, covering 83.2 million ha. [Transnational... 2012].
1 PhD, e-mail: [email protected]

95
The objective of this paper is to analyse the reasons, scope, methods and consequences of European large-scale land acquisitions in Sub-Saharan Africa. The comparative analysis of available databases should allow an estimate of the share of European investors in this phenomenon and its geographic distribution. The paper aims to present possible economic, environmental and social consequences of biofuel-linked European investments in African developing countries, as well as identify negative and positive effects on African agriculture. The paper concludes with a summary of the major findings as well as possible improvements in this area.
Biofuels and Large-Scale Land Acquisitions in Africa
For the needs of this essay large-scale land acquisitions are purchases or leases of agricultural land on a scale disproportionate in size when compared to average land holdings in the region [Land... 2010]. Due to its high specificity, land deals differ in size (usually at least 200 ha [Transnational... 2012]) and legal structure (purchase or lease), duration and other contract details. A large number of intended transactions is not finalised, and in many cases investors are granted only a small share of what they applied for.
The exact number and value of land transactions worldwide remains unknown as there is no aggregate and reliable data provided by host governments or investors, and the estimates of research agencies and institutes vary significantly. Lack of transparency is one of the biggest problems of land deals, especially with regard to the actual implementation status of the contracts. Even more challenging is the attempt of determining the actual use of land acquired, as investors tend to report the cultivation of crops for multiple uses (for food or biofuels production). Evidence suggests that only 20% of investments that have been announced are actually being followed with agricultural production on the ground [Rising... 2011].
Foreign investors are interested in African land due to rising fossil fuel prices, shrinking land resources at home and rising global demand for food, food commodities and biofuels feedstock. In less than one decade, world biofuel production has increased five times, from less than 20 billion litres/year in 2001 to over 100 billion litres/year in 2011 [Biofuels... 2013]. International organisations, such as the International Energy Agency (IEA), Organisation for Economic Co-Operation and Development (OECD) or Food and Agriculture Organisation of the United Nations (FAO) share the conviction that global biofuel demand will increase significantly within the next decade [Technology... 2012, OECD-FAO 2013], pointing to the EU as the biggest biodiesel producer and consumer, and the third ethanol market after the US and Brazil. Within the next decade the EU is supposed to reach a 7% share in world ethanol production and 10% share in consumption. As regards biodiesel production and use, the EU is leading in both: it is expected to reach a 45% share in world production and 51% share in consumption by the year 2022 [OECD-FAO 2013].

96
Fig.1. EU ethanol production and consumption in 2000-2012 (bnl)
Fig.2. EU biodiesel production and consumption in 2000-2012 (bnl)
Source: data from OECD-FAO Agricultural Outlook 2013-2022
Source: data from OECD-FAO Agricultural Outlook 2013-2022
Africa’s biofuel production is insignificant in global supply. In 2011, the whole African continent produced less than 23,000 tons of oil equivalent of biofuels, constituting 0.04% of the total global supply [BP 2013]. In Africa most biofuel crops are exported for processing, meaning little value added is captured locally [Land... 2011].
Bioethanol production in the EU is based mostly on sugar beet derivatives, wheat, and corn but also on barley and rye. Biodiesel feedstock is rapeseed oil (2/3), as well as soybean and palm oil. EU imports ethanol mainly from Brazil [Renewable...] and some share is expected to be supplied through preferential trade measures (GSP), mainly from Guatemala, Peru and Pakistan [EU... 2013]. Other suppliers are: Nicaragua, Bolivia and Costa Rica. Only very small amounts of ethanol are shipped from Congo, South Africa, Swaziland, and Zimbabwe [Assessing... 2013]. European biodiesel imports come mostly from Argentina, Indonesia and Malaysia.
The European demand for biofuels is driven by policy and renewable energy targets accepted by the European Union. Under Directive 2003/30/EC on the promotion of the use of biofuels or other renewable fuels for transport, EU established the goal of reaching a 5.75% share of renewable energy in transport fuel by 2010 [Directive... 2003]. In 2009 the Renewable Energy Directive 2009/28/EC (RED) put on member states obligation to achieve a 20% share of energy from renewable resources in total energy consumption, and a 10% share in the transport sector by the year of 2020. Considering net GHG emissions and food security, the RED called for GHG reduction a minimum of 35% and in new plants in 2018 by 60 % [Directive... 2009]. Thus, to achieve biofuels targets, European countries strengthen cooperation with important biofuels producers, increase the biofuels feedstock yield levels, target prospective partners in Sub-Saharan Africa and buy land so as to produce biofuels by themselves. The EU estimates that 20-30 million hectares is needed to meet its target of 10% biofuel use by 2020. It expects 60% of its supplies will be grown outside its borders [Land... 2011, Assumptions... 2010].
0
2
4
6
8
1020
0020
0120
0220
0320
0420
0520
0620
0720
0820
0920
1020
1120
12
production consumption
0
5
10
15
2000
2001
2002
2003
2004
2005
2006
2007
2008
2009
2010
2011
2012
production consumption

97
The European Investment in African Land
Africa is a natural direction of European expansion due to its proximity, fertile land, water resources, favourable weather conditions, and historic relations connecting European and African states. There are many factors that distinguish Africa as good prospective investment place. Of utmost importance is stable political and economic environment in the majority of African countries, making foreign companies prone to invest. The accessibility of African markets is also very important. Host governments are usually eager to cooperate, possible objections from local communities are of minor importance, as foreign investors have supremacy over the rights of individual landowners. This is possible as land tenure systems in many African countries are flexible enough to allow sometimes dubious procedures of acquisition [Land... 2011].
Land deals are very difficult to trace due to their specific nature and the subject they refer to. Often the agreements are signed but not implemented due to different reasons. The area actually ceded to investors may be smaller or bigger than the one mentioned in the contract. Investors usually secure the rights to acquire more land in the unspecified future, so in consequence there is no absolute certainty about the real number of hectares handed over to new owners. Information about signing the deal is usually made public, while there is no follow up about the implementation of the contracts. Furthermore both investors and host governments are usually unwilling to reveal the details of the contracts [Cotula 2011]. This inaccuracy undermines the reliability of existing records and makes them difficult to compare.
The Land Matrix The most thorough and aggregate data about land transactions is provided by the Land
Matrix, an online public database created by The International Land Coalition (ILC), The Centre for Development and Environment (CDE), CIRAD, the GIGA German Institute of Global and Area Studies, as well as The Deutsche Gesellschaft für Internationale Zusammenarbeit (GIZ). The Land Matrix report defines detailed criteria for inclusion into the database: transactions need to entail a transfer of rights to use, control or own land through sale, lease or concession, cover an area of 200 hectares or more (each), involve the conversion of land from local community use or important ecosystem service provision to commercial production and be international in nature (involve a foreign investor). Only transactions that have been concluded since 2000 are taken into account [Transnational... 2012].
According to the Land Matrix data, in 2000-2013 (June 2013) the European investors concluded2 150 land contracts with Sub-Saharan countries for the area of 5,659,745 ha (out of 47,915,235 ha of global land purchases). Investors seem to concentrate on two African regions with huge agricultural advantages and potential: Western and Eastern Africa, with only minor contracts in central parts of the continent. Specificity of agricultural investments (need of fertile land, water resources, etc.) restrains investors to look for the best deals no matter where they are located, though there are some tendencies to restrain to traditional partners (e.g. Portugal investing in former colonies: Angola and Mozambique). European land investments concentrate in seven countries (Mozambique, Sierra Leone, Liberia, Madagascar, Ethiopia, Tanzania and Mali), which account for 77% of the total area 2 In my estimates I took into account only concluded transactions (oral agreement or contract signed). Data used for calculations are real contract sizes, not intended size of purchase.

98
acquired. Mozambique is the most popular place of investment, as 34 purchases for the amount of 1,206,952 ha were concluded, followed by Sierra Leone (836,295 ha) and Liberia (693,820 ha).
Fig.3. Sub-Saharan land acquired by European investors in 2000-2013 (ha).
Source: data from the Land Matrix.
The United Kingdom is the major European investor, accounting for 33% of all investments in the region. Its deals are evenly spread across the whole continent, where it has concluded 44 contracts for the amount of 1,863,757 ha. British investments concentrate on biofuels feedstock production (jatropha, oil palm, maize, sugar cane, sorghum), which covers the area of 1,011,211 ha (57% of UK investments). The most important European investors, beside the UK, are Italy (14.2%), Sweden (10.8%), the Netherlands (10.8%), France (9.5%) and Norway (8.4%). Altogether 6 biggest investors account for 86.8% of European investments in Sub-Saharan Africa. British supremacy was also confirmed by other sources, e.g. the Guardian investigation [Carrington 2011].
Following the British example, biofuels feedstock constitutes important share in European production in Africa, especially in case of Portugal (93%), Belgium (84%), Germany (78%), the Netherlands (56%), and France (50%). Small countries, like Cyprus or Denmark give full attention to biofuels feedstock production. Investment in forestry is another important area, especially in case of Italy (60% of total land area), Norway (56%), Sweden (55%) and the Netherlands (43%).
UK33%
Italy14%Sweden
11%The Netherlands
11%
France10%
Norway8%
Portugal4%
Germany3%
Belgium3%
Switzerland1%
Cyprus1%
Others1%

99
Fig.4. European Land Investments in SSA in 2000-2012 (%).
Source: data from the Land Matrix.
According to the Land Matrix statistics, European investors have the biggest share in land deals in Sub-Saharan Africa (22%), though American investments are not much smaller (20%). Taking into consideration the number of European countries involved, their share is not significant.
Fig.5. Purchases of land in Sub-Saharan Africa in 2000-2012: breakdown by area (%)
Source: data from the Land Matrix.
Mozambique23%
Sierra Leone16%
Liberia13%
Madagascar11%
Ethiopia5%
Tanzania5%
Mali5%
Benin4%
Burkina Faso4%
Zambia3%
Gabon2%
Guinea2%
Cameroon1%
Ghana1%
Angola1%
Others3%
Europe22%
USA20%
Sub-Saharan Africa11%
Gulf States & North Africa
15%
China1%
India6%
Others25%

100
European investment in land reached a peak in 2010 and then considerably decreased. After only one transaction in 2012, there should be no expectation of future significant investments from Europe.
Grain Grain, a non-profit organisation, gathers information about transnational land
investments for biofuel feedstock production. As in case of the Land Matrix, the data is reliable only partly. According to Grain, the size of land acquisitions for biofuels in Africa should be estimated at 7,551,056 ha, and total world land transactions for biofuels close with the amount of 17,179,423 ha. Grain estimates confirm the preponderance of European investors, standing behind 3,925,441 ha in Africa only, with an additional 415,700 ha in Latin America (Brazil, Argentina, Guatemala), 61,600 ha in Europe (Ukraine), and 775,000 ha in Asia (Philippines, Indonesia and Malaysia) [http://www.grain.org/].
Fig.6. European land purchases in Sub-Saharan Africa (2000-2012) thousands of ha
Source: data from the Land Matrix.
According to Grain, European investments are concentrated in Eastern and Western Africa, as well as in central parts of the continent (e.g. Angola and Cameroon). Investments from Italy dominate in Africa, totalling 1,545,592 ha. According to Grain data, only one company Nuove Iniziative Industriali SRL cultivates jatropha in four countries: Guinea (700,000 ha), Ethiopia (30,000 ha), Kenya (50,000 ha), and Senegal (50,000 ha). Other Italian companies, e.g. Fri-El and ENI grow oil palm in Congo, Angola, Ethiopia and Nigeria [http://www.grain.org/].
A second European investor, the United Kingdom, controls 1,005,148 ha. British companies are present in eight countries: Ethiopia, Ghana, Liberia, Madagascar, Sierra Leone, Tanzania, Zambia, with special focus on Mozambique, where they have sugar cane plantations of CAMEC (30,000 ha), and Principal Capital (18,000 ha), as well as jatropha plantations of D1 Oils (5,348 ha), Sociedade Inveragro SARL (ESV Group) (11,000 ha),and Viridesco (1,000 ha) [http://www.grain.org/]. One of the biggest British investments belonged to Crest Global Green Energy, which established large jatropha and pongamia plantations of 900,000 ha in Mali, Guinea and Senegal. However the company was dissolved in 2012 [https://www.duedil.com/company/06858479/crest-global-green-energy-limited].
63 3 7
14152
128
109
513410
977
1227
122
20
200400600800
100012001400
2000 2001 2002 2003 2004 2005 2006 2007 2008 2009 2010 2011 2012

101
French investments reported by Grain are considerably smaller, equalling 49,805 ha. However Grain’s listing has no data about the French Group Bolloré, one of the most important global agribusiness investors, with purchases in 43 African states. Group Bolloréhas shares in other companies, such as Belgian Group Socfin (38.7% of shares), also active in the African land market. The group reported its African land possessions in 2012: oil palm and rubber plantations in Cameroon (8,800 ha), Nigeria (16,400 ha), Ivory Coast (23,000 ha), as well as an oil palm plantation in Cameroon (33,900 ha) with a refining unit Ferme Suisse [Résultats... 2013].
Portuguese investments total 259,734 ha and concentrate in Mozambique and Angola. Portugese Quifel Agribusiness is the largest foreign agricultural investor of Sierra Leone, where it has 130,000 ha in three sites. In Angola Quifel grows oil seeds (10,000 ha), and in Mozambique Quifel Agricola owns 23,000 ha of oil seeds and sunflower [http://www.gleinol.pt/401.html; Quifel... 2011].
Grain identifies eight Dutch investments in Africa, all cultivating jatropha, totalling 28,312 ha. The area covered by single investment is rather small, between 1,000-3,500 ha, with the exception of Madagascar plantation (15,000 ha). Other European countries have single agribusiness investments in Sub-Saharan Africa. There are only two Norwegian projects, both in Ghana, and their combined size is very modest: 11,550 ha. Swedish-owned sugar cane plantation of 200,000 ha is located in Tanzania. Cyprus has reportedly acquired 50,000 ha in Ethiopia (F.E.P.E Amero Bio-Oil) and Spain possesses Biocongo Global in Democratic Republic of the Congo (60,000 ha) – these are the only African land investments of these countries. Romanian Ovidiu Tender has land in Gambia (30,000 ha) and Senegal (100,000 ha). Danish I.D.C Investment possesses 15,000 ha of jatropha plantation in Ethiopia and 1,000 ha in Mali (MFC Nyetaa).
Oakland Institute An American policy think tank, Oakland Institute (OI), has prepared very thorough
analyses of foreign investments in land in five African countries (Mali, Sierra Leone, Tanzania, Mozambique and South Sudan). The choice is very interesting, as the previous estimates show that Sierra Leone and Mozambique are very popular among European investors. However OI estimates differ significantly from the previous analyses, which seem to be much overestimated.
Table 1. European investments in land for biofuels (ha)
Mali Sierra Leone Tanzania Mozambique South Sudan
The Land Matrix 236,700 836,295 237,980 1,206,952 20,490
Grain 45,817 307,200 652,835 469,332 600,000
Oakland Institute 22,600 214,475 150,287 52,920 na
Source: [http://www.grain.org/, Understanding... 2011].
The difference in this table proves the inaccuracy in possible listings of land deals due to lack of public records, restricted information, and the reluctance of entities engaged in transactions to reveal not only the details, but also the basic data from the contracts. European investors are present in the continent, but their acquisitions are comparable with purchases of investors from the US or the Gulf States.
102
The Consequences of Investments
The effects of European large-scale land deals are diverse. Of utmost importance is its indisputable negative impact on African farmers and pastoralists. Although the land sold or leased to foreign investors is considered abundant, in most cases it is cultivated by individuals or the whole communities. As the land tenure system in Africa is very unclear, and in many countries the land is a public good, host governments may dispose of it without consent of local communities. As foreign investors have much better levers than poor farmers, the latter are forced to move to new locations to allow the government to lease or sell the land. Displaced people settle in assigned, sometimes remote places, often deprived of all basic services and, most surely, with much less fertile land. In consequence their living standard deteriorates and some of them decide to migrate abroad.
Very important, yet underestimated, is the situation of African women. Lack of land equals lack of food and the possibility of earning money and feeding children. Even though women usually cultivate the land, they are not the owners, and cannot get any compensation for the land taken. In all cases the compensation received from foreign investors is usually small.
Influx of European money may reinforce negative autocratic tendencies in some African countries. Host governments may also use foreign investments as excuses to reach questionable political goals (e.g. European land acquisitions are linked with the new villagisation programme of reallocation of 1.5 million rural families in Ethiopia [Chonghaile 2013]).
There are also positive consequences of investments. Under contract provisions, investors finance social commitments, e.g. construction and maintenance of hospitals and schools. Foreign companies improve local employment possibilities, both permanent and seasonal, and acquaint African workers with modern agriculture. Transfer of technology and know-how is specifically included in transaction agreements, as Africa has still the capacity to improve and develop farmland productivity. Thanks to foreign investment, local farmers reduce their vulnerability to price fluctuations and increase financial stability by switching to new product (e.g. jatropha) in areas dominated by traditional crops.
Economic development is fostered due to institutional and regulatory reforms implemented by host governments. Modern registration and cadastre systems are introduced, business regulatory practices improved (e.g. trade procedures, property registration). Within the last years African governments have made considerable efforts, as in 2012 alone Sub-Saharan countries have introduced more than 9 reforms on average [Doing... 2013].
Possible consequences depend also on the crops cultivated by foreign companies. Increased cultivation of biofuels feedstock affects the global food market, as smaller production of subsistence crops may cause supply problems that cannot be solved without adapting new territories or increased productivity on available land, both not easy to resolve. Land conversion decreases environment diversity (e.g. deforestation, draining wetlands) and causes greenhouse gas (GHG) emission growth when carbon locked in the soil is emitted to the atmosphere. Hence, expectations that thanks to increased production of biofuels feedstock the carbon emissions will be reduced have also turned out to be false. There is widespread disagreement whether countries with food shortages should sell or lease land for biofuel production, as shrinking production of subsistence crops raises the price of alimentary products, already high after the 2007-08 growth [Rising... 2011] .

103
European gains of land transactions are much more evident. Investors get access to land and its crops, and processing them at home increases job creation. The transactions are of minor risk and the gains are certain. Of utmost importance is the impact that European investment exerts on its African partners [Biofuels... 2008]. As financial incentives shared by foreign investors are very difficult, if not impossible, to overcome, international aid and environmental organisations call for reducing the limits of biofuels required, to prevent the rise of food feedstock prices and attain food security. Following the demands, in October 2012 the EU Commission (EC) reconsidered the requirements concerning the use of biofuels produced from food crops, and published a proposal to limit the 10% renewable energy target to 5% [Proposal... 2012]. The EC declared it would also take into account the extra carbon emitted when farmers switch from growing crops for food to growing crops for fuel. The proposal still has a long way ahead until being accepted and implemented (probably not before 2015), but the situation should improve, as investors attentively follow the EC policy.
Conclusions
Growing interest in African land has made public opinion aware of the continent’s food security concerns. Widespread debate over the outcomes of this phenomenon was strengthened by its dubious character stemming from lack of reliable information.
Due to incomplete data even now we cannot assess this process in full. Yet available numbers show the preponderance of European investors encouraged by the biofuel limits introduced, as well as the Common Agricultural Policy making biofuel production in Europe too expensive. European demand for land is likely to continue, although not on the 2009-10 levels. As land sales can be detrimental to food security and economic development of the world’s poorest countries, some countermeasures should be adopted. The European Commission should reduce the biofuel targets, as well as exert pressure on foreign companies operating in Africa to assure decent compensation for displaced people and to dedicate some output to cover the demands of African internal markets. African governments should develop domestic processing capabilities and motivate foreign investors to move their processing facilities to Africa. They should also better protect their citizens’ rights by introducing stronger legal protection of people, land and resources, and they should adopt a more pro-citizen attitude, to better serve the public interest. Prudent and limited foreign investment may be a fruitful enterprise for both sides.
References
Assessing the impact of biofuels production on developing countries from the point of view of Policy Coherence for Development, Contract N° 2012/299193, FWC COM 2011 - Lot 1 – Studies and Technical Assistance in all Sectors, Final report. [2013]: European Commission. Brussels. p.71.
Assumptions in the European Union biofuels policy: frictions with experiences in Germany, Brazil and Mozambique. [2010]. Franco J., Levidow L., Fig D., Goldfarb L., Hönicke M., Mendonça M.L. Journal of Peasant Studies, 37(4), p. 661–698.
Biofuels and food security. [2013]: A report by the High Level Panel of Experts on Food Security and Nutrition of the Committee on World Food Security, Rome 2013. HLPE. p.

Biofuels for all? Understanding the Global Impacts of Multinational Mandates. [2008]. Hertel T.W. (ed.), Tyner W.E., Birur D.K. GTAP Working Paper No. 51. Center for Global Trade Analysis. Department of Agricultural Economics. Purdue University. p. 27-28.
BP [2013]: Statistical Review of World Energy. http://www.bp.com/statisticalreview. Retrieved April 2, 2013. Carrington D., Valentino S. [2011]: Biofuels boom in Africa as British firms lead rush on land for plantations. The
Guardian. http://www.theguardian.com/environment/2011/may/31/biofuel-plantations-africa-british-firms. [Retrieved October 29, 2013].
Chonghaile C.N. [2013]: Ethiopia's resettlement scheme leaves lives shattered and UK facing questions. TheGuardian.
Cotula L. [2011]: Land deals in Africa: What is in the contracts? IIED. London. p. 1. Directive 2009/28/EC of the European Parliament and of the Council of 23 April 2009 on the promotion of the use
of energy from renewable resources and amending and subsequently repealing Directives 2001/77/EC and 2003/30/EC. [2009]: European Parliament. p. 28-36.
Directive 2003/30/EC of the European Parliament and of the Council of 8 May 2003 on the promotion of the use of biofuels or other renewable fuels for transport. [2003]: European Parliament. p. 45.
Doing Business 2013. Smarter Regulations for SME. [2013]: World Bank. EU Biofuels Annual 2013. [2013]. Flach B., Bendz K., Krautgartner R. and Lieberz S. GAIN. p.18. Land Grab study. [2010]. Graham A., Aubry S., Künnemann R., Monsalve Suárez S. FIAN. p. 17. Land Grab? The Race for the World’s Farmland. [2009]. Kugelman M., Levenstein S.L. IFPRI. p. 1. Land tenure and international investments in agriculture. A report by the High Level Panel of Experts on Food
Security and Nutrition of the Committee on World Food Security. [2011]: HLPE. Rome. p.20. Land Matrix database. http://landportal.info/landmatrix/get-the-detail/by-target-region. Retrieved April 2, 2013. OECD-FAO Agricultural Outlook 2013. [2013]: OECD Publishing. Proposal for a Directive of the European Parliament and of the Council amending Directive 98/70/EC relating to
the quality of petrol and diesel fuels and amending Directive 2009/28/EC on the promotion of the use of energy from renewable sources. COM(2012) 595 final. [2012]: European Commission. Brussels. p. 14.
Quifel International Holdings in Sierra Leone. Understanding land investment deals in Africa. [2011]: Oakland Institute.
Renewable Ethanol in the European Union. ePURE. Brussels. p.2. Résultats 2012. [2013]: Bolloré. Rising Global Interest in Farmland: Can it yield equitable and sustainable benefits? [2011]. Deininger K., Byerlee
D., Lindsay J., Norton A., Selod H. and Stickler M. The World Bank. P. XXV. Scherer C. [2012]: Despite Drop from 2009 Peak, Agricultural Land Grabs Still Remain Above Pre-2005 Levels.
Worldwatch Institute. http://blogs.worldwatch.org/nourishingtheplanet/wp-content/uploads/2012/08/Land-Grabs-VSO-Press-Release_FINAL.pdf. [Retrieved October 21, 2013]. p.1.
Technology Roadmap. Bioenergy for Heat and Power. [2012]: International Energy Agency. Transnational Land Deals for Agriculture in the Global South. Analytical report based on the Land Matrix
Database. [2012]. Anseeuw W., Boche M., Breu T., Giger M., Lay J., Messerli P. and Nolte K. Bern/Montpellier/Hamburg. p. 19.
Understanding land investment deals in Africa. Country reports: Mali, Tanzania, Sierra Leone, Mozambique, South Sudan. [2011]: Oakland Institute.
Internet sources
http://www.duedil.com/company/06858479/crest-global-green-energy-limited. [Retrieved April 10, 2013.] http://www.gleinol.pt/401.html. [Retrieved March 10, 2013.] http://www.grain.org/. [Retrieved April 10, 2013.]

105
Julian T. Krzy anowski1
Department of Agricultural Economics and International Economic Relations Warsaw University of Life Sciences – SGGW
Small, young, active – some new elements of the CAP reform
Abstract: The paper deals with some new elements in the CAP reform. The author presents support scheme for small farmers, young farmers and active farmers. The latter three are crucial in the subsequent reform of the Common Agricultural Policy.
Key words: agriculture, Common Agriculture Policy, international competitiveness of agricultural products.
The EC’s Communication on ‘The CAP towards 2020’ outlined new instruments for the future CAP and launched a formal debate with other European institutions, with Member States, with farmers and with members of the public. All those events were followed by a set of legislative proposals which have to be adopted in the near future. Among those new instruments were some new schemes: for small farmers, young farmers, but foremost for active farmers. The aim of this short paper is to present those ideas and to show their economic implications.
Support scheme for small farmers
The EU agricultural sector is characterized by a very high number of small farms (more than 70% have less than 5 ha). These farms are heterogeneous with respect to socio-economic characteristics of farm holders, the farm asset base, the availability of non-farm incomes, and therefore their capacity to stay or become viable and flourish.
Many small farms may be unprofitable and uncompetitive from an economic perspective. Yet, they are of crucial social importance in certain Member States and rural regions where they make a significant contribution to employment, to the maintenance of viable areas and to cultural heritage.
Furthermore, small farms are important for the provision of public goods. Practices applied by small-scale farmers vary a lot across the EU but generally small farms play an important role in maintaining a varied landscape with a diverse pattern of perennial, natural and planted vegetation. This variety, when accompanied by the presence of retained landscape features such as field margins, hedgerows, stonewalls, meadows, small woods and watercourses, is valuable for biodiversity through ensuring connectivity between semi-natural habitats and cultivated areas. It also contributes to the resilience of the landscape in the face of climate change.
In the face of these pressures on the one hand, and the important contribution of small farms to social and environmental objectives on the other, support structures need to be in place that allow small farms to survive and develop. Although at present, there are already some rules aimed at relieving smaller structures and Member States administrations from some administrative costs related to cross-compliance (e.g. with respect to the de minimis
1 PhD, associated professor, e-mail: [email protected]

106
rule or hygiene regulation), the administrative burden on small farmers is in general disproportionately high in relation to the amount of support they receive.
A specific scheme for supporting small farmers would acknowledge the contribution such farms make to rural areas and the environment. It could allow small farms to restructure, diversify and increase their competitiveness, e.g. by exploring new local market opportunities and providing specific regional products. To achieve this, the scheme would have to be designed in a way to either promote competitiveness, development and structural change or allow small farmers to choose their development path (e.g. maintaining local small-scale production) in order to narrow the income gap with larger structures. This specific scheme would also make it possible to cut red tape by simplifying administrative procedures for farmers as well as for national administrations.
However, a support scheme for small farmers within the first pillar would only offer limited possibilities of targeting or imposing requirements in terms of e.g. development capacity, investments, or the commitment to continue farming. This is why it is important to grant it in combination with more targeted support through Rural Development policy, focusing on the competitiveness of farms.
The purpose of a small farmer scheme in the first pillar would thus be to provide for general support to small farms in the form of a higher level of direct payments while simplifying the management of the scheme at farm and at Member State level (without imposing any specific request on the development strategy of the farm). This could be done by introducing a single payment at farm level that replaces all other elements of the direct payment (i.e. the basic rate, the payment for natural constraints, coupled payments and the greening component). This higher payment could either consist of:
The attribution of a fixed EU-wide support (lump-sum) in addition to the "normal" payment to farmers below a threshold. In that case, there is a risk that farmers just below the threshold may receive a higher level of direct payment compared to the ones just above the threshold who would not be entitled to the specific lump-sum for small farmers.
The granting of a lump-sum payment corresponding to a pre-determined threshold. However, this could lead to grant a high "bonus" to those with the lowest payments compared to the ones that are just below the threshold.
An increase of direct payments by progressive percentages (the lower the payment below the threshold, the higher the percentage). This would assume setting up bands under the threshold to the limit of which the payment of the farmers falling in the band would be completed. This option would mitigate the concerns of the above option by completing only to the limit of the band but it would be complicated to apply.
As regards the financing of the scheme, it should not put at risk the competitiveness of other farms by using a disproportionate share of the total direct payment envelope. Several options could be envisaged: either through a share (e.g. 5%) of the national envelope for direct payments of each Member State or through the result of capping generated in the same Member States. The latter could be an intuitively appealing solution as it would link the distribution problems at both ends of the farm spectrum. However, this would result in a financial mismatch between the funds needed for the scheme and those generated , owing to the unevenly distributed farm structures between Member States. There would be either too little financing available (in Member States with many small farms) or the scheme would be over-funded (in Member States with large farm structures).

107
Clearly, the budgetary needs for financing the small farmer scheme crucially depend on the definition of small farmers. Several options could be considered to define the small farmers: – Option 1: A threshold fixed at EU level for all Member States (e.g. EUR 1 000 per
beneficiary) – Option 2: A threshold calculated at Member State level with an EU-wide formula (e.g.
15% of the average amount of direct payment per beneficiary in each Member State) – Option 3: A threshold defined at Member State level within an EU framework (e.g.
maximum EUR 1 000 per beneficiary and maximum 5% of the direct payments envelope in each Member State dedicated to small farmers).
The results of the calculations made by the Commission services are the following: Option 1: would use 9.2% of the EU DP envelope which would mean an additional
5.1% of DP dedicated to small farmers as compared to what they receive in the Status Quo. In Cyprus (CY), Malta (MT), Romania (RO), more than 40% of the direct payment (DP) national envelopes would be used for more than 70% of beneficiaries. In Italy (IT), Lithuania (LT), Greece (EL), Spain (ES), Poland (PL), Portugal (PT) and Slovenia (SI), 8 to 23% of national DP envelopes would be used for more than 40% of beneficiaries. Detailed results are presented in Table 1.
Table 1. Small farmers - Impacts of option 1 (EUR 1 000 per beneficiary for all MS)
Country Share of beneficiaries below the 1000 euros
threshold
Share of budget necessary to grant 1000 euros to the beneficiaries below the 1000
euros threshold
Share of additional budget needed to finance these
small farmers AT 22% 3,7% 2,0% BE 12% 0,9% 0,5% BG 46% 4,5% 2,1% CY 76% 57,7% 35,9% CZ 17% 0,4% 0,2% DE 23% 1,5% 0,9% DK 23% 1,5% 0,9% EE 36% 4,6% 2,2% EL 55% 23,9% 15,1% ES 44% 8,1% 4,9% FI 9% 1,1% 0,3% FR 15% 0,7% 0,4% HU 43% 6,2% 3,1% IR 8% 0,8% 0,4% IT 62% 20,2% 12,3% LT 59% 23,5% 11,3% LU 9% 0,5% 0,2% LV 48% 15,5% 7,0% MT 85% 82,3% 66,3% NL 24% 2,0% 1,2% PL 50% 22,5% 10,6% PT 70% 22,5% 15,2% RO 79% 43,5% 21,9% SE 27% 3,0% 1,4% SI 45% 19,6% 9,5% SK 48% 1,9% 1,0% UK 18% 0,9% 0,4% EU 27 50% 9,2% 5,1%
Source: CATS data, DG Agri calculations.

108
Option 2: would use 4.8% of EU DP envelope which would mean an additional 2.8% of DP dedicated to small farmers as compared to what they receive in the Status Quo. The maximum share of national DP envelopes dedicated to small farmers would be 11% (in SK). The scheme would concern more than 40% of beneficiaries in Bulgaria (BG), the Czech Republic (CZ), Estonia (EE), ES, Hungary (HU), IT, MT, PT and Slovakia (SK). Detailed results are presented in Table 2.
Table 2. Small farmers - Impacts of Option 2 (15% of the average amount of direct payment per beneficiary in each MS)
Country Threshold (15% of national avg)
(in €)
% beneficiaries below threshold
Total amount needed to raise small farmers to the threshold set at 15% of national .average
(in % of the DP envelope)
Share of additional budget needed to finance
these small farmers
AT 868 20% 3,0% 1,6% BE 2.070 22% 3,3% 1,8% BG 1.524 66% 9,9% 6,3% CY 198 21% 3,2% 0,8% CZ 5.737 57% 8,6% 5,4% DE 2.203 34% 5,1% 3,3% DK 2.411 38% 5,8% 3,7% EE 1.179 43% 6,4% 3,2% EL 348 31% 4,7% 2,4% ES 824 40% 6,1% 3,6% FI 1.244 12% 1,8% 0,7% FR 2.947 26% 3,9% 2,6% HU 1.054 45% 6,8% 3,5% IR 1.496 13% 2,0% 0,9% IT 461 42% 6,3% 3,0% LT 379 18% 2,8% 0,9% LU 2.800 17% 2,5% 1,5% LV 467 21% 3,1% 1,2% MT 155 48% 7,2% 3,8% NL 1.831 33% 4,9% 3,2% PL 335 13% 1,9% 0,4% PT 468 51% 7,7% 4,5% RO 271 12% 1,8% 0,4% SE 1.347 35% 5,2% 2,7% SI 347 14% 2,1% 0,8% SK 3.855 73% 11,0% 8,3% UK 3.046 35% 5,3% 3,4% EU 27 UE27 819 33% 4,8% 2,8%
Source: CATS data, DG Agri calculations.
Option 3: In this option, it is assumed that each Member State would try to maximise the threshold by reaching either EUR 1 000/beneficiary or the level of the threshold which reaches the maximum (5%) share of national DP envelopes. This limitation to 5% of national DP envelopes would reduce the EUR 1 000/beneficiary threshold in 11 Member States. The number of beneficiaries concerned still differs widely between Member States. At EU level, it would represent 29% of all beneficiaries.
From an economic point of view, the scheme would result in an improvement of the position of smaller structures and to a consolidation of micro-sized farms, thus contributing to the vitality of rural areas, increasing the public acceptance of direct payments and having a positive impact on the income and purchasing power of small farmers.

109
In the course of ongoing discussion, Option 2 was selected for further refinements.
Specific support scheme for young farmers
Data on the age structure of farmers in the EU indicate the ageing of the farming community. There are 1.8 million young farmers (defined as farm holders "under 40 years of age") which make up 14% of the population of farmers in the EU-27 and hold 20% of the potentially eligible area (PEA) The largest share in PEA held by young farmers is found in PL (29%), Austria (AT) and France (FR) (both 27%), while the smallest one in RO (12%), MT and CY (both 13%). The average farm size for young farmers in most Member States is larger than the overall average farm size.
The CAP recognized years ago that the age structure in the farming sector was a problem, and has been addressing it by rural development measures, in particular by the measure “Setting-up of young farmers”. In contrast, direct support schemes up to now have not explicitly targeted young farmers. Within an overall aim to enhance the competitiveness of EU agriculture, direct support schemes serve as an income support for farmers and have to be granted in line with the principle of non-discrimination. Nevertheless, when allocating payment entitlements under the SPS, Member States have the possibility to address young farmers indirectly through provisions for farmers commencing their agricultural activity between the reference period and the first year of the SPS and later on by using the national reserve.
Farmers commencing their agricultural activity are defined as a natural or legal person that did not have any agricultural activity in her own name and at her own risk in the 5 years preceding the start of the new agricultural activity. It is highly likely that many of the newcomers who apply are young farmers.
While a majority of Member States use the national reserve for newcomers, there are a few that do not (Denmark - DK, the Netherlands - NL, Sweden - SE, MT, Germany - DE, United Kingdom - UK), which means that their young farmers can get the access to direct support under the SPS only by transfers of entitlements (by buying, leasing or inheriting). As this can be, together with land, rather costly, young farmers may not be encouraged to start farming. This is particularly the case when the support for setting-up (or for an early retirement) is not available under the rural development programme (MT, NL, SK). In terms of access to direct payments, young farmers in Member States applying SAPS benefit from a more favourable treatment as they can claim direct support any year provided that they have at their disposal eligible land.
In the light of this situation, a specific support scheme for young farmers in Pillar I could be envisioned that would encourage the setting-up of young farmers and/or support the operation of their farms in the first years. When designing such a new scheme, the objectives of the scheme should guide further decisions such as whether it is mandatory or voluntary, who are beneficiaries, the amount and the form of support, when and for how long to grant support and whether to set any budgetary limits.
A mandatory application would ensure that the often difficult situation for young newcomers would be equally taken into account in all Member States. On the other hand, voluntary application could be argued as well since Member States are in the best position to decide if an additional measure is necessary in their case.
The following options for a specific support to young farmers could be envisaged:

110
Option 1: Granting a fixed top-up payment per hectare to young farmers (less than 40 years of age)
Option 2: Devoting a fixed percentage of Member States’ direct payment budget to a scheme for young farmers (less than 40 years of age)
Option 3: Granting a top-up of a certain percentage of the basic rate for direct payments in each Member State to a scheme for young farmers (less than 40 years of age)
Option 4: Granting a lump-sum support to starting-up farmers based on average farm size and average direct payments per ha in the Member State.
In all options, the support would be given for a limited number of years, e.g. 3 years or 5 years, or until a farmer reaches the age of more than 40 years.
The results of the Commission services calculations are as follows: Option 1: The impact of a Young Farmer Scheme (YFS) with a fixed top-up amount
per hectare for small farmers has been examined for three different amounts for the top-up of 100€/ha, 50€/ha and 20€/ha. Both a top-up of 100€/ha and a top-up of 50€/ha would require a considerable share of the direct payment budget for its financing (7.6 % and 3.8 % respectively at EU level) while these amounts would be reduced substantially for the top-up of 20€/ha (1.5 %). Latvia (LV) would be the Member State with the highest share of the national direct payment envelope going into the YFS, up to 16 % with a 100€/ha top-up due to the fact that its number of young farmers is relatively high and the budgetary envelope for direct payments relatively low.
Option 2: The impact of a YFS with a fixed percentage of the Member State overall direct payment budget devoted to the scheme was examined for two shares of the direct payment budget, i.e. 5% and 2.5%. At EU level, the per hectare top-up amounts resulting from the application of such a scheme would be 66€/ha for a 5% share of the budget and 33 €/ha for a 2.5% share of the budget. However, the amounts would vary substantially between Member States with, for example, MT going up to 266 €/ha in the 5% budget situation while LV would be at 31€/ha for the same setting.
Option 3: The impact of a YFS with a top-up for young farmers as a percentage of the basic payment rate was examined for top-up percentages of 20% and 25%. Assuming a basic rate of 60% of the overall direct payment envelope of a Member State, for the EU-27 the 20% top-up would be 30€/ha, leading to a basic rate of 179€/ha for young farmers (as compared to 149€/ha for other farmers) and 37€/ha for the 25% top-up leading to a basic rate of 186€/ha for young farmers. This would mean 2.3% and 2.8%, respectively, of the direct payment budget at EU level. The highest 25% top-up would be paid in Greece (75€/ha) while the lowest would be in LV (19€/ha). The share of the direct payment budget devoted to the YFS would vary between 1.3% in RO and MT and 4.6% in GR with the 25% top-up.
Option 4: The impact of a lump-sum support to young farmers was analysed for a model that would give young farmers a payment at the level of 25% of the average direct payment per ha in the Member State in which they are located, times their farm size in hectares, with a limit of 25 ha, in Member States whose average size of holding is below 25 ha, and a maximum comprised between 25 ha and the average size of holdings in the Member States where average holding size is equal to or higher than 25 ha. The results shown in Table 2 indicate that the overall budgetary impact at EU-27 level would be limited to 0.21% of the total direct payment budget. In the different Member States, the amounts would lie between 0.1% in the UK and 0.36% in PL.

111
Social impacts
A specific support scheme for young farmers could encourage the entry of young farmers into the sector and thus improve the age structure in the farming sector. A setting-up aid (Option 4) is likely to prove more efficient in this respect because it is targeted only to new entrants, not to those young farmers already in the sector.
However, an aid given to all new entrants – whether young farmers or not – would risk supporting some people who were not actually targeted by the measure. Furthermore, Option 4 bears a certain risk of leading to double funding with the already existing aid for “Setting-up of young farmers” under rural development policy, which is based on similar criteria. However, if the young farmer scheme was designed in such a way as to bring additional income and lower the cost of capital it could actually be complementary to the support possible under Pillar II.
Options 1-3, which are not targeted as a start-up support but an income support to all farmers under a certain age, risk less of an overlap with existing rural development support as they are based on different criteria. On the other hand, due to the fact that they are based on age alone as the selection criterion, they may be challenged at the European Court of Justice for being discriminatory.
"ACTIVE FARMERS"
The current definition of "farmer" ("…a natural or legal person, or a group of natural or legal persons (…) who exercises an agricultural activity") acknowledges the fact that direct support is decoupled and, thus, not linked to production activity. However, the application of this definition has resulted in criticism from the European Court of Auditors (ECA), and also from the public at large, as certain cases have been reported where direct payments seem to have been granted to persons or companies that cannot be considered as genuine farmers, as they are only to a very small extent engaged in agriculture or agriculture is not their main business activity.
This problem was already addressed in the Health Check of the CAP that provided for optional additional criteria for the exclusion of persons/companies from aid , whose agricultural activity is only an insignificant part of their overall activity and/or whose main business objects do not consist of exercising an agricultural activity. However, no Member State has made use of the possibility of setting up these additional criteria.
This is why a provision could be introduced that obliges Member States to define who is an "active farmer". However, the introduction of such a provision poses substantial practical difficulties:
First, as there exists limited information on the exact dimension of the problem (number of beneficiaries now receiving direct support but not qualifying as "active farmers") it is rather difficult to make a quantitative analysis of impacts.
Second, the definition needs to be fine-tuned to reliably exclude non-active farmers while at the same time not affecting the access to support of genuine farmers. The criteria to define 'active farmers' would have to ensure that part-time farmers are not excluded as it is clear that diversification of activities is a valuable alternative to limited growth opportunities within the farm sector and contributes to maintaining farming in areas where agriculture is socially and environmentally valuable.

112
Third, the situations differ substantially between Member States with respect to how many beneficiaries could be affected and with respect to what kind of information is available in national statistics to be used as criteria to determine what is an "active farmer".
As for establishing the criteria to define who is an "active farmer" there are two approaches, both of which, however, may create problems:
Due to the differences between Member States mentioned above, it could be a promising approach to establish a list of criteria for the definition of "active farmers" at European level from which Member States could then choose those elements that best fit their national situation and the availability of information. The problem with this approach is that it could give rise to complaints about discrimination and unequal treatment between farmers. Alternatively, fixed and equal criteria could be set that all Member States would have to apply. This, however, would not leave flexibility to Member States and could create problems for those Member States that are not in a position to apply the selected elements. Possible elements to be considered as criteria to determine who is an "active farmer"
could be, for example: That the turnover (or income, or receipts) derived from an agricultural activity represents or represented at least X % of the total turnover (income, receipts) of a natural or legal person. This would mean that payments would be granted only to those natural and legal persons for whom agriculture forms a significant part of overall economic activities, or whose principal business or company objectives consist of exercising an agricultural activity. However, care would have to be taken not to exclude part time farmers with such a definition (most notably those engaged in diversification strategies). That farm animals or agricultural crops, or that farm machinery, or relevant facilities for an agricultural activity are present on the agricultural holding. However, these criteria could result in problems with the Green Box classification of support if they were not linked to a date in the past – which, in turn, would make them questionable for determining who is an active farmer today. That professional qualification and/or practical experience is properly credited or that the physical residence of the person is on the agricultural holding or close to it. However, while these criteria are not problematic from a WTO or discrimination point of view, they would also not suffice as the only criteria to determine who is an active farmer. Certain types of business (such as airports, railway companies, sport grounds, etc.) could be excluded from qualifying as active farmers ("negative list"). However, such a negative list could pose problems since it may not be exhaustive and thus may leave out certain companies which could lead to complaints about unequal treatment by the economic agents explicitly mentioned on the list.Farmers subscribing to rural development measures could be considered as active
farmers. However, this criterion is, again, not sufficient as the sole determinant of who should be seen as an active farmer.
The economic impacts of a better definition of "active farmers" would most likely not be substantial as the problem of granting direct payments to non-genuine farmers seems to be limited to particular cases and is not a widespread phenomenon. This having been said, a

113
definition that guarantees that only active farmers receive support means, of course, a better targeting of payments to those who actually are the intended recipients. Thus, the approach would improve the use of public funds and increase the public acceptance of direct payments.
It would have to be ensured that the list of criteria set up to define who is an "active farmer" contains only elements that respect WTO Green Box criteria. In particular, it would have to be avoided that any of the criteria would imply an obligation to produce in order to be classified as an "active farmer," as this would be against the principle of decoupling.
Care is needed not to exclude from support – and so from GAEC – land which is important for environmental reasons and/or which may also at some stage be needed for agriculture.
Improving the targeting of payments to active farmers would require careful fine tuning of definitions, possibly in cooperation with Member States, and selecting criteria to be integrated into the IACS register. This would generate substantial administrative effort for farmers who would have to prove eligibility by providing supplementary detailed information and possibly submitting accompanying documents with their application, and for national/regional authorities who would have to manage the received information. This could lead to a considerable increase of administrative burden for farmers and Member States.
Conclusions
During the Ministerial Council of March 18-19, 2013, Member States reached the compromise on the above-mentioned issues. 1. Payments to small farmers become more elastic. The primary proposal is maintained,
i.e. small farms are exempt from greening as well as from cross-compliance controls and sanctions.
2. As for young farmers, in all Members States shall be the same criteria for farms eligible for support: the limit of payment shall be not less than 25 hectares or an average farm size in a given Member State. A bulk sum payment was also proposed, fixed on the basis of an average size of young farmers’ holdings.
3. The definition of active farmer has been simplified, as well as a “negative list” has been created i.e. the list of entities that cannot apply for direct payments. However those entities may prove that payments constitute at least 5% of their annual receipts from non-agricultural activities (eg. airfields, recreation areas).
References
Communication on the CAP towards 2020: meeting the food, natural resources and territorial challenges of the future [2010]: COM 672/5
Cooper T, Hart K., Baldock D. (2009): The Provision of Public Goods Through Agriculture in the European Union, Report for DG Agri.
Hoelgaard L. [2010] :The future of the CAP:issues of the post-2013 debate, Agra Europe Outlook for Agriculture, London.

Krzy anowski J. [1990]: Cenowe i pozacenowe instrumenty oddzia ywania na produkcj rolnicz w EWG [Price and Non-Price Instrument Afecting Agricultural Production in the EEC], Problemy Rolnictwa wiatowego,Vol. IV, SGGW, Warsaw.
Reflecting environmental land use needs into EU policy preserving and enhancing the environmental benefits of “land services”: soil sealing, biodiversity corridors, intensification/marginalization of land use and permanent grassland [2010]: Final report to the European Commission.

115
Szilvia Majóczki-Katona1
Szent István University, Gödöll , Hungary
Institutional characteristics of the Hungarian grain sector – research methodology
Abstract.The article presents the institutions of the grain product path (transaction costs, applied economics of contracts). The article presents the method of research. Due to limited space, the concrete facts, figures, and results are not presented. The aim of this paper is to identify the factors which influence the development or lack of contractual relationships, as well as how vertical coordination could contribute to the improvment and stabilization of terms between the participants involved in the sector. The conditions under which the contracts are made, as well as the differences that exist in practice and the reasons why the different controlling structures are applied are also presented. A questionnaire was used to collect details about each participant of the grain sector. In this article, the structure of the questionnaire, the main characteristics of the survey, as well as the collection of hypotheses of the expected results based on the analizations, are also introduced.
Keywords: grain sector, applied economics of contracts, transaction costs
Introduction
In the article, there was first outlined the characteristics of institutions in the grain sector and its problems, and then the methodology of empirical research is introduced referring to the institutions of the grain sector. Also, there is discussion about the aim of the questionnaire, its structure, then the introduction of variables applied in the survey, though it is not intended to be exhaustive. Finally, the hypotheses regarding the research results is stated.
Institutional characteristics of grain sector and its problems
The institutions basically can be divided into two parts, the so-called institutional environment (rules, principles, that control the attitude of participants) and the organizations (that make sure the frames of functioning in the market). The grain sector includes the following institutions, as organizations. [Lehota, 2003]: 1. Spot Markets 2. Concentrated Markets 3. Hybrid Institutions 3.1. Contractual Systems 3.2. Institutions of storage, warehousing 3.3. Co-operatives, associations, and othe forms of cooperation
E-mail address: [email protected] Kápolna, Szabadság tér 4.

116
3.3. Quality Controlling Systems 4. Forms of vertical proprietorial integration 5. Assisting Institutions 5.1. Information Organizations 5.2. Logistic Organizations 5.3. Financial Organizations
In the grain sector the spot markets, the contractual relations and vertical integration based on joint property run parallel in determining the sector's characteristics.
In the input relations of cultivation of grain crops (seeds, plant-protecting materials, fertilizers, and machinery production) mainly the contractual relations are determinant.
In the case of material producers and the primarily processing industry (flour milling industry, forage industry) also the contractual relations determine the sector, but they are supplemented with spot market relations.
The primary and secondary (pasta companies, sweets industry, baking industry and starch production) relations between the processing companies, are based partly on a vertical integration based on common ownership, partly on contractual relations and partly on spot market relations. [Lehota, 2003].
Empiric research referring to the institutions of grain sector
Aim and structure of the questionnaire
The primary aim of the questionnaire is to study the connections between the participants of the grain product path – based on the theory of transaction costs, and on the applied economics of contracts; as well as the analysis of the main factors which determine the different controlling structures.
It is necessary to estimate which factors influence the development or lack of contractual relations, as well as how the tools of coordination could contribute better to the stabilization between the growers and the processors.
The main questions are the following: how, and under what conditions the contracts are made, what differences exist in contractual practice, what the driving forces are behind the different controlling structures.
Characteristics of the sample and introduction of willingness to answer
The survey was based on the registers and databases of the following organisations: Millregister, public grower list, the leaders of county directorates of FM, the National Association of Graingrowers, the Hungarian Farmer's Ring and Farmer Associations, the National Association of Agricultural Growers, Hungarian Graingrowers, the Association of Forage Producers és Traders, National Association of Farmer's Ring in Hungary, the Association of Young Farmers in Hungary, the Council of Grain Products and Trade Organization and Council of Seed Products.

117
The questionnaire contained 4 blocks: I. General questions II. Questions referring to employees III. Questions referring to contracts IV. Closing questions
During the examination nine canals of marketing were differed: Opened (wholesale) markets, wholesale traders, marketing (sales) associations, grower and trader organizations, concentrated markets (stock exchange), engrossers, mills and processors, buyer associations and others. These canals can be ranked as different levels of controlling structures within the marketing system.
The data of the survey include nominal, ordinal and data measured on an intervallum scale. After receiving the questionnaires, the database was formed and cleared.
Due to the applied electronic questioning process, the received answers were automatically stored in a database. The different columns of the database were formed by the questions which were asked, their lines were formed by the given answers received in each questionnaire.
After receiving the questionnaires, the variables were coded according to the questions, then the database was checked by fixing and clearing. When coding, the content of the question was taken into comparison, and I tried to form codes that are simple, easy to recognize, and that can be understood by statistic program packs.
The questionnaires that markedly lacked data were deleted from the database. In some cases, the missing data could have been obviously supplied.
When the content was being checked, mainly the bad, bland answers were strained out. Bad answers come from misunderstanding the measures, in most of the cases these mistakes could be corrected. Controversial answers also came from the inconsistency of respondents, and had to be weighted at each questionnaire.
Introduction of the variables applied in the questionnaire
79 variables were applied in the questionnaire. The questions were divided into four groups according to the following subjects:
Basic characteristics of the examined enterprise, Characteristics of the applied contracts, Bargaining positions of participants in product path, Opportunity to obtain information.
The applied variables in the examination can also be grouped: Information costs, Negotiation costs, Checking costs, Physical tools specifications, Human resources specifications.

118
Introduction of hypotheses
The main theory that was expected from the questionnaire examination is the following: unsettled and improperly developed market institutions spoil the efficiency of the grain product path. It causes high transaction costs. Vertical coordination could improve and stabilize the relations of participants of the sector.
Four question collections of hypotheses were set up, within which were several subhypotheses. The characteristics of the theories (based on Fert I., Juhász P., Kapás J., Kiss T., Szakál F., [at. all.]) are the following.
1. What factors influence the evolving or lack of contractual relations? One of the main characteristics of contractual relations is fluctuation, due to the
significant fluctuation of grain production and the different market expectations of growers and processors. This is typical of mainly the mill- and forage- industries, as well as between grain wholesale traders and national smaller sized grain traders. (Lehota, 2003)
An advantage of using contracts rather than open market sales is that a contract moderates the price, and in this way, the income risk as well (risk sharing approach). On the other hand, it reduces the costs of realization in the spot market (transaction costs approach). This latter makes us reach lower production costs, and also makes the coordination faster between the different levels of production, for example by adapting new technology, development of information flow, quality controlling, easier reach of loans, etc.
When the transaction costs (namely costs of market exchange) have an important role, the application of contracts will lead to the improvement of productivity and better quality of products.
2. What differences exist in contractual practice? The bargaining position and the determination of contract is essential in the aspect of
concrete price. The problem of contractual realization is that it does not include contractual
guarantees or assurance for the grower and the buyer, and the legal compulsion of contracts is missing. Arguments over quality and quantity completion are the most frequent, as well as the keeping of delivery and completion deadlines. Their reasons are the growing lack of capital, financial difficulties and the fluctuation of supply and demand. The obtainment of contracts' clauses by legal force: legal process, and the institution of chosen court [Lehota, 2003].
Regarding the duration of contracts, longer duration of contract means closer cooperation, call it (vertical) integration. Certain contracts oblige the growers to make such long-term investments, which make customer-specific production possible. In case, a contract means only a short-term buying-up obligation for the customer, it means the further risks (so-called barrier problems) for the grower, which may come from the cancellation of contract, or the buyer's fault, etc. There might be such cases, that give the customer a dominance in the market.
3. How could the vertical coordination contribute better to improvement and stabilization of the relationships between the participants of the sector?
The size of an organisation influences the bargaining position in a positive way. Associations have an important role in the vertical integration, by improving, keeping and strengthening the technological and market efficiency of members, as well as their income positions, and independence – compared to the alternative integration mechanisms [Szabó, 2002].

119
Table 1. Summary of the Hypotheses
1. Hypothesis group: What factors influence the evolving or lack of contractual relations?
2. Hypothesis group: What conditions are contracts made on, what differences exist in contractual practice?
3. Hypothesis group: How could the vertical coordination contribute better to improvement and stabilization of the relationships between the participants of the sector?
4. Hypothesis group: What are the driving forces behind the choice of different controlling structures?
1.a. hypothesis: Written contracts are done only by certain groups of the sector, other groups do not have written contracts at all or only in a small measure
2.a. hypothesis: In case of written contracts are the contractual conditions better completed
3.a. hypothesis: Size influences the bargaining position in a positive way
4.a. hypothesis: Those, who are on spot market face the following problems: lack of information, conflicts, difficulties of changing partners, etc.
1.b. hypothesis: The fluctuation of contracts in time, the length of contractual period, entering into contract in a determined time, and the activity of enterprise are in connection with the form of contracts (written contracts )
2.b. hypothesis: Marking the realization price ( and quantity ) in contracts reduces the price risk
3.b. hypothesis: Associations have a determinant role in vertical integration
4.b. hypothesis: BCE participants are the bigger processors, it has several indications to ignore its use.
1.c. hypothesis: The position in grain sector, and in this way the closer cooperation influences the length of contractual period
2.c. hypothesis: The written contract reduces the realization costs of spot market
4.c. hypothesis: The application of associations, and other forms are not widespread in Hungary
2.d. hypothesis: Fixing the quality in contracts leads to a better quality of products
4.d. hypothesis: The vertical proprietorial integration covers only 2-3 parts of the sector
2.e. hypothesis: The possibility of bargaining position is not typical in most of the contracts
4.e. hypothesis: The activity of enterprise and the application of different sales ways are in correlation with each other
2.f. hypothesis: It is determining which party takes guarantee and/ or assurance in case of application of each sales canals
2.g. hypothesis: The opportunity to apply a legal force lacks in most of the cases
2.h. hypothesis: In case of each sales canals the characteristics of contracts are different
Source: Own results

120
1. What are the driving forces behind the choice of different controlling structures? The realization problems of the spot market are: because of the lack of demand and
price information, the price risk is high. There are frequent conflicts between the sellers and buyers, due to the lack of permanent connection, as well as the lack of advantages of a long-term, stabile relationship [Lehota, 2003].
The participants of the Budapest Commodity Exchange (BCE) mostly are the bigger processors, the participation of growers is relatively low, there is a lack of admission limits, the growers have shortage of capital, and there is the absence of quality level and stock exchange skills [Lehota, 2003].
In the case of open market coordination, the role of contracts are taken over by the price, and in connection, when a vertical integration is established it is from inner, administration decisions.
In the aspect of buying and realization of prices, the marketing association is a very important institutional form [Lehota, 2003].
The main aim of the growers' realization associations is to represent a sufficent power to stay economically viable, and to have an effective support at the same time.
The characteristic of vertical proprietorial integration relationships in the grain sector is that it usually covers only 2-3 levels of participants of the sector, the connections of mill, pasta-, bakery industries and wholesale trade are determinant, however, the participation of growers in integration forms is really low.
Conclusion
By the questionnaire that was used to collect details about grain sector’s participants, a collection of hypotheses was introduced. In this article was presented the method of research. Due to the limited space, the concrete facts and figures and results are not here presented. On the basis of the set up hypotheses, with the help of several variables of mathematical/ statistical processes, the hypothesis examination will be published in a following article as well as discussions with experts, results and aspects of practical application.
References
FERT I. [1996]: A vertikális koordináció a mez gazdaságban, Közgazdasági Szemle, (43) 957-971 p. FERT I.[2002]: A mez gazdasági termelés szerkezetének változásai a fejlett országokban I., Közgazdasági
Szemle, (49) p. 574–596. FERT I.[2002]: A mez gazdasági termelés szerkezetének változásai a fejlett országokban II., Közgazdasági
Szemle, (49) p. 760–773. JUHÁSZ P.–MOHÁCSI K.[1999]: A mez gazdaság m ködését szolgáló f bb intézmények., Közgazdasági
Szemle, (46) p. 231–244. KAPÁS J.[2003]: A piac, mint intézmény – szélesebb perspektívában.- Közgazdasági Szemle, (50) p. 1076–1094. KISS T.-SZABÓ G. G. [2001]: Versenyszabályozás és szövetkezeti vertikális integráció az Európai Unió
élelmiszer-gazdaságában, Acta Agraria Kaposváriensis, 5 (2), p. 55–71. KLEIN B.–CRAWFORD R.–ALCHIAN A. [1978]: Vertical integration: appropriable rents and the competitive
contracting process, Journal of Law and Economics, (21) p. 279–326. LEHOTA J. [2003]: A vertikális koordináció és a szerz déses kapcsolatok a búzavertikumban, Marketing &
Management, 35 (5,6), p. 45. SZABÓ G. G.[2005]: A szövetkezeti identitás – egy dinamikus megközelítés a szövetkezetek fejl désének

gazdasági néz pontú elemzésére.- Közgazdasági Szemle, (52) p. 81–92. SZABÓ G. G.[2002]: A szövetkezeti vertikális integráció fejl dése az élelmiszergazdaságban, Közgazdasági
szemle, 49 (3), p. 235-250. SZAKÁL F. [1994]: A tranzakciós és szervezési költségek szerepe a mez gazdasági struktúra alakításában,
Gazdálkodás, 38 (1), p. 28-38. WILLIAMSON O. E. [1979]: Transaction-Cost Economics: The Governance Of Contractual Relations.- Journal
Of Law And Economics, 22 (2)p. 233–261.

122
Kateryna elnyk1
National University of Life and Environmental Sciences of Ukraine Kyiv, Ukraine
The peculiarities of formation and development of agricultural holdings in Ukraine
Abstract. In the article the main tendencies of the development of agricultural formations in Ukraine are generalized. Types and groups of agricultural holdings are given. The system of management and the peculiarities in the functioning of some of the biggest agricultural holdings in Ukraine are analyzed. The main positive and negative aspects of their practices are identified. The effectiveness of agricultural holdings practices is compared. Company outlets on the stock exchange are characterized and the rate of the investigation involvement by the biggest agricultural holdings of Ukraine is shown.
Key words: agricultural holding, vertically and horizontally – integrated enterprises, EBITDA, real estate bank, investigations, IPO (initial public offering), governmental regulation, agricultural complex.
Introduction
Nowadays we observe the intensive influence of global and investigational processes on state economics, which is accompanied by an increase in the price of subsistence supplies. According to calculations by international organizations, increase of product demand, which is mainly a result of fast-growing economies of such countries as China and India (definitely by increase of profits and consumer demand in those countries), is able to prove by the help of low-level countries, such as Russia, Ukraine and Kazakhstan.
Ukraine has strong potential possibilities for producing agricultural products through its suitable natural and climatic conditions and powerful human potential. Afterwards the following, and because of insufficient effectiveness of national procedures, for Ukrainian agriculture the concentration of agricultural formations becomes stronger, in so-called vertically and horizontally – integrated enterprises of holding type (agricultural holdings). The situation that was folded at the market of food, imperfect landed relations related to subzero demand on agricultural lands, together with their availability, and became basic pre-condition of becoming and development of the agricultural holding in Ukraine. As such enterprises for Ukraine are relatively new - their becoming, activity and adjusting need a corresponding scientific ground. In fact, research of management of the agricultural holding is especially actual in a period passing to the landed relations of market type, as it has not only economic but also social and ecological value. And the scales of bringing in of land are required the agricultural holding the detailed study of features of their activity and possibility of perfection of mechanism of regulations from the side of the state.
The separate aspects of this problem were investigated by prominent Ukrainian economists-agriculturalists such as V.Andriychuk, O. Gudz’, M.Puhachiov, S.Demianenko,
1 PhD student, address: 59, ‘50 October St., Boyarka, 08150, Ukraine, e-mail: [email protected]

123
M.Demianenko, P.Sabliuk, V.Haivoronskyi, O.Nychyporuk, I.Kot’kova, P.Stetsiuk, O.Popova and others.
However, prospects of development of agricultural formations need further research from position of economic, ecological and social efficiency in the conditions of market transformation of the landed relations on a village. The state of development of range of problems functioning of the agricultural holding, represented in economic literature, does not expose all questions that stand before modern economic science in relation to this direction of research. In particular, paying attention to management of the agricultural holding doesn’t fully answer to the level of public meaningfulness of this economic process. As both structural and destructive character shows up in activity of the agricultural holding, there is a necessity for an analysis and ground of control system of the agricultural holding.
The aim of the research was to analyse the control system by the vertically-integrated enterprises (agricultural holding), to define the features of construction of their business processes and ground events in relation to the improvement of mechanism of government control. Certain studies are undertaken on materials of the agricultural holding of Ukraine.
Research results
With passing of economy of Ukraine to market principles, agriculture – as an industry with seasonal production and slow transaction of capital – is in worse terms comparatively with other industries.
Among major problems in an agro-industrial complex ( IC) it is possible to distinguish: subzero efficiency of agricultural production, that does not provide the extended recreation; absence of motivation to labour, unemployment, poverty and labour migration, decline of social infrastructure, extinction of villages; deindustrialization of agriculture (the provision of agrarian enterprises technique presents 45-59%, over 90% of present technical equipments need replacement through their worked out) [Sabluk 2008, pp. 4-6].
If we bear objective component origins and functioning of the agricultural holding in mind, then aspiration of diversification of production and action of law of economy have an indisputably stimulant value on scales. The short history of this type of agricultural formations testifies that the evolution of most of them was begun with trade, industrial activity, processing of agricultural produce and only afterwards did agricultural production become familiar to them. Well-known practice testifies that most effective are associations that form the reserved circle: production of agricultural goods, their storage and processing and realization of prepared finished goods. Just the same approach is the basis of forming of integration model of the Ukrainian agricultural holding.
The staple resource base of agricultural production is soil. Obviously, its cost or charges for bringing in substantially influence the realization of any agrarian project. Agricultural enterprises are before created actually gratuitously got lot lands in the usage. Therefore in evaluation procedures of expediency and efficiency of agricultural activity this component of bringing in of financial resources practically is not taken into account. Only taken into account is the size of rent, which in obedience to curent legislation can not be more subzero 3% from the cadastre estimation of lot land [Stetsiuk 2010, pp. 17-25].

124
Table 1. Some biggest agricultural holding of Ukraine, thousand ha
The name of the agriculturalholding Description of company
land-bank,
thousand ha
PLC Ukrland
farming
Specialized on growing of agricultural cultures and production of sugar, grows a cattle, production of beef and milk, produces seed, skin. Proprietor of majority share holding of the agricultural holding of Avangard(eggs and egg products)
480
New Century Holding (NCH)
All agricultural enterprises are incorporated in six agricultural holdings: Bio Agro, Promin Agro, Lat Agro, Golden Svitanok, Charivny Svitanok, Kraevyd Invest. They are specialized on growing of wheat, , corn, sunflower, soy. Separate enterprises develop a stock-raising
350
UkrainianAgrarian Investments
Grows wheat, corn, sunflower, ripak, soy and barley, unites 24 companies, accompanies own products "from the field to port"
240
Mironivsky Hliboproduct
Breeding of poultry, production and sale of meat of hen is under the brand of "Nasha Ryaba"(from 2002) and products from it ( "Legko"!). Grows grain for the production of the mixed fodders; makes forage for the poultry factories from growing of paternal population and factories from the production of meat of poultry.
280
HarvEastHolding
Basic directions of activity of holding: plant-grower (growing of wheat, sunflower, barley, long-term herbares, corn) and suckling stock-raising.
220
Kernel Holding S.A.
It is the most supplier of sunflower-seed oil and shrot to the international market, by the key supplier of bottled oil to the internal market and leading operator in area of grant of services for agricultural producers for storage of grain on elevators, and also services in a transloading and export of grain, vegetable oil and shrot on terminals in ports of the Black sea. In 2011 a company doubled the agricultural assets as a result of acquisition of company Ukrros
170
Private Agro Holding
Unites 24 companies, occupies, by both a plant-grower: growing of grain and technical crops(winter wheat, winter-annual ripak, winter-annual barley, furious barley, soy, sunflower, corn, hybrid corn of silo direction) and stock-raising
116
Mriya Agro Holding
Agro Holding grows wheat, sugar beet, potato, , corn, barley and buckwheat, has an own seminal production, builds a powerful complex for storage of potato
298
Astarta–Kyiv A basic sphere of activity is a production of sugar and concomitant products (molasses and granular bagasse), growing and realization of grain and oil-bearing crops, and also meat and milk.
200
Agroton Agroton is a regional leader from growing of agricultural cultures (corn, ripak, barley, rye, sorghum, oat, peas, buckwheat, millet, coriander, soy, flax and agricultural cultures on a feed to the cattle), stock-raising and to the production of foodstuffs
151
Source: own work on the basis of public information of the agricultural holding.

125
To accelerate development and introduction of new instruments of management would provide further development of agricultural production, maybe by development of its new legal forms. Absence of the institutional providing of motion of lot lands from one side and imperfection of leasing legislation and any control from the side of the state for land-tenure, from the other, allowed to develop the processes of concentration of agricultural lands in the hands of the agricultural holding, including with foreign capital, with the use of hundreds of thousands of hectares of these lands in especially the commercial interests. It is mainly multiple product companies the primary purpose of which consists of the increase of capital of their founders, activity is sent mainly to export, and size of land-tenure arrive at 500 thousand ha of the landed lands. From data of the Ukrainian Club of Agrarian Business, in Ukraine counted 60 large agricultural holdings that process more than 4 million hectares of lands. As a transparent system of account of property rights on ground in Ukraine does not exist, estimation of the landed lands in Ukraine, that really belong or are in the management of that or other company or group of persons, as yet yields mainly only to the expert estimation, thus can be strongly underestimated.
Without regard to considerable distribution of the agricultural holding, in the Ukrainian legislative base there is not only interpretation of their essence to this time. In particular, V.G. ndriychuk in his work "Capitalization of agriculture: the state and economic adjusting of development" marks that often integral enterprises that does not answer the name "holding" legally name the agricultural holding actually [ ndriychuk 2007]. By the law of Ukraine "About holding companies in Ukraine" [Law… 2009] but by the Commercial code of Ukraine [Commercial… 2003] by a holding company a joint-stock company, that owns, uses, and also disposes of holding corporate shareholding (parts, shares) two or more corporate enterprises, is “open”. Thus under holding corporate share holding understand such share holding, that exceeds 50% of the general amount or is sufficient for decision influence on its economic activity of enterprise.
Presently multiple product enterprises and their associations give advantage to creation of limited liability company and does not declare own business from position of holding, that is why officially to watch them complete list it is impossible. Coming from it, consider that more exact decision of the new multiple product agro-industrial forming is the agricultural "holding", as a group of associate enterprises of agrarians to the sector with a considerable land-bank, that carries out a multiple production, processing, storage and realization of agricultural produce, thus controlling interest belongs to the main company. Most agricultural holdings of Ukraine became leaders in the domestic market of agricultural produce and occupy a perceptible place in the world market [Didus 2011, pp. 96-101].
The results of analysis of already existent practice of functioning of the agricultural holding allow to divide them into three groups:
1. The mixed form is a holding that unites practically unconnected interest structures. For example, banks that participate in an investment project.
2. A horizontal form is a holding, structures homogeneous after direction of activity enter in that. Such form of holding has mainly sale character. Structurally such holding shows mostly main enterprise and its branches that is united together by the general logistic system and network of places of production distribution. Due to the use of effect of scale such form of enterprises organization gives an opportunity to bring down a unit and transactional expense cost, and its advantages consist there. As a defect can be marked that

126
such form of organization of enterprises can be the object of intent control from the side of antimonopoly institutions.
3. Apeak form – it is possible to reckon enterprises for it, which are united in a general technological chain in making of eventual products, for example its foodstuffs. Holdings of such type remind business concerns on the essence.
Here is a high degree of concentration of capital, price stability and possibilities of mushroom innovative growth of all participants of holding [Cherevko 2012, p. 32]. Complete vertical integration guarantees high quality of products on every stage of production and allows to offer a most acceptable price. In the total holding controls the complete cycle of production and offtake, beginning from the purchases of raw material and production of prepared goods, and ending realization of commodities to the eventual customer.
Certainly, functioning of the agricultural holding has a range of both positive and negative descriptions.
Table 2. Advantages and disadvantages of practice of the agricultural holdings in Ukraine
Advantages Disadvantages
-is an ideal platform for an exit on exchange stocks for the receipt of investments; -assists involving strategic investors, partners and professionals -can carry out manoeuvrability of property asset, rationalization of the usage of resource potential; -combines production with processing and realization that promotes efficiency of work considerably;-has an access to the markets of sale and possibility of exit on an export.
-the development of infrastructure of village is not supported; -the level of employment of rural population diminished considerably; - price on land and food will become high, as the large landed interests, as a rule, conduct itself as monopolists; -inefficiency of the operating system of expense of state facilities is in support agricultural industry is existed;-the decrease of fertility, ecologization, property rights for peasants, monolevel of culture, advancement of GMO; - source (sailed) of capital to the foreign country, profit oncealment of the agricultural holding are seen etc.
Source: own research
However the results of activity of such structures testify to their considerable influence on the economy of country, and scales of bringing in of the landed lands – about the necessity of government control of process of their creation and functioning [Dankevich 2011, pp. 11-16].
In connection with an increase on the world arena of competitiveness of many Ukrainian markets of agricultural production, for the agricultural holding, for today, the question of effective management of enterprises that enter to him activity appears sharply. The biggest problem within the framework of holding is a management of the regional manufacturing enterprises. We can distinguish a few types of the holdings:
- the financial holdings, that consist of independent business-units that have loosely-coupled interfaces with a managing company. The functions of managing company consist for this type, first of all, in financial control by budgeting of profit and money stream

127
- the branch holdings that usually develop one direction of business only, but have a few production subdivisions, that or work in different regions, or produce different commodities. In those companies, management, as a rule, is centralized.
Between these two types there are holdings that have mixture of the financial or branch holdings in different proportions.
The appropriate characteristic is forming of the apeak integrated holding from a trading company. Thus often with the increase of scales of activity there is only an increase of quantity of employees of company that manages, without any substantial changes in the structure of management. For example, in the large commercial and industrial holding by successful fascinations and absorptions the far of industrial enterprises that work in one industry was purchased. It is possible to name this agricultural holding the example of such forming "Avangard" which, although practically does not have the landed lands, however is the biggest producer of poultry and organic eggs in Ukraine.
Efficiency of activity of the agricultural holding can be traced by means of index of EBITDA (Earnings of before Interest, Taxes, Depreciation and Amortization) - analytical index, that the volume of profit to deduction of charges after percents, tax payment and depreciation decrees. EBITDA allows to trace forming of profit on all levels. In addition, by means of EBITDA it is possible to compare alike sort of activity and sizes of company. An index settles accounts on the basis of the financial reporting of company and used for the estimation of that, as far as profitable basic activity of company.
Table 3. Index comparison of EBITDA among some Ukrainian agricultural holdings, millions of dol. USA
Company name 2010 2011 Changes, %
ernel 190 310 63
Mironivsky Hliboproduct 325 401 24
Avangard Co 193,5 245,8 27
Mriya Agro Holding 167 188,3 13
Astarta–Kyiv 127,2 140 10
Industrial Milk Company (IMC) 20,598 29,349 42
AgroGeneration 2,216 1,68 -24
Source: own work on the basis of public information of the agricultural holding.
An index is used for making a comparison with branch analogues, allows to define efficiency of activity of company regardless of its debt before different creditors and state, and also from the method of charging amortization.
An index is not part of standards of record-keeping, it targets the analysis of attractiveness of operations from absorption on loan facilities and is widely used as an instrument for the analysis of companies. The statistics of Table 3 testify to success of both development of company and agricultural potential of Ukraine.
The presence of own financial resources comes forward as a solid argument in the mutual relations of the agricultural holding with creditors and investors. So, powerful external sourcing for practice of the Ukrainian agricultural holdings is the main issue. Their actions being in the quotation marks of such well-known grounds as London, Frankfort and Warsaw exchange stocks.

128
Table 4. Investments bringing by the biggest agricultural holdings of Ukraine
Company Exchange with the actions The attracted investments through exchanges
PLC Ukrlandfarming Avangard Co - is quoted in London Stock Exchange, Land West Company it is included Kremney Public Co listed for Frankfurt Stock Exchange
Selling 23% shares of stock, "Avangard Co" attracted 188 million dol. (general capitalization is 938 millions of dol.)
Mironivsky Hliboproduct
London Stock Exchange "Mironivsky Hliboproduct", that sold 22,32% shares of stock, rescued 371 million dol. (general capitalization is 1,662 milliards of dol.)
Kernel Holding S.A. Warsaw Stock Exchange Selling 33% shares of stock, "Kernel" got 218 million dol. (general capitalization is 661 million of dol.)
Mriya Agro Holding Frankfurt Stock Exchange Selling 20% shares of stock, Mriya Agro Holding attracted 310 million dol.
Astarta–Kyiv Warsaw Stock Exchange Selling 20% shares of stock, company Astarta - Kyiv got 30 million dol. (general capitalization is 158 million dol.).
Agroton Warsaw Stock Exchange (26,2%), Frankfurt Stock Exchange (25%)
After 26% of the sold shares of stock, Agroton got 54 million dol. (general capitalization is 207 million dol.)
Milkiland Warsaw Stock Exchange Selling 22% actions, a company got 98 million dol. (general capitalization is 438 million dol.)
Ukrainian Agrarian Investments (UAI)
Prepares to IPO2 on Warsaw Stock Exchange
Source: [Skolotianyi 2011].
The market value of the public agricultural holding that work in Ukraine has grown and by the state on early April estimated in 6,3 milliards of dollars. Data from the "Ukrainian Club of Agrarian Business" association shows that index on 10% less index of early, 2011 (7,02 milliards of dol.) September. Although in the same time, for the last four months their capitalization grew on 26%, which testifies to the improvement of situation at the market of equities of agrarian companies.
The derivative of exit on foreign exchange stocks is opening of access to the credit resources of foreign banks, the cost (paying is for the use) of that below, than the Ukrainian banks in 2,0 - 2,5 times. It is worth noting that in this context, the Ukrainian banks gave out credits to the agricultural holding on considerably more attractive terms in comparison with to other agricultural enterprises.
Stimulating influence on development of market integration in agriculture of Ukraine was addressed by a current tax legislation. It is known that for enterprises in the structure of realization of that agricultural production and products of its processing occupy not less than 75%, operated row of tax deductions. Among them an agricultural tax is fixed, zero rate of tax value-added, privileges on separate obligatory payments in a budget. In total, on
2 An initial public offering (IPO) or stock market launch is a type of public offering where shares of stock in a company are sold to the general public, on a securities exchange, for the first time

129
the estimations of specialists, it provided to the agrarian enterprises the tax loading in 3 times below that of other industries of the Ukrainian economy.
For today, according to expert estimations, the average cost of one hectare of agricultural land in Ukraine is about 500 dol., while in Russia there are 800 dol., in Bulgaria - 3100 dol., in Romania - 5000 dol., in Poland - 6600 dol. In the most developed countries this index is higher: the USA - 11000 dol., France - 12500 dol., England - 17100 dol. for a hectare. And a world tendency steadily heads for the further rising in price of the landed resources, among that Ukrainian black soil, as known, stands on the special place. Even if cost of agricultural lands after appearance of market will coincide with a prognosis (from 12 to 20 thousand hrn. for a hectare), it however will be closely to the real cost value of the most strategic Ukrainian resources [Skolotianyi 2011].
Conclusions
Thus, forming and development of the vertically integrated forming - agricultural holding is the realization of agrarian reforms predefined by logic and preferable economic their operating conditions.
Nowadays imperfection of current national agrarian legislation is often discussed. However, an accent is constantly placed toward absence of legal norms in relation to the purchase-sale of land [Stetsiuk 2010, pp. 17-25].
The conducted analysis of activity of the agricultural holding testifies that the form of vertical integration of structural subdivisions has indisputable advantages before other agricultural enterprises, it is more successful and more effective. It is arrived at due to the best found supply of production. The presence of free money gives an opportunity of investing in innovative technologies and expansions of production. Due to own production capacities, the agricultural holding has the opportunity to create the reserved cycle of production, which will give an opportunity to decrease the productive expenses, unit cost, price, and in the future due to it to promote the competitive edges at the market.
Next advantages that arise due to the inlaid investments, the row of lacks of functioning of the agricultural holding appears, in particular, companies are oriented to growing of highly remunerative agricultural cultures, with violations of crop rotations and rational structure of sowing, the fertility-improving of soils and improvement of agricultures does not come true, a social constituent is not provided.
Thus, after the rational and high-efficiency use of agricultural earth agricultural holding, it is necessary to carry out structural agrarian politics in relation to development of agriculture, perfect a land legislation and relations of property on earth and control of its use, set the norms of penalty approvals for unusing or improper use of land, to regulate export-import activity of the agricultural holding and to counterbalance tax payment to the local budgets. Indisputably, by an important factor, also there is defense of national commodity producer, improvement of the system of crediting of enterprises in an agrarian sphere, and having a special purpose program of state support of small and midsize businesses development in the country.

References
ndriychuk V. [2007]: Capitalization of agriculture: the state and economic adjusting of development, Nizhyn, LTD. "Aspect poligraph" Publishing. p. 216.
Cherevko G. [2012]: Agricultural Holding as new organizational form of multiple issues menage in the agribusiness of Ukraine, Agrarian economy, vol. 5, no. 1-2, p. 32.
Commercial code of Ukraine [2003], no. 436 – V, from 16.01.03, p. 144. Dankevich . [2011]: Land-tenure: advantages and lacks of the agricultural holding. pp. 11-16. Didus S. [2011]: Agricultural holding in Ukraine: features of becoming and development, Economy of IC.
no.12.- pp. 96-101. Law of Ukraine "On holding companies in Ukraine", [2009], no. 1617 – V , from 24.07.09. Sabluk P. [2008]: The State and prospects of development of agroindustrial complex of Ukraine. Economy of
Ukraine. no. 12, p. 4. Skolotianyi Y. [2011]: The most strategic resource, Mirror of week. Ukraine. no. 27. Stetsiuk P. . [2010]: Pre-conditions and possibilities of development of integrated gricultural formations:
financial aspect, Announcer Kharkiv National university of agriculture: Economic sciences, Kharkiv, issue 99, pp. 17-25.

131
Karolina Pawlak1
Department of Economics and Economic Policy in Agribusiness Pozna University of Life Sciences
The development and significance of foreign trade in agri-food products in selected preferential trade agreements2
Abstract. The aim of the paper is to present the development tendencies and the significance of agri-food trade in selected preferential trade agreements in both Americas, Asia and Africa. The analysis included the values of trade turnover both within the region and in exchange with third countries, the share of the agri-food trade in the total trade in the region and the share of the regions under investigation in the global agri-food trade. The analysis allowed us to indicate the greatest global exporters and importers of agri-food products. The assessment of trade creation and trade diversion effect in agri-food trade of selected trade agreements was also possible.
Key words: export, import, agri-food products, preferential trade agreement, regional grouping, trade creation effect, trade diversion effect
Introduction
The international agricultural market is supplied mainly from three sources: the countries with the most favourable natural and economic conditions to the development of agriculture, such as the United States, Australia and New Zealand, other highly developed countries, which subsidise their agriculture to a considerable extent, especially the products for export, and poorly developed countries, for which the export of agricultural products is the sine qua non for the import of industrial goods [Przygodzka 2006]. Thus, agricultural trade occupies an important position in the structure of international trade exchange of many countries at different levels of economic development.
The changes which take place in contemporary international trade chiefly consist of the tightening of relations within the existing integrative groups, the development of new trade zones and the pursuit of liberalisation of the rules of global trade exchange [Dybowski 1998]. It is possible to state that the volume and structure of global trade, including the agri-food trade, is the resultant of two opposite but overlapping tendencies, i.e. multilateralism and regionalism. Regionalism, which is defined as the tendency of a specific group of countries to liberalise mutual trade exchange and simultaneously, to discriminate against the other countries of the world (the countries outside the preferential trade area), has a relatively long history [Machlup 1977]. Its beginnings could be traced back to the establishment of the German customs association (Zollverein) in 1853, but it is the establishment of the European Economic Community (EEC) in 1957 that is commonly recognised as the genesis of regionalism in Western Europe.
1 PhD, e-mail: [email protected] 2 The paper is funded by National Science Centre within the research project in the field of basic research – SONATA No. 2011/01/D/HS4/03830, titled “Competitiveness of the agri-food sector of the European Union countries’ (some ranking and typology with the use of ex post and ex ante measures) – proposals for Poland”.

132
Bhagwati [1992] distinguishes two stages of regionalism after World War II3.According to him, the first wave of regionalism appeared in the late 1950s and early 1960s and spread both to developed and developing countries. At the time the idea of regional economic integration became rooted in Europe, Asia, Australia and New Zealand, Latin America and Africa. The second wave of regionalism began in the 1980s, but it boomed in the 1990s. According to the data of the World Bank, from 1990 to 1998, 82 regional trade agreements took effect and more than half of the present free trade zones and customs unions were established or modified during that period [Bijak-Kaszuba 2003]. In contrast to the early forms of regionalism, contemporary regionalism is centred around developed countries4 located in three main regions of the world, i.e. in Europe, both Americas and Asia. Thus, all the countries that play a leading role on international markets became involved in the development of trade blocs, which began to have significant influence on world trade. It is necessary to stress the fact that developing countries showed great activity in the development of preferential trade areas both during the first and second wave of regionalism. However, the impact of the trade systems they established on the global trade was incomparably smaller than that of developed countries. It is significant that the second wave of regionalism swept across a larger number of countries and higher volume of global turnover than the first wave. The high intensity of the processes of formation of regional trade systems in the late 1980s and early 1990s can be accounted for by the domino effect and the growing concern of the countries not associated in appropriate integrative groups not to be marginalised both on the regional and global markets. Finally, as long as the first wave of regionalism had rather minimal effect on the geographical structure of international trade, the second wave caused its distinct reorientation and contributed to the emergence of three trade blocs, which concentrated their activity on America, Europe and the Pacific region and determined the development of global trade5.
According to the data of the WTO, at the beginning of January 2013 there were 354 effective regional trade agreements around the world [Regional Trade Agreements Information System (RTA-IS), http://rtais.wto.org/UI/PublicMaintain RTAHome.aspx, 1.02.2013]. The aim of this paper is to present the development tendencies and the significance of agri-food trade in selected preferential trade agreements in both Americas, Asia and Africa.
Material and research method
The author analysed both the groups of the world’s greatest food exporters and importers and those which have a smaller share in the global agricultural trade, but which attempt to specialise in the exchange of agri-food products and thus they gain a considerable part of the export income in the region. The analysis included the values of trade turnover both within the region and in exchange with third countries, the share of the agri-food trade in the total trade in the region and the share of the regions under
3 For more information on the history of regionalism see Grimwade [1996] and Carpenter [2009]. 4 Fiorentino, Crawford and Toqueboeuf [2009] show that in December 2007 26% of all effective regional trade agreements notified upon Article XXIV of the GATT were agreements between developed countries, whereas 37% of them bound developed and developing countries and 37% bound developing countries only. 5 There are interesting considerations of the subject presented by Schott [1991].

133
investigation in the global agri-food trade. The analysis used the statistics from the database of the United Nations Conference on Trade and Development (UNCTAD). The investigation encompassed foreign trade in the agri-food products classified in sections 0, 1, 22 and 4 of the Standard International Trade Classification (SITC). The period of time subject to analysis depended on data availability and applied to the years 1995 and 2011. Simultaneously, 1995 was the first year when all of the preferential trade agreements under study functioned at the same time6.
The volume and structure of trade in agri-food products in selected preferential trade agreements
The essential premise and simultaneously the condition of the development of international trade is diversification of production in individual countries or, to be more specific – the entities functioning within the borders of those countries, i.e. the specialisation of production. In the agri-food sector it depends on the availability, dynamics and above all on the effective use of the necessary factors of production, including natural resources, to a far greater extent than in other sectors of the national economy. For this reason the significance of the agri-food trade in the preferential trade agreements under study is diversified.
The integrative groups from the region of Latin America and Africa play the least important role in the global exchange of agri-food products. In 2011 the regional import of agri-food products in that region reached the maximum value of 1-2% of the global import, whereas the export, except for the Southern Common Market countries (MERCOSUR) and their nearly 9.5% share in the global export of agri-food products, reached the value of not more than 1.5% of the global export (Tables 1 and 2). However, the importance of the agri-food sector in regional trade in those regions of the world was relatively high. In 2011 agri-food products provided 37%, nearly 36%, 17% and about 20% of regional income from the exports of the MERCOSUR countries, the Central American Common Market (CACM) countries, those of the Common Market for Eastern and Southern Africa (COMESA) and the Andean Community (ANCOM), respectively. The second and third of the groups listed above spent simultaneously more than 13% and nearly 19% of total import expenses, respectively. The importance of agri-food trade in the West African region was only slightly less significant. In the Economic Community of West African States (ECOWAS) the share of agri-food export and import in total trade reached 10.5% and 15.5% respectively. In 2011 the countries of the Caribbean Community (CARICOM) were also distinguished by their high share of the agri-food import, which reached almost 18%, in the total import of products in the region. On the other hand, the export of agri-food products played a less important role in the trade exchange structure of that group, as it amounted only to 8% of the total export of products. Simultaneously, it is worth mentioning that in 1995 the share of income from the foreign sales of agri-food products in that area of the world was about 65% higher and reached the value of about 22.5% of the total export
6 The latest of the trade agreements under study, i.e. the Common Market for Eastern and Southern Africa (COMESA), replaced the Preferential Trade Area for Eastern and Southern Africa established in 1981 and it began to take effect on 8 December 1994.

134
income. From 1995 to 2011 in the CACM there was also a significant decrease of nearly 35% in the importance of agricultural export in the total export of the region.
Table 1. Export of agri-food products in selected preferential trade agreements in 1995 and 2011
Regionaltrade
agreement
Totalagri-food
export (billionUSD)a
The share of the region in
the global agri-food
export (%)
The share of the
agri-food export in the total export in the region
(%)
Agri-food export within the region
Agri-food export to the third countries
BillionUSD
The share in the agri-food export in the region (%)
BillionUSD
The share in the agri-food export in the region (%)
1995
EU-27 208,7 45,4 9,7 149,8 71,8 58,9 28,2
NAFTA 79,5 17,3 9,3 22,4 28,2 57,1 71,8
MERCOSUR 25,0 5,4 35,5 3,9 15,6 21,1 84,4
ANCOM 7,2 1,6 34,0 0,4 5,6 6,8 94,4
CACM 5,1 1,1 54,8 0,4 7,8 4,7 92,2
CARICOM 1,3 0,3 22,4 0,2 15,4 1,1 84,6
ASEAN 32,0 7,0 10,0 6,3 19,7 25,7 80,3
COMESA 5,0 1,1 20,4 0,4 8,0 4,6 92,0
ECOWAS 4,1 0,9 18,5 0,3 7,3 3,8 92,7
2011
EU-27 558,8 40,3 9,3 425,0 76,1 133,8 23,9
NAFTA 196,5 14,2 8,6 80,4 40,9 116,1 59,1
MERCOSUR 130,7 9,4 37,0 9,3 7,1 121,4 92,9
ANCOM 21,1 1,5 20,3 1,8 8,5 19,3 91,5
CACM 12,6 0,9 35,8 1,9 15,1 10,7 84,9
CARICOM 1,7 0,1 8,1 0,5 29,4 1,2 70,6
ASEAN 131,3 9,5 10,5 27,8 21,2 103,5 78,8
COMESA 16,3 1,2 16,9 3,1 19,0 13,2 81,0
ECOWAS 15,3 1,1 10,5 1,8 11,8 13,5 88,2 a – the value covers sections 0, 1, 22 and 4 of the Standard International Trade Classification (SITC) Source: UNCTADStat, http://unctadstat.unctad.org/ReportFolders/reportFolders.aspx, 29.01.2013; own calculations.
It is necessary to note the fact that except for the import of agri-food products to the MERCOSUR countries, and in 2011 to the CACM countries as well, the signatories of the aforementioned trade agreements achieved more than 70% of the turnover in agri-food products with third countries, which may indicate small impact of the trade diversion effect which accompanied the formation of a preferential trade area. Trade in those regions was above all created. The investigated integrative groups from Africa and Latin America, except the CARICOM and CACM, were characterised by some of the world’s highest rates of increase in the agri-food export. From 1995 to 2011 the rate of increase in export rose
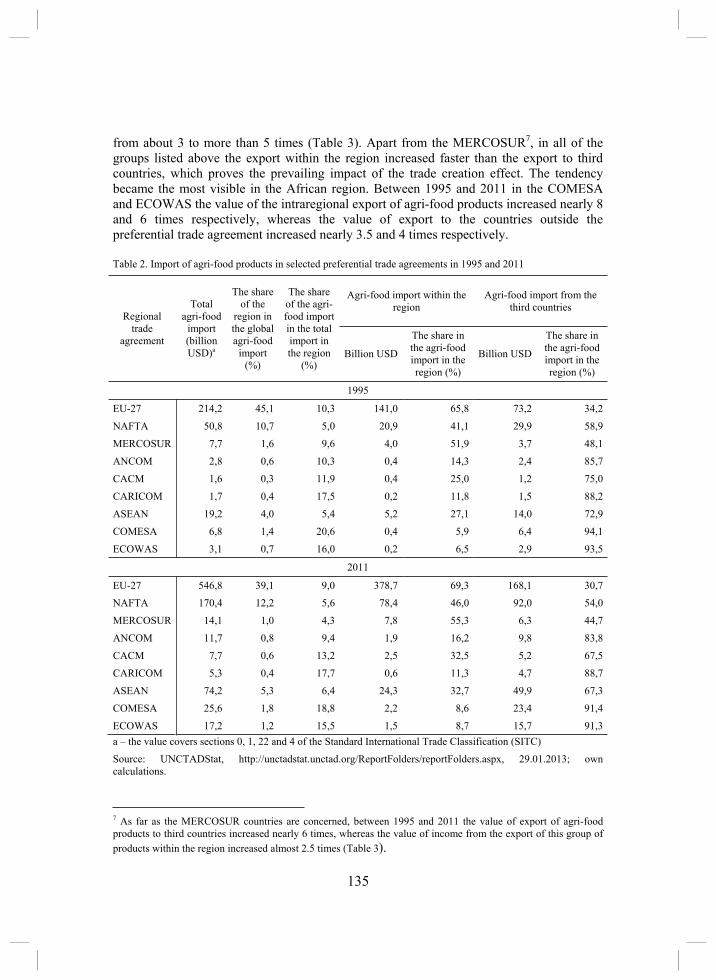
135
from about 3 to more than 5 times (Table 3). Apart from the MERCOSUR7, in all of the groups listed above the export within the region increased faster than the export to third countries, which proves the prevailing impact of the trade creation effect. The tendency became the most visible in the African region. Between 1995 and 2011 in the COMESA and ECOWAS the value of the intraregional export of agri-food products increased nearly 8 and 6 times respectively, whereas the value of export to the countries outside the preferential trade agreement increased nearly 3.5 and 4 times respectively.
Table 2. Import of agri-food products in selected preferential trade agreements in 1995 and 2011
Regionaltrade
agreement
Totalagri-food
import (billionUSD)a
The share of the
region in the global agri-food
import (%)
The share of the agri-food import in the total import in the region
(%)
Agri-food import within the region
Agri-food import from the third countries
Billion USD
The share in the agri-food import in the region (%)
Billion USD
The share in the agri-food import in the region (%)
1995
EU-27 214,2 45,1 10,3 141,0 65,8 73,2 34,2
NAFTA 50,8 10,7 5,0 20,9 41,1 29,9 58,9
MERCOSUR 7,7 1,6 9,6 4,0 51,9 3,7 48,1
ANCOM 2,8 0,6 10,3 0,4 14,3 2,4 85,7
CACM 1,6 0,3 11,9 0,4 25,0 1,2 75,0
CARICOM 1,7 0,4 17,5 0,2 11,8 1,5 88,2
ASEAN 19,2 4,0 5,4 5,2 27,1 14,0 72,9
COMESA 6,8 1,4 20,6 0,4 5,9 6,4 94,1
ECOWAS 3,1 0,7 16,0 0,2 6,5 2,9 93,5
2011
EU-27 546,8 39,1 9,0 378,7 69,3 168,1 30,7
NAFTA 170,4 12,2 5,6 78,4 46,0 92,0 54,0
MERCOSUR 14,1 1,0 4,3 7,8 55,3 6,3 44,7
ANCOM 11,7 0,8 9,4 1,9 16,2 9,8 83,8
CACM 7,7 0,6 13,2 2,5 32,5 5,2 67,5
CARICOM 5,3 0,4 17,7 0,6 11,3 4,7 88,7
ASEAN 74,2 5,3 6,4 24,3 32,7 49,9 67,3
COMESA 25,6 1,8 18,8 2,2 8,6 23,4 91,4
ECOWAS 17,2 1,2 15,5 1,5 8,7 15,7 91,3 a – the value covers sections 0, 1, 22 and 4 of the Standard International Trade Classification (SITC)
Source: UNCTADStat, http://unctadstat.unctad.org/ReportFolders/reportFolders.aspx, 29.01.2013; own calculations.
7 As far as the MERCOSUR countries are concerned, between 1995 and 2011 the value of export of agri-food products to third countries increased nearly 6 times, whereas the value of income from the export of this group of products within the region increased almost 2.5 times (Table 3).

136
The EU-27 countries were the world’s largest exporter and importer of agri-food products, because in 2011 they spent nearly 547 billion dollars to purchase agri-food products abroad, whereas they achieved the income of 559 billion dollars from the sales of domestic products on foreign markets, which made about 40% of global agricultural turnover (Tables 1 and 2). In contrast to the developing countries, most of the trade was done as the intra-EU trade, whose rate of increase between 1995 and 2011 was higher than the rate of exchange with third countries (Table 3). The transactions completed between the EU member states during that period can be estimated at about 66-76%, which proves the fact that apart from the creation effect, the formation of a preferential trade area also resulted in a trade diversion effect. As a result, the geographical structure of the exchange became reoriented and the more effective trade partners from the countries outside the zone, who did not avail themselves of preferences, were replaced with less effective but preferentially treated suppliers from other member states of the EU8. The agri-food sector in regional trade in the EU-27 was of lesser importance than in Latin American and African countries. The share of agri-food turnover in the total commodity trade in the EU was about 10% in 1995 and about 9% in 2011.
Table 3. The dynamics of export and import of agri-food products in selected preferential trade agreements in 1995-2011 (1995=100)
Preferential trade agreement
Export Import
Total Intraregional To the third countries Total Intraregional
From the third
countries
EU-27 267,8 283,7 227,2 255,3 268,6 229,6
NAFTA 247,2 358,9 203,3 335,4 375,1 307,7
MERCOSUR 522,8 238,5 575,4 183,1 195,0 170,3
ANCOM 293,1 450,0 283,8 417,9 475,0 408,3
CACM 247,1 475,0 227,7 481,3 625,0 433,3
CARICOM 130,8 250,0 109,1 311,8 300,0 313,3
ASEAN 410,3 441,3 402,7 386,5 467,3 356,4
COMESA 326,0 775,0 287,0 376,5 550,0 365,6
ECOWAS 373,2 600,0 355,3 554,8 750,0 541,4 Source: Own calculations based on the data from table 1 and 2.
The countries of the North American Free Trade Agreement (NAFTA) were the second largest participant of international agri-food markets, as in 2011 their export value was 196.5 billion dollars and the import value exceeded 170 billion dollars, thus making about 14% of the world’s export and 12% of the import, of which 41-46% was concentrated in the region (Tables 1 and 2). The share of the agri-food export in the total commodity export of the NAFTA countries was similar to that of the EU-27 countries. However, the import of food was of lesser importance, which points to a higher level of food self-sufficiency and in consequence – a smaller degree of import penetration of the market in
8 For more information on the effect of creation and diversion in the agri-food trade between the EU countries from the Central and Eastern European region see Pawlak [2011].

137
that region. Due to the high degree of food self-sufficiency of the NAFTA countries, especially the USA and Canada, and due to the export specialisation of those countries not only in agri-food products but also in industrial, diversified products, with higher value added, the rate of increase in the agri-food trade in those countries between 1995 and 2011 was one of the lowest of all the regional groupings under analysis9 (Table 3).
What also deserves attention is the stronger position of the Association of South-East Asian Nations (ASEAN) as an exporter of agricultural products. From 1995 to 2011 the value of export of agri-food products from this integrative group increased more than 4 times and in the last year under investigation it exceeded 131 billion dollars (Tables 1 and 3). At the same time a nearly four-fold increase in import expenses could be observed, which reached the value of over 74 billion dollars in 2011. The share of income from the sales of this group of products in the total commodity export from the region in 2011 was 10.5% and it was 1.2% and 1.9% higher than in the EU and NAFTA countries, respectively (Table 1). Globally in 2011 the ASEAN countries provided 9.5% of the agri-food export value and they were the world’s third largest food exporter. Their share in the global import of agri-food products was smaller and amounted to about 5% (Table 2).
It is important to note that due to the complementary structure of production and, in consequence, their export offer, the ASEAN countries completed about 80% of their export and 70% of import with the countries outside the association. However, from 1995 to 2011 the rate of increase in the intraregional turnover was higher, especially in imports. Thus, it is possible to draw a conclusion that the establishment and functioning of the ASEAN free trade area resulted in a stronger trade creation rather than trade diversion effect. The geographical structure of exchange and the considerable share of third countries in it were largely developed by the trends in specialisation of production and availability of specific products, which caused the need of exclusive import both in the countries belonging to the group and in its external trade partners.
Concluding remarks
To sum up, it is possible to say that the two waves of regionalism and the domino effect they caused led to the concentration of the most important trade agreements in the global trade system in three regions, i.e. in Europe, both Americas and Asia, with a smaller share of preferential trade areas in Africa. It is necessary to note the fact that contemporary preferential trade agreements break the scheme of integration of the countries at a similar level of economic development, which was characteristic of the first stage of regionalism. The regional systems established in the 1990s connect countries with different degrees of development, the examples of which are such organisations as the EU-27, NAFTA or COMESA. This fact results not only from different conditions in which regionalism developed at the end of the 20th century but also from a change in the strategy of foreign trade in the developing countries, which was manifested by its increased openness.
The dependence of production and its trends in specialisation on the natural conditions and access to natural resources causes differences in the importance of agri-food trade in individual integrative groups. The world’s greatest exporters and importers of agri-food products were the EU-27 and NAFTA countries. However, the importance of agricultural
9 Without the rate of increase in export in the CARICOM countries.

138
turnover in the total commodity trade structure was relatively small in them and fluctuated around 10% of the total volume, which means that highly developed countries more often tend to specialise and make profit from the export of industrial products. In contrast to them, the countries concentrated in the integrative groups from the regions of Africa and Latin America do not play an important role in the global exchange of agri-food products in spite of the relatively high importance of the agri-food sector in regional trade, which could be observed there.
The establishment and functioning of a preferential trade area is accompanied by the trade creation and diversion effect. The impact of these two effects in the regional groupings under study was diversified. The strongest diversion effect could be observed in the EU-27 countries, where 66-76% of their agri-food turnover was part of the intra-EU trade. In the other groups trade creation was more visible than trade diversion, which resulted in a larger scale of trade with third countries. This leads to a conclusion that regional trade liberalisation did not inhibit the development of global agricultural trade.
On the one hand, a less complex character of negotiations and a greater ability to reach an agreement undoubtedly implicate the easiness of signing regional trade liberalisation agreements and speak in favour of them. On the other hand, by liberalisation of trade on a smaller scale regional trade agreements offer less profit to the producers of specific goods. It is so because of the fact that regional liberalisation contributes to a less dynamic increase in global prices than in the case of multilateral liberalisation and additionally, it offers producers smaller compensation due to the limitation of price support. However, in view of the fact that the WTO plays an important role in the liberalisation of trade in industrial products and its effects concerning agricultural trade are less significant10, it is possible to conclude that regional trade agreements are an effective form of liberation and stimulation of the development of agricultural trade.
References
Bhagwati J. [1992]: Regionalism versus Multilateralism. The World Economy, vol. 15, No. 5. Bijak-Kaszuba M. [2003]: Regionalna liberalizacja handlu mi dzynarodowego a zmiany strukturalne
zagranicznych obrotów towarowych kraju uczestnicz cego (na przyk adzie Polski). Wydawnictwo Uniwersytetu ódzkiego, ód .
Carpenter T. [2009]: A Historical Perspective on Regionalism, [w:] Multilateralizing Regionalism. Challenges for the Global Trading System, R. Baldwin, P. Low (red.). Cambridge University Press, Cambridge.
Dybowski G. [1998]: Uwarunkowania handlu zewn trznego Polski towarami rolno-spo ywczymi, [w:] Identyfikacja priorytetów w modernizacji sektora rolno-spo ywczego w Polsce. FAPA, Warszawa.
Fiorentino R. V., Crawford J., Toqueboeuf Ch. [2009]: The Landscape of Regional Trade Agreements and WTO surveillance, [w:] Multilateralizing Regionalism, R. Baldwin, P. Low (red.). Cambridge University Press, Cambridge.
Gibson P., Wainio J., Whitley D., Bohman M. [2001]: Profiles of Tariffs in Global Agricultural Markets. Agricultural Economic Report No. 796, Market and Trade Economics Division, Economic Research Service, U.S. Department of Agriculture, Washington D.C.
Grimwade N. [1996]: International Trade Policy. A contemporary analysis. Routledge, London, New York. Ingco M. [1995]: Agricultural Trade Liberalization in the Uruguay Round. One Step Forward, One Step Back?
Policy Research Working Paper 1500, International Trade Division, The World Bank, Washington D.C.
10 In 1992 the level of customs tariffs on agricultural products was about 15 times higher than the tariffs on industrial products, whereas in 2001 when the period of implementation of the Uruguay Round decisions in developed countries finished, the duties on agricultural products were still 12 times higher than those on industrial products. See Ingco [1995] and Gibson et al. [2001].

Machlup F. [1977]: A History of Thought on Economic Integration. The Macmillan Press Ltd., London, Basingstoke.
Pawlak K. [2011]: The static effects of customs union in agri-food trade of the New Member States of the European Union. Annals of The Polish Association of Agricultural and Agribusiness Economists, Volume XIII No. 6, Warszawa-Pozna -Wroc aw.
Przygodzka R. [2006]: Fiskalne instrumenty wspierania rozwoju rolnictwa – przyczyny stosowania, mechanizmy i skutki. Wydawnictwo Uniwersytetu w Bia ymstoku, Bia ystok.
Regional Trade Agreements Information System (RTA-IS). [Available at:] http://rtais.wto.org/UI/PublicMaintain RTAHome.aspx. [01.02.2013].
Schott J. J. [1991]: Trading Blocks and the World Trading System. The World Economy, vol. 14, No. 1. UNCTADStat. [Available at:] http://unctadstat.unctad.org/ReportFolders/reportFolders.aspx. [29.01.2013].

140
Iryna Petrovska1
Department of Economics of Agricultural and International Economic Relations Warsaw University of Life Sciences – SGGW
The cut flower markets of Poland and Ukraine in the EU
Abstract: Distribution channels play an important role for the market. The cut flower market has big potential for development in such countries as Ukraine and Poland. In the article there outlined a comparison of distribution channels of cut flowers in European countries. A model of the distribution system was created which determined the main locations of flower trade in the European countries.
Key words: cut flower market, distribution channels, auction
Introduction
Development of the flower market depends on market segmentation. In other words, the place for selling product is important for market agents. That is why in this article is described research into the market segmentation of European countries.
Distribution channels play a very important role for a flower company. The paper compares distribution channels at the European flower market. It also shows the general model of distribution channels in the flower markets of Poland and Ukraine.
The role of wholesale markets and auctions is very important for the country. Many wholesale markets create their own web-sites where there is possibility to conduct online trading. Thanks to well-developed information systems this type of trading works very well and makes trade easier. Now sellers and buyers can easily find each other. They don’t need to spend time looking for buyers and at the same time they reduce their needs for warehousing, which reduces costs.
If a company works with a certain type of product (for example, flowers), there could appear also problems with the time between product tracking from the buyer to seller. That is why it is very important for the seller to find a buyer as fast as possible in order to have fresh products.
Flower production is very specific and needs special care. Flowers should have special conditions for transportation and for warehousing. The development of effective distribution channels is very important in this case.
Research goal, research methods and materials
The main goal of the research is to create a model of the distribution system of the flower market. The second goal is to define the most popular place for flower trade in Europe.
1 Msc, e-mail: [email protected]

141
The following research methods were used: analytical observation of flower market activity in Europe and method of data analysis using statistical reports.
The following research materials were used: statistical reports of CBI and BTC statistics, wholesale institution and auctions.
Development of cut flower market in Europe
The majority of flowers on the European market are sold at the Dutch auctions. This system has big impact on trade because it includes the auction’s long-distance buying system and other intermediary services. The flower trade is based on digital product images. The market also rates growers according to the quality level of their products. RFID tracing systems monitor the quality level of products such as delivery time, temperature and location.
The number of supermarkets is growing. That is why the market share of supermarkets in the sales of cut flowers also increased, as has the buying power of retailers. The cut flower market in Europe is diversified with many markets and florists. [CBI 2012]
For the most part, customers in Poland buy flowers from florists. The number of florist shops remains stable. In Poland, street vendors also play an important role. The cut flower market of Poland has grown significantly during the last years. Also the supply of locally produced flowers has increased.
The main characteristics and dynamics of the EU flower trade are the following [CBI 2012]:
The Netherlands is the center of the European flower trade. The Netherlands auctions sell more than 50% of exported flowers in the EU. Auction is the central market place for sellers and buyers of cut flowers from all around the world to meet.
The volume of direct trade is growing. Only 4% of the total number of companies create 50% of export turnover. The number of growers from developing countries which export directly to the EU market is increasing.
There are two segments of the cut flower market: o Specialized market channel: This channel contains sales from florists,
street and market stalls and others. The most important characteristic of this channel is that flowers are the main and dominant product at the market.
o The unspecialized market channel: This channel contains supermarkets, petrol stations and DIY stores. The main characteristic of this channel is that flowers are a secondary product there.
The Dutch Flower Group has annual turnover of more than 1 billion euro. It is the biggest wholesale market in Europe
Below is presented the flower market segmentation according to geographical areas. These areas have specific behavior and consumption. They are the following[CBI 2012]:
o Western and Northern Europe is the biggest single segment and such countries as Switzerland, the Netherlands, Germany, Belgium and France consumed the largest amount of cut-flowers per capita in 2011. Cut flowers were mostly sold in florist shops and supermarkets. In the UK, cut flowers were sold mostly in supermarkets. There is seen also slow growth because of the crisis.

142
o Southern Europe has a different tendency of growth. The cut flower consumption is going down. The flowers are sold mostly in florist shops and supermarkets.
o In the Eastern Europe segment, the main characteristics are: in such countries as Sweden and Finland the cut flower consumption increased. Mostly flowers were sold in florist shops. But also there has appeared development of garden centers in terms of market share.
The Flora Holland platform helps enter the European market. For this purpose they provide extensive service for companies. Exporting through the auction is needed if the company doesn’t have any experience and knowledge of exporting directly to the EU market. In order to become trusted and long-term suppliers, it is required to focus on segment, market channel and range.
There are presented the main import countries which supply flowers to EU in Fig. 1.
Fig. 1. The main suppliers of cut-flowers imported to EU, million Euro
Source: made by author using statistical data from report “The European Markets for Fair and Sustainable Flowers and Plants”, [BTC 2010]
The main supplier of cut flowers in EU is the Netherlands. The second, third and fourth places belong to non-EU countries such as Kenya, Ecuador and Colombia.
Cut flower market’s segments
In the specialized segment, the Dutch flower auction plays the main role. The wholesalers very often buy flowers there and then sell them to the European florists. There is a more diversified range of products at the specialized florists than at supermarkets.
0
500
1000
1500
2000
2500
3000 2005
2007
2009

143
Usually at florist shops it is possible more often to buy some specific types of flowers with higher quality than at the supermarket.
There are the following trends on specialized segment [CBI 2012]: Italy, Spain, France: most flowers are bought in florists Eastern Europe: florist market share is from 65-85%. Scandinavian countries: the market share of florists is going down. The importance of remote buying should also be mentioned. Thanks to a well-
developed auction system the share of non-Dutch buyers is increasing at the auction. That is why it is important for the flower company at least to have accesses to the internet. The development of ITC is the second important thing which helps to lead company purchases.
Information plays a very important role at the auction. Mostly there is found long-distance buying. In this case, grower’s information is very important for the buyers. The correct information creates the reputation of the supplier and has influence on trade.
Considering unspecialized market the following trends are present [CBI 2012]: The major players are: Tesco (UK), Aldi (Germany), Carrefour (France), Royal
Ahold (the Netherlands) and Suinsbury (UK). They have a big influence on the market. Unspecialized market segment increased in UK, the Netherlands, Germany and
Scandinavian countries Certification plays an important role here. Here also exist additional requirements
to growers connected with sustainable and social responsibility. There is shown a big amount of imported flowers at the unspecialized market [CBI
2012].
Table 1. Comparison of distribution channels shares between EU countries, %
Distribution channels of cut
flowers Belgium Denmark France The
Netherlands Germany Italy Poland
Florists 63 50 68 53 63 63 75
Supermarkets 13 27 14 19 13 7 5
Markets/Street sale
10 6 5 11 5 6 5
Garden Centers 5 3 4 6 2 3 5
Market Garden/Nursery
3 5 3 3 8 7 4
Kiosks 2 1 2 5 1 11 3
BuildingCenters
1 0 1 1 2 1 0
Others 3 8 4 3 5 2 3
Source: Market Intelligence: Cut Flowers and Foliage, [CBI 2012].

144
Fig. 2. Market share for cut flower in Poland per sales channels in %
Source: Market Intelligence: Cut Flowers and Foliage [CBI 2012].
Fig. 3. Market share for cut flower in the Netherlands per sales channels in %
Source: Market Intelligence: Cut Flowers and Foliage [CBI 2012].

145
Fig. 4. Market share for cut flower in Ukraine per sales channels in %
Source: made by author using work of Solomacha .V.[2011]
According to data presented in Table 1, most flowers are sold by florists in each EU country. In Poland the distribution channel “Florist” took 75 %, more rarely flowers are sold in kiosks. Also, supermarkets are not a popular place for buying flowers in Poland and Ukraine. More often flowers are sold by the supermarkets in such countries as Denmark (27%), the Netherlands (19%) and France (14%). In Italy the kiosk is also a popular place for buying flowers. Such distribution channels as “market and street sales” is the most popular in Belgium and Netherlands in comparison with other countries.
At the flower market of Poland the share of florists went down during the period from 2009 till 2011 (Fig. 2), but the share of supermarkets and gardening centers increased during these years.
At the flower market of Netherlands (Fig. 3) there is presented a small decrease of florist’s share, but an increase in the share of unspecialized segment such as supermarkets during three years from 2009 till 2011. The number of street markets and kiosks went down. There was an increase in the share of farms as cut flower retailers.
In Fig. 4 are presented changes in market shares of distribution channels in Ukraine. In Ukraine, the florists don’t take the biggest share on the flower market, as it was observed in EU countries. The most popular place for buying flowers is markets and street sales, the second one – small flower shops. The market segmentation between Ukraine and EU countries doesn’t have many similarities. The number of street sales and small flower shops became bigger. The share of florists was decreased during one year from 2009 till 2010.
For entering the EU, a flower company can choose different ways. In this purpose there are presented the following methods of starting trade at EU market [BTC 2010]:
Through the auction

146
Through the import agents to the wholesale or auction Directly to the retailer (large supermarket chain) Directly to the wholesaler.
The model of distribution channels for flowers entering the EU market is shown on Fig. 5.
Fig. 5. Model of distribution channels for flowers entering the EU market
Source: The European Markets for Fair and Sustainable Flowers and Plants, [BTC 2010].
Fig. 6. The model of distribution channels system in Poland and Ukraine
Source: made by author using Jablonska L. [2007], Jablonska L. [1995, Perner L.[2008].
As was already mentioned in the article, flower production needs special conditions, which is why direct trade is very important to make it possible for flowers to stay fresh during long periods. Below is a table showing a model of distribution channels system in Poland and Ukraine (Fig. 6).
In Ukraine almost 90% of flowers came from import. There do not exist many domestic growers on the market. According to the model shown, at first growers and
Consumer
Retail
Wholesale
AuctionAgents
Wholesale market
Retailers
Growers and importers
Gardening centers
Market/streetsales
Florists
OthersKiosks
Market garden
Supermarkets
Exporters
Growers/Exporters

147
importers bring flowers to retailers or to wholesale markets. After wholesale markets, flower products go to retailers or exporters. On the next stage retailers sell flowers to specialized and unspecialized segments such as florists, market and street sales, gardening centers, supermarkets, market gardens, kiosks and others. Then from these distributors flowers are sold to customers.
Internet flower shops as a prospective distribution channel for the flower market in Poland and Ukraine
Bringing products to the buyers immediately requires from sellers the so-called skill of “fast finder of buyers”. As an example, we can take the Flower Auctions in Holland. Thanks to their information systems, buyers can even sell their products just directly from their home. There is no faster way for bringing together the buyer with the seller. Here members save their time. They can find each other faster, more transactions can be made and as a result – profit will be increased.
Such online trading should be introduced in countries such as Poland and Ukraine. Talking about ITC development it should be taken into account the number of internet users. Access to the Internet plays an important role for entering the EU cut flower market.
According to the statistical data in Fig. 7, Ukraine has the lowest share of internet users. The amount of internet users in Poland is higher at around 10 million. The difference is quite big, almost double. But anyway, there are also perspectives for Internet development in Ukraine, because the number of internet users is growing now. The biggest share of internet users belongs to The Netherlands. More than 50% of the population of each country as presented in the figure, aside from Ukraine, use the Internet.
Online trading gives advantages for the company such as quickly connecting sellers and buyers, trading just directly from the home or working place.
Fig. 7. The internet user share of population in European countries in year 2012, %
Source: made by author using statistical data from Internet World Stats [2013].
0 20 40 60 80 100
Ukraine
Netherlands
Poland
Italy
France
Germany

148
Conclusions
This article compared the development of flower market distribution channels between the most developed EU countries, Poland and Ukraine. The main goal of the research was to determine the main places for flower trade at the European market and create a model of distribution channels system for the Polish and Ukrainian flower markets.
The following conclusions were made: In Europe the share of unspecialized segments increased, especially for such distribution channels as supermarkets. Mostly in Europe flowers are sold by florists. The Netherlands are the center of European flower trade. Thanks to auctions, companies are able to lead their activity more efficiently. Information plays a very important role at the auction. It is an instrument of creating the company’s reputation. In the developing country (Ukraine) the main place for selling and buying flowers is market and street sales. In Poland also street sales have become more popular nowadays. The flower markets in Poland and Ukraine have big potential for developing. As a model of development, the Holland auction should be taken as an example. Trading by auction gives a big advantage for traders: a decrease in transaction costs. The economic crisis creates a high level of uncertainty in the flower market, because many florists have liquidity problems. Supplying through the auction helps guarantee a more constant cash-flow. If a company wants to supply into the EU market it is better to start from the flower auction.
Bibliography
Jablonska L. [2007]: Ekonomiczne perspektywy rozwoju sektora kwiaciarskiego w Polsce, Wydawnictwo SGGW, Warszawa.
Jablonska L. [1995]: Okre lenie perspektyw polskiego kwiaciarstwa na podstawie d ugookresowej analizy porównawczej i jego rozwoju w Polsce i Holandii, Fundacja „Rozwój SGGW, Warszawa.
Perner L.[2008]: Channels of distribution [Available at:] http://www.consumerpsychologist.com/distribution.html [February 2013].
Solomacha .V.[2011]: [Available at:] http://archive.nbuv.gov.ua/portal/Soc_Gum/Vcndtu/2010_44/21.htm[February 2013].
BTC [2010]: The European Markets for Fair and Sustainable Flowers and Plants. [Available at:] http://www.befair.be/sites/default/files/all-files/brochure/The%20European%20Market%20for%20Fair%20 and%20Sustainable%20Flowers%20and%20Plants_1.pdf. [February 2013].
CBI [2012]: Market Intelligence: Cut Flowers and Foliage [Available at:] http://www.cbi.eu/About%20CBI/sectors/Cut%20flowers%20and%20foliage/1857 [February 2013].
Internet World Stats [2013]: Internet Usage in Europe [Available at:] http://www.internetworldstats.com/ [February 2013].

149
Krystyna Rejman1, Sylwia Walkowska2, Ewa Halicka3
Department of Organization and Consumption Economics Warsaw University of Life Sciences – SGGW
Application of nutritional marketing tools in press advertisements
Abstract. In chosen periodicals of the food industry and so-called “women’s press,” food advertisements containing nutritional marketing messages were analysed. The frequency and type of these tools was observed and scientific value and correctness was evaluated. The study results show that most of the advertisements do not comply with current legal regulations. Producers often emphasize the presence of ingredients which are recommended from the nutritional point of view although the product’s overall nutritional value is low or controversial.
Key words: food, nutrition and health claims, nutritional marketing, advertisement, magazines
Introduction
Consumers are increasingly becoming more interested in healthy lifestyles and in ways to introduce rational and balanced diets. This trend has inspired many food producers to develop unconventional marketing tools, such as “nutritional marketing.” Nutritional marketing is defined as a new method of providing scientifically proven information about food products, including their positive influence on human body and health, which should in turn lead to pro-health consumer choices and – over the long-term – to health and economic advantages in the population [Rejman and Halicka 2008]. It is therefore a form of activation (boosting) and promotion of sales, which utilizes data on nutritional value and health aspects of food products in the process of communication with consumers.
Nutritional marketing uses the following tools: 1. Nutritional value information – up to now, still voluntary data placed by producers on
the food product packaging. The “Regulation (EU) No 1169/2011 of the European Parliament and of the Council of 25 October 2011, on the Provision of Food Information to Consumers” makes it obligatory for all producers from December 2016. Currently the obligation applies only to the labelling of food products enriched with vitamins and minerals as well as with nutrition and health claims [Wierzejska 2012].
2. Claims – defined for the first time in the European legislation in 2006. The “Regulation (EC) No 1924/2006 of the European Parliament and of the Council of 20 December 2006 on Nutrition and Health Claims Made on Foods” (with subsequent changes) stipulates labelling rules from July 2007 and defines claim as “any message or representation, which is not mandatory under Community or national legislation, including pictorial, graphic or symbolic representation, in any form, which states, suggests or implies that a food has particular characteristics”. The regulation differentiates three types of claims:
1 Doctor habilitated, e-mail: [email protected] 2 Msc, e-mail: [email protected] 3 PhD, e-mail: [email protected]

150
A. Nutrition claims – which concern the particular beneficial nutritional properties of the given food product due to the energy (calorific value) it provides, provides at a reduced or increased rate, or does not provide; and/or the nutrients or other substances it contains, contains in reduced or increased proportions, or does not contain. The product could be labelled solely with claims specified in the list of claims generated and lead by the European Commission, and with respect to the given application terms. The list of claims contains 29 types of nutrition claims.
B. Health claims – which state, suggest or imply that a relationship exists between a food category, a food or one of its constituents and health. This group is divided into two types of claims: 1) generic claims, which regard the role of nutrient or other substance in growth,
development or physiological functioning of human body; 2) reduction of disease risk claims, which regard significant reduction of risk factor in
the development of a human disease. C. The list of 222 permitted generic health claims which may be made on food, other than
those referring to the reduction of disease risk and to children’s development and health, was set out in the Commission Regulation (EU) No 432/2012 of 16 May 2012. It applies to all food producers since December 14th, 2012.
3. Voluntary nutrition-labelling schemes, like GDA (Guideline Daily Amount) or “My Choice”, which are front-of-pack labels with the aim to help consumers choose food products facilitating the adoption of a balanced diet.
Nutritional marketing contributes to an increase in nutritional awareness among consumers through enhanced knowledge about food and nutrition and the links between them [Rejman and Halicka 2008]. In consequence food choice can in larger degree be determined by the anticipation of health consequences of individual diets [Rejman and Borowska 2009].
Nutritional marketing can bring not only social benefits, but also help to build competitive advantages of food businesses. By emphasizing the nutritional qualities and health benefits of certain food products, companies can build their positive image based on concern about consumer health. Nutritional marketing can be introduced in all stages of the company’s marketing strategy according to the “5P” concept (i.e. Product, Place, Price, Promotion, Packaging). Food companies which provide information matching the needs and knowledge of consumers or introduce nutrition or health claims, urge potential buyers to become acquainted with their market offer [Rejman and Halicka 2008].
This type of marketing was for the first time used at the beginning of 1990s on the US food market. In the following 15 years an unprecedented increase in its application was observed [Colby, 2006] and legal regulations in this matter became highly advanced. Producers who wanted their products to “stand out” introduced information on their pro-health properties on packaging and marketing releases. However, many of these claims are not scientifically proven and do not comply with current regulations.
Aim and method
The aim of this paper was to analyse the application of nutritional marketing in advertising press releases. Randomly chosen periodicals, available in Poland between January 2010 and June 2012, were reviewed. These included: Poradnik Handlowca and

151
Przemys Spo ywczy (monthlies focused on the food market and food processing) as well as: Olivia, Poradnik Domowy, Shape, Twój Styl (monthlies dedicated to women). In the selected magazines – 30 issues of each title – the frequency of food advertisement publications was analysed. Additionally the number and character of nutritional marketing arguments was studied and the correctness of given information (nutrition and health claims) was evaluated.
Results
The conducted research showed that the largest number of food advertisements was published in the Poradnik Handlowca magazine (56% all total food ads), while the smallest was in Przemys Spo ywczy (5.5%). Marketing releases in the overviewed food industryperiodicals seldom refer to nutritional and health arguments and definitely more often accentuate the high quality of a certain product, its market share or packaging change. In the analyzed time not one nutritional marketing advertisement was found in PrzemysSpo ywczy. In Poradnik Handlowca only 7% of all food ads included nutritional information.
Food advertisements in monthly magazines focusing on women comprised less than 20% of all ads, but the largest percentage include nutritional marketing: ranging from an average of (in studied years) 36% in Poradnik Domowy to almost 65% in Shape (Table 1).
Table 1. Total food advertisements (A) and with nutritional marketing arguments (B) in the chosen magazines in the period of January 2010 – July 2012 (% of all advertisements)
Magazine title On average 2010 2011 2012
A B A B A B A B
Poradnik Handlowca 56.1 7.2 57.7 7.1 56.9 6.9 51.7 7.7
Przemys Spo ywczy 4.5 0.0 4.0 0.0 4.9 0.0 4.6 0.0
Olivia 17.6 44.3 16.7 49.4 21.2 34.7 11.3 63.6
Poradnik Domowy 15.6 35.8 18.3 40.5 12.3 25.5 15.7 38.2
Shape 14.8 64.9 19.8 60.4 11.9 69.6 6.7 85.7
Twój Styl 10.2 32.9 11.3 39.4 9.3 24.4 10.0 38.2
Source: own calculations.
The analysis of collected data shows that the number of advertisements using nutritional marketing tools concerning the nutritional value, nutritional and pro-health characteristics of food stuffs decreased in 2011. However in the first half of 2012, an increase was observed and the percentage in all titles/magazines surpassed those of 2010. In two periodicals these tools were applied in more than 50% of advertisements (64 and 86%)
Analysis of the nature of advertisements applied in press releases with nutritional marketing arguments in the studied period (Figure 1 and Table 2) demonstrates that in the magazines for women, readers were most frequently informed (in 42% of ads) about presence of certain food ingredients, mainly fibre, vitamins, minerals and polyunsaturated

152
fatty acids. The highest number of such messages were found in Poradnik Domowy magazine – in the whole period circa 50% of all advertisements had nutritional and health messages, and in 2011 more than 90%. In almost 20% of press advertisements producers referred to the product’s influence on health, emphasizing that it “lowers the level of bad cholesterol”, “regulates blood sugar”, “influences the development of bones” or “increases body resistance”. In 9% of the ads consumers were informed that the product has “no sugar added”, in 8% – that its components were of natural origin, and in circa 5% – that the product had a lower content of fat, sugar or salt.
Fig. 1. The nature of nutritional marketing arguments in advertisements (% of all nutritional information)
Source: own calculations.
Table 2. Nutritional marketing arguments used in food advertisements in women press (% of all nutritional information)
Information Olivia Poradnik Domowy Shape Twój Styl
Specific nutrient contents 45.4 46.4 39.7 38.3
Healthy 8.2 0.0 12.7 6.7
Natural ingredients 11.3 10.7 0.0 5.0
No sugar added 7.2 8.3 11.1 6.7
No monosodium glutamate, preservatives etc. 6.2 7.2 6.3 16.6
Reduced nutrient contents 7.2 2.4 6.3 5.0
Better health 12.4 25.0 17.5 21.7
Low-calorie product/light 2.1 0.0 4.8 0.0
Without milk 0.0 0.0 1.6 0.0
Source: own calculations
25
3,3
9,8
3,3
31,5
6,5
14,1
2,2
0
3,3
43,1
6,6
7,6
8,2
8,6
5,3
18,8
1,6
0,3
0
0 5 10 15 20 25 30 35 40 45 50
specific nutrient contents
healthy
natural ingredients
no sugar added
no monosodium glutamate, preservatives etc.
reduced nutrient contents
better health
low-calorie product/light
without milk
gluten-free
womens' press industrial press

153
It is important to notice that advertisements referring to improved product content (no sugar, lower nutrient content, lower energy content) were found in Shape magazine, which is addressed to women interested in health and with potentially higher awareness about the relationship between diet and human body – c. 22% of messages. More information about artificial additives occurred in advertisements in Twój Styl – almost 17%.
In the studied industry magazines, in more than 30% of marketing messages producers stressed that no additives, such as monosodium glutamate, preservatives, artificial food dyes and aromas were present in the product. In about 25% of cases the presence of certain nutritional ingredients was advertised. As in the case of women’s magazines information about impact on health (14%) and the term “natural” was marketed (10%).
The analysis of information contained in advertisements of “health claim” nature showed that most of it does not comply with current legal regulations. The most frequent mistake made by producers is the application of messages that are not specified in the official list of claims conducted by the European Commission. For example producers advertised that the product “increases resistance”, provides “iron for brain development”, influences “healthy bones and happiness” or contains “prebiotics which supports the development of proper gut microflora”. Despite the necessity to inform consumers about the amount of ingredient which causes the positive effects mentioned in the claim, only in some of the messages this was found. Another frequent mistake was to include information on “unspecific benefits”: “improves mood”, “stimulates energy flow”, “makes you feel great”. Producers have to remember that health claims requirements apply also to advertisements and therefore many of them – after December 14th 2012 – have to be changed according to Commission Regulation (EU) No 432/2012.
A smaller number of mistakes was observed in the case of information of “nutrition claim” type. Among those, the most frequent was referring to the product as “natural”. This term should not be used in the case when no artificial ingredients were added [Regulation (EU) No 1169/2011]. Also, three times producers declared “lower fat content” without giving information about the specific amount. One time the claim “light” was used without indicating the product’s properties which made the product “light”.
Mieczkowska and Panfil-Kuncewicz [2011] observed that in many cases the application of nutrition and health claims on packages and advertisements of milk products was against the law. It therefore seems important to conduct training sessions for the food industry which would lead to the growth of knowledge on proper food product labelling.
By applying nutritional marketing tools in press advertisements producers often underline the presence of ingredients which are recommended from the nutritional point of view although the product’s overall nutritional values may be controversial. They indicatethe high levels of vitamins and minerals in food products dedicated to children, such as dairy and sweet desserts, cereals or chocolate drinks in which one portion of product contains from two to four teaspoons of sugar or in sweets which contain 80% of sugar in the form of glucose-fructose syrup. In one of these cases a product was promoted as “light” because of “lowered fat content” although it contains four teaspoons of sugar per 100 g. In another case, chocolate was called “light” although it had more fat than a standard product and the energy value of both were similar.

154
Summary
A general principle of the European food law [Regulation (EC) 178/2002)] is to provide a basis for consumers to make informed choices in relation to food they consume and to prevent any practices that may mislead the consumer. Moreover the European Authorities in the Regulations regarding the provision of food information to consumers underlined that in order to achieve a high level of health protection for consumers and to guarantee their right to information, it should be ensured that consumers are appropriately informed.
However the presented research results showed that food producers like to apply nutritional marketing arguments in press releases aimed at women readers but do not always follow the tools’ concept. A lot of information provided in the form of health claims in studied advertisements does not comply with current legal regulations. Producers should take into consideration the fact that the requirements related to using health claims concern also advertisements, therefore these should be prepared according to the rules. In the case of nutritional claims a smaller number of such cases was observed. Producers often stress the presence of ingredients which are recommended from the nutritional point of view whereas the product’s overall nutritional value is controversial. In effect, such practice may mislead consumers with low nutritional knowledge.
It is important to add that in comparison to analogical studies conducted in 2005 [Gajek 2007], the overall percentage of advertisements in women’s press did not change, however the percentage of ads with nutritional marketing messages increased. Incorrect terms such as “portion of healthy energy” or “good calorie” were commonly used.
Literature
Colby S. [2006]: Nutrition market and the worldwide obesity epidemic. Proceedings of the Allied Academies International Conference. New Orleans. 12-15.04.2006. www.ars.usda.gov. [Access: June 2012].
Gajek A. [2007]: Wykorzystanie marketingu ywieniowego w dzia aniach marketingowych firm przemys uspo ywczego. MST SGGW (typescript)
Mieczkowska M., Panfil-Kuncewicz H [2011]: O wiadczenia ywieniowe i zdrowotne na opakowaniach produktów spo ywczych. Przemys Spo ywczy. 65. 54-56.
Rejman K., Borowska A. [2009]: Wykorzystanie marketingu ywieniowego w budowaniu przewagi konkurencyjnej przedsi biorstw spo ywczych. [w:] Juchniewicz M. (red.): Czynniki i ród a przewagi konkurencyjnej. Uniwersytet Warmi sko-Mazurski. Olsztyn. 161-166.
Rejman K., Halicka E. [2008]: Wykorzystanie marketingu ywieniowego na rynku innowacyjnych produktów spo ywczych. [w:] Adamowicz M. (red.): Innowacje i innowacyjno w sektorze agrobiznesu. Tom II. Rodzaje innowacji. Wydawnictwo SGGW. Warszawa. 91-101.
Regulation (EC) No 178/2002 of the European Parliament and of the Council of 28 January2002 laying down the general principles and requirements of food law, establishing the European Food Safety Authority and laying down procedures in matters of food safety. [Access: July 2012].
Regulation (EC) No 1924/2006 of the European Parliament and of the Council of 20 December 2006 on nutrition and health claims made on foods. Internet. http://eur-lex.europa.eu. [Access: June 2012].
Regulation (EU) No 1169/2011 of the European Parliament and of the Council of 25 October 2011 on the provision of food information to consumers, amending Regulations (EC) No 1924/2006 and (EC) No 1925/2006 of the European Parliament and of the Council, and repealing Commission Directive 87/250/EEC, Council Directive 90/496/EEC, Commission Directive 1999/10/EC, Directive 2000/13/EC of the European Parliament and of the Council, Commission Directives 2002/67/EC and 2008/5/EC and Commission Regulation (EC) No 608/2004. Internet. http://eur-lex.europa.eu. [Access: June 2012].

Regulation (EU) No 432/2012 of 16 May 2012 establishing a list of permitted health claims made on foods, other than those referring to the reduction of disease risk and to children’s development and health. [Access: July 2012].
Wierzejska R. [2012]: Informacje ywieniowe na opakowaniach produktów spo ywczych – podej cie konsumenta. Przemys Spo ywczy. 66. 43-45.

156
Micha Roman1
Warsaw University of Life Sciences – SGGW Krzysztof Nuszkiewicz2
Jadwiga Dziubi ska Agricultural Education Centre Schools in Gol dkowo
Changes in agricultural production in Poland after accession to the European Union
Abstract. The first part of the paper presents the issue of the Common Agricultural Policy and next it presents the development of Polish agriculture in the structures of the European Community. The paper presents the changes in the agrarian structure in Poland after the accession to the European Union. Special attention is paid to crop and livestock production.
Key words: Polish agriculture, crop and animal production, the European Union, the Common Agricultural Policy
Introduction
Agriculture constitutes a very important sector of the Polish economy. Political and economic changes that are taking place in Poland have created new opportunities and posed challenges for agriculture and rural areas. They are connected with the necessity to restructure and modernise the Polish agricultural sector as well as the need to enhance social and economic cohesion in the country. The accession of Poland to the European Community on May 1, 2004 became a condition for those changes. The aim of the article is to show the development and changes in Polish agriculture before and after the accession to the European Union.
Material and research method
The materials used in the article come from reports published by the Institute of Agricultural and Food Economics – National Research Institute. The data of 1998 and 2009 reports are compared. The year 2004 marked a breakthrough in Poland because of the accession to the European Union. The article presents a comparison of growth dynamics and, based on that, conclusions regarding Polish agriculture are formulated.
The Common Agricultural Policy
The Common Agricultural Policy refers to all activities in the agricultural sector carried out by the European Union in order to fulfil the decisions of the Treaty of the European Union. It covers agriculture, forestry, vineyard production and gardening.
1 PhD, e-mail: [email protected] MA, e-mail: [email protected]

157
Thanks to the Common Agricultural Policy, it is possible to maintain the dominance of a family-owned farm in agriculture, the basis of the agricultural system in the European Union and the protection of the model of rural areas developed throughout history, the so-called European Agricultural Model. Its main characteristic features include [Wspólna … 2012]:
Competitive agriculture that is able to gradually increase export without excessive subsidies; Balanced development of rural areas in the European Union; Methods of agricultural production that are friendly for the environment and guarantee a supply of high quality healthy products, which meet public demand; Agriculture balanced with long traditions, not only oriented on efficiency but also paying attention to rural environment and landscape, providing the society with food and increasing employment; Simpler, understandable agricultural policy, which clearly distinguishes between the decisions made by the Community and those that should remain within the competence of member states; Agricultural policy that guarantees that the costs of its implementation are justified by the farmers’ activities expected by the society.
Developing production, the food-processing industry and connections with the global market, the European Union created an extremely complex economic and legal system of developing the market and maintaining agrarian prices, supporting farm modernization and development of rural areas and rural communities, promotion and subsidizing export. It is necessary to state that the European Union spends half of its annual budget on these tasks (over €40 billion). These include funds from countries’ domestic budgets (€15-20 billion). The support for Polish agriculture is estimated to be $0.8 billion annually. Additionally, agriculture is also extensively financed by consumers [Wspólna … 2012].
One of the tasks of the Common Agricultural Policy is to guarantee ‘satisfactory’ income from agriculture [Traktaty … 1957]. The income of people employed in Polish agriculture, as with most European Union countries, is below the national average [Floria czyk 2003].
Changes in Polish agriculture after accession to the European Union
Polish agriculture is characterized by its disintegration into a large number of small farms. The average farm size is increasing gradually and in 2010 it was close to 8.6 hectares (in 2009 it was 8.0ha). The average farm size in the European Union is about 18 hectares. In Polish agriculture there is considerable over-employment and at the same time unemployment and low level of productivity. It can also be observed that there is a big proportion of people working in agriculture, forestry and fishing industry (residents of rural areas who do not work in agriculture make up 22.2%). Almost 11.5% of farms and 9.6% of people from rural areas earn their living in agriculture. There is a high percentage of farms processing their products. This is proof that rural areas in Poland are agricultural in particular. The percentage of people working in Polish agriculture is four times higher than in other European Union countries (in Poland, 25.8%; in European Union countries, 5.5% on average) [Rolnictwo ... 2011].

158
It is necessary to point out that Polish farmers are young because about 1/3 of all farm owners of farms bigger than 15 hectares are below the age of 40. This results in their higher flexibility in adjusting to new work conditions and domestic and international markets. However, the problem of Polish rural areas is a low level of education for youths. This is connected with the high cost of education in secondary schools and at universities. Families that earn their living in agriculture cannot afford educating all their children and this results in problems with finding employment in sectors other than agriculture [Instrumenty … 2009].
In comparison with the European Union, the price of land in Poland is not high. The low price of land is a consequence of its low quality. However, some land price differences between regions can be observed. In regions where there is a high level of agricultural development, interest in land purchase is bigger. Cheap land encourages foreign investors to treat land purchase as a way to invest their capital. Polish land has maintained its unique quality in Europe because of the following characteristic features [Pi … 2009]:
the varied lie of the land (big variation in soil and climate conditions creates an opportunity to find a multiplicity of different settlement areas and natural landscapes); the type of agriculture that has been lost in other European Union countries.
After the accession of Poland to the European Union, in comparison with the pre-accession period, we can observe a clear decline in arable land in hectares, which is illustrated in Table 1.
Table 1. Land-use change in Polish agriculture (2000-2009)
Dynamics 2000 2004 2009 2009
1995 2000 2004 1995
Agricultural land 98,9 88,7 98,7 86,6
Arable land (sown land) 98,4 90,2 95,5 84,8
Permanent plantations 88,5 108,1 119,2 114,2
Permanent pastures 95,7 86,9 94,5 78,6
Other 116,4 130,6 113,9 173,2
Source: A. Judzi ska, W. opaciuk: Wp yw Wspólnej Polityki Rolnej na rolnictwo. IERiG , Warszawa 2011, p. 51.
The area of farms smaller than 1 hectare increased but their number decreased. After the accession to the European Union, the number of farms went down by 28% and their area by 3%. The development of big farms lost momentum but arable land acquisition by farms from 20 to 50 hectares continued. Purchases were from both: small farms, the number and area of which decreased and bigger ones, the number of which increased despite the decrease of their area. The suppression of the number of the biggest farms is connected with the introduction of a regulation imposing an area limit for family-owned farms and the end of lease periods in the second half of the previous decade. On the other hand, the number of farms smaller than 1 hectare decreased by 27%. The decline in the number of small (1-5 ha) and medium (5-10 ha) size farms was smaller (from 25 to 16%). But their area also went down and the change was biggest in the group of farms between 10-20 hectares. The changes show that Polish agriculture, irrespective of how big the

159
changes are, is still disbursed into a large number of small farms. Figure 1 presents a detailed characteristic.
Fig. 1. Changes in the agrarian structure in Poland after the accession to the European Union (1998-2009)
Source: A. Judzi ska, W. opaciuk: Wp yw Wspólnej Polityki Rolnej na rolnictwo. IERiG , Warszawa 2011, p. 52.
After the accession to the European Union, there were no major changes in the share of plant cultivation and livestock production. There were some changes within those individual sectors. The share of industrial plants production and gardening increased while the share of potato cultivation decreased. Figure 2 presents this data.
Fig. 2. The structure of plant cultivation in the Polish agriculture (%)
Source: A. Judzi ska, W. opaciuk: Wp yw Wspólnej Polityki Rolnej na rolnictwo. IERiG , Warszawa 2011, p. 55.
97 98 97 95 92
109
93
72 73 7583 84
101
136
60
70
80
90
100
110
120
130
140
On average < 1 1--5 5--10 10--20 20-50 > 50 (ha)
Number of farms
Area
35,3 34,4 36,6 39,2 37,9 36,8 41,1 36,3 33,342,7 40,8 35,3
11,9 10,8 10,4 9,5 10,7 10,413,5
14,0 14,312,8 12,6 16,0
13,1 12,5 12,0 12,3 10,4 9,412,4 14,6
12,111,8 10,7 12,9
14,9 15,4 15,1 14,6 16,8 16,7
15,3 15,917,3
14,9 15,3 17,910,4 14,0 9,2 11,8 11,0 15,1
8,8 10,3 11,3 7,5 12,7 8,514,3 12,8 16,7 12,6 13,2 11,5 8,9 8,8 11,7 10,2 7,9 9,4
0
10
20
30
40
50
60
70
80
90
100
1998 1999 2000 2001 2002 2003 2004 2005 2006 2007 2008 2009
Potatoes
Fruit
Vegetables
Forage
Industrial plants
Cereal

160
Poland is also known as a producer of vegetables, including cabbage, carrot and onion. Polish berry-fruit, especially strawberries and red and black currants are appreciated on the European Union markets. It is necessary to focus on Polish strawberries, which differ from those produced in other countries – they have a unique taste and flavour. The best-known Polish orchard products include apples, cherries and plums.
As Figure 3 shows, the share of maize and other grains, especially triticale and grain mixes, in the structure of grain production increased. However, the share of rye decreased.
Fig. 3. The structure of grain production in Poland (%)
Source: A. Judzi ska, W. opaciuk: Wp yw Wspólnej Polityki Rolnej na rolnictwo. IERiG , Warszawa 2011, p. 56.
Within the group of industrial plants, the share of canola increased and the share of sugar beet decreased. This resulted from the sugar market reform in the European Union. Detailed data regarding this issue are presented in Figure 4.
Fig. 4. The structure of industrial plants production in Poland (%)
Source: A. Judzi ska, W. opaciuk: Wp yw Wspólnej Polityki Rolnej na rolnictwo. IERiG , Warszawa 2011, p. 56.
44,5 43,1 43,8 40,7 40,1 36,6 37,4 36,7 36,5 34,3 36,9 38,9
17,6 16,1 14,2 14,9 12,1 11 11,9 10,6 11 10,9 11,6 10,4
13,3 13,1 13,5 12,5 12,3 12,2 13 13,6 14 14,9 14 13
15 16,3 15,1 17,5 16,8 18,5 16,9 16,9 17,4 17,2 15,8 14
7,6 8,4 9,2 9,6 11,1 12,3 12,6 14,2 14,4 15,7 15,6 17,2
2 3 4,2 4,8 7,5 9,4 8,3 8,1 6,7 7 6 6,6
0102030405060708090
100
1998 1999 2000 2001 2002 2003 2004 2005 2006 2007 2008 2009
Maize
Other
Oates
Barley
Rye
Wheat
49,8 49,8 53 50,4 57,1 55,2 56,5 5842,8
33,322,1 27,6
32,6 28 29,1 33,629,1 28,9 32 29,7
4348,3
62,1 57,8
7,7 10,1 6 4,9 4,3 3,8 2,6 3,3 32 2,8 3,8
7,4 8,7 8,1 7,1 5,3 6,7 5,1 5 5,2 7,7 7,1 6,12,6 3,5 3,7 4 4,2 5,5 3,8 3,9 5,9 8,7 5,9 4,7
0102030405060708090
100
1998 1999 2000 2001 2002 2003 2004 2005 2006 2007 2008 2009
Other
Pulses
Tobacco
Canola
Sugar beet

161
In the livestock production, the biggest changes were connected with the decrease in the share of pig production. At the same time the importance of poultry, eggs and beef production rose (Fig. 5).
Fig. 5. The structure of livestock production and production milk and eggs in Poland (%)
Source: A. Judzi ska, W. opaciuk: Wp yw Wspólnej Polityki Rolnej na rolnictwo. IERiG , Warszawa 2011, p. 57.
Based on Figure 5, it is necessary to point out that the share of milk production remains unchanged.
Conclusions
It must be pointed out that Poland is a country, where in the course of the political and economic transformation and then as a result of the accession to the European Union there were substantial changes in agriculture and that this has had an important impact on domestic economic results. However, the sector continues to be important for the country’s economy.
Literature
Instrumenty oddzia ywania pa stwa na kszta towanie struktury obszarowej gospodarstw rolnych w Polsce. Rola systemu ubezpieczenia spo ecznego rolników w kszta towaniu tej struktury. Stan obecny i rekomendacje na przysz o oraz propozycje nowych rozwi za dotycz cych tego obszaru dla systemu ubezpieczerolników.[2009] IERiG , Warszawa, p. 55.
Judzi ska A., opaciuk W. [2011]: Wp yw Wspólnej Polityki Rolnej na rolnictwo. IERiG , Warszawa, pp. 51-57. Floria czyk Z. [2003]: Charakterystyka instrumentów Wspólnej Polityki Rolnej oraz ich wp yw na dochody
rodzin rolniczych. IERiG -PIB, Warszawa, pp. 43-49. Pi lat Polski w Unii Europejskiej [2009]. Wydaw. Urz du Komitetu Integracji Europejskiej, Warszawa, p. 85. Rolnictwo i gospodarka ywno ciowa w Polsce [2011]. Wydaw. MRiRW, Warszawa, pp. 8-9. Traktaty Ustanawiaj ce Uni Europejsk , Wspólnota Europejska, 1997, former Traktaty Rzymskie, Article 39,
1957. Wspólna polityka rolna. Rolnictwo i rozwój obszarów wiejskich [2012], Luksemburg, pp. 5-8.
9 9,4 7,7 7,2 7,2 7 8,1 10,4 10,5 10,4 11,3 11,5
42,3 39 38,3 40,9 40,1 37,6 36,3 33,6 33,5 28 26,9 28,5
11,6 11,8 11,3 12,6 13,2 13,1 14,1 14,7 13,616,5 16,8 18,4
28,2 31 33,7 30,7 30,3 31,2 31,6 32,4 32,5 33,8 34,7 29,6
7,4 7,4 7,9 7,5 8,3 9,3 8,4 7,6 8,6 8 9,4 11,11,5 1,4 1,1 1,1 0,9 1,8 1,5 1,3 1,3 3,3 0,9 0,9
0
10
20
30
40
50
60
70
80
90
100
1998 1999 2000 2001 2002 2003 2004 2005 2006 2007 2008 2009
Other
Eggs
Milk
Poultry
Pigs
Cattle

162
Ludwig Theuvsen Department of Agricultural Economics and Rural Development Georg August University of Goettingen, Germany
Risks and Risk Management in Agriculture
Abstract. Agriculture has always been exposed to a wide spectrum of risks. But it is largely undisputed that farmers have faced growing risks in recent years. More volatile agricultural and input prices, climate change, ongoing discussions about the future of the Common Agricultural Policy, increasing difficulty in finding qualified farm workers, and growing criticism of modern intensive agriculture from the wider public and the mass media are just a few of the risks farmers have to cope with. Therefore, risk management has become highly relevant in agriculture. In this paper, we highlight the need for systematic risk management and outline a systematic agricultural risk management approach. Empirical results illustrate farmers’ risk perceptions and their preferred risk management strategies.
Key words: agriculture, risks, risk management
RISKS IN AGRICULTURE
Farming has always been a risky business due to the handling of living organisms and its exposure to weather conditions and other natural phenomena (such as pathogens, animal diseases etc.). Other risks originate in the political and social environment of farms, for instance uncertainty about future agricultural and environmental policies, a growing lack of societal acceptance of intensive agriculture, and reluctance of qualified personnel to work in agriculture. Figure 1 enumerates some of the most important risks in agriculture.
It is a widely shared assumption that several of the risks mentioned in Figure 1 have become more relevant for farms and farmers in recent years (Frentrup, Heyder and Theuvsen 2010):
The Common Agricultural Policy of the European Union has undergone an incremental process of liberalization with the result that EU farmers are currently more exposed to world agricultural markets and world market prices than ever. As a consequence, EU farmers today face increasing price volatility. Furthermore, the future of the Common Agricultural Policy (for instance, the need for decoupled payments to European farmers) and other relevant policies (for instance, environmental and animal welfare policies) is becoming increasingly controversial. Climate change will result in changing weather conditions, including higher temperatures, changing quantities and seasonal distribution of rainfall, and more extreme weather phenomena, such as droughts, heavy rains, storms and extreme high or low temperatures. In many regions, agriculture has turned out to be less attractive for younger people, and it has become more difficult to find adequately trained and motivated farm workers and young farmers willing to continue family farming businesses.

163
In many European countries, agriculture is subject to lively societal discussion and media debate concerning its environmental effects, prevalent animal welfare standards, use of genetically modified organisms etc.
More examples of growing risks in agriculture could be added. Against this background, it is a widely shared assumption that agricultural risk management has become more relevant than ever before, especially for modern farms, which can no longer rely mainly on family labour, their own land and equity capital. Instead, modern farms are often characterized by growth strategies that involve hiring paid farm workers, leasing major shares of their land and growing debt to equity ratios (Schaper, Deimel and Theuvsen 2011). Therefore, these farms face substantial fixed payments and the risk of insolvency should unforeseen major risks, such as longer periods of (very) low prices or the outbreak of an animal disease, occur. Therefore, it is the objective of this paper to outline the core elements of a systematic risk management process in agriculture, introduce important determinants of agricultural risk management strategies and present empirical results that shed some light on farmers’ risks perceptions and preferences concerning risk management instruments.
Figure 1. Risks in agriculture
Source: Based on Näther and Theuvsen 2012; Lehrner 2002

164
THE RISK MANAGEMENT PROCESS
Risk management comprises all measures that help to identify and manage risks that put a farm or a firm at risk (Wolke 2007). Its major goal is to identify, quantify, manage and control potential sources of losses. This contributes to the ongoing existence and success of a farm or firm. The literature distinguishes between general and special risk management (Mikus 2001). General risk management addresses all types of risks, whereas special risk management focuses only on risks that can be insured by an insurance company, for instance fire or hail risks.
The risk management process comprises four main steps (Figure 2): Risk identification: Which risks are relevant for a specific farm? Livestock farmers, for instance, face different risks than arable farms, producers of wheat different risks than producers of sugar beets and conventional farms different risks than organic farms. Risk assessment: How much attention do the risks identified in the first step deserve? Two assessment criteria are relevant from the point of view of risk management: (a) Incident rate: What is the probability that a specific risk will occur? In some cases information is available that makes it possible to quantify the incident rates of risks; this is true, for instance, in the case of weather risks, for which longer-term records exist. In other cases, farmers need to develop subjective assessments of incident rates, taking into account, for instance, prior experiences with occurrence of these risks. (b) Potential loss: What will be the financial loss if a risk, such as an animal disease or a hail storm, occurs? Risk management: After relevant risks have been identified and assessed, farmers have to decide how to cope with these risks. In general, farmers have four options for managing a risk: (a) Risk avoidance, for instance, if a risk can have catastrophic consequences. Horse farms, for example, often quit the risky breeding business and focus on more projectable horse boarding activities (Näther and Theuvsen 2012); (b) transfer of risks to third parties, such as insurance companies or financial investors in futures markets; (c) risk reduction through such means as concluding longer-term contracts or diversifying farm activities; and (d) risk acceptance, a strategy used mainly where incident rates and loss potentials are low. Risk control includes internal design of the risk management process (responsibilities, deadlines etc.); regularly supplying decision-makers with relevant information about topics such as new risks or changing incident rates and loss potentials; and critical control of the effectiveness of the risk management strategy applied, i.e. its potential to reduce risks to an acceptable level. If any need for a critical review of a farm’s risk management strategy occurs, the whole risk management process has to be re-run.

165
Source: Based on Wolke 2007
Incident rates and loss potentials are often displayed in a risk matrix that makes it possible to distinguish between more relevant risks, characterized by high incident rates and/or high, in some cases even catastrophic, loss potentials, and those less relevant risks that are extremely unlikely to occur and/or will have limited financial consequences. Figure 3 provides a simplified overview of the risks facing a dairy farmer.

166
Figure 3. A dairy farmer’s risk matrix
Source: Goeser 2010
In agriculture there is a wide spectrum of traditional and, in some cases, new risk management strategies that allow farmers to transfer or reduce risks (Figure 4).
Figure 4. Agricultural risk management strategies
Source: Based on Hirschauer and Musshoff 2012

167
DETERMINANTS OF AGRICULTURAL RISK MANAGEMENT
According to contingency theory, there is no “one best way” of management; instead, it is a widely shared belief that situational determinants strongly influence the efficient design of management practices and that the fit between the situation and the design of management procedures determines the performance of a farm or firm (Perrow 1967; Lawrence and Lorsch 1967). With regard to agricultural risk management, two important situational factors can be identified: farmers’ risk attitudes and a farm’s risk-bearing potential.
The factor ‘farmers’ risk attitudes’ denotes their willingness (or reluctance) to accept risks. People’s attitudes towards risks are very diverse, including risk-averse, risk-neutral and risk-seeking behaviour (Hillson and Murray-Webster 2007). Similar results have also been obtained with regard to farmers’ risk attitudes (Schaper, Spiller und Theuvsen 2010). Figure 5 exemplifies farmers’ risk attitudes by referring to an empirical study in which 546 Eastern German farmers were asked to assess their own willingness to accept risks (from 0% = extremely risk averse to 100% = extremely risk seeking).
Figure 5. Farmer’s willingness to accept risks
Source: Schaper, Bronsema and Theuvsen 2012
From a risk management perspective, a farmer’s risk attitudes are highly relevant since they will strongly influence his or her decision to implement risk management strategies. If a farmer is highly risk-averse, he or she will be reluctant to accept many risks but will try to reduce, transfer or even completely avoid as many risks as possible. But if a farmer is highly risk-seeking, he or she will deliberately accept major shares of the risks facing the farm and will largely refrain from actively implementing strategies aimed at reducing, avoiding or transferring risks. Therefore, the exposure of farms to risks can be very diverse,

168
depending on farmers’ risk attitudes (Schaper, Bronsema und Theuvsen 2012; Faff, Mailino and Chai 2008; Lucius 2009).
A second important determinant of agricultural risk management is the farm’s risk-bearing capacity. This is an objective measure of how much financial loss a farm can bear without going bankrupt (Lucius 2009; Zeilbeck 2007). Thus, it is a measure that assesses a farm’s robustness against negative financial outcomes resulting from the occurrence of risks, for instance, longer periods of lower prices, increasing costs of leasing land, higher prices of other input factors, or reduced productivity due to the spread of pathogens or the outbreak of animal diseases (Theuvsen 2012). Due to structural changes in European agriculture, fixed payments related to the increasing employment of non-family labour, growing shares of lease land and higher debt to equity ratios have become more relevant and threaten farms during times of crises. Similar to farmers’ risk attitudes, farms’ risk-bearing capacities also influence their assessment of risks and the choice of risk management strategies. The lower the risk-bearing capacity, the more risks have to be characterized as a potential threat to the ongoing existence of a farm – and vice versa. As a consequence, a farm with a low risk-bearing capacity has to undertake more efforts to reduce, avoid or transfer risks and, thus, needs a more systematic application of effective risk management strategies.
A farm’s risk-bearing capacity is mainly determined by its ongoing cash flows (surplus of incoming payments over outpayments; investments and disinvestments; changes in debt and equity capital) and its realizable liquid assets (Lucius 2009). Realizable liquid assets are those assets for which an external market exists and which can be sold without considerably jeopardizing the future prospects of a farm. If a farm is run as a family business, non-farm income, debts and assets (real estate, securities etc.) also have to be taken into account since these payments and liquid assets can stabilize, but also destabilize a farm during crisis situations.
It is important to note that a farm’s risk-bearing capacity has to be distinguished from its competitiveness. Competitive farms are able to produce at low, marginal or full cost, whereas a farm with a high risk-bearing capacity can successfully resist financial losses after the occurrence of a risk. Often a farm’s competitiveness and its risk-bearing capacity are very dissimilar. Competitiveness is often the result of pronounced growth strategies that allow farms to realize economies of scale. But this advantage often comes at the price of a lower risk-bearing capacity since growing farms often face increasing debt to equity ratios, wage payments to hired farm workers and other fixed expenses. Fixed payments increase a farm’s risk of bankruptcy. On the other hand, small family farms, which often produce at high cost, turn out to be very stable during crisis situations since these farms do not have to pay hired workers, rents for lease land or interest on debt capital. Therefore, small family farms often require only a few risk management strategies, whereas large farms have to effectively provide for potential risks.
SOME EMPIRICAL RESULTS
During autumn 2011, 546 farms in Eastern Germany (Saxony, Saxony-Anhalt, Thuringia, Mecklenburg-West Pomerania) were surveyed regarding their risk perceptions and risk assessment, their risk attitude and experience, and their preferred risk management strategies. A written questionnaire was sent to full-time farmers and management boards of

169
large agricultural enterprises. Table 1 shows some sample characteristics. The comparison with the average numbers of farms in the area under investigation shows that mainly larger farms were surveyed. We surveyed 126 arable farms and 420 livestock farms.
Table 1. Sample characteristics
Sample average Average Eastern Germany
Arable land 810.04 ha 232.5 ha
Grassland 174.83 ha 55.35 ha
Total acreage 1,015.24 ha 233.23 ha
Family workers 2.4 1.3
Hired farm workers 19.4 2.6
Total number of workers 21.8 3.9 Source: Schaper, Bronsema and Theuvsen 2012
Farmers and management board members were asked to assess the incident rates and loss potentials of various risks their farms face. In both cases, Likert scales (from 1=very low to 5=very high) were used. In order to get a ranking of risks, average assessments of incident rates and loss potentials were multiplied. Table 2 shows the top six risks as perceived by the respondents. It becomes obvious that farmers rank external risks they hardly can control – mainly price developments and political decisions – highest. On the other hand, risks, such as animal diseases, which have not occurred for several years are ranked very low (in this case, rank 21), even if they can have disastrous consequences. Additional analyses showed that the ranking of risks according to their severity is very robust; alternative operationalizations of severity only very slightly changed the ranking of risks.

170
Table 2. Top six risks in Eastern German agriculture
Rank Incident rate Loss potential Total risk
Mean values (std. dev.)
Mean values (std. dev.)
1 Increasing leasing and purchasing prices for farm land
4.43 (0.794)
3.80 (0.902)
16.83
2 Decreasing decoupled EU payments
4.54 (0.786)
3.65 (1.003)
16.57
3 Increasing volatility of agricultural prices
4.21 (0.870)
3.32 (0.872)
13.97
4 Increasing volatility of input prices
4.22 (0.856)
3.28 (0.830)
13.84
5 Tightened cross-compliance regulations
4.15 (0.921)
3.14 (0.994)
13.03
6 Reduced availability of farm land
3.73 (1.150)
3.40 (1.072)
12.68
Source: Based on Schaper, Bronsema and Theuvsen 2012
With regard to the development status of agricultural risk management, it turned out that all in all 92.4% of the farmers surveyed assess the risks their farms face. Risk assessments are performed when considered necessary (59.7% of respondents), once a year (11.5%) or more frequently (21.2%). Regular risk assessments have become highly relevant for farms since most farms in our survey have already faced the occurrence of risks. In a considerable number of cases, the occurrence of these risks resulted in existence-threatening situations for the farms affected (Table 3).

171
Table 3. Risk experience of Eastern German farms
Risk N Already affected
Not affected
Threat to existence
No threat to existence
Animal diseases 220 27.3 % 72.7 % 23.3 % 76.6 %
Crop failure 437 89.7 % 10.3 % 23.7 % 76.3 %
Unexpected changes in input prices
470 92.5 % 7.5 % 16.3 % 83.7 %
Unexpected changes in output prices
448 89.9 % 10.1 % 24.6 % 75.4 %
Bankruptcy of customers
283 42.0 % 58.0 % 15.2 % 84.8 %
Non-compliance with quality requirements
279 38.0 % 62.0 % 12.3 % 87.7 %
Uninsured damage to buildings and production facilities
247 25.5 % 74.5 % 14.3 % 85.7 %
Lawsuits 328 66.2 % 33.8 % 16.6 % 83.4 %
Loss of lease land 422 85.0 % 15.0 % 15.9 % 84.1 %
Deficient availability of farm workers
291 44.3 % 55.7 % 9.3 % 90.7 %
Source: Schaper, Bronsema and Theuvsen 2012
In order to manage the risks they face, farms apply a multitude of risk management strategies (Table 4). Respondents were asked to assess various risk management strategies on 5-point Likert scales (1=very low relevance to 5=very high relevance). It is striking that there is a strong focus on management instruments to mitigate farm risks, while classical agricultural risk management strategies, such as irrigation, plant protection, choice of more robust varieties or purchase of agricultural insurance, rank in the middle of the range. Furthermore, complex risk management instruments, such as the use of commodity futures exchanges, rank very low. In the case of price risks, farmers clearly prefer pre-contracts and expect that their marketing partners, for instance, processors or traders, use commodity futures exchanges to manage price risks.

172
Table 4. Preferred risk management strategies of Eastern German farms
Risk management strategy Mean values (std. dev.)
Low or very low relevance
High or very high relevance
Long-term safeguarding of farm land
4.77 (0.643)
2.2% 96.1 %
Liquidity reserves 4.30 (0.824)
3.0 % 85.5 %
Diversification 3.79 (1.115)
14.1 % 63.5 %
Using management consulting services
3.65 (0.996)
10.9 % 57.9 %
Training of employees 3.59 1.178)
16.5 % 61.3 %
Source: Schaper, Bronsema and Theuvsen 2012
It is interesting to see that farmers’ risk attitudes influence their choice of risk management strategies. Respondents were asked, for instance, which share of their mineral fertilizers they contracted in advance through pre-contracts. The use of pre-contracts is very dissimilar. 15.3% of the respondents pre-contract up to 20% of the quantities needed, 8.1% 21–40%, 22% 41–6 %, 28.2 % 61–80 % and 19.1% more than 80%. Similar results were obtained with regard to farmers’ preferences for pre-contracting feeding stuff. In both cases, actual behavior in general very much parallels farmers’ willingness to take (or to avoid) risks. Nonetheless, additional cross-tabulations taking into account farmers’ risk attitudes and their contract choices revealed that the actual risk behavior of farmers is diverse and that quite a number of outliers confound the initial findings on the influence of risk attitudes on the choice of risk management strategies.
Liquidity management has become an integral part of agricultural risk management. Of the respondents, 83.5% use their farm’s balance sheet when managing liquidity, 63.6% make liquidity forecasts, 43.8 % build up liquidity reserves, and 35.7% negotiate extended credit limits with their banks. With regard to liquidity management, banks are farmers’ preferred partners: 28% of the respondents talk about their farm’s current situation with their bank if this is considered necessary, 53.1% inform their bank of current developments once, twice or three times each year, and 18.9% of the farmers surveyed talk to their bank more than three times per year.

173
CONCLUSIONS
Risk management has gained relevance in agriculture due to growing risks (for instance, agricultural and input price volatility, climate change), the limited and often decreasing risk-bearing capacity of farms and the intention of the majority of farmers to limit their farms’ exposure to risks. Therefore, a systematic risk management process should be implemented and regularly performed on future-oriented farms. The importance of systematic risk management grows the more non-family workers are hired, the higher the debt to equity ratio, and the higher the share of lease land.
Empirical results show that farmers rank external market and political risks highest. They react to these risks by applying various risk management strategies. The latter often comprise a mix of management (such as diversification, liquidity management) and agronomic instruments (for instance, choice of robust varieties, irrigation).
These findings have interesting implications for farmers, public administrations and political decision makers. Farmers should critically control the development status of their risk management. This is most important where the farm’s risk-bearing capacity has decreased due to pronounced growth strategies or where cooperations with other farmers or other incidents have sharply changed a farm’s risk situation. Public administrations should check how they can support the implementation of effective risk management strategies in agriculture. Training activities might be necessary to sensitize farmers to the need for a more systematic risk management. Finally, politicians should be aware that political decisions are perceived as one of the most important risks in agriculture. This should motivate them to provide more reliable and more predictable agricultural (and other) policies. Furthermore, farmers rank price risks very high. This could influence the design of the safety net that the European Union plans to implement in the next phase of the Common Agricultural Policy to reduce the incidence of bankruptcies in European agriculture.
The results of the empirical study very much parallel earlier findings that have already highlighted the risk-conscious behavior of many farmers (Schaper, Lassen and Theuvsen 2010). Since the study only focused on large agricultural enterprises in Eastern Germany, future research should also include smaller farms, other farm types (for instance, organic farming) and farms in other European countries. This would make it possible to control for size and other factors and to determine whether agricultural risk management exhibits regional differences.
REFERENCES
Faff, R., Mailino, D. and Chai, D. [2008]. On the Linkage between Financial Risk Tolerance and Risk Aversion, in: Journal of Financial Research, 31 (1): 1-23.
Frentrup, M., Heyder, M. and Theuvsen, L. [2010]. Risikomanagement in der Landwirtschaft. Frankfurt a. Main, Landwirtschaftliche Rentenbank.
Goeser, T. [2010]. Risikomanagement in Milchviehbetrieben und Konzeption eines Beratungsansatzes für die landwirtschaftliche Praxis. Master�s Thesis, University of Goettingen.
Hillson, D. and Murray-Webster, R. [2007]. Understanding and Managing Risk Attitude. 2nd ed., Aldershot, Gower Publishing.
Hirschauer, N. and Musshoff, O. [2012]. Risikomanagement in der Landwirtschaft. Clenze, Agrimedia. Lawrence, P. and Lorsch, J. [1967] Differentiation and Integration in Complex Organizations, in: Administrative
Science Quarterly, 12 (1): 1-30.

Lehrner, J. [2002]. Notwendigkeit, Nutzen und Realisierbarkeit eines Risiko-Managements in landwirtschaftlichen Betrieben. Ph.D. Thesis, University of Vienna.
Lucius, O. [2009]. Erfassung der Risikobereitschaft von Kunden – helfen regulatorische Vorgaben? In: Everling, O. and Müller, M. (eds.). Risikoprofiling von Anlegern, Kundenprofile treffend analysieren und in der Beratung nutzen. Bank-Verlag, Cologne: 29-42.
Mikus, B. [2001]. Risken und Risikomanagement – ein Überblick, in: Götze, U., Henselmann, K. and Mikus, B. (eds.). Risikomanagement, Heidelberg, Physica: 3-28.
Näther, M. and Theuvsen, L. [2012]. Risikomanagement im Pferdebetrieb. Cuvillier, Goettingen. Perrow, C. [1967]. A Framework for the Comparative Analysis of Organizations, in: American Sociological
Review, 32 (2): 194-208. Schaper, C., Bronsema, H. and Theuvsen, L. [2012]. Betriebliches Risikomanagement in der Landwirtschaft – eine
empirische Analyse in Sachsen, Sachsen-Anhalt, Thüringen und Mecklenburg-Vorpommern. Landesamt fuer Umwelt, Landwirtschaft und Geologie, Dresden.
Schaper, C., Deimel, M. and Theuvsen, L. [2011]. Determinanten der Wettbewerbsfähigkeit erweiterter Familienbetriebe – Ergebnisse einer Betriebsleiterbefragung, in: German Journal of Agricultural Economics, 60 (1): 36-51.
Schaper, C., Lassen, B. and Theuvsen, L. [2010]. Risk Management in Milk Production: A Study in Five European Countries, in: Food Economics – Acta Agriculturae Scandinavica, 7 (2), Section C: 56-68.
Schaper, C., Spiller, A. and Theuvsen, L. [2010]. Risikoneigung und Risikoverhalten von Milcherzeugern: Eine Typologisierung, in: Yearbook of Socioeconomics in Agriculture, 3: 157-193.
Theuvsen, L. [2012]. Risikomanagement in der Landwirtschaft: Risikobewertung und Risikotragfähigkeit im Fokus, in: Doluschitz, R. (ed.), Hohenheimer Genossenschaftsforschung, Vol. 21, University of Hohenheim, Stuttgart: 23-31.
Wolke, T. [2007]. Risikomanagement. Oldenbourg, Munich and Vienna. Zeilbeck, M. [2007]. Das Risikotragfähigkeitskonzept – Grenzen des Risikos, in: geldprofi, 6/2007: 40-42.

175
Ewa Wasilewska1
Department of Economics of Agriculture and International Economic Relations Warsaw University of Life Sciences – SGGW
Economic activity of older people in selected EU countries
Abstract. The paper presents an analysis of changes in activity of the population in older age people (50-64 years) in selected EU countries: Finland, Germany, the Netherlands and Estonia in the context of demographic aging. The study period covered the years 2000 to 2012. It was low participation of people aged 50+ in most European countries and the EU average. At the same time there was an increase in the labor market involvement of people in this age group in recent years. Also presented are examples of good practices used in those countries that have successfully improved the situation on the labor market, leading to an increase in employment of people around the age of retirement.
Key words: economic activity, the age of retirement, the employment rate
Introduction
For decades, developed countries, including the countries of the European Union, have been trying to manage the problem of demographic aging. The decline in fertility, together with increasing age inevitably lead to an ever-increasing proportion of older people in the population. Economic growth, improved health conditions, advances in medicine and medical technology in the last 50 years have increased the average life expectancy by 20 years. On the other hand, the fertility rate dropped drastically, to the extent that none of the current EU Member States currently reach the level of simple replacement of generations, which is attributable to 2.1 children per woman of childbearing age [Michalska 2012]. Demographic projections indicate that by 2030 the number of people of working age in the EU will fall by almost 21 million, while the share of the elderly and the oldest in the entire population of the Union and individual member states will continue to grow. It is expected that in 2030 every third person in the European countries will be aged over 60 years, and every tenth citizen of the European Union reaches the age of 80 years and more [Schimanek 2013]. According to the forecast by Eurostat, as a result of the processes of aging in EU countries, the proportion of people of retirement age will increase from 17.4% in 2010 to 29.5% in 2060. In Poland, the number of people over age 65 in the same period will increase from 13.5% to 34.5 %. So drastic demographic changes must cause huge tension in both the health care system, as well as the pension system. An aging population causes a rise in health care costs, and the cost of the payment of pension benefits, while fewer people of working age will have to ensure the financing of these benefits [Pelc 2011].
The process of aging is applied to the high level of deactivation of people aged about retirement. In almost all European countries, the actual age of cessation of labor is lower than the statutory retirement age. The average European withdraws from the labor market at the age of about 60 years, i.e. several years before the right to receive a full pension. In Poland, the average age of labor market exit is among the lowest in Europe.
1 PhD, e-mail: [email protected]

176
The scale of the problems resulting from low economic activity of older people is the reason that the European Council in 2000, under the Lisbon Strategy, adopted as one of the priority objectives, an increase in the level of employment in the Member States up to 70% in 2010, including growth of the employment rate of people aged 55-64 years to a level not lower than 50% in 2010. It should be emphasized that the majority of EU countries did not achieve this goal, and the gap in relation to the target value was the average for the countries of the 3.7 pp In June 2010 the European Council adopted the strategy "Europe 2020", under which five major objectives were agreed. The first is to raise the employment rate of 2020 people aged 20-64 to at least 75%, among other things, by increasing the number of older people in the workplace.
The low level of activity of mature and older people has major implications, not only economic but also social. Not working causes social marginalization and leads to exclusion of persons 50+, because low economic activity also generates low social activity. The consequences of social exclusion of persons 50+ affect the whole society, which is not able to use the capacity, knowledge and experience of these people, as well as financing social benefits enjoyed by persons 50+ [Schimanek 2013]. In terms of macroeconomics, earlier deactivation of people calls on the one hand the effects of reduced tax revenues and revenues from contributions. On the other hand, it contributes to the increase in the cost of benefits for those burdening the state budget. According to many experts, an opportunity the aging population not to have to resign from the current level of life is to increase their economic activity by, among others, extending the period of activity [Woli ska 2011]. Therefore, the issues of activation in older working age are now a necessity and should be one of the most important elements of socio-economic policies of all countries of the European Union.
Purpose and method of research, the source of empirical data
For many years, European countries have taken measures to activate and increase the employment of people over fifty years of age, who have not yet reached retirement age. A good example includes Finland, Germany, the Netherlands and Estonia, where effective government programs have contributed to spectacular changes in this regard. The aim of the study is to determine the changes in activity of the older population in these countries. The study brought closer to the practices of these countries leading to activation of the elderly. Directly analyzed population is the group of older population of working age, i.e. people aged 50 to 64 years. This age group is referred to as "Generation 50+". Due to the age of these people they can be active on the labor market. The study period covers the years 2000 to 2012.
To measure the degree of involvement of the population in the labor market, the employment rate was used, indicating how many people out of 100 in the age group are working. This indicator is particularly relevant to the assessment of activity of people over 50 years of age, because in the case of absence of work they often decide to withdraw from other activities. [Ch o -Domi czak 2013] .
The study used data published by the statistical office of the European Union (Eurostat). The main source of data is carried out in the EU Labour Force Survey (EU LFS). According to the methodology of LFS, which is based on standards of the International Labour Organisation, all persons aged 15 and over are classified as

177
economically active or inactive. Economically active population (labor force) comprises employed and unemployed persons. The unemployed are persons who are not working but actively looking for work. Population passive professionals are people who are not classified as employed or unemployed. With a uniform methodology used by Eurostat, obtained statistics on the labor market in all EU countries are comparable. It is worth noting that in studies of economic activity a different methodology is applied by CSO (Poland). Another is e.g. the definition of an unemployed person. According to Eurostat, the unemployed is a person without employment (aged 15 to 74 years old), who is able to work within two weeks, and who has actively sought work for at least four weeks. The methodology of the CSO (Poland) is based on the number of persons registered in labor offices, without checking whether the registered unemployed person is interested in finding a job.
Results of research
Eurostat population projections indicate that the population in the 27 countries of the European Union in 2060 will amount to about 517 million people, while in 2010 it was slightly over 501 million. In the period 2010-2050, the population is expected to increase among others, in Finland (7.3%), Sweden (23.45%), the UK ( 27.3%), while in Estonia, Germany and Poland population is expected to drop by 12.0%, 18.8 % and 14.3 % respectively. Despite the upward trend in the number of population, in the EU will be observed progressive aging of the population. In all EU countries will significantly increase the proportion of people of retirement age. The share of people aged 65+ in the total population in each country is illustrated in Figure 1. While in 2010 the share of people aged 65+ ranged from 11.3 % in Ireland to 20.6 % in Germany and was for all EU countries 17.4 %, in fifty years this percentage will increase significantly. In 2060 the share of people aged 65+ in the EU will be 29.5%, and will vary in the range of 22.0% (in Ireland) to 35.7 % in Latvia. This means that a very large increase in age dependency in the retirement age will occur (Fig. 2). The most dramatic situation is expected in Latvia, where on 100 working people will fall 68 elderly people aged 65+. Old age dependency ratio above 50% will reach most of the countries of the Union, while the level of 60% - outside Latvia, will be exceeded in Bulgaria, Poland, Romania and Slovakia. This unfavorable situation, without the introduction of appropriate reforms, could lead in less than 50 years to disastrous economic and social consequences.
In the European Union in 2000 there were 66.6% employed persons aged 20-64 years, while in 2012 there were 68.5% employed (Fig. 3). This means an increase in the employment rate over the past 13 years, only about 1.9 pp and failure to meet the Lisbon Strategy target level of the index (it was to be 70 % in 2010). The highest employment rate in 2012 was recorded in Sweden (79.4%), the Netherlands (77.2%) and Germany (76.7%). At the same time, Germany is a country where there was the greatest increase of involvement in the labor market over the past 13 years, where the share of employed increased by 7.9 pp The lowest employment rate in 2012 occurred in Greece (55.3%), Spain (59.3%) and Italy (62.0%). In most countries in the period from 2010 to 2012, occurred the upward trend of the employment rate, which is largely a result of the economic policy of the Union in the field of vocational activation, particularly in relation to older people.

178
0
5
10
15
20
25
30
35
40EU
27
Aust
ria
Belg
ium
Bulg
aria
Cypr
us
Czec
h Re
publ
ic
Den
mar
k
Esto
nia
Finl
and
Fran
ce
Ger
man
y
Gre
ece
Hun
gary
Irel
and
Italy
Latv
ia
Lith
uani
a
Luxe
mbo
urg
Mal
ta
Net
herl
ands
Pola
nd
Port
ugal
Rom
ania
Slov
akia
Slov
enia
Spai
n
Swed
en
Uni
ted …
%2010 2060
Fig. 1. The share of people aged 65+ in the population aged 15 and more in 2010 and forecast for 2060.
Source: own elaboration based on Eurostat.
0
10
20
30
40
50
60
70
80
EU 2
7
Aust
ria
Belg
ium
Bulg
aria
Cypr
us
Czec
h Re
publ
ic
Den
mar
k
Esto
nia
Finl
and
Fran
ce
Ger
man
y
Gre
ece
Hun
gary
Irel
and
Ital
y
Latv
ia
Lith
uani
a
Luxe
mbo
urg
Mal
ta
Net
herl
ands
Pola
nd
Port
ugal
Rom
ania
Slov
akia
Slov
enia
Spai
n
Swed
en
Uni
ted …
%2010 2060
Fig. 2. Old age dependency ratio (the population aged 65 year and older divided by the population aged 15 to 64) and forecast for 2060
Source: own elaboration based on Eurostat.
Despite favorable changes in the occupational activation observed in most EU countries, in some of them there was a relatively large decline in the employment rate in the period 2000-2012. The largest decrease in this ratio occurred in Portugal (-7.0 pp), Ireland (-6.7 pp) and Greece (-6.6 pp).

179
0
10
20
30
40
50
60
70
80
90EU
27
Aust
ria
Belg
ium
Bulg
aria
Cypr
us
Czec
h Re
publ
ic
Den
mar
k
Esto
nia
Finl
and
Fran
ce
Ger
man
y
Gre
ece
Hun
gary
Irel
and
Italy
Latv
ia
Lith
uani
a
Luxe
mbo
urg
Mal
ta
Net
herl
ands
Pola
nd
Port
ugal
Rom
ania
Slov
akia
Slov
enia
Spai
n
Swed
en
Uni
ted …
%2000 2012
Fig. 3. The employment rate of people aged 20-64 years in 2000 and 2012 Source: own elaboration based on Eurostat.
Examples of countries that have had the greatest success in the field of occupational activation of people aged 50+ in the last 13 years are Germany, the Netherlands, Estonia and Finland (Fig. 4, 5, 6). While in 2000 in Germany, the Netherlands and Estonia employment rate in this age group was similar to the EU average, in 2012, it was significantly higher than the EU average. In 2012, the employment rate of people aged 50-64 years in Germany, the Netherlands, Estonia and Finland ranged from 58.2% to 61.5%, while the average for the EU was 48.9%. Particular attention should be paid to Germany and the Netherlands, which saw the largest increase in the employment rate - in the case of Germany by 23.9 percentage points, and the Netherlands - by 20.4 pp However, in case of Estonia and Finland interesting is a particularly high employment rate of women aged 50+. In Estonia it was in 2012, 61.2%, Finland 59.7%. At the same time the largest increase in employment of older women was observed in Germany: from 29.0% (in 2000) to 54.8 % (in 2013).
The reason for such spectacular changes in these countries is effective government policies and actions taken in this regard by the employers themselves. More and more companies are starting to use age management policy. Age management is geared to maintain in employment persons who have crossed 50 years of life while maintaining the work efficiency of these people. Its essence is the maximum consideration of the benefits of employing workers of all ages, including those over 50. As a result, the employer provides a mutual exchange of knowledge and experience between the different generations of workers [Schimanek 2013]. The implementation of government programs to promote employment of older workers in Germany, Finland, Estonia and the Netherlands, to promote the activity of workers in the age of retirement, as well as reducing the possibility of early retirement has allowed these countries to achieve the goal to increase the employment of persons in excess of 50 years of age.

180
2025303540455055606570
2000
2001
2002
2003
2004
2005
2006
2007
2008
2009
2010
2011
2012
%
EU 27 Finland Netherlands Estonia Germany
Fig. 4. The employment rate of people aged 50-64 years during 2000-2012
Source: own elaboration based on Eurostat.
2025303540455055606570
2000
2001
2002
2003
2004
2005
2006
2007
2008
2009
2010
2011
2012
%
EU 27 Finland Netherlands Estonia Germany
Fig. 5. The employment rate of men aged 50-64 years during 2000-2012
Source: own elaboration based on Eurostat.
In Finland, the activation measures concerning aging workers started in the early 90s, during the economic downturn, one of the consequences of which was the sharp rise in unemployment. They launched pension reforms whose main objective was to raise the retirement age and to limit the possibility of early retirement. One of the next steps of the reform was the introduction of so-called flexible retirement age of 63-68 years. The solution lies in the fact that each year worked over age 63 causes a significant increase in the amount of future pensions. Such a system promotes long activity and encourages remaining in the labor market. At the same time the minimum age for giving the opportunity for early retirement is set at 62 years. Access to benefits that were the cause of professional deactivation, was systematically restricted. Also the ability of retirement for unemployed people approaching retirement age was restricted, the minimum age for the use

181
of pension in respect of incapacity for work was raised and the minimum age for receiving unemployment benefits in the retirement age.
20
25
30
35
40
45
50
55
60
65
7020
00
2001
2002
2003
2004
2005
2006
2007
2008
2009
2010
2011
2012
%
EU 27 Finland Netherlands Estonia Germany
Fig. 6. The employment rate of women aged 50-64 years during 2000-2012
Source: own elaboration based on Eurostat.
In the Netherlands, in the early 90s, the criteria for granting disability benefits were tightened, including medical criteria entitling receipt of disability benefits. There were introduced special grants for employers who hire retirees returning to work, thus encouraging increased employment of people with health problems. Social security contributions for companies that employed such persons were reduced. For high growth in employment of people of the 50+ group in recent years has also contributed the elimination of favorable tax arrangements for people leaving the labor market below the statutory retirement age. There were completely eliminated all systems enabling the transition to early retirement [Milewska-Marzy ska 2013].
In Germany, the labor market has been revolutionized by so-called Hartz reforms implemented by the German government in 2003-2005 to reduce the results of high unemployment and stagnating employment rate. Reform effort has been focused on increasing labor market flexibility. New, more effective methods of activation of the unemployed were introduced. For example, they can apply to private employment agencies, for which the state paid. Employers were encouraged in hiring for a specified period of older workers. The state also introduced (temporarily) addition to the remuneration of older people and a discount rate of contribution to unemployment insurance. The social benefits system was reconstructed to hamper long-term exposure to unemployment. Significantly reduced were benefits paid to unemployed remaining unemployed for a long time. It should be noted that the Hartz reforms, including the introduction of more flexible forms of employment, have brought great success - the unemployment rate has fallen significantly. These reforms, however, enjoyed scarce popularity among the public and still arouse much controversy.
Estonia belongs to a small group of former Eastern Bloc countries (along with Latvia and Lithuania), where there has been one of the highest activity of persons aged 50-64 years. The reform of the social security system, started in the 90s in Estonia, to a great extent contributed to maintain the activity of the population at the age of retirement. There

182
are new rules for the granting of pensions and benefits. Early retirement can be obtained not earlier than three years before the statutory retirement age provided they have a minimum of 15 years of service. Retirement benefits for a pre-retirement pension are less than adequate. If you continue working beyond retirement age the pension amount increases depending on the number of additional months worked. In this way, the actions taken in Estonia gave the people of retirement age new opportunities to increase income. In addition, actions are taken to support the employers of people with lower qualifications, including those unemployed who lack five years to reach retirement age. In the longer term the system provides to equalize retirement ages for men and women [Belczyk 2008].
Summary
In the context of demographic aging and the related aging of human resources in the labor market across Europe, the professional activity of society is one of the priorities of the European Union. Particular importance is given to support the activity of people in their 50+ years, who have not yet reached retirement age. In most European countries participation in professional activity among people aged 50-64 is low. In 2000, the employment rate in this age group averaged 36.9% in the EU. With activation measures taken by many countries, the employment rate in the period 2000-2012 increased to 48.9 %. It should be noted that in 2010 this indicator reached the average level of 46.3%, which means that the gap in relation to the target values assumed in the Lisbon Strategy was 3.7 pp.
Germany, the Netherlands, Finland, Estonia belong to the group of countries that have been most successful in terms of activation of people around the age of retirement. Effective government policies and actions by employers have led to a significant increase in the involvement in the labor market of people aged 50-64 years. During the twelve years the employment rate in this age group has increased in these countries by an average of 18.8 pp, while the level of the EU average increased by 12.0 pp.
Actions taken in these countries in order to prevent unfavorable developments in the labor market are an example of good practice in Europe. The basic tools to increase the employment rate of people aged 50+ was to raise the retirement age and reduce the possibility of early retirement .
References
Belczyk K. [2008]: 50+: Przyk ady dobrych praktyk w Europie. [Available at:] http://www.rynekpracy.pl/ artykul.php/wpis.77. [October 2013].
B dowski P. [2013]: Aktywno zawodowa osób w starszym wieku. [W:] Rynek pracy wobec zmian demograficznych. Zeszyty demograficzne.Warszawa.
Ch o -Domi czak A. [2010]: Ekonomiczne skutki i uwarunkowania niskiej aktywno ci zawodowej osób 50+ w Polsce. [W:] Aktywizacja zawodowa osób 50+ i zarz dzanie wiekiem. Warszawa.
Eurostat [2013]: http://epp.eurostat.ec.europa.eu/portal/page/portal/employment_unemployment_lfs/data/main_ tables. [October 2013].
Jodkowska L. [2010]: Reformy systemu zasi ków a wzrost nierówno ci w Niemczech. [W:] Nierówno ci spo eczne a wzrost gospodarczy. Uniwersytet Rzeszowski, zeszyt nr 17. Rzeszów.
Michalska K. [2012]: Jak zwi kszy aktywno zawodow osób w wieku przedemerytalnym? Przyk ad Finlandii. Analiza FOR nr 16. Warszawa.

Milewska-Marzy ska U. [2013]: Aktywno zawodowa osób z grupy 50 plus. Biuletyn Obserwatorium Regionalnych Rynków pracy nr 17. [Available at:] http://www.obserwatorium.pracodawcyrp.pl/images/ BIULETYN_ ORRP_NR_17.pdf. [October 2013].
Pelc P.: [2011]: Eurostat opublikowa prognozy demograficzne do 2060 roku. Tak wygl da katastrofa demograficzna. [Available at:] http://3obieg.pl. [October 2013].
Schimanek T. [2010]: Spo eczne uwarunkowania i konsekwencje niskiej aktywno ci zawodowej osób 50+ oraz rozwi zania s u ce jej zwi kszeniu. [W:] Aktywizacja zawodowa osób 50+ i zarz dzanie wiekiem. Warszawa.
Woli ska I. [2011]: Ekspertyza tematów projektów innowacyjnych. [Available at:] http://pokl.wup.torun.pl/pokl/ images/stories/projekty_innowacyjne/ekspertyza_tematow_pr_innowacyjne.pdf. [October 2013].

Information for Authors of papers published in Scientific Journal Warsaw University of Life Science – SGGW
Problems of World Agriculture
1. The Scientific Journal of Warsaw University of Life Science – SGGW Problems of World Agriculture, publishes scientific papers based on original research, compliant with the profile of the journal, in Polish and English.
2. The manuscripts submitted, accepted by the Editor, will be subject to the double-blind peer review. If the manuscript is written in English at least one of the reviewers is affiliated with a foreign institution. The list of reviewers is published in the journal.
3. The written review contains a clear reviewer's finding for the conditions of a scientific manuscript to be published or rejected it (the review form can be found on the website of the journal).
4. In order to prevent the "ghostwriting" and "guest authorship" the authors are requested to fill out and sign an Author's Ethical Declarations (the declaration form can be found on the website of the journal).
5. Authors have to send to the Editor text of the paper prepared according to the editorial requirements (editorial requirements can be found on the website of the journal). Author is responsible for the contents presented in the paper.
6. The original version of the scientific journal issued is a print version. An electronic version is posted on line on the journal's website.
7. The authors of the papers contribute to the costs of printing (issuing). 8. The journal is published quarterly. Each paper published in the Scientific Journal of
Warsaw University of Life Science – SGGW Problems of World Agriculture receives 8 points (Decision from the Minister of Science and Higher Education on the list of scientific journals dated. Dec. 17, 2013).
Editorial Office: Zeszyty Naukowe Szko y G ównej Gospodarstwa Wiejskiego w Warszawie Problemy Rolnictwa wiatowego / Scientific Journal Warsaw University of Life Science: Problems of World Agriculture Faculty of Economic Sciences WULS-SGGW Department of Agricultural Economics and International Economic Relations 166 Nowoursynowska St. 02-787 Warsaw, Poland Phone: +48 22 5934103, +48 22 5934102, fax.: +48 22 5934101 e-mail: [email protected]
Web page: http://www.wne.sggw.pl/czasopisma/problemy-rolnictwa-swiatowego/