probable cost of ownership for enterprise data warehouse ... · data warehouse, ncr teradata data...
TRANSCRIPT
Copyright 2004 by Market Magic Ltd. All rights reserved.
MARKET MAGIC RESEARCH
Probable Cost of Ownership for Enterprise Data Warehouse Software
Providing a financial basis for choosing a software supplier to power your next Data Warehouse project
Abstract In this study we provide a comparative Probable Cost of Ownership™ (PCO™) analysis of the three major software packages that are being used to build enterprise level data warehouses today. We evaluate the data warehouse offerings from the three industry's premiere vendors as measured by market share determined in the survey we conducted; IBM DB2, NCR Teradata, and Oracle. We provide a basis for making a purchasing decision, based on the price of software license and support alone. We have found that there is a great difference in licensing and pricing models which result in a significantly higher overall price in a relatively short period of time. Using our data warehouse software costing tool, it is possible to compare the direct costs associated with the purchase of data warehouse software and support while cutting through the fog of the different pricing and licensing schemes offered by each of the vendors.
September 2004
Price US$250.00
2
Probable Cost of Ownership for Enterprise Data Warehouse Software Providing a financial basis for choosing the right software to power your next Data Warehouse project
Executive Summary The purchase of software licenses and support can be a daunting and confusing experience due to the complexity of licensing and support terms and conditions stipulated by different software vendors. To aid our clients in cutting through the fog of software licensing and support; we, Market Magic Research (MMR), have developed a new methodology called Probable Cost of Ownership (PCO) which allows potential customers to compare the costs of the three top three Enterprise Data Warehouse software vendors; IBM DB2, NCR Teradata and Oracle.
Our PCO methodology started with an MMR survey of members of the U.S. Fortune 1000 group of companies. We asked them about their experiences in the implementation of data warehouses; we determined how enterprises build data warehouses focusing on what types of commercial-off-the-shelf (COTS) software do they purchase to make their data warehouses perform. Because of this survey we know which data warehouse software features and functions are actually being used in practice. The survey also told us which brand of database software is being used as the core to the data warehouse; based upon that question, we found that IBM DB2, NCR Teradata and Oracle cover 85% of the market for data warehouses.
We then scanned the Internet looking for the data warehouse software options from the three dominant data warehouse database vendors. We determined the licensing, support, and pricing models used by each of our top three vendors for each of the data warehouse options such that we could compare them from a cost perspective. It was from this public data1 that we built a model that calculates and compares the cost of the software. Our pricing model allows us to compare the overall cost of license and support for each of the three vendors for a specific set of data warehouse requirements. The model is intelligent enough to calculate the optimal licensing configuration for each of the three vendors such that we can compare the best list price cost of software license and support for up to a five year period.
1 All pricing data was extracted from Internet web sites on the 4th of June 2004.
3
To enable us to input the real world data warehouse requirements into cost comparison model in a way that would not favor any single vendor, we needed to describe the features and functions required by real customers at a very high level. From these generic high level requirements we are able to determine what vendor-specific options must be purchased to support the generic needs. We defined the generic, high-level requirements as follows:
• Database – relational database software used to store the raw data that makes up the data warehouse
• Clustering – software feature used with the Database to create larger data warehouse by splitting the data between multiple instances of the database.
• Partitioning – software feature that allows the data from a single table to be split into chunks within the data warehouse such that it is easier to manage and to use (required for scaling of data)
• ETL – Extract, Transformation, and Load software used to extract data from operational (e.g., OLTP) and other source systems. The software also needs to be able to transform the data into a suitable format and encoding and then load it into the data warehouse.
• Query Manager – software used to monitor the performance of the queries and to control what queries can run and when. This option is needed to keep one user from using all of the resources of the data warehouse.
• OLAP – On-Line Analytical Processing, software used to create a multi-dimensional view of the data for quick and efficient access to aggregated or summary data.
• Data Mining – software used to find patterns and aberrations in the data that might lead to useful business insight.
• Data Visualization – software used to display patterns and aberrations in the data using visual display such human analyst can discover additional business insight.
But our software cost comparison model has limitations, it is only able to compare the prices for a single, specific set of requirements at any one time and although this is useful for a specific set of needs it does not allow us to make any general observations about overall licensing and pricing policies of the three different vendors. To overcome this limitation, we combined the survey results with advanced Monte Carlo simulation techniques to generate what we call Probable Cost of Ownership (PCO). The data resulting from the Monte Carlo simulation allows us to see the frequency distributions of the costs over the entire range of real-world, data warehouse scenarios as driven from the data
4
from our study. From the frequency distribution we are able to derive statistics, which we have named Probable Cost of Ownership (PCO), we can see not only the mean PCO but also how PCO will vary over a wide range of configurations. We are able to see which vendor most often offers the best value and which vendor most often offers the worst value.
Through our PCO analysis, we discovered that all three vendors had strengths and weaknesses and some consistent trends emerged. IBM, with their DB2 Data Warehouse offering, offers the best overall Probable Cost of Ownership (PCO). NCR, with their Teradata Data Warehouse offering, most often offered the worst PCO. Finally, Oracle with their complex licensing was more expensive than IBM 87% of time and 96% of the time less expensive than Teradata. Specifically, the five-year PCO for IBM DB2 is on average 61% less than Teradata and the five-year PCO for IBM DB2 is on average 22% less than Oracle. IBM DB2 offers this tremendous cost advantage due to the availability of the deeply discounted DB2 Data Warehouse Edition bundles.
Copyright 2004 by Market Magic Ltd. All rights reserved.
Market Magic, Market Magic Research, the Market Magic logo, Probable Cost of Ownership, and PCO are
trademarks of Market Magic Ltd.
Additional copies of this white-paper can be purchased by contacting Market Magic Ltd below.
Market Magic Ltd. Hassets • Stockton Avenue
Fleet • Hampshire GU51 4NP • England
www.marketmagic.co.uk Phone +44 1252 676377 • Fax +44 1252 629666
IBM, with their DB2 Data Warehouse offering, offers the best overall Probable Cost of Ownership (PCO).
5
Introduction All three software vendors claim to offer the best product, fastest database, the best value in licensing packages, most responsive user support options, and the highest productivity available for the money spent. The most confusing aspect of these claims is that each company can find data to support their claims, so reading the literature, or checking a website, will provide lots of information and very little in the way of discriminatory data.
In the world of sales, this sort of ‘attribute stacking’ is to be expected, and buyers would be surprised to find that a database vendor was not putting their best foot forward. But such selling does not benefit either the buyer or seller beyond a certain point of the selling process.
With large amounts of money at risk, which has even bigger implications for the small to medium sized businesses, facts, not opinions, become critical to the decision making process, and where facts are not available, the decision process breaks down. It is imperative that a prospective buyer of a data warehouse implementation get facts and data that can be analyzed and parsed based on the buyer’s needs, and not have that information selected and presented by the seller. Third party analysis is always a useful tool for the discriminating buyer. If done properly, an objective third party can take disparate application data points and compare them in a standard fashion.
In order to fairly and objectively compare the attributes of software licensing and support, Market Magic Research (MMR) compared and analyzed the three core data warehouse software vendors discovered during our market survey; IBM, NCR Teradata and Oracle2. Specifically, the analysis compared IBM’s DB2 Universal Database (UDB) software for data warehouse, NCR Teradata Data Warehouse, and Oracle’s 10g software for data warehouse.
The goal of this study was to determine a Probable Cost of Ownership (PCO) which is a statistical variant of Comparative Cost of Ownership (CCO) between the top three data warehouse vendors on the market. The CCO metric, as opposed to a Total Cost of Ownership (TCO) metric, was used because analysis of CCO focuses on limited, quantifiable data points, i.e., price of a license, characteristics of licenses, limitations of licenses, number of users, etc. A TCO analysis, by comparison, has a much broader, less quantifiable focus, which is to say a TCO analysis includes data that may have more of a subjective, rather than objective, basis. For example, all software vendors make claims on productivity and hardware efficiency that are used to show their software in a better light. Vendors often argue that, while their software license is more expensive initially, it will be cheaper in the long run since less staff will be needed, less expensive hardware can be used, or even that less hardware will be needed to successfully run the application. While these claims may be valid in some instances, it is difficult to quantify them in a fashion
2 Throughout this whitepaper we will list all three database vendors in alphabetical order. This order is completely arbitrary.
6
that can help customers make a buying decision. Database software is becoming less differentiated over time, and though vendors are regularly adding new features particularly for specialized purposes such as data warehousing, most applications that require a database are not highly distinguishable from each other. In fact, the greatest areas of quantifiable difference for assessing the best database for an application might just be the price of the software licenses and support services. Without factoring elements such as staffing and hardware costs, this analysis cannot accurately be deemed a TCO study. However, by excluding the more subjective elements of a TCO study, a stronger CCO picture emerges. To provide the best Comparative Cost of Ownership (CCO) of these database packages, the data used for this study was culled from publicly available data on each application package, their licensing and support pricing, and any additional information that might add value and clarity in determining the best CCO.
But our CCO model is only able to compare the prices for the input of a single, specific set of requirements and although useful for specific customer needs this would not allow us to make any general observations about overall licensing and pricing policies of the three different vendors. To overcome this limitation, we used the results from the survey combined with Monte Carlo simulation to generate what we call Probable Cost of Ownership (PCO). Monte Carlo simulation allows us to input a large number of real world configurations into the CCO model. As we input the large number of real world configurations, we collect statistics about the resulting CCO parameters. The data resulting from the Monte Carlo simulation gives us a very good idea of the probability distribution for the cost for each of the different software vendors. From this data we can not only see the mean CCO (which we call PCO) but how the CCO will vary over a wide range of configurations. We are able to see which vendor most often offers the best value and which vendor most often offers the worst value.
For the purposes of this study, IBM, NCR Teradata, and Oracle were the only vendors examined. This decision was based on the fact that these three vendors hold the lion’s share of the database market. There are other data warehouse software providers, but they either specialize in one aspect of data warehousing or their market share is negligible by comparison, and their inclusion in this study would provide little additional value.
We anticipate that many people will ask us why we have not included Microsoft in this survey. The answer is simple; we simply did not have enough data points on configurations which included Microsoft SQL Server to give us confidence in the results. In other words, we simply did not observe them as a player in today’s data warehouse marketplace.
For the purposes of this study, IBM, NCR Teradata, and Oracle were the only vendors examined. This decision was based on the fact that these three vendors hold the lion’s share of the database market.
7
METHODOLOGY The key to this, or any, comparative analysis is to ensure that like elements of the data warehouse implementation are compared. To ensure that fair and accurate comparisons were made, a model was developed and expressed as a spreadsheet tool for this study3.
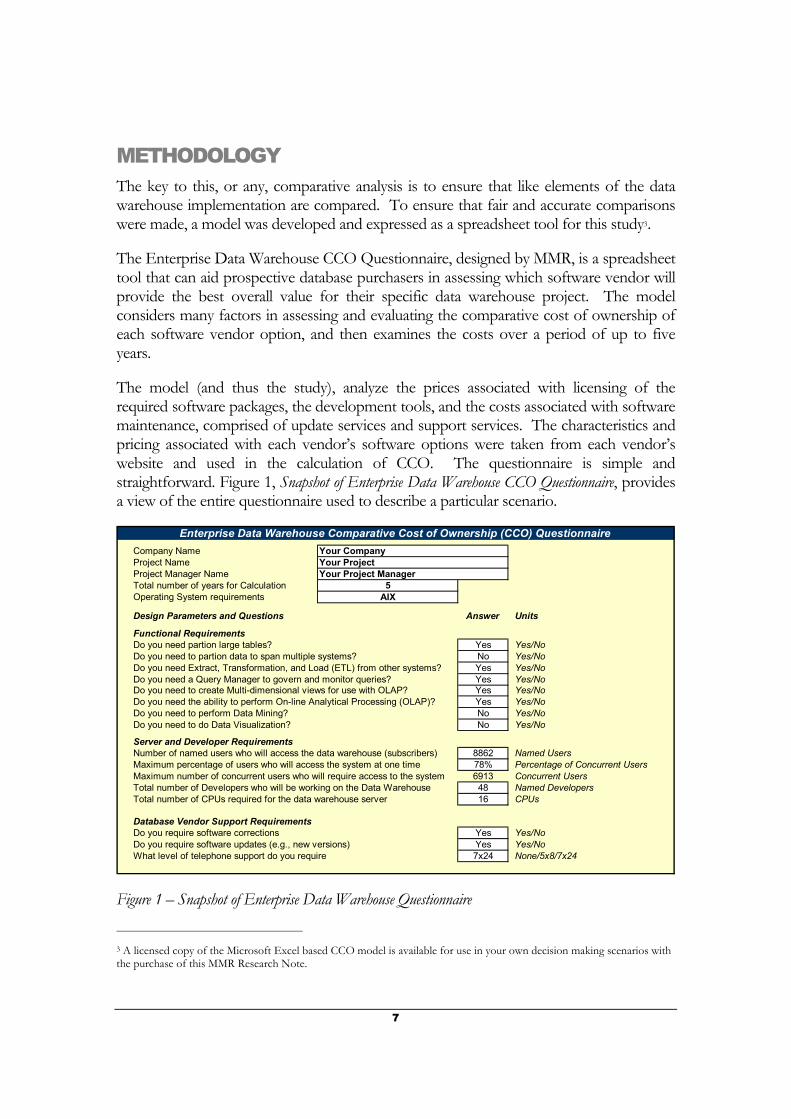
The Enterprise Data Warehouse CCO Questionnaire, designed by MMR, is a spreadsheet tool that can aid prospective database purchasers in assessing which software vendor will provide the best overall value for their specific data warehouse project. The model considers many factors in assessing and evaluating the comparative cost of ownership of each software vendor option, and then examines the costs over a period of up to five years.
The model (and thus the study), analyze the prices associated with licensing of the required software packages, the development tools, and the costs associated with software maintenance, comprised of update services and support services. The characteristics and pricing associated with each vendor’s software options were taken from each vendor’s website and used in the calculation of CCO. The questionnaire is simple and straightforward. Figure 1, Snapshot of Enterprise Data Warehouse CCO Questionnaire, provides a view of the entire questionnaire used to describe a particular scenario.
Company NameProject NameProject Manager NameTotal number of years for Calculation 5Operating System requirements AIX
Design Parameters and Questions Answer Units
Functional RequirementsDo you need partion large tables? Yes Yes/NoDo you need to partion data to span multiple systems? No Yes/NoDo you need Extract, Transformation, and Load (ETL) from other systems? Yes Yes/NoDo you need a Query Manager to govern and monitor queries? Yes Yes/NoDo you need to create Multi-dimensional views for use with OLAP? Yes Yes/NoDo you need the ability to perform On-line Analytical Processing (OLAP)? Yes Yes/NoDo you need to perform Data Mining? No Yes/NoDo you need to do Data Visualization? No Yes/No
Server and Developer RequirementsNumber of named users who will access the data warehouse (subscribers) 8862 Named UsersMaximum percentage of users who will access the system at one time 78% Percentage of Concurrent UsersMaximum number of concurrent users who will require access to the system 6913 Concurrent UsersTotal number of Developers who will be working on the Data Warehouse 48 Named DevelopersTotal number of CPUs required for the data warehouse server 16 CPUs
Database Vendor Support RequirementsDo you require software corrections Yes Yes/NoDo you require software updates (e.g., new versions) Yes Yes/NoWhat level of telephone support do you require 7x24 None/5x8/7x24
Enterprise Data Warehouse Comparative Cost of Ownership (CCO) QuestionnaireYour CompanyYour ProjectYour Project Manager
Figure 1 – Snapshot of Enterprise Data Warehouse Questionnaire
3 A licensed copy of the Microsoft Excel based CCO model is available for use in your own decision making scenarios with the purchase of this MMR Research Note.
8
Results of the questionnaire are presented to the user in a clear, easy-to-understand format that succinctly shows a one to five year CCO of the three vendor options, and how each target vendor performed in the user-driven model. Although this study focused only on a five year CCO, the tool allows the user to specify the lifetime of the project, from one year to five years.
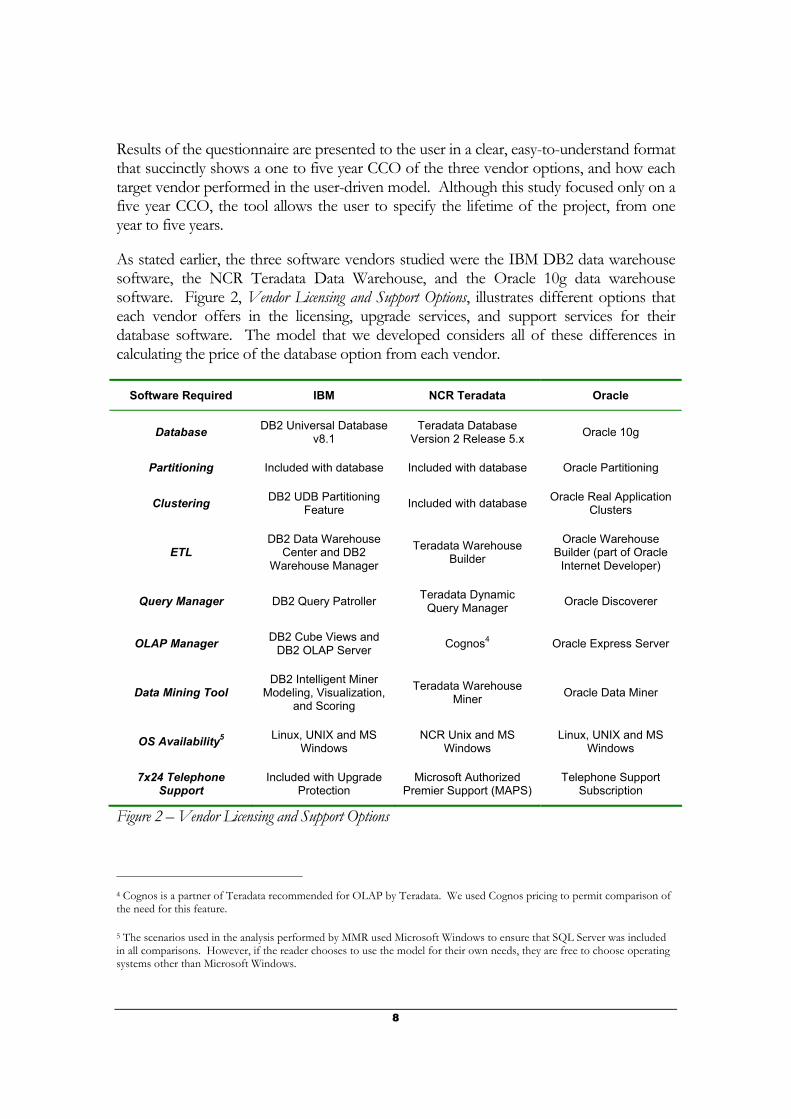
As stated earlier, the three software vendors studied were the IBM DB2 data warehouse software, the NCR Teradata Data Warehouse, and the Oracle 10g data warehouse software. Figure 2, Vendor Licensing and Support Options, illustrates different options that each vendor offers in the licensing, upgrade services, and support services for their database software. The model that we developed considers all of these differences in calculating the price of the database option from each vendor.
Figure 2 – Vendor Licensing and Support Options
4 Cognos is a partner of Teradata recommended for OLAP by Teradata. We used Cognos pricing to permit comparison of the need for this feature.
5 The scenarios used in the analysis performed by MMR used Microsoft Windows to ensure that SQL Server was included in all comparisons. However, if the reader chooses to use the model for their own needs, they are free to choose operating systems other than Microsoft Windows.
Software Required IBM NCR Teradata Oracle
Database DB2 Universal Database v8.1
Teradata Database Version 2 Release 5.x Oracle 10g
Partitioning Included with database Included with database Oracle Partitioning
Clustering DB2 UDB Partitioning Feature Included with database Oracle Real Application
Clusters
ETL DB2 Data Warehouse
Center and DB2 Warehouse Manager
Teradata Warehouse Builder
Oracle Warehouse Builder (part of Oracle
Internet Developer)
Query Manager DB2 Query Patroller Teradata Dynamic Query Manager Oracle Discoverer
OLAP Manager DB2 Cube Views and DB2 OLAP Server Cognos4 Oracle Express Server
Data Mining Tool DB2 Intelligent Miner
Modeling, Visualization, and Scoring
Teradata Warehouse Miner Oracle Data Miner
OS Availability5 Linux, UNIX and MS Windows
NCR Unix and MS Windows
Linux, UNIX and MS Windows
7x24 Telephone Support
Included with Upgrade Protection
Microsoft Authorized Premier Support (MAPS)
Telephone Support Subscription
9
The analysis performed in this study focused on the best price available from each vendor within a particular scenario. For example, each vendor offers an entry-level package that provides a lower cost for data warehouses that require less than a few CPUs. In these instances, the model calculates and uses the entry-level edition if it provides a cost advantage to the customer. Also, Oracle offers user based licensing that can offer advantageous pricing in some scenarios which have low user counts; again, for this study, whichever licensing model provided the best overall price to the customer from each vendor was used.
By using the CCO model it was possible to calculate and assess the software CCO for all three vendors, IBM, NCR Teradata, and Oracle; but only for a single set of specific requirements. This is a useful tool for pricing out a single option but it is not meaningful when trying to make generalizations about the licensing and pricing model of each vendor. We needed to come up with an approach that would allow us to compare a broad range of configurations.
To enable us to compare a broad range of customer requirements while still allowing us to make generalization, we decided to take a probabilistic approach; hence the term Probable Cost of Ownership. To do this we used an advanced simulation technique called Monte Carlo simulation6.
Monte Carlo simulation is named after the famous casino in Europe. The technique has been used for many years and is a powerful tool that is particularly well suited for use within spreadsheet models. Monte Carlo simulation effectively deals with the misconceptions and error that many spreadsheet users suffer from. Often a spreadsheet model will use a series of “average” values as input parameters. These “average” parameters are then run through a complex model to come up with an “average” output result. Unfortunately, there is a flaw in this approach. Even a very simple spreadsheet model is non-linear one and it is not valid to simply run “averages” through non-linear models and expect an accurate result. Further, only through understanding the probability distribution of the output results can understand the whole picture. As an illustration, consider the drunk who walks down the center line of the road. The road’s center line is the average position of the drunk, but through the course of collecting this average position, the drunk could be very well off the center line and thus his average state of the drunk is very dead.
Monte Carlos simulation allows us to treat each of the inputs to the CCO questionnaire as a random variable. We then ran the model a hundred thousand times and for each run
6 We used a commercial Monte Carlo simulation and analysis software which plugs into Microsoft Excel. The software used was XLSim, Commercial Electronic Edition, Version 2.01, Copyright 2000-2003, AnalyCorp Inc.
To enable us to compare a broad range of customer requirements while still allowing us to make generalization, we decided to take a probabilistic approach; hence the term Probable Cost of Ownership (PCO).
10
we randomly selected different input variables to the questionnaire based upon the real world values which we derived from our study. The result is not a single set of CCO numbers but rather a set of estimated probability distributions for each of the CCO values. Each estimated probability distribution has a set of statistics which are used to describe the distribution. It is because of this technique that we have used the term Probable Cost of Ownership (PCO).
As mentioned earlier, to ensure that an equitable analysis could be performed, and that the results could be quantified in a meaningful fashion, vendor claims of ‘increased productivity’ and ‘reduced staffing costs’ were deemed equal in all cases. In fact, there is little quantifiable evidence to support one vendor’s claim over another in these areas.
One area of potential difference between vendors is in the area of discounts. It is often possible for a customer to negotiate special discounted prices with vendors. Because discounts are generally fashioned on a ‘per customer’ basis, it was impossible for this type of discount to be factored into this analysis. Our focused is on list prices; however, we did consider and apply discounts for both NCR Teradata and Oracle. NCR Teradata does not publish a price list nor do they publish a lot of details about their licensing; however, they do sell to the US Government and as such they publish a GSA price list which by law is the lowest set of prices on offer. We have considered the NCR Teradata GSA price list as a form of discount. On the other hand, Oracle offers standard volume discounting to all customers as part of their published price list; as such, we have included the standard Oracle volume discount into our tool this since it can be argued that this standard volume discount is part of the published price list.
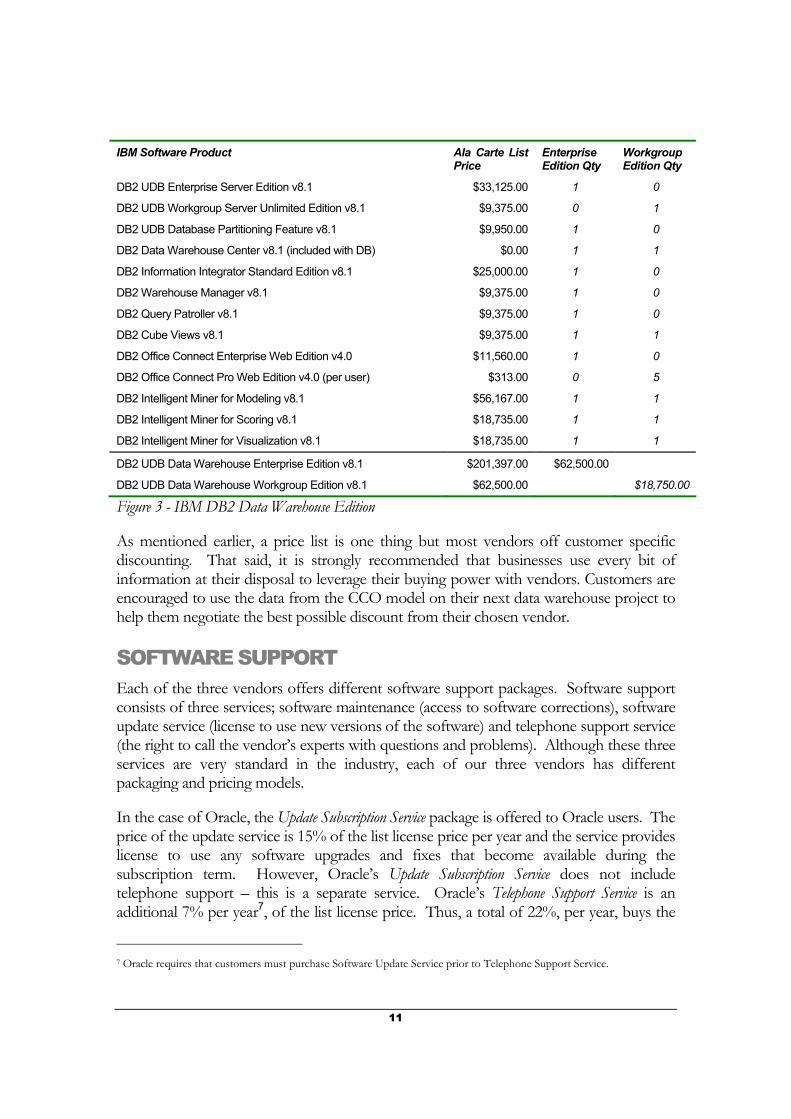
We also looked for special value-based packaging offered by all three vendors; however, we only found such an offer from IBM. IBM has created a packaging of DB2 software specifically targeted at the enterprise that is building a data warehouse. This package offers tremendous value over the list price of the individual components. Figure 3, IBM DB2 Data Warehouse Edition, illustrates the components that make up the two special bundles; the IBM DB2 Data Warehouse Workgroup Edition and the IBM DB2 Data Warehouse Enterprise Edition. As we can see, the IBM DB2 Data Warehouse Workgroup Edition bundle offers an 84% discount over the ala carte pricing whereas the IBM DB2 Data Warehouse Enterprise Edition bundle offers a 65% discount over the ala carte pricing. For the purpose of the CCO tool, the tool calculates the price both using the bundles and with using the ala carte pricing; the tool then uses the lowest of the two prices.
…the IBM DB2 Data Warehouse Workgroup Edition bundle offers an 84% discount over the ala carte pricing whereas the IBM DB2 Data Warehouse Enterprise Edition bundle offers a 65% discount over the ala carte pricing.
11
IBM Software Product Ala Carte List Price
Enterprise Edition Qty
Workgroup Edition Qty
DB2 UDB Enterprise Server Edition v8.1 $33,125.00 1 0
DB2 UDB Workgroup Server Unlimited Edition v8.1 $9,375.00 0 1
DB2 UDB Database Partitioning Feature v8.1 $9,950.00 1 0
DB2 Data Warehouse Center v8.1 (included with DB) $0.00 1 1
DB2 Information Integrator Standard Edition v8.1 $25,000.00 1 0
DB2 Warehouse Manager v8.1 $9,375.00 1 0
DB2 Query Patroller v8.1 $9,375.00 1 0
DB2 Cube Views v8.1 $9,375.00 1 1
DB2 Office Connect Enterprise Web Edition v4.0 $11,560.00 1 0
DB2 Office Connect Pro Web Edition v4.0 (per user) $313.00 0 5
DB2 Intelligent Miner for Modeling v8.1 $56,167.00 1 1
DB2 Intelligent Miner for Scoring v8.1 $18,735.00 1 1
DB2 Intelligent Miner for Visualization v8.1 $18,735.00 1 1
DB2 UDB Data Warehouse Enterprise Edition v8.1 $201,397.00 $62,500.00
DB2 UDB Data Warehouse Workgroup Edition v8.1 $62,500.00 $18,750.00
Figure 3 - IBM DB2 Data Warehouse Edition
As mentioned earlier, a price list is one thing but most vendors off customer specific discounting. That said, it is strongly recommended that businesses use every bit of information at their disposal to leverage their buying power with vendors. Customers are encouraged to use the data from the CCO model on their next data warehouse project to help them negotiate the best possible discount from their chosen vendor.
SOFTWARE SUPPORT Each of the three vendors offers different software support packages. Software support consists of three services; software maintenance (access to software corrections), software update service (license to use new versions of the software) and telephone support service (the right to call the vendor’s experts with questions and problems). Although these three services are very standard in the industry, each of our three vendors has different packaging and pricing models.
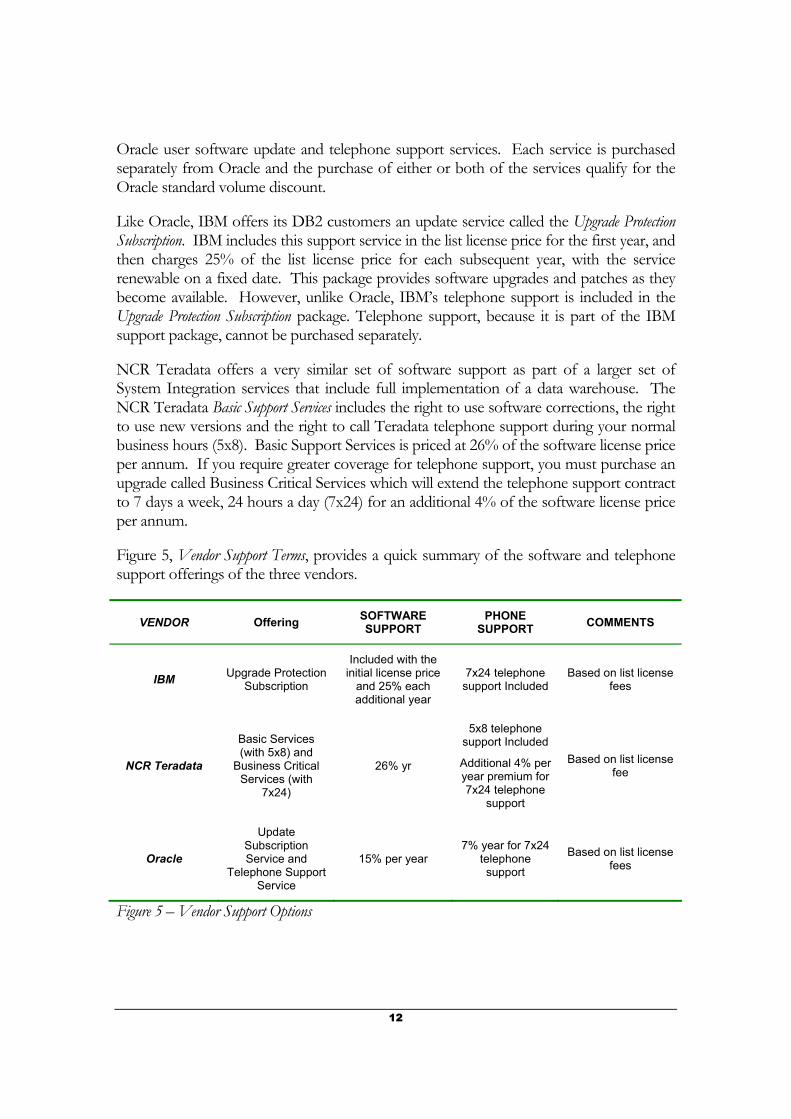
In the case of Oracle, the Update Subscription Service package is offered to Oracle users. The price of the update service is 15% of the list license price per year and the service provides license to use any software upgrades and fixes that become available during the subscription term. However, Oracle’s Update Subscription Service does not include telephone support – this is a separate service. Oracle’s Telephone Support Service is an additional 7% per year7, of the list license price. Thus, a total of 22%, per year, buys the
7 Oracle requires that customers must purchase Software Update Service prior to Telephone Support Service.
12
Oracle user software update and telephone support services. Each service is purchased separately from Oracle and the purchase of either or both of the services qualify for the Oracle standard volume discount.
Like Oracle, IBM offers its DB2 customers an update service called the Upgrade Protection Subscription. IBM includes this support service in the list license price for the first year, and then charges 25% of the list license price for each subsequent year, with the service renewable on a fixed date. This package provides software upgrades and patches as they become available. However, unlike Oracle, IBM’s telephone support is included in the Upgrade Protection Subscription package. Telephone support, because it is part of the IBM support package, cannot be purchased separately.
NCR Teradata offers a very similar set of software support as part of a larger set of System Integration services that include full implementation of a data warehouse. The NCR Teradata Basic Support Services includes the right to use software corrections, the right to use new versions and the right to call Teradata telephone support during your normal business hours (5x8). Basic Support Services is priced at 26% of the software license price per annum. If you require greater coverage for telephone support, you must purchase an upgrade called Business Critical Services which will extend the telephone support contract to 7 days a week, 24 hours a day (7x24) for an additional 4% of the software license price per annum.
Figure 5, Vendor Support Terms, provides a quick summary of the software and telephone support offerings of the three vendors.
Figure 5 – Vendor Support Options
VENDOR Offering SOFTWARE SUPPORT
PHONE SUPPORT COMMENTS
IBM Upgrade Protection Subscription
Included with the initial license price
and 25% each additional year
7x24 telephone support Included
Based on list license fees
NCR Teradata
Basic Services (with 5x8) and
Business Critical Services (with
7x24)
26% yr
5x8 telephone support Included
Additional 4% per year premium for 7x24 telephone
support
Based on list license fee
Oracle
Update Subscription Service and
Telephone Support Service
15% per year 7% year for 7x24
telephone support
Based on list license fees
13
SURVEY RESULTS To provide the most realistic view of data warehouse implementations for our Monte Carlo simulation, we needed to have actual data warehouse configurations that we could use to drive the simulation. To collect real world configurations, we conducted a survey of randomly selected IT managers from the Fortune 1000 list of companies in the United States. We talked with 50 different IT managers about their experience in implementing data warehouses. Everyone who responded to the survey had implemented at least one data warehouse and most had implemented several.
We asked each IT manager surveyed the same questions that are present in the CCO questionnaire such that we would be able to input their answers directly into the CCO model and calculate the CCO for the implementation of their specific data warehouse requirements. The survey results by themselves are interesting and have been included.
• 100% of those surveyed use Table Partitioning to help control the size of database tables and to improve query performance.
• 36% surveyed use Clustering (i.e., System Partitioning or MPP) as a technique to improve overall query performance.
• 85% surveyed use Commercial Extract, Transformation, and Load (ETL) software to build and update their data warehouses.
• 85% surveyed use a Commercial Query Manager to control when and how complex queries would be allowed to run.
• 94% surveyed use data in a Multi-dimensional On-Line Analytical Processing (OLAP) tool to enable them to slice and dice summary or aggregated information.
• 12% surveyed use commercial Data Mining software to find patterns and aberrations in the data which could lead to a meaningful business insight.
• 4% surveyed use commercial Data Visualization software to visualize their data using advanced visual paradigms such that analysts can quickly find business insight in the patterns and aberrations found in the data.
• The survey showed user counts range from 600 to 200,000 users of the data warehouses. Further, those that responded to the survey try to build data warehouses that are used widely and often throughout the enterprise.
• Of those that responded to the survey, they averaged that 1/3 of users use the data on a frequent basis and nearly all of the users use the data every business day.
14
• Of the data warehouses included in the survey, the CPU count ranged from 2 to 32 CPU’s with an average of 8 CPU.
• Of those that responded to the survey, they have built data warehouse developer staffs that count from 3 to 382 programmers with an average of 49 developers.
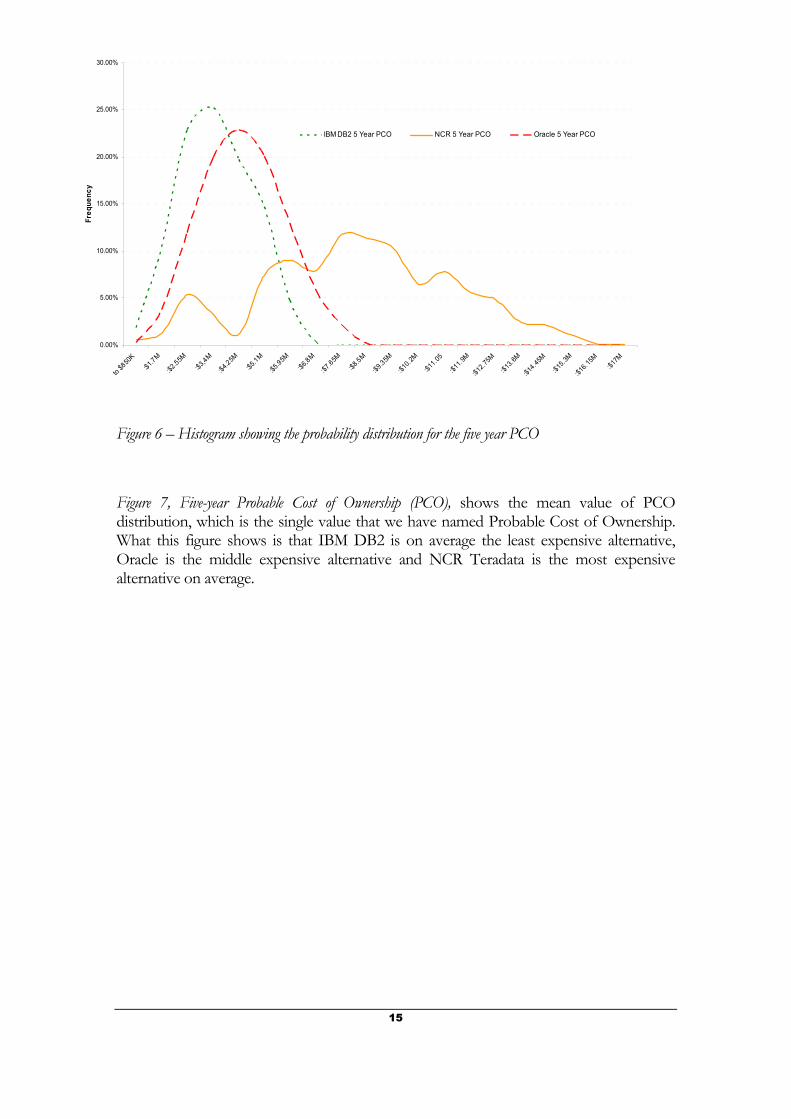
MONTE CARLO SIMULATION RESULTS Using the Data Warehouse CCO model as a basis, we used commercial Monte Carlo simulation software which examined the widest range of input to the model as possible. Our survey results were used to create a random variable for each input to the Data Warehouse CCO questionnaire. We then ran the simulation through 100,000 random iterations; each random iteration representing a real-world data warehouse scenario. The Monte Carlo simulation software then collected the results of the CCO model for a series of output variables. These output variables allow us to create statistics for the CCO output variables based upon the 100,000 real world configurations in the sample size. The statistics allow us to get a better feel for the probability distribution associated with the Comparative Cost of Ownership (CCO) output variables; this is why we have named this a Probable Cost of Ownership (PCO).
Figure 6, Histogram showing the probability distribution for the Five Year PCO, represents what the probability distribution looks like for the five year PCO for each of the three vendors. From the figure we see that IBM DB2 has the least spread of five year PCO while NCR Teradata has the widest. What this means is that IBM DB2 will offer the lowest cost over 5-Years and as your data warehouse grows, the cost will remain low. For Oracle, the costs are higher while the growth in cost as the data warehouse grows is a little higher. But for NCR Teradata, it means that the costs are high to begin with and will grow substantially.
15
Figure 6 – Histogram showing the probability distribution for the five year PCO
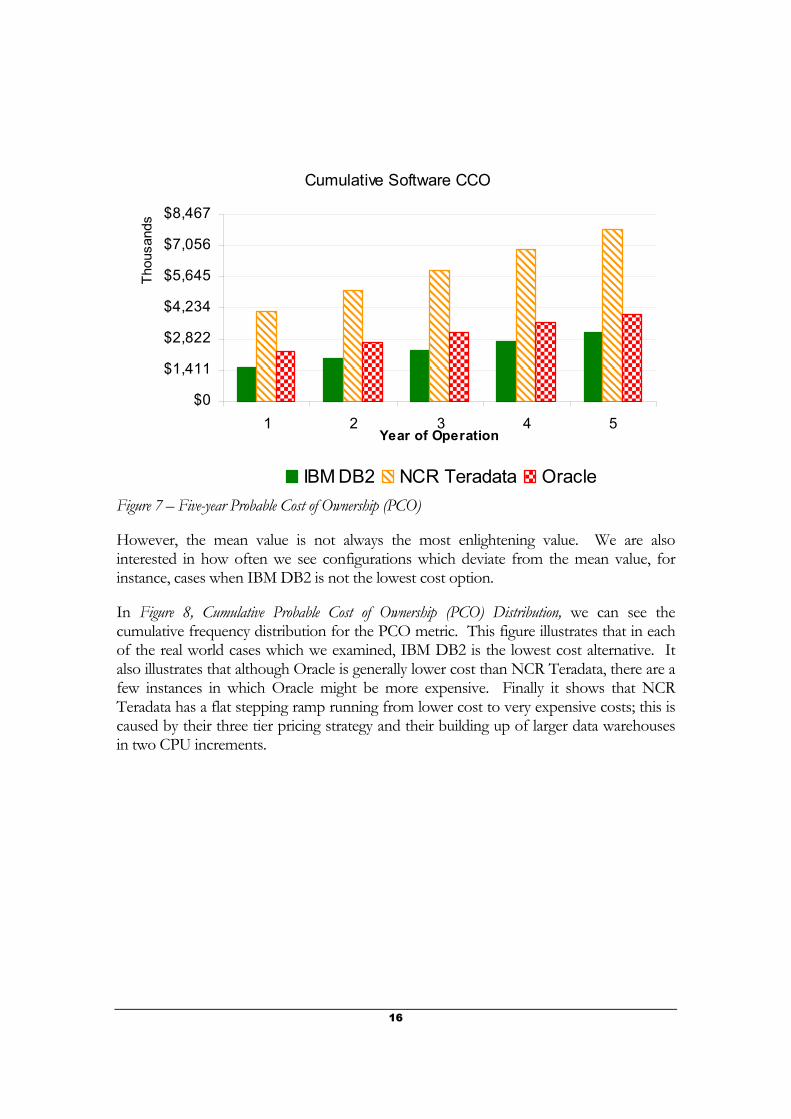
Figure 7, Five-year Probable Cost of Ownership (PCO), shows the mean value of PCO distribution, which is the single value that we have named Probable Cost of Ownership. What this figure shows is that IBM DB2 is on average the least expensive alternative, Oracle is the middle expensive alternative and NCR Teradata is the most expensive alternative on average.
0.00%
5.00%
10.00%
15.00%
20.00%
25.00%
30.00%
to $8
50K
:$1.7M
:$2.55M
:$3,4M
:$4.25M
:$5.1M
:$5.95M
:$6,8M
:$7.65M
:$8.5M
:$9.35M
:$10.2
M
:$11.0
5
:$11.9
M
:$12.7
5M
:$13.6
M
:$14.4
5M
:$15.3
M
:$16.1
5M:$1
7M
Freq
uenc
y
IBM DB2 5 Year PCO NCR 5 Year PCO Oracle 5 Year PCO
16
Figure 7 – Five-year Probable Cost of Ownership (PCO)
However, the mean value is not always the most enlightening value. We are also interested in how often we see configurations which deviate from the mean value, for instance, cases when IBM DB2 is not the lowest cost option.
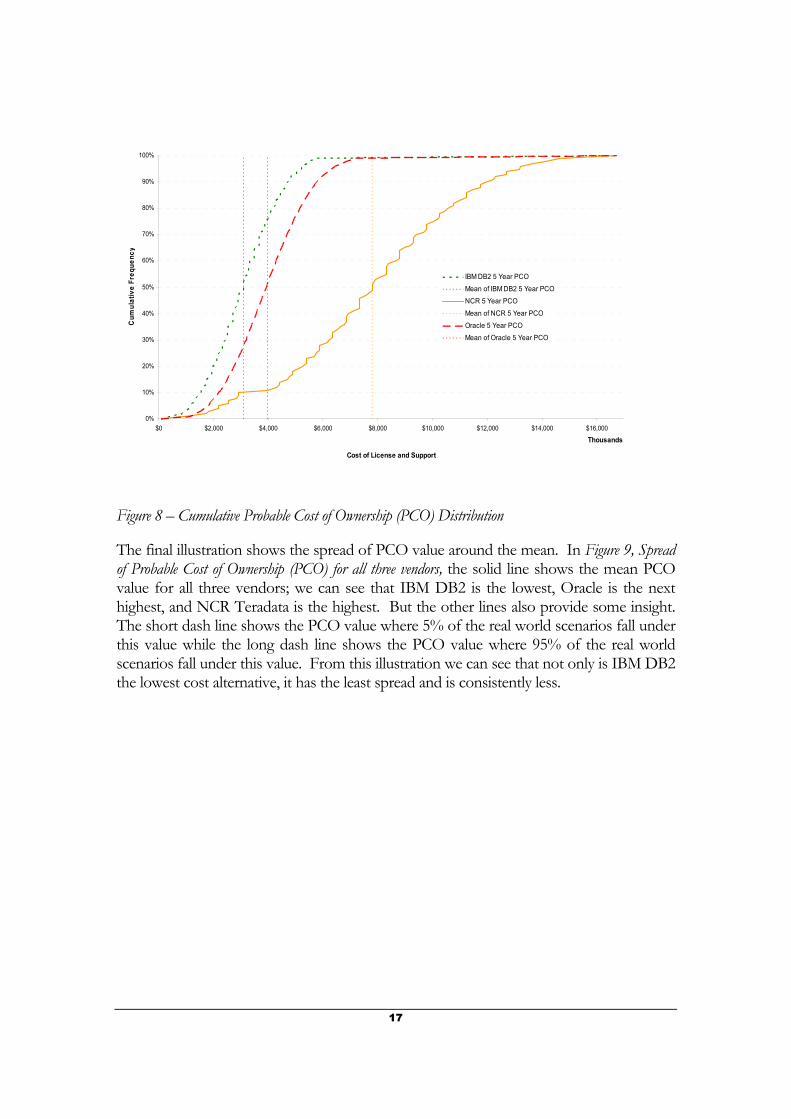
In Figure 8, Cumulative Probable Cost of Ownership (PCO) Distribution, we can see the cumulative frequency distribution for the PCO metric. This figure illustrates that in each of the real world cases which we examined, IBM DB2 is the lowest cost alternative. It also illustrates that although Oracle is generally lower cost than NCR Teradata, there are a few instances in which Oracle might be more expensive. Finally it shows that NCR Teradata has a flat stepping ramp running from lower cost to very expensive costs; this is caused by their three tier pricing strategy and their building up of larger data warehouses in two CPU increments.
Cumulative Software CCO
$0
$1,411
$2,822
$4,234
$5,645
$7,056
$8,467
1 2 3 4 5
Thou
sand
s
Year of Operation
IBM DB2 NCR Teradata Oracle
17
Figure 8 – Cumulative Probable Cost of Ownership (PCO) Distribution
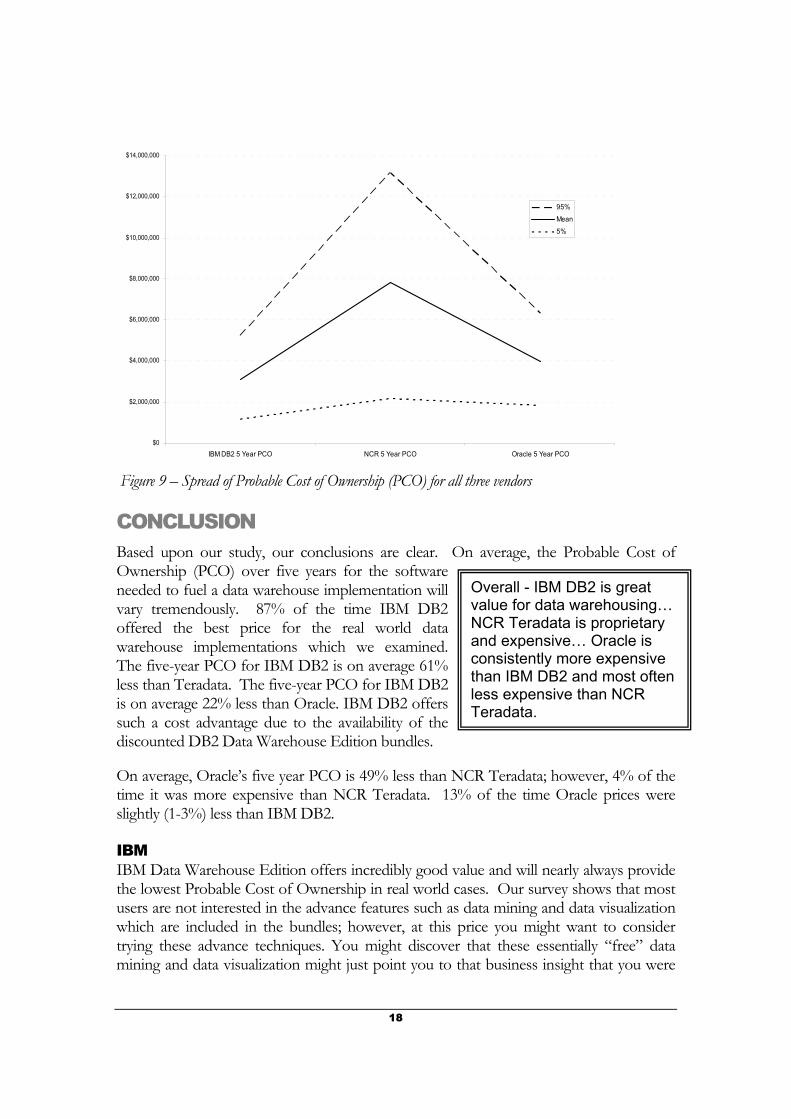
The final illustration shows the spread of PCO value around the mean. In Figure 9, Spread of Probable Cost of Ownership (PCO) for all three vendors, the solid line shows the mean PCO value for all three vendors; we can see that IBM DB2 is the lowest, Oracle is the next highest, and NCR Teradata is the highest. But the other lines also provide some insight. The short dash line shows the PCO value where 5% of the real world scenarios fall under this value while the long dash line shows the PCO value where 95% of the real world scenarios fall under this value. From this illustration we can see that not only is IBM DB2 the lowest cost alternative, it has the least spread and is consistently less.
0%
10%
20%
30%
40%
50%
60%
70%
80%
90%
100%
$0 $2,000 $4,000 $6,000 $8,000 $10,000 $12,000 $14,000 $16,000
Thousands
Cost of License and Support
Cum
ulat
ive
Freq
uenc
y
IBM DB2 5 Year PCO
Mean of IBM DB2 5 Year PCO
NCR 5 Year PCO
Mean of NCR 5 Year PCO
Oracle 5 Year PCO
Mean of Oracle 5 Year PCO
18
Figure 9 – Spread of Probable Cost of Ownership (PCO) for all three vendors
CONCLUSION Based upon our study, our conclusions are clear. On average, the Probable Cost of Ownership (PCO) over five years for the software needed to fuel a data warehouse implementation will vary tremendously. 87% of the time IBM DB2 offered the best price for the real world data warehouse implementations which we examined. The five-year PCO for IBM DB2 is on average 61% less than Teradata. The five-year PCO for IBM DB2 is on average 22% less than Oracle. IBM DB2 offers such a cost advantage due to the availability of the discounted DB2 Data Warehouse Edition bundles.
On average, Oracle’s five year PCO is 49% less than NCR Teradata; however, 4% of the time it was more expensive than NCR Teradata. 13% of the time Oracle prices were slightly (1-3%) less than IBM DB2.
IBM IBM Data Warehouse Edition offers incredibly good value and will nearly always provide the lowest Probable Cost of Ownership in real world cases. Our survey shows that most users are not interested in the advance features such as data mining and data visualization which are included in the bundles; however, at this price you might want to consider trying these advance techniques. You might discover that these essentially “free” data mining and data visualization might just point you to that business insight that you were
Overall - IBM DB2 is great value for data warehousing… NCR Teradata is proprietary and expensive… Oracle is consistently more expensive than IBM DB2 and most often less expensive than NCR Teradata.
$0
$2,000,000
$4,000,000
$6,000,000
$8,000,000
$10,000,000
$12,000,000
$14,000,000
IBM DB2 5 Year PCO NCR 5 Year PCO Oracle 5 Year PCO
95%
Mean
5%
19
seeking when you began the data warehouse project to begin with. The IBM licensing is simple and straightforward and the software provides tremendous flexibility as to the choice of OS and hardware. Overall - IBM DB2 is great value for data warehousing.
NCR Teradata We found NCR Teradata software licensing and support to be very expensive and resulting in a very high Probable Cost of Ownership (PCO). This was due primarily to the fact that the price of the software licenses, and hence the support, increases with the speed of the CPU and the performance of the underlying system. NCR Teradata only supports their own-branded proprietary hardware. NCR was the least transparent in the pricing of their software and services. NCR pricing and licensing information is very difficult to find and we eventually used the US Government GSA price list. Overall - NCR Teradata is proprietary and expensive.
Oracle We found that Oracle was 87% of the time more expensive than DB2 but less expensive than Teradata in all but 4% of the cases. Thus, Oracle offers the middle-of-the-road Probable Cost of Ownership (PCO); however, this is a wide road and there are substantial PCO differences between all three vendors. Although Oracle does an excellent job of publishing their pricing information to enable customers to make choices, their software licensing is complex and often difficult to understand. In particular, we observed that although the entry level pricing of Oracle Standard Edition is attractive, for many data warehouses you will not benefit from this pricing since you are not allowed to use the Standard Edition with the data warehousing options which you might require and our survey showed as popular. We advise you to look closely at the restrictions on Standard Edition to avoid a surprise. Overall - Oracle is consistently more expensive than IBM DB2 and most often less expensive than NCR Teradata.
All three vendors had strengths and weaknesses, and these strengths and weaknesses will be perceived differently by prospective buyers. At the very least, the data contained in this report, or derived from actual use of the Database CCO Comparison Tool, can help a user more clearly understand their needs and their options while providing them with the leverage necessary to negotiate better discounts.
20
Copyright 2004 by Market Magic Ltd. All rights reserved.
Market Magic, Market Magic Research, the Market Magic logo, Probable Cost of Ownership, and PCO are
trademarks of Market Magic Ltd.
Additional copies of this white-paper can be purchased by contacting Market Magic Ltd below.
Market Magic Ltd. Hassets • Stockton Avenue
Fleet • Hampshire GU51 4NP • England
www.marketmagic.co.uk Phone +44 1252 676377 • Fax +44 1252 629666