probabilistic representation in syllogistic reasoning: a...
TRANSCRIPT

Cognition 157 (2016) 296–320
Contents lists available at ScienceDirect
Cognition
journal homepage: www.elsevier .com/locate /COGNIT
Original Articles
Probabilistic representation in syllogistic reasoning: A theoryto integrate mental models and heuristics
http://dx.doi.org/10.1016/j.cognition.2016.09.0090010-0277/� 2016 The Author(s). Published by Elsevier B.V.This is an open access article under the CC BY-NC-ND license (http://creativecommons.org/licenses/by-nc-nd/4.0/).
⇑ Address: College of Comprehensive Psychology, Ritsumeikan University, 2-150Iwakura-cho, Ibaraki, Osaka 567-8570, Japan.
E-mail address: [email protected]
1 This general word does not necessarily indicate the same thing that is mthe mental model theory introduced later.
Masasi Hattori ⇑College of Comprehensive Psychology, Ritsumeikan University, Japan
a r t i c l e i n f o
Article history:Revised 2 September 2016Accepted 8 September 2016Available online 3 October 2016
Keywords:DeductionProbabilistic inferenceSyllogistic reasoningMental representationInformation gainSymmetry inference
a b s t r a c t
This paper presents a new theory of syllogistic reasoning. The proposed model assumes there are prob-abilistic representations of given signature situations. Instead of conducting an exhaustive search, themodel constructs an individual-based ‘‘logical” mental representation that expresses the most probablestate of affairs, and derives a necessary conclusion that is not inconsistent with the model using heuristicsbased on informativeness. The model is a unification of previous influential models. Its descriptivevalidity has been evaluated against existing empirical data and two new experiments, and by qualitativeanalyses based on previous empirical findings, all of which supported the theory. The model’s behavior isalso consistent with findings in other areas, including working memory capacity. The results indicate thatpeople assume the probabilities of all target events mentioned in a syllogism to be almost equal, whichsuggests links between syllogistic reasoning and other areas of cognition.� 2016 The Author(s). Published by Elsevier B.V. This is an open access article under the CC BY-NC-ND
license (http://creativecommons.org/licenses/by-nc-nd/4.0/).
All fools are poets; this the Prefect feels; and he is merely guiltyof a non distributio medii in thence inferring that all poets arefools.
[— Edgar Allan Poe, The Purloined Letter (1845)]
1. Introduction
Reasoning is intended to derive reasonable conclusions frompremises. Given the assertions that ‘‘The Kyotoite are Japanese”and ‘‘The Japanese are Asian,” it is reasonable to conclude that‘‘The Kyotoite are Asian.” In this case, the relation is transitive: ifK? J and J? A, then K? A. However, if one knows that ‘‘TheKyotoite are suave,” it is illogical to infer that ‘‘Suave people areKyotoite.” A relation is symmetric if X? Y implies Y? X, but suchsymmetrical derivations are not licensed in logic. As such, someinferences are logically valid, and others are invalid; some are easy,and others are difficult. The difficulty of inference depends, at leastpartly, on its logical form, but an error-prone argument can some-times be obvious with a slight change in wording (e.g., using famil-iar terms). At the same time, difficulty of inference must relate toother types of thinking, because if nothing else, reasoning must
be carried out in working memory. Any comprehensive psycholog-ical theory of reasoning must address these issues, that is, whysome inferences are difficult and how this relates to other areasof cognition. The current paper proposes one such attempt, alongwith the novel idea of probabilistic representation. Before going intodetail, however, I first motivate two issues regarding cognitivearchitecture and inferential structure: mental representationsand symmetry, which will feature strongly in what follows.
The current theory (probabilistic representation theory hereafter)proposes dual mental representations: probabilistic representa-tions and individual-based mental models.1 This is based on thehypothesis that people have several thinking modes. We sometimestake a summary view with probabilistic representations when, forexample, we are seeking some rules or tendencies that are usefulfor predictive inference. In this heuristic mode, we think and talkabout probable relations between classes of events or objects (e.g.,‘‘I know the Kyotoite are suave [by and large].”). In contrast, whencritically testing a hypothesis or thinking counterfactually, we takea distinctive view with individual-based representations. In this ana-lytic mode, we talk about stricter (i.e., more logical) rules, sometimesfocusing on exceptions (e.g., ‘‘One of my acquaintances is Kyotoite,but he is not suave; so, I don’t think this is true.”). In this way,we can easily switch views according to factors such as context,situation, motivation, and purpose. These two distinctive views, I
eant by

M. Hattori / Cognition 157 (2016) 296–320 297
assume, depend on different representations: continuous (i.e., proba-bilistic) and discrete (i.e., individual-based).
Probabilistic representation theory supposes the summary viewprecedes the distinctive, because the summary view is based onheuristic processes but the distinctive view is based on deliberateprocesses. People first have a probabilistic intuition, and next con-struct mental models based on that intuition that serves for logicaltests. As a result, the distinctive view is affected by the summaryview, in that, people’s probabilistic intuitions restrict how they testlogical relations. In modeling this mechanism, a set of discretemental models is a summary representation of a primitive contin-uous probabilistic model, and not the other way around. Thisimplementation is unique among probabilistic approaches thathave been proposed for deductive reasoning. One previous model(Chater & Oaksford, 1999) did not propose any internal representa-tions, and the others (Guyote & Sternberg, 1981; Johnson-Laird,Legrenzi, Girotto, Legrenzi, & Caverni, 1999; Khemlani, Lotstein,Trafton, & Johnson-Laird, 2015) assume the priority of discretemodels, introducing probabilistic behavior by allocating numerals(i.e., probability values) to discrete models.
This aspect of the theory is an extension of recent approaches toreasoning based on probability (e.g., Chater & Oaksford, 1999;Evans & Over, 2004; Oaksford & Chater, 2007) called the new para-digm in the psychology of reasoning (Elqayam & Over, 2013; Over,2009). Although logic guides deductive reasoning, the idea thatdeduction depends on logic as a normative theory of human rea-soning is now an ‘‘ancient proposal” (Johnson-Laird, Khemlani, &Goodwin, 2015, p. 201). After the 1990s, many researchers movedto probabilistic approaches to reasoning. In these approaches it isusually presupposed that degrees of certainty or belief correspondto subjective probabilities, and the validity of an argument isassessed via the probabilistic validity, or p-validity, proposed byAdams (1975): the uncertainty (i.e., the complement of the proba-bility) of a p-valid conclusion does not exceed the sum of theuncertainties of the premises. This presupposition implicitlyrequires each proposition to retain its probability (at any time inany context, in principle) to enable probabilistic inference asfollows:
(prob
)
The Kyotoite are suave.
(prob(prob(prob
= 0.85)
The suave are . . . = 0.43) . . . = 0.05)The Kyotoite are . . .
= . . .)2 It is called the equiprobability assumption in Hattori and Oaksford (2007) andHattori and Nishida (2009). However, some researchers use the same term with thedifferent meaning that each individual possibility has the same probability (e.g.,Johnson-Laird et al., 1999; Lecoutre, 1992). To avoid confusion, I adopt a differentname here.
This actually places an excessive load on the working memory,especially when forming a chain of inferences, because an extrapiece of information about probability must be retained for eachstatement. Moreover, even a couple of premises can result in innu-merable (p-)valid (but vapid) conclusions (see, Johnson-Laird et al.,2015). Thus, a model based on a system of p-validity (as well as astandard binary logic) can generate serious concerns at the algorith-mic level about the feasibility of a model implementing (deductive)reasoning. It seems reasonable to suppose that people discretize(i.e., simplify) their degrees of belief in each proposition at somepoint in time. For example, a statement with a probability of 95%or higher may be regarded as just a ‘‘true” statement somewherein the course of the reasoning process. In the probabilistic represen-tation model, this is done by constructing a discrete model (i.e.,by generating a small number of samples) in accordance with agiven probability distribution contained in the probabilisticrepresentation.
The current theory also proposes that symmetry inferences arecentral to syllogistic reasoning performance. The symmetry infer-ence is prevalent not only in syllogisms, but also in other areas.
For example, a conditional ‘‘If X then Y” is often interpreted as ifit also means that ‘‘If not-X then not-Y” or ‘‘If Y then X” at the sametime (e.g., Geis & Zwicky, 1971; Staudenmayer, 1975). A logic-based account for this inference is that the conditional ‘‘X? Y” isprone to be interpreted as a biconditional ‘‘XM Y” (e.g., Johnson-Laird & Byrne, 1991). Similarly, if one is told that the probabilityof a woman who has breast cancer receiving a positive mammog-raphy is 80%, then one is apt to infer that the probability that awoman who tested positive actually has breast cancer is also about80%, even if the answer clearly violates the Bayesian norm (Eddy,1982; Gigerenzer & Hoffrage, 1995; Tversky & Kahneman, 1980).Many researchers have attributed this type of error to the inversefallacy, a tendency to confuse a given conditional probability P(symptom | disease) with the inverse conditional probability, P(dis-ease | symptom), that is to be judged (Braine, Connell, Freitag, &O’Brien, 1990; Gavanski & Hui, 1992; Hammerton, 1973; Koehler,1996; Macchi, 1995; Villejoubert & Mandel, 2002; Wolfe, 1995).These are all examples of the symmetry inference.
One of the reasons why symmetry inference is important for acomprehensive theory of thinking is that this mode of inferencehas been argued to be distinctively human. Nonhuman animalssuch as chimps (Dugdale & Lowe, 1990, 2000), find symmetryinferences extremely difficult (e.g., D’Amato, Salmon, Loukas, &Tomie, 1985; Sidman et al., 1982). Many researchers have pointedto the relevance of symmetry to language processing (e.g., Dugdale& Lowe, 1990; Horne & Lowe, 1996; Oaksford, 2008) or to creativ-ity (Hattori, 2008). The fundamental ability to perform symmetryinferences may be constrained by phylogenetic factors, and isclosely related to other areas of cognition such as language andcreativity that are only found in humans. Thus, appearance ofsymmetry inferences in syllogistic reasoning may be a reflectionof our common cognitive architecture.
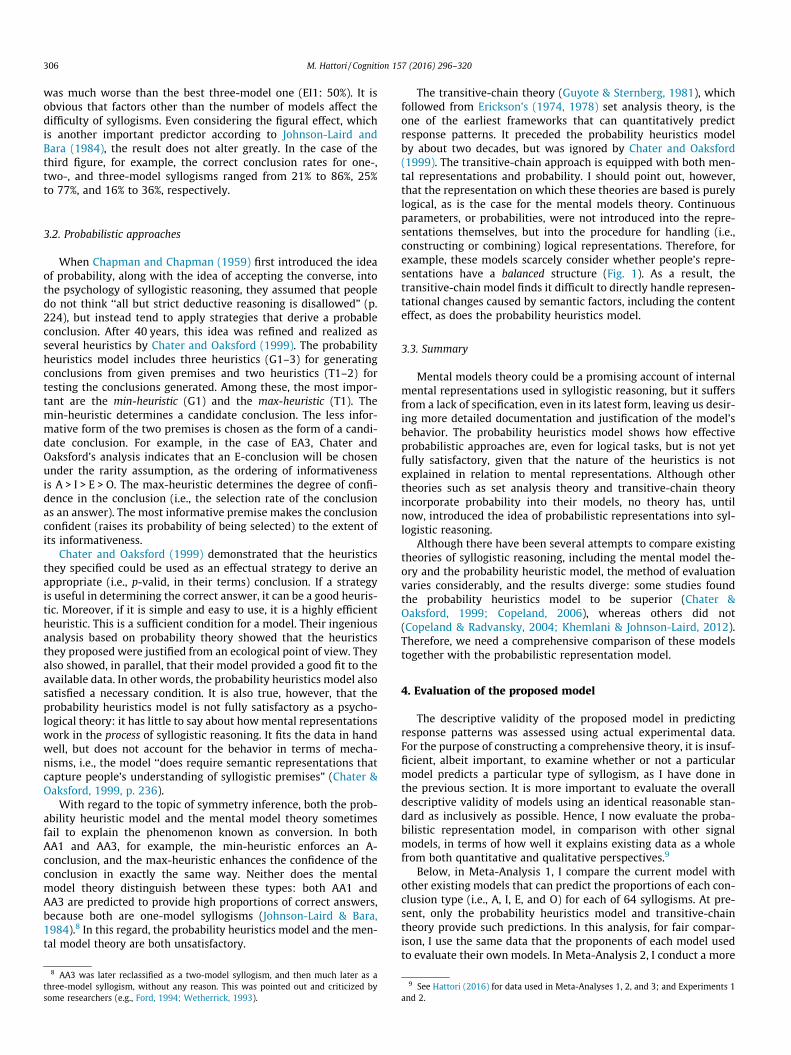
A theory with probabilistic representations may afford aninsight into the nature of symmetry inferences. Hattori andNishida (2009) hypothesized that people tend to regard two targetclasses of objects or events as almost equal in size (see Fig. 1). Forexample, when we think of a disease (e.g., breast cancer) and itssymptoms (e.g., a positive mammography), we assume that thesizes of two target sets, one for the disease and the other for symp-toms, are roughly the same. This default assumption results in theinverse fallacy. It is reasonable to assume that the target eventshave a similar probability, unless we know this is not the case(e.g., showing many false positives for a rare disease), becausewe then gain some information about the credibility of the test.Thus equating the sizes of two target sets (i.e., a set-size balancingprinciple2) is a reasonable model of ignorance and the simplestassumption. This principle is known to be maintained in other areasof human thinking, including causal induction (Hattori & Oaksford,2007) and reasoning in the Wason selection task (Hattori, 2002).Therefore the current theory can reveal an important new linkbetween deductive reasoning and other areas of thinking.
I now briefly introduce the syllogistic reasoning task and someof the terminology required to understand the literature and thecurrent theory before turning to review of previous studies. I fol-low the orthodox Aristotelian classification in this paper, althoughthere are several different forms of notation used in the psycholog-ical literature (see also Appendix A). Syllogisms are constructedwith two premises and one conclusion. Each statement is one offour forms called moods. Traditionally, these are labeled A, I, E,and O:

Table 1All types of syllogism with their valid conclusions, and predictions by the mentalmodels theory.
No Type Valid conclusion MMT
Aristotle J-L #MM 1st 2nd 3rd
1 AA1 A A 1 A,A0
2 AA2 – – 2 A,A0 N3 AA3 I I,I0 1 A,A0
4 AA4 I A0 1 A,A0
5 AI1 I I,I0 1 I,I0
AI2 – – 2 I,I0 NAI3 I I,I0 1 I,I0
P
SS
P
(I) Imbalanced (II) Balanced
Fig. 1. Probabilistic structures.
298 M. Hattori / Cognition 157 (2016) 296–320
A:
M – PS – MS – P
(1)
All X are Y67
AI4 – – 2 I,I0 N
I: Some X are Y 8 IA1 – – 2 I,I0 N0
E: No X are Y 9IA2 – – 2 I,I NIA3 I I,I0 1 I,I0
O:
Some X are not Y 1011 12 IA4 I I,I0 1 I,I013 AE1 – O0 3 E,E0 O,N O0
14 AE2 E E,E0 1 E,E0
15 AE3 – O0 3 E,E0 O,N O0
16 AE4 E E,E0 1 E,E0
17 EA1 E E,E0 1 E,E0
18 EA2 E E,E0 1 E,E0
19 EA3 O O 3 E,E0 O0 ,N O20 EA4 O O 3 E,E0 O0 ,N O21 AO1 – – 2 O,O0 N22 AO2 O O 2 O0 O,N23 AO3 – O0 2 O O0 ,N24 AO4 – – 2 O,O0 N25 OA1 – – 2 O,O0 N26 OA2 – O0 2 O O0 ,N27 OA3 O O 2 O0 O,N28 OA4 – – 2 O,O0 N29 II1 – – 2 I,I0 N30 II2 – – 2 I,I0 N31 II3 – – 2 I,I0 N32 II4 – – 2 I,I0 N33 IE1 – O0 3 E,E0 O,N O0
34 IE2 – O0 3 E,E0 O,N O0
35 IE3 – O0 3 E,E0 O,N O0
36 IE4 – O0 3 E,E0 O,N O0
37 EI1 O O 3 E,E0 O0 ,N O38 EI2 O O 3 E,E0 O0 ,N O39 EI3 O O 3 E,E0 O0 ,N O40 EI4 O O 3 E,E0 O0 ,N O41 IO1 – – 2 O,O0 N42 IO2 – – 2 O,O0 N43 IO3 – – 2 O,O0 N44 IO4 – – 2 O,O0 N45 OI1 – – 2 O,O0 N46 OI2 – – 2 O,O0 N47 OI3 – – 2 O,O0 N48 OI4 – – 2 O,O0 N49 EE1 – – 2 E,E0 N50 EE2 – – 2 E,E0 N51 EE3 – – 2 E,E0 N52 EE4 – – 2 E,E0 N53 EO1 – – 2 E,E0 N54 EO2 – – 2 E,E0 N55 EO3 – – 2 E,E0 N56 EO4 – – 2 E,E0 N57 OE1 – – 2 E,E0 N58 OE2 – – 2 E,E0 N59 OE3 – – 2 E,E0 N60 OE4 – – 2 E,E0 N61 OO1 – – 2 O,O0 N62 OO2 – – 2 O,O0 N63 OO3 – – 2 O,O0 N64 OO4 – – 2 O,O0 N
The subject (S) and predicate (P) in the conclusion are called endterms, and a term that does not appear in the conclusion is calleda middle term (M). The two terms X and Y in the first premise corre-spond to P and M, or M and P, respectively; likewise, X and Y in thesecond premise correspond to S and M, or M and S, respectively. Aseach premise has two possibilities, there are four possibilities forthe positions of end and middle terms, which are called figures, asshown in Fig. 2 (see also Appendix A). Because each of two premisescan be one of the four moods, and there are four possibilitiesregarding the position of terms, there are 4� 4� 4 ¼ 64 possibletypes of premises for logical syllogisms. These are expressed by aset of three symbols, such as AA1, indicating the mood of the firstpremise, the mood of the second premise, and the figure (1–4, seeFig. 2). Of these 64 syllogisms, only 19 have a logically valid conclu-sion that can be expressed in terms of A, I, E, and O, as shown inTable 1 (the validity of a syllogism is somewhat controversial, seeAppendix A).
Symmetry inferences in syllogistic reasoning were first articu-lated by Chapman and Chapman (1959), which is now called illicitconversion, although the idea dates back to the early work ofWilkins (1928) and Sells (1936). Their seminal (albeit ambiguous)ideas, on which the current study relies heavily, seemed to accountfor the trend of people’s major responses to syllogisms, as well asthe atmosphere hypothesis (Woodworth & Sells, 1935). However,it was not until the 1970s that a comprehensive theory appeared.Ceraso and Provitesa (1971) first proposed the concept of the inde-terminacy of representations with regard to Euler circle representa-tions of syllogisms. This concept is relevant to some major theoriesin this area. They noted that premises in forms A, I, and O areambiguous in terms of specifying the set relations between theterms in the premise. That is, ‘‘All X are Y” (A) is compatible withtwo possible set relations, X ¼ Y and X � Y (X is included in Y),which correspond to Euler circles D0 and D1, respectively, inFig. 3. Developing this idea, Erickson (1974) proposed a set analysistheory, which Guyote and Sternberg (1981) later developed into amuch specific model called the transitive-chain theory, which is ahybrid model of logic and probability. Each premise has one ormore possible representations in terms of set relations. This isthe main reason why the combined representation for two pre-mises of a syllogism always has alternatives. To handle this inde-terminacy, Guyote and Sternberg (1981) introduced probabilitiesinto the model, and established representational priorities to
Note. The prime symbol indicates that the order of terms is converted (i.e., P–Sinstead of S–P). The ‘‘–” sign indicates there is ‘‘No valid conclusion.” N indicates themodel predicts the ‘‘No valid conclusion” response. ‘‘J-L” indicates Johnson-Laird’sdefinition.
P – MS – MS – P
M – PM – SS – P
P – MM – SS – P
(2) (3) (4)
Fig. 2. Syllogistic figures.
derive a logical conclusion. Their highly complicated parameter-ized model was the first to qualitatively predict participants’response patterns, and exhibited a good fit to the available data.

Fig. 3. Euler circles representing the relationships between two sets, X and Y.
M. Hattori / Cognition 157 (2016) 296–320 299
The idea of incorporating probability into a model of syllogisticreasoning, which is normatively non-probabilistic, was later fol-lowed by the probabilistic heuristics model (Chater & Oaksford,1999), albeit this placed issues about the nature of mental repre-sentations to one side. The indeterminate nature of mental repre-sentations was also a key idea in the mental models theory(Johnson-Laird & Bara, 1984; Johnson-Laird & Steedman, 1978),but this model could not elicit quantitative predictions. As such,the probability heuristics model and the mental model theoryappear to be mutually exclusive. The current theory based on prob-abilistic representation is an intersection of these theories,intended to provide a new integrated theory.
2. A theory of probabilistic representation
In this section, I present a model for syllogistic reasoning basedon probabilistic representations.3 This theory, unlike previous prob-abilistic approaches, predicts people’s behavior in syllogisms basedon internal representations. The model’s two major assumptionsare (1) that probabilistic representations are constructed and (2) thatinferences are based on individual-based representations. The modelassumes that people reason by picturing a ‘‘probable” state of affairsdrawn from the premises of a syllogism instead of an exhaustive log-ical scrutiny of propositions in the premises. The model also includesthree key conceptions: (1) minimal constraints on logical relations,(2) a small number of samples, and (3) the informativeness of state-ments. Each conception corresponds to one step of the model, asdetailed below.
2.1. Outline of the model
First, I briefly illustrate the conception of probabilistic inferencethat was first introduced by Chapman and Chapman (1959). I thenattempt to reformulate this concept.
2.1.1. Probabilistic inferenceHere, I introduce a sketch of a probabilistic inference, the heart
of the current theory. According to Chapman and Chapman (1959),people regard the middle term of a syllogism as a common qualityor effect: people reason that ‘‘things that have common qualities oreffects are likely to be the same kinds of things, but things that lackcommon qualities or effects are not likely to be the same” (p. 225).For example, given the premises that ‘‘Some Practitioners areMediators” and ‘‘Some Sophists are not Mediators” (IO2), Sophistsand Practitioners are not likely to be considered the same kindsof people, and thus ‘‘Some Sophists are not Practitioners” (O) isfalsely concluded by probabilistic inference.
I now provide a more formal explanation of my interpretationof this idea. Logically speaking, there can be some individualswho are both Sophists (S) and Practitioners (P), but not Mediators(M); in fact, all individuals can be so (i.e., both S and P, but not M).Therefore, the O-conclusion (shown above) must be rejected. How-
3 The model code (implemented in R, ver. 3.1.0 or later) together with all data usedin this article is available online (Hattori, 2016).
ever, people seem to infer that the probability that an individualwho is S but not M (warranted by the second premise) also hap-pens to be P is very small; thus, the O-conclusion is not suppressed.This view is justified as follows by the rarity assumption (Oaksford& Chater, 1994). As the probability of S is small (i.e., rare), the prob-ability that some arbitrary individual is S but not M is smaller.Moreover, the probability of P is small (i.e., rare). Therefore, theprobability that an individual is S but not M and also P would bemuch smaller. This means that the conclusion is hardly refuted,or the conclusion has some probability of being endorsed. Thissketch instantiates how our (deductive) inference is affected byprobabilistic information. It shows how individual heuristics areincorporated in a process of deduction, and also how an originalidea of probabilistic inference is linked to mathematicalprobabilities.
2.1.2. Model assumptions and stepsThe model has three major assumptions:
(1) The assumption of probabilistic representations: Models thatrepresent a state of affairs include probabilistic information,which is sometimes logically incorrect.
(2) The assumption of individual-based representations: ‘‘Logical”(i.e., discrete) inferences are made based on a finite numberof individual elements.
(3) The assumption of possibility: A logically possible (not neces-sary) conclusion is derived based on the individual-basedrepresentation.
According to the current theory, probabilistic information thatis essentially irrelevant to descriptions of the logical status or tological inferences will (inevitably) affect our deductive reasoning.This is because the construction of probabilistic representationsprecedes individual-based representations. Contrary to assump-tion (1), most psychological theories on syllogistic reasoning, aswell as the ordinary Euler circle representation, do not distinguishbetween two diagrams that are topologically identical.
The second point of the model is the process of assessing logicalrelationships based on a limited number of individuals. The modelinherits the idea that a class is represented by limited number ofindividuals from the mental model theory. The new modelassumes that we have difficulty thinking about many elements atthe same time because of working memory limitations. A logicalstatement that is not inconsistent with the current finite sampleis assumed to be derived. I introduce the concept of random sam-pling to connect these two assumptions.
The third point of the model is that we derive a statement as a‘‘logical” conclusion if the statement tested is consistent with theindividual-based model that indicates a possibility (not the neces-sity) of given premises (Evans, Handley, Harper, & Johnson-Laird,1999). The test is conducted sequentially, and the informativenessof statements affects the process. The model process in drawing aconclusion from the premises of a syllogism is assumed to consistof three steps:

300 M. Hattori / Cognition 157 (2016) 296–320
(1) Constructing a probability prototype model (PPM): Given asyllogism, people construct a representative model withminimal logical constraints other than those given by thetwo premises. This model includes probabilistic informationabout the occurrence of events.
(2) Constructing a sample mental model (SMM): Generating asmall number of data in accordance with the PPM, peopleconstruct an SMM.
(3) Generating a logical conclusion: People sequentially (indescending order of informativeness) examine which ofthe quantified statements is consistent with the SMM, andthe first one that the model fulfills is chosen as theconclusion.
2.1.3. An illustrationAn outline of the model is schematized in Fig. 4. I now provide a
specific explanation of how the model behaves. In the case of AI2,for example, the two premises are as follows:
Step 1 Probability Prototype Model (PTo construct a PPM that is not logically inconsistent with two premises.
Step 2 Sample Mental Model (SMM)To construct a SMM generating n data in accord with the PPM.
Step 3 Logical ConclusionTo derive a logical conclusion that the SSMfulfills.
1. “Some S are P”? → A2. “No S are P”? → No 3. ...
0
S&M&PS&M&¬PS&¬M&P
S&¬M&¬P¬S&M&P
¬S&M&¬P¬S&¬M&P
¬S&¬M&¬P
0
S&M&PS&M&¬PS&¬M&P
S&¬M&¬P¬S&M&P
¬S&M&¬P¬S&¬M&P
¬S&¬M&¬P
x = .20c = .90
All P are MSome S are M
Random sampling(sample genera�on)
Fig. 4. Outline of the mod
(1) All P are M(2) Some S are M
The first premise causes people to assume the relationshipbetween P and M is like D1 in Fig. 3, and the second premise causesthem to assume the relationship between S and M is like D3. Infact, the first premise is compatible with D0 and D1, and the sec-ond premise is compatible with D0, D1, D2, and D3, but I regardD1 and D3 as ‘‘standard” diagrams for each premise. In the firststep, combining two diagrams with minimal constraints, peopleconstruct a PPM as shown in Step 1 of Fig. 4. This model assignsprobabilities for each area corresponding to 2� 2� 2 ¼ 8 possiblecombinations of the truth values for S, M, and P.
The point here is that a probabilistic representation (PPM) isconstructed in advance before an individual-based mental model(SMM). In this point, the probabilistic representation theory isdistinctive from other theories, including the latest extension ofmental model theory (Khemlani et al., 2015), as mentioned in
S MP
.04 .14
.00
.02
.16.64
PM)
ny individual that is S&P? → “NO”individual that is S&P? → “YES”→ OUTPUT
S MP
0.5 1
0.5 1
el: in the case of AI2.

M. Hattori / Cognition 157 (2016) 296–320 301
Section 1. The probability distribution that determines the proba-bility value of each Euler circle area is defined by two parameters(i.e., x and c) detailed later (Section 2.2.2) and the structural con-straints given by logic.
In the second step, a comparatively small number of elements(e.g., seven) within an SMM are randomly generated according tothe probability distribution defined in the PPM. So the logical sta-tus of each element in a discrete mental model (i.e., SMM) isderived from a random assignment based on a continuous proba-bilistic representation (i.e., PPM). Reasoning processes based onelements in a probable state of affairs are realized by Steps 1 and2: hard-coded standard (not necessarily logical) relationshipsamong terms in the premises (Step 1) and probabilistic sampling(Step 2).
Finally, people test the logical relationships of the SMM in termsof S and P, and output their response. In this case, the first inspec-tion is ‘‘Some S are P” (I), but the particular SMM exemplified inFig. 4 happens to be inconsistent with this statement, and the next,‘‘No S are P” (E), is verified. Thus, the final statement is output as aconclusion. In this procedure, the order of tests greatly affects themodel’s performance. The order is determined according to themin-heuristic and the max-heuristic identified by Chater andOaksford (1999). This example outlines the behavior of the model.I now describe the three steps of the model in detail.
2.2. Step 1: Constructing a probability prototype model
When engaging in syllogistic reasoning, we have to interpretand represent two premises, and then integrate these representa-tions into a single representation. As I mentioned in Section 1,the problem of indeterminacy emerges in this encoding stage. Iassume this encoding is conducted following a law of simplicity:(1) only one representative representation is adopted for each pre-mise and (2) only one minimally restricted probabilistic represen-tation is formed by combining two representations for premises.Here, I explain the model’s specifications using Euler diagramsfor the sake of convenience, but note that the graphical represen-tation is not essential for the modeling, and any other equivalentrepresentations, including some mental tokens (that must beequipped with probabilities) could perform the same function.
2.2.1. Euler circle representationsEach quantifier, A, I, E, and O, corresponds to one or some Euler
circle representations, known as the Gergonne relations (Faris,1955). An A-statement is compatible with Euler representationsD0 and D1 in Fig. 3. Likewise, I-, E-, and O-statements are compat-ible with D0, D1, D2, and D3; with D4; and with D2, D3, and D4,respectively. Let me define a standard Euler representation for eachquantifier from the view of minimal logical constraints. Probabilis-tic constraints for D0 are PðX; �YÞ ¼ 0 and Pð�X;YÞ ¼ 0, and for D1 arePðX; �YÞ ¼ 0 and Pð�X;YÞ > 0. The difference between D0 and D1 isthe constraint on the value of Pð�X;YÞ. D1 can be seen as having lessof a constraint than D0, because Pð�X;YÞ of D1 (i.e., a value greater
Fig. 5. Three possible combined Euler circles for AI2 when the two premises are D1 anbecause it maximizes the independence.
than 0 and smaller than or equal to 1) has a much higher degree offreedom than that of D2 (i.e., 0, which is a particular point on anumber line). The Euler circle with the highest freedom amongpossible variations under the probabilistic constraints imposedby a premise is called the standard Euler representation of the pre-mise. According to this definition, the standard representation of Iis D3, because D3 is the least constrained diagram among the four.Likewise, the standard representations of E and O are D4 and D3,respectively. The idea of this standard representation is based onthe minimization of logical constraints, or maximization ofindependence. Note that Stenning and Oberlander’s (1995) purelylogical detailed analyses provided similar results.
To draw a conclusion from two premises, the Euler circle repre-sentations for the premises should be combined into one. In somecases, however, several possibilities emerge at this stage. In suchcases, the least logically constrained representation is againadopted. For example, as shown in Fig. 5, three Euler representa-tions are possible for AI2 when combining D1 for the first premiseand D3 for the second premise. Among the three, we chooseFig. 5-III as the standard representation, in which independencebetween S and P conditioned by M can be assumed. That is, giventhat the first premise imposes constraint PðMjPÞ ¼ 1, and the sec-ond premise requires that PðS;MÞ > 0, the maximum freedom isallowed between the end terms by assuming their conditionalindependence (Chater & Oaksford, 1999; Pearl, 1988) given themiddle term, PðS;PjMÞ ¼ PðSjMÞPðPjMÞ. The conditional indepen-dence is important for the probability heuristic models (Chater &Oaksford, 1999) as it affects the p-validity of conclusions, and isthus incorporated into the current theory although it does notdirectly use p-validity. The standard Euler circle representationsfor all syllogisms are shown in Fig. 6.
2.2.2. Assigning probabilities to Euler circles: two parametersNext, we assign probabilities to each of the subsets of the Euler
circles. For this procedure, I again assume a law of simplicity. Acombination of three sets, S, M, and P, yields a maximum of23 = 8 subsets, indicated by Arabic numerals 1–8 in Fig. 6 (seethe note in Table 2 for the correspondence between each numeraland its logical status). I introduce the simplest policy that assumesall terms have the same probability (expressed by a parameter x),unless this violates the logical constraints of the premises, and theyretain maximal independence. First, the probability of the middleterm P(M) is assumed to be expressed by x:
x ¼ PðMÞ: ð1ÞUnless the premise is A, S and P are allowed to have the same prob-ability as M, and we can assume
PðSÞ ¼ x; ð2ÞPðPÞ ¼ x: ð3ÞWhen the premise is A, the probability is defined by a coverageparameter c (0 < c 6 1). If the premise is ‘‘All X are M” (X standsfor S or P),
d D3 in Fig. 3. The probability prototype model (PPM) of AI2 is assumed to be III,

SSM
P
15 7
PS
2 1 5
PM
1
3
74P
MS
12 4
SM
P
13 5 7 651244
S P M M S P
6 2 1 5 7
MS P
12 34 7
SM
P
34 5 7
S
P
M
4 56S
M P
2 6 7
S P M
4 3
7
5 6
M S P
6 2
4
3 7
S
PM7
3
4
6S P
M
1
3
2
4
5
7
6
PSM
2 34 7
M
6
(1) AA1 (AA1) (2) AA2 (AA2) (3) AA3 (AA3) (4) AA4 (AA4)
(5) AI13 (AI1,3; AO1,3) (6) AI24 (AI2,4; AO2,4) (7) IA12 (IA1,2; OA1,2) (8) IA34 (IA3,4; OA3,4)
(9) AE13 (AE1,3) (10) AE24 (AE2,4) (11) EA12 (EA1,2) (12) EA34 (EA3,4)
(13) IE (IE*; OE*) (14) EI (EI*; EO*) (15) EE (EE*) (16) II (II*; IO*; OI*; OO*)
Fig. 6. PPM for each syllogism expressed by the Euler diagram. Each model corresponds to the syllogisms listed in parentheses. Asterisks in parentheses indicate the wildcard(e.g., IE⁄ indicates IE1,2,3,4). S, M, and P indicate syllogistic terms and Arabic numerals indicate the logical status of the corresponding areas (e.g., 1 indicates S and M and P;see the note to Table 2).
302 M. Hattori / Cognition 157 (2016) 296–320
PðXÞ ¼ cx: ð4ÞAlternatively, if the premise is ‘‘All M are X,”
PðXÞ ¼ 1� cð1� xÞ: ð5ÞThe coverage parameter means that the overlap between X and Mgrows as c approaches 1, and X completely coincides with M whenc = 1.
Second, joint probabilities for S, M, and P are defined as follows.If the premise is A (‘‘All X are Y”), the logical constraint implies thefollowing relationship:
PðX; �YÞ ¼ 0: ð6ÞSimilarly, if a premise is E (‘‘No X are Y”), the following relationshipis implied:
PðX;YÞ ¼ 0: ð7ÞThe probabilistic interpretations of I (‘‘Some X are Y”) and O (‘‘SomeX are not Y”) would be PðX;YÞ > 0 and PðX; �YÞ > 0, respectively, butthese conditions do not constrain any assigned probability values.Consequently, the two parameters, x and c, uniquely define proba-bilistic representations for all syllogisms.
2.2.3. An illustrationIncorporating Eqs. (1)–(3) as assumptions and Eqs. (4)–(7) as
constraints imposed by logic, and allowing maximal independenceamong terms, the joint probability distribution for S, M, and P canbe defined. Table 2 shows the joint probability distributions for alltypes of syllogisms defined by this procedure. I now explain theprocedure of probability allocation using specific examples. In
the case of AA2, as the first premise is ‘‘All P are M,” P(M) = x andP(P) = cx from Eqs. (1) and (4). According to the conditional inde-pendence between S and P, PðS;PjMÞ ¼ PðSjMÞPðPjMÞ. Therefore,P1 ¼ PðS;M;PÞ ¼ PðS;MÞPðP;MÞ
PðMÞ ¼ PðSÞPðPÞPðMÞ ¼ c2x, where P1 denotes
PðS;M;PÞ. P2; . . . ; P8 are also defined in Table 2. The PPM for AA2(Fig. 6-2) indicates that P2 ¼ PðSÞ � P1 ¼ cx� c2x ¼ cð1� cÞx, andP3 ¼ 0. Then, P4, P6, P7, and P8 are automatically derived asdescribed in the note in Table 2.
The next example is EE1. In this case, the PPM (Fig. 6-15) indi-cates that P1 ¼ P2 ¼ P5 ¼ 0. As the conditional independence is alsomaintained on the outside of M, PðS;Pj �MÞ ¼ PðSj �MÞPðPj �MÞ. There-fore, P3 ¼ ðP3þP4ÞðP3þP7Þ
1�x ¼ x21�x, and the other probabilities (P4, P6, P7,
and P8) are fixed.
2.3. Step 2: Constructing a sample mental model
In this step, an individual-based mental representation is con-structed using instances generated by a random sampling proce-dure based on the probabilities defined by the PPM. Theoreticallyspeaking, if the number of instances generated approaches to infin-ity, the logical relationship that the mental model satisfies coin-cides with its original PPM’s logical relationship (i.e., the onesatisfied by the corresponding Euler circle shown in Fig. 6). Thatis to say, ‘‘AE24” and ‘‘EA12” in Fig. 6 entail both E and O; ‘‘AA1”entails both A and I; and the others entail both I and O.
However, if the number of instances is finite, and particularly ifit is small, the logical relationship in a PPM is not guaranteed in thecorresponding SMM. This is the point of the SMM. For example, in

sm = pm = p
(I) Model 1
E, O
s = pm = p
pp
A, O
(II) Model 2
S PM
S PM
(x = 0.2, c = 0.9)
(x = 0.2, c = 0.5)
Fig. 7. Two examples of sample mental models (SMMs) for syllogism AE1.Parameters alter the probability of each instance being generated. Equivalentrepresentations expressed by the notation of the mental model theory are shown inthe right portions.
Table 2Probabilities of all subsets in each PPM.
No Name Type P(S) P(P)P1 P2 P3 P5
PðS;M; PÞ PðS;M; �PÞ PðS; �M; PÞ Pð�S;M; PÞ1 AA1 AA1 cx y cx 0 0 �cx2 AA2 AA2 cx cx c2x c�cx 0 c�cx3 AA3 AA3 y y x 0 �c2�x 04 AA4 AA4 y cx cx �cx 0 05 AI13 AI1,3; AO1,3 x y x2 0 �cx�x x�x6 AI24 AI2,4; AO2,4 x cx cx2 �cx2 0 cx�x7 IA12 IA1,2; OA1,2 cx x cx2 cx�x 0 �cx2
8 IA34 IA3,4; OA3,4 y x x2 x�x �cx�x 09 AE13 AE1,3 x y 0 0 �cx�x x10 AE24 AE2,4 x cx 0 0 0 cx11 EA12 EA1,2 cx x 0 cx 0 012 EA34 EA3,4 y x 0 x �cx�x 013 IE IE⁄; OE⁄ x x 0 0 x2 x2
14 EI EI⁄; EO⁄ x x 0 x2 x2 015 EE EE⁄ x x 0 0 x2=�x 016 II II⁄; IO⁄; OI⁄; OO⁄ x x x3 x2�x x2�x x2�x
Note. Parameters x and c indicate P(M) and degree of coverage, respectively (see text in detail). In this table, �x and �c stand for 1 � x and 1 � c, respectively; and y ¼ xþ �c�x.Probabilities of other areas can be derived using values given in this table as follows:P4 ¼ PðS; �M; �PÞ ¼ PðSÞ � P1 � P2 � P3.P6 ¼ Pð�S;M; �PÞ ¼ PðMÞ � P1 � P2 � P5.P7 ¼ Pð�S; �M; PÞ ¼ PðSÞ � P1 � P3 � P5.P8 ¼ Pð�S; �M; �PÞ ¼ 1� P1 � P2 � P3 � P4 � P5 � P6.
M. Hattori / Cognition 157 (2016) 296–320 303
the case of ‘‘AE13” in Fig. 6, if c is nearly equal to 1, then M and Plargely overlap, and the probabilities of areas 3 and 7 are small.This makes samples of conjunctive instances for S and P hard toobtain, an I-conclusion becomes hard to derive, and an O- or anE-conclusion is promoted. The sample size is assumed to be seven,which is the approximate size of our working memory, unlessotherwise stated (as in Section 4.7). I now illustrate thismechanism.
For AE1, if we assume x = 0.2 and c = 0.9, the probabilities ofareas 3, 4, 5, 7, and 8 (see the note in Table 2) would be 0.06,0.14, 0.20, 0.02, and 0.58, respectively, according to Table 2. As aresult of sampling seven instances based on these probabilities,assume we now have one instance in area 4, two in area 5, and fourin area 8, as shown in Fig. 7-I. This SMM can be represented in thenotation of the mental model theory, as shown in the right panel ofFig. 7-I.4 In this model, as there is no instance that satisfies both S
4 The representation is not exactly the same as Johnson-Laird’s, because in thispaper I simplify the expression (without altering the number of models) as long as idoes not affect the conclusion. I have tried not to use the notation ‘‘0s” or ‘‘(s)” thaappeared in their earlier papers, which indicate that it is uncertain whether or not therelevant individual exists.
tt
and P, an E- or an O-conclusion will be derived. Which of these isderived depends on the procedure defined in the next step, wherea logical conclusion is generated (detailed in Section 2.4).
Alternatively, if we assume that x = 0.2 and c = 0.5 for the samesyllogism, AE1, the probabilities of areas 3, 4, 5, 7, and 8 would be0.08,0.12,0.20, 0.32, and 0.28, respectively, according to Table 2.Suppose that one, one, two, and three instances are obtained inareas 3, 5, 7, and 8, respectively, based on random sampling, result-ing in the SMM shown in Fig. 7-II. In this case, an A- or I-conclusion, different from the previous case, will be derived.
2.4. Step 3: Generating a logical conclusion and its probability
Once an SMM has been constructed, the next step is to derive alogical conclusion by examining the logical relationships betweenS and P according to the samples in the model. In most cases, how-ever, multiple statements would be compatible with an instance-based model. Logically speaking, A implies I, and E implies O.Therefore, both A- and I-conclusions, and both E- and O-conclusions, are available in some cases. Moreover, in many cases,I- and O-conclusions are not inconsistent with each other. There-fore, the procedure for selecting a conclusion from multiple candi-dates must be clarified to make a prediction of participants’behavior.
2.4.1. Order of the testsI assume an SMM is sequentially tested according to the infor-
mativeness of the syllogistic statements analyzed by Chater andOaksford (1999). The model incorporates two important heuristicsfor forming the output from the probability heuristics model: themin-heuristic and the max-heuristic. The min-heuristic is used todefine the order of testing at the final stage. This is expected torealize an efficient procedure in which more probable candidateswould be tested earlier. It is intuitive that uninformative state-ments can generally provide only a weak argument. In this sense,the informativeness of syllogistic statements restricts the type ofvalid conclusions. The min-heuristic in the probability heuristicsmodel is used to pick the least informative premise of the two asa type of conclusion candidate. Chater and Oaksford (1999)revealed that the order of informativeness of statements under

304 M. Hattori / Cognition 157 (2016) 296–320
the rarity assumption is I(A) > I(I) > I(E) > I(O), and this order isadopted for testing in the probabilistic representation model.
In this model, the max-heuristic is applied at the very lastmoment to output the conclusion. After determining a provisionalcandidate conclusion in the above process, the probability ofadopting it as the final output (i.e., the degree of confidence in thiscandidate as an actual conclusion) is defined by the type of quan-tifiers of the premises according to the max-heuristic. The max-heuristic in the probability heuristics model defines the degree ofconfidence in the conclusion in proportion to the informativenessof the most informative premise. Following this idea, in the prob-abilistic representation model, the degree of confidence is set bysemi-fixed parameters (i.e., uA, uI, uE, and uO) defined by the mostinformative premise (i.e., A, I, E, or O). In practice, the overall algo-rithm of the model is as follows (see Fig. 8):
(1) Choose the least informative statement of the two premises(i.e., the min-heuristic), and set this as the target mood ofthe target statement to be tested.
(2) The given SMM is tested for consistency with the targetstatement. The criteria for judgment are detailed below. Ifthe statement is validated, output it as a conclusion with aprobability defined by the max-heuristic parameters; other-wise, go to (3).
(3) Choose the next most informative mood as the target to betested. If the mood to be tested reaches O, then go back toA. If all four moods are exhausted, output N (i.e., ‘‘no validconclusion”) as the conclusion. Otherwise, return to (2).
In a series of consistency tests, if a candidate conclusion is nec-essary for the targeted SMM, it is adopted as the conclusion. Putanother way, the criteria for testing the consistency of the SMMare as follows:
(1) An A-conclusion is derived if there is not any individual thatis S but not P.
Start
X1
Conclude X1 X2
Conclude X2 X3
Conclude X3
YN
uY 1 uY
YN
uY 1 uY
YN
uY 1 u
Fig. 8. The process for generating a logical conclusion in the model. Logical conclusionscontents of the SMM), and a random effect prescribed by free parameters (uA, uI, uE, and
(2) An I-conclusion is derived if there is at least one individualthat is both S and P.
(3) An E-conclusion is derived if there is not any individual thatis both S and P.
(4) An O-conclusion is derived if there is at least one individualthat is S but not P.
2.4.2. Forming a probability distribution of responsesThe model constructed as described above takes two premises
of a particular syllogism as input, and produces a conclusion ofA, I, E, O, or N as its output. The model simulates, a one-shot infer-ence of a particular person. When the model is iteratively run aconsiderable number of times, the total pattern of its output isassumed to be a prediction for the result of an experiment thatconsiders a sufficient number of participants. The theoretical dis-tribution of the frequency of responses is analytically derived froma probability distribution defined by a PPM and the number ofsamples as follows:
An A-statement, ‘‘All S are P” (S \ �P ¼ £), is consistent in anSMM including n samples with the probability that there is nosample in Areas 2 (S \M \ �P) and 4 (S \ �M \ �P) (see Fig. 6). Theprobability that a sample is in Areas 2 or 4 is P2 þ P4, and the prob-ability that no sample is in either area is 1� P2 � P4. As each sam-ple is independent, the probability that n samples are neither inArea 2 nor in Area 4 is ð1� P2 � P4Þn.
An E-statement, ‘‘No S are P” (S \ P ¼ £), is consistent in anSMM with the probability that there is no sample in Areas 1(S \M \ P) or 3 (S \ �M \ P), which is 1� P1 � P3. As for the A case,the probability that n samples are neither in Area 1 nor in Area 3 isð1� P1 � P3Þn. An I-statement, ‘‘Some S are P” (S \ P–£), is consis-tent if and only if its complement, ‘‘No S are P” (S \ P ¼ £), isinconsistent. The probability of the latter is ð1� P1 � P3Þn, asshown above, and the probability to be derived is1� ð1� P1 � P3Þn. An O-statement, ‘‘Some S are not P” (S \ �P–£),is consistent if and only if its complement, ‘‘All S are P”
X4
Conclude X4 Conclude NVC
End
Y
YN
uY 1 uY
Min-heuris�c:
Max-heuris�c:
{X1, X2, X3, X4} =
{A, I, E, O} if Min = A{I, E, O, A} if Min = I{E, O, A, I} if Min = E{O, A, I, E} if Min = O
uY =
uA if Max = AuI if Max = IuE if Max = EuO if Max = O
are determined by the order of the tests, the result of each test (depending on theuO).

Model 1 Model 2EA3 E:O:N = 62:17:19 (%)
M. Hattori / Cognition 157 (2016) 296–320 305
(S \ �P ¼ £), is inconsistent. Therefore, the probability to be derivedis 1� ð1� P2 � P4Þn.
ss = m
ps = ms = p
p
Model 1ss = m
mp
Model 2
s = mm
s = p
EI3
E, O I, O
E, O I, O
E:O:N = 24:37:34 (%)
Fig. 9. Mental model representations for syllogisms EA3 (upper) and EI3 (lower).I, E, or O followed by an entailment symbol (�) indicate a conclusion consistent withthe model, and percentages indicate the mean choice rate in data used in Meta-Analysis 2.
3. Mental representation and probability in other theories
In this section, I review how mental representation and proba-bility, which are the two main issues of this paper, have been dealtwith in previous theories of syllogistic reasoning. I discuss the mer-its and problems of some leading theories that involve at least oneof these ideas as their central concept.
3.1. Mental models
Themental model theory (Johnson-Laird, 1983; Johnson-Laird &Bara, 1984; Johnson-Laird & Byrne, 1991; Johnson-Laird &Steedman, 1978) is one of the earliest comprehensive psychologi-cal theories of syllogistic reasoning. This theory explains humanperformance in syllogistic reasoning based on mental representa-tions. The mental model’s ‘‘crucial characteristics as far as infer-ence is concerned are that a mental model is finite, computable,and contains tokens in relations that represent entities in a specificstate of affairs” (Johnson-Laird & Bara, 1984, p. 4). Although thischaracteristic is basically inherited, the current model is uniquein that it includes probabilistic information.5 For the mental modeltheory, the number of elements in a mental model is not important,as mental models ‘‘represent a set of entities by introducing an arbi-trary number of elements that denote exemplary members of theset” (Johnson-Laird, 1980, p. 98; italics mine).
As Johnson-Laird and Bara (1984) claim, the mental model the-ory appears to predict the difficulty of syllogistic reasoning as afunction of the number of mental models that must be constructedto derive a logically valid conclusion. For example, EA3 has twopremises, E (‘‘No P are M”) and A (‘‘All M are S”), and a validO-conclusion (‘‘Some S are not P”). EA3 is compatible with thetwomental models shown in the upper part of Fig. 9, which followsthe notation used by Johnson-Laird and Bara (1984).6 With Model 1in the upper part of Fig. 9, E- and O-conclusions are compatible; withModel 2, I- and O-conclusions are compatible. However, as E- and I-conclusions are inconsistent with each other, the only statementconsistent with both models is the I-conclusion, which becomesthe final output (i.e., the correct answer). People who think of Model1 but fail to construct Model 2 will derive an E-conclusion. Aspredicted, half of the participants derived an E-conclusion in Exper-iment 1 conducted by Johnson-Laird and Bara (1984) (and no-onecorrectly derived an O-conclusion). A task that requires more modelsto be constructed to reach a correct answer increases the probabilityof mistakes in the inference process, and would thus be likely toresult in failure.
Although the mental model theory is one of the most influentialtheories at the algorithmic/representational level in Marr’s (1982)sense, its explanatory insufficiency is its most critical problem (see,also, Bonatti, 1994; Ford, 1994; Garnham, 1993; Newstead, 1993;Stenning & Oberlander, 1993; Wetherrick, 1993). When we assessthe descriptive validity of a model such as the mental model the-ory, which assumes two steps, we need to know at least two piecesof information for each step: (1) the conditions or procedures to
5 Whereas the mental model theory has been extended in various ways, and thereis a version that contains probabilistic information (Johnson-Laird et al., 1999Khemlani, Lotstein, & Johnson-Laird, 2015), none of the basic models represeninformation on probability or frequency, but instead represent purely logicarelationships, as in the case of the transitive-chain theory (see Section 3.2).
6 The original notation includes tokens like ‘‘0s,” but here I have simplified theexpression. Johnson-Laird and his colleagues treated EA3 as a three-model task, buthe third model is not necessary unless we liberate the positions of S and P in theconclusion. Therefore, only two models are shown here.
7 Johnson-Laird and Bara (1984) actually classified EI3 as a three-model syllogismas they did EA3. See footnote 4.
;tl
t
construct mental models like Models 1 and 2 (Fig. 9) and (2) theprocedures used to derive conclusions from the constructed mod-els. The mental model theory (Johnson-Laird & Bara, 1984, pp. 35–36), as for the probability heuristics model, assumes that one triesto derive conclusions in decreasing order of informativeness(A > I > E > O), and this assumption satisfactorily specifies proce-dure (2) above. The mental model theory, however, is not specificenough with (1). What if one constructs Model 2 first? One wouldthen derive an I-conclusion, which is actually a very rare response.The mental model theory does not describe why one particularmodel is constructed earlier than others when multiple modelsare available. Although Johnson-Laird and Bara (1984) articulatedprocedures for constructing alternative models (pp. 36–40) andthe number of models needed to derive logically correct conclu-sions (pp. 52–59), they did not document which model would besought in what order, and what triggers the next search. Eventhough, as claimed in their papers, the model is implemented ina computer program, the problem is that the principles of priorityin the model construction have never been fully articulated,including in the latest mental model paper on syllogisms(Khemlani & Johnson-Laird, 2012).
The problem comes into focus when we compare one syllogismwith another, similar one. EI3 is a two-model syllogism,7 as shownin the lower panel of Fig. 9. As in the case of EA3, E and O are com-patible with Model 1, and I and O are compatible with Model 2. Thedata (e.g., those used in Meta-Analysis 2), however, indicate a greatdifference between these two types of syllogism. In EA3, the choicerates for E, O, and N were 62%, 17%, and 19%, respectively, but were24%, 37%, and 34% in EI3. The mental model theory cannot explainthis difference. Many similar instances of discordance can be foundamong the data for pairs of syllogisms. For example, IA1 and EE2are two-model syllogisms, neither of which have a valid conclusion(N), but their correct conclusion rates differed greatly (17% vs. 77%).
Indeed, the mental model theory does not even precisely pre-dict the difficulty of syllogisms. According to the mental modeltheory, the difficulty of syllogisms is determined mainly by thenumber of models and the figure, as mentioned above. However,my analysis of the same data indicates that the negative correla-tion between these variables is not particularly strong(r = �0.61), and the proportion of correct conclusions for one-,two-, and three-model syllogisms was 18–90%, 17–77%, and11–50%, respectively. The worst one-model syllogism (AA3: 18%)
,
306 M. Hattori / Cognition 157 (2016) 296–320
was much worse than the best three-model one (EI1: 50%). It isobvious that factors other than the number of models affect thedifficulty of syllogisms. Even considering the figural effect, whichis another important predictor according to Johnson-Laird andBara (1984), the result does not alter greatly. In the case of thethird figure, for example, the correct conclusion rates for one-,two-, and three-model syllogisms ranged from 21% to 86%, 25%to 77%, and 16% to 36%, respectively.
3.2. Probabilistic approaches
When Chapman and Chapman (1959) first introduced the ideaof probability, along with the idea of accepting the converse, intothe psychology of syllogistic reasoning, they assumed that peopledo not think ‘‘all but strict deductive reasoning is disallowed” (p.224), but instead tend to apply strategies that derive a probableconclusion. After 40 years, this idea was refined and realized asseveral heuristics by Chater and Oaksford (1999). The probabilityheuristics model includes three heuristics (G1–3) for generatingconclusions from given premises and two heuristics (T1–2) fortesting the conclusions generated. Among these, the most impor-tant are the min-heuristic (G1) and the max-heuristic (T1). Themin-heuristic determines a candidate conclusion. The less infor-mative form of the two premises is chosen as the form of a candi-date conclusion. For example, in the case of EA3, Chater andOaksford’s analysis indicates that an E-conclusion will be chosenunder the rarity assumption, as the ordering of informativenessis A > I > E > O. The max-heuristic determines the degree of confi-dence in the conclusion (i.e., the selection rate of the conclusionas an answer). The most informative premise makes the conclusionconfident (raises its probability of being selected) to the extent ofits informativeness.
Chater and Oaksford (1999) demonstrated that the heuristicsthey specified could be used as an effectual strategy to derive anappropriate (i.e., p-valid, in their terms) conclusion. If a strategyis useful in determining the correct answer, it can be a good heuris-tic. Moreover, if it is simple and easy to use, it is a highly efficientheuristic. This is a sufficient condition for a model. Their ingeniousanalysis based on probability theory showed that the heuristicsthey proposed were justified from an ecological point of view. Theyalso showed, in parallel, that their model provided a good fit to theavailable data. In other words, the probability heuristics model alsosatisfied a necessary condition. It is also true, however, that theprobability heuristics model is not fully satisfactory as a psycho-logical theory: it has little to say about howmental representationswork in the process of syllogistic reasoning. It fits the data in handwell, but does not account for the behavior in terms of mecha-nisms, i.e., the model ‘‘does require semantic representations thatcapture people’s understanding of syllogistic premises” (Chater &Oaksford, 1999, p. 236).
With regard to the topic of symmetry inference, both the prob-ability heuristic model and the mental model theory sometimesfail to explain the phenomenon known as conversion. In bothAA1 and AA3, for example, the min-heuristic enforces an A-conclusion, and the max-heuristic enhances the confidence of theconclusion in exactly the same way. Neither does the mentalmodel theory distinguish between these types: both AA1 andAA3 are predicted to provide high proportions of correct answers,because both are one-model syllogisms (Johnson-Laird & Bara,1984).8 In this regard, the probability heuristics model and the men-tal model theory are both unsatisfactory.
8 AA3 was later reclassified as a two-model syllogism, and then much later as athree-model syllogism, without any reason. This was pointed out and criticized bysome researchers (e.g., Ford, 1994; Wetherrick, 1993).
The transitive-chain theory (Guyote & Sternberg, 1981), whichfollowed from Erickson’s (1974, 1978) set analysis theory, is theone of the earliest frameworks that can quantitatively predictresponse patterns. It preceded the probability heuristics modelby about two decades, but was ignored by Chater and Oaksford(1999). The transitive-chain approach is equipped with both men-tal representations and probability. I should point out, however,that the representation on which these theories are based is purelylogical, as is the case for the mental models theory. Continuousparameters, or probabilities, were not introduced into the repre-sentations themselves, but into the procedure for handling (i.e.,constructing or combining) logical representations. Therefore, forexample, these models scarcely consider whether people’s repre-sentations have a balanced structure (Fig. 1). As a result, thetransitive-chain model finds it difficult to directly handle represen-tational changes caused by semantic factors, including the contenteffect, as does the probability heuristics model.
3.3. Summary
Mental models theory could be a promising account of internalmental representations used in syllogistic reasoning, but it suffersfrom a lack of specification, even in its latest form, leaving us desir-ing more detailed documentation and justification of the model’sbehavior. The probability heuristics model shows how effectiveprobabilistic approaches are, even for logical tasks, but is not yetfully satisfactory, given that the nature of the heuristics is notexplained in relation to mental representations. Although othertheories such as set analysis theory and transitive-chain theoryincorporate probability into their models, no theory has, untilnow, introduced the idea of probabilistic representations into syl-logistic reasoning.
Although there have been several attempts to compare existingtheories of syllogistic reasoning, including the mental model the-ory and the probability heuristic model, the method of evaluationvaries considerably, and the results diverge: some studies foundthe probability heuristics model to be superior (Chater &Oaksford, 1999; Copeland, 2006), whereas others did not(Copeland & Radvansky, 2004; Khemlani & Johnson-Laird, 2012).Therefore, we need a comprehensive comparison of these modelstogether with the probabilistic representation model.
4. Evaluation of the proposed model
The descriptive validity of the proposed model in predictingresponse patterns was assessed using actual experimental data.For the purpose of constructing a comprehensive theory, it is insuf-ficient, albeit important, to examine whether or not a particularmodel predicts a particular type of syllogism, as I have done inthe previous section. It is more important to evaluate the overalldescriptive validity of models using an identical reasonable stan-dard as inclusively as possible. Hence, I now evaluate the proba-bilistic representation model, in comparison with other signalmodels, in terms of how well it explains existing data as a wholefrom both quantitative and qualitative perspectives.9
Below, in Meta-Analysis 1, I compare the current model withother existing models that can predict the proportions of each con-clusion type (i.e., A, I, E, and O) for each of 64 syllogisms. At pre-sent, only the probability heuristics model and transitive-chaintheory provide such predictions. In this analysis, for fair compar-ison, I use the same data that the proponents of each model usedto evaluate their own models. In Meta-Analysis 2, I conduct a more
9 See Hattori (2016) for data used in Meta-Analyses 1, 2, and 3; and Experiments 1and 2.

Table 3Probabilities of constructing mental models as parameters of the p-mental model.
SyllogismSuccessful (up to)
Unsuccessful1st 2nd 3rd
One-model P1M1 � � 1� P1M1
Two-model P2M1 P2M2 � 1� ðP2M1 þ P2M2ÞThree-model P3M1 P3M2 P3M3 1� ðP3M1 þ P3M2 þ P3M2Þ
M. Hattori / Cognition 157 (2016) 296–320 307
inclusive comparison using data from the literature: using thesame set of extended datasets, all models were evaluated accord-ing to an identical standard. To make this comparison possible,the mental model theory is extended in line with the original ideato allow it to make quantitative predictions. After these compar-isons, I examine how the model explains known qualitative phe-nomena in syllogistic reasoning, including immediate inference,Gricean interpretation, conversion, and figural effects. Thus, Ireveal how the theory links syllogistic reasoning to other cognitiveprocesses.
4.1. Meta-Analysis 1
The purpose of this analysis is to examine how well the currentmodel performs on the same datasets used by previous models.The probabilistic representation model was compared with theprobability heuristics model and the transitive-chain model. Forthe current model, predictions were derived by estimating theparameters that gave the best fit to the given data. These estimateswere optimized by a quasi-Newton method using the ‘‘optim”function on R version 3.1.0 with ‘‘L-BFGS-B” options (Byrd, Lu,Nocedal, & Zhu, 1995). In this analysis, the goodness-of-fit wasbasically evaluated by Akaike’s Information Criterion (AIC). A smal-ler score represents a better fit to the data. The AIC score wasderived from the sum of the squared deviations of all (i.e., usually64) syllogisms regarding a mean square deviation (MSD) of thechoice rate for all five options (i.e., A, I, E, O, and N) as a respectivesquare deviation of each syllogism. The root mean square deviation(RMSD) and Pearson’s correlation coefficient (r) were also derivedas indices of goodness-of-fit, as these are useful when two modelshave the same number of parameters. First, the predicted choicerate of each answer (including N, i.e., ‘‘No valid conclusion”) foreach syllogism was derived from a model. Next, MSD, RMSD, andr were calculated for each syllogism from the choice rate distribu-tion.10 Finally, the weighted average of the 64 (or fewer, dependingon the experimental material) measure of each index was calculated.The weighting considered the number of participants (via Fishertransformation in the case of r).
4.1.1. Probability heuristics modelChater and Oaksford (1999) evaluated their model using five
experiments (a total of N = 10111). The current model was fittedto the same dataset, and the results were compared with their pre-dictions (Chater & Oaksford, 1999, pp. 247–248). The fit of the cur-rent model and the probability heuristics model was equally good,with almost no differences: AIC = 17.7 vs. 17.9, RMSD = 0.829 vs.0.824, respectively; and the correlation coefficient was almost thesame: rs = 0.973 for both. Parameter values for the current modelwere as follows (those for the probability heuristics model are
10 The evaluation of the goodness-of-fit may be different from that in the meta-analysis of Chater and Oaksford (1999), who did not provide details of their methodThe original probability heuristics model study does not provide proportions of N, andso these have been calculated by subtracting the proportions of A, I, E, and O from100%.11 The virtual number of participants in Dickstein’s (1978) Experiment 2 was treatedas N = 19 here (actual N = 76), because each participant considered only one of fourfigures (a total of 16 out of 64 syllogisms) in this experiment.
12 Confusingly, the notation of syllogistic reasoning differs considerably betweenpapers following the traditional approach, including in the current article and papersby Johnson-Laird and his colleagues. For example, ‘‘conclusion I0 from syllogism AI1”corresponds to ‘‘conclusion Iac from syllogism AI2” in Table 7 of Khemlani andJohnson-Laird (2012).
.
shown in the above paper): x = 0.464, c = 0.895, uA = 0.824, uI = 0.492,uE = 0.280, uO = 0.285.
4.1.2. Transitive-chain modelIn the same way, the data from Experiment 1 (N = 49) of Guyote
and Sternberg (1981) were used to compare the probabilistic rep-resentation model and the transitive-chain model. The formermodel predicts data with only five parameters (omitting one), asthese data include only 45 out of 64 syllogisms, whereas the lattermodel has seven. The results show the superiority of the currentmodel, considering the number of parameters: AIC = 13.8 vs. 16.6(with parameter values x = 0.499, c = 0.837, uA = 0.872, uI = 0.720,uE = 0.131), while the actual fit of the transitive-chain model wasslightly better: RMSD = 0.077 vs. 0.046; r = 0.979 vs. 0.994,respectively.
4.2. An extension of the mental model theory: a parameterized model
Given that the mental model theory is currently the most com-prehensive and representative theory of mental representations, itis important to compare its predictions with those made by thecurrent theory. Unfortunately, however, this theory does not pre-dict responses to syllogisms as a distribution of conclusion types,even in its latest form accounting for probabilistic reasoning (i.e.,Khemlani et al., 2015), and it is thus impossible to compare thetwo models directly. Therefore, I constructed a parameterizedmodel based on the idea of the original theory (the ‘‘p-mental mod-el” for short).
In the mental model theory, the core machinery that generatesvariations in response patterns is the search for alternative models.Because each mental model searched is causative of particularresponse types, it is comparatively easy to construct a generativemodel for response variations. Several parameters that define theprobabilities of the constructed models are listed in Table 3. Forinstance, in a two-model syllogism, the probability that peopleconstruct only one model (and fail to provide the correct answer)is P2M1, and the probability that people construct the appropriatetwo models (and respond successfully) is P2M2; the probability ofother errors in the process of model construction is 1 �(P2M1 + P2M2).
I now illustrate how the p-mental model behaves using anexample. In the case of AA2, which is defined as a two-model syl-logism, the first mental model derives A, A0, I, and I0, according tothe mental model theory (Johnson-Laird & Bara, 1984; Khemlani& Johnson-Laird, 2012).12 Here, the prime symbol (e.g., A0) indicatesthe order in which end terms in the conclusion are converted (e.g.,‘‘All P are S”) from the Aristotelian traditional order (e.g., ‘‘All S areP”). See Appendix A and Table A.1 for details on this topic.
If a participant only constructs the first mental model, but failsto search the second model, the model predicts that an A- orA0-statement will be output. I assume here that the p-mental

Table 4Results of Meta-Analysis 2 for data from eight experiments and of experiments 1 and 2.
ID Study Experiment NPRM PHM pMM
RMSD r AIC RMSD r AIC RMSD r AIC
D78-1 Dickstein (1978) Expt 1 22 0.090 0.970 17.93 0.095 0.980 19.47 0.125 0.980 22.53
D78-2 Dickstein (1978) Expt 2 19 0.093 0.961 18.18 0.090 0.968 18.40 0.121 0.926 21.51
JS78-2.1 Johnson-Laird and Steedman (1978) Expt 2, 1st 20 0.103 0.978 19.97 0.106 0.971 20.72 0.119 0.968 21.25
JS78-2.2 Johnson-Laird and Steedman (1978) Expt 2, 2nd 20 0.116 0.981 23.24 0.119 0.980 24.63 0.126 0.987 23.72
GS81-1 Guyote and Sternberg (1981) Expt 1 49 0.077 0.979 13.78 0.122 0.952 18.69 0.116 0.969 19.44
JB84-3 Johnson-Laird and Bara (1984) Expt 3 20 0.143 0.945 24.71 0.130 0.934 22.60 0.143 0.944 23.66
BBJ95 Bara, Bucciarelli, and Johnson-Laird (1995) Adults 20 0.153 0.914 25.39 0.134 0.938 22.83 0.134 0.961 22.85
RNG01 Roberts et al. (2001) – 56 0.106 0.952 20.02 0.084 0.971 17.66 0.106 0.930 19.35
Weighted average – 226 0.105 0.965 19.48 0.107 0.965 20.33 0.122 0.960 21.43
Exp-1 Experiment 1 88 0.090 0.959 8.08 0.133 0.942 8.17 0.102 0.976 14.15
Exp-2 Experiment 2 50 0.113 0.931 10.37 0.122 0.923 10.42 0.105 0.978 14.35
Note: PRM, PHM, and pMM indicate the probabilistic representation model, the probability heuristic model, and the new parameterized model based on mental model theory,respectively (see text). The underlined numbers indicate the best fit models. RMSD: root mean square deviation, r: Pearson’s correlation coefficient.
3 The effect of this modification on the target datasets is actually quite small, ande conclusions are not altered if they were treated as missing values: the averageifference in the percentage of all response rates in terms of RMSD was 2.3, 1.4, 3.8,.2, and 2.1 for BBJ95, JB84-3, JS78-2.1, JS78-2.2, and RNG01 in Table 4, respectively.
308 M. Hattori / Cognition 157 (2016) 296–320
model dismisses an I-type answer because, logically speaking, anyA-statement implies the corresponding I-statement, and the for-mer is always more informative than the latter. This is consistentwith a common observation that very few people actually givean I-type answer when an A is available. In the same way, as thesame relation exists between A0 and I0, E and O, and E0 and O0, Imake the same supposition with regard to I0, O, and O0.
Otherwise, if a participant successfully constructs the secondmental model, the p-mental model predicts that an N (‘‘No validconclusion”) will be output, because the second model is consis-tent with E, E0, O, and O0, and it refutes A and A0, one of whichhas been derived at the previous stage of the first mental model.Therefore, A or A0 is derived with probability P2M1, and N is derivedwith probability P2M2. Other errors occur with probabilityPE ¼ 1� P2M1 � P2M2. For simplicity, the frequencies of other errorsare assumed to be distributed uniformly across all incorrectresponses. Consequently, when the options are A, I, E, O, and N,the predicted selection rates are P2M1, PE=3, PE=3, PE=3, and P2M2,respectively.
The number of mental models and the conclusions derived byeach are listed in Table 1. The former is based on Johnson-Lairdand Bara (1984, Table 9–12), although there have been some crit-icisms on this topic (e.g., Ford, 1994; Wetherrick, 1993); the latteris based on Khemlani and Johnson-Laird (2012, Table 7).
4.3. Meta-Analysis 2
It may be considered unsatisfactory that Meta-Analysis 1 didnot compare models simultaneously using the same datasets andthe same single standard. Here, I compare three models under suchconditions: the mental model theory as the most representativemodel based on internal representations, the probability heuristicsmodel as the most influential probabilistic model, and the proba-bilistic representation theory as a promising integrated approach.
4.3.1. MethodThe basic method of evaluation was the same as for Meta-
Analysis 1, except for the following two points: all models werecompared on the same extended datasets, and all models adoptedthe parameter estimation method described in Section 4.1. Toobtain experimental data on syllogisms that provide the propor-tion of each response as a syllogistic conclusion (i.e., A, I, E, O, orN), I excluded data from experiments that used non-adult partici-pants, that examined too few syllogism variations (less than half ofthe 64), and that did not have people derive a conclusion but
instead had them examine the validity of each type of conclusionin a yes/no format (e.g., Rips, 1994). As a result, the set of eightexperiments (with a total of N = 226) shown in Table 4 were cho-sen as the target of this analysis. This set is more inclusive thanthe data targeted in previous studies, including Chater andOaksford (1999) and Khemlani and Johnson-Laird (2012).
Before the analysis, some datasets were slightly modified toadapt to the assumption of the models that the sum of allresponses is 100%. In some experiments (JS78-2.1, JS78-2.2, JB84-3, BBJ95, and RNG01 in Table 4), in which participants did notmake a choice from the given options but generated their own con-clusion, the authors did not report the proportion of a few minor,unexpected responses. In such cases, data were complementedwith N answers, as it is reasonable to assume that if a set of optionswere given to them, such participants would not have found anyappropriate answer other than N.13 Although participants in a gen-eration task are not constrained by the order of terms in the conclu-sion (i.e., they can generate either an S–P or P–S conclusion), thedifference was ignored in this analysis (following some predecessors,e.g., Chater & Oaksford, 1999) because some preliminary analysesindicated that the distinction has little effect on the results.
4.3.2. Results and discussionFirst, to intuitively understand the goodness-of-fit of the cur-
rent model, I drew graphs indicating the relation between theactual data and model predictions for each syllogism. The resultsare shown in Fig. 10. These data are the integrated set from theeight experiments taken from the literature. Although it is not idealto simply total up all data, I thought this would be useful to graspthe overall fitness of the model, which is revealed to be quite good.Considering the difference in some aspects of the experimentalmethod among studies including the population of participants,each model should be fitted to data from an individual experimentfirst, and then the results should be integrated by model to enablecomparison. All other results described below are from suchanalyses.
Table 4 summarizes the results. The weighted average of AIC inTable 4 indicates that the probabilistic representation model pro-duced the best performance (19.48), followed (albeit at a narrowmargin) by the probability heuristics model (20.33) and the
1
thd1

Table 5Model parameters estimated for data from eight experiments in the literature and two new experiments (Meta-Analysis 2 and experiments 1 and 2).
IDPRM PHM pMM
x c uA uI uE uO PA PI PE PO Pent Perr P1M1 P2M1 P2M2 P3M1 P3M2 P3M3
D78-1 0.478 0.905 0.897 0.525 0.189 0.210 0.806 0.398 0.178 0.152 0.050 0.006 0.930 0.392 0.578 0.298 0.295 0.401D78-2 0.430 0.916 0.883 0.524 0.298 0.326 0.715 0.358 0.198 0.214 0.110 0.023 0.900 0.352 0.495 0.366 0.323 0.281JS78-2.1 0.474 0.901 0.750 0.402 0.216 0.107 0.700 0.314 0.192 0.084 0.029 0.003 0.875 0.292 0.679 0.334 0.359 0.296JS78-2.2 0.472 0.780 0.778 0.220 0.223 0.001 0.731 0.169 0.217 0.001 0.018 0.002 0.881 0.194 0.786 0.280 0.272 0.448GS81-1 0.499 0.837 0.872 0.721 0.131 – 0.723 0.378 0.119 0.200 0.086 0.012 0.887 0.621 0.313 0.250 0.312 0.398JB84-3 0.477 0.999 0.701 0.423 0.180 0.308 0.664 0.382 0.156 0.290 0.059 0.006 0.825 0.376 0.523 0.550 0.398 0.053BBJ95 0.467 0.987 0.811 0.509 0.235 0.391 0.715 0.429 0.186 0.409 0.077 0.018 0.883 0.419 0.500 0.536 0.296 0.101RNG01 0.465 0.979 0.841 0.643 0.408 0.601 0.733 0.519 0.307 0.485 0.083 0.026 0.831 0.494 0.329 0.565 0.237 0.163
All 0.473 0.914 0.828 0.548 0.248 0.342 0.726 0.394 0.202 0.266 0.070 0.014 0.873 0.391 0.514 0.419 0.302 0.253
Exp-1 0.499 0.805 0.832 – – – 0.673 – – – 0.114 0.019 0.832 0.560 0.274 0.386 0.324 0.176Exp-2 0.485 0.779 0.788 0.542 – – 0.560 0.377 – – 0.183 0.021 0.560 0.377 0.200 0.200 0.183 0.021
Note: The top row indicates models and the ID indicates studies (see note to Table 4).
d: 0.064r: 0.983
d: 0.104r: 0.896
AA3 d: 0.007r: 1.000
AA4 d: 0.175r: 0.781
AI1 d: 0.147r: 0.960
AI2 d: 0.080r: 0.945
AI3 d: 0.119r: 0.976
AI4 d: 0.086r: 0.974
AE1 d: 0.041r: 0.987
AE2 d: 0.029r: 0.996
AE3 d: 0.052r: 0.989
AE4 d: 0.048r: 0.991
AO1 d: 0.055r: 0.984
AO2 d: 0.036r: 0.996
AO3 d: 0.034r: 0.992
AO4 d: 0.016r: 0.999
IA1 d: 0.106r: 0.978
IA2 d: 0.066r: 0.970
IA3 d: 0.121r: 0.971
IA4 d: 0.146r: 0.968
II1 d: 0.028r: 0.990
II2 d: 0.050r: 0.971
II3 d: 0.109r: 0.839
II4 d: 0.038r: 0.981
IE1 d: 0.107r: 0.804
IE2 d: 0.098r: 0.830
IE3 d: 0.061r: 0.940
IE4 d: 0.076r: 0.904
IO1 d: 0.110r: 0.867
IO2 d: 0.105r: 0.879
IO3 d: 0.106r: 0.891
IO4 d: 0.033r: 0.989
EA1 d: 0.037r: 0.993
EA2 d: 0.047r: 0.989
EA3 d: 0.044r: 0.994
EA4 d: 0.013r: 0.999
EI1 d: 0.059r: 0.943
EI2 d: 0.068r: 0.923
EI3 d: 0.066r: 0.930
EI4 d: 0.151r: 0.605
EE1 d: 0.202r: 0.681
EE2 d: 0.101r: 0.947
EE3 d: 0.103r: 0.945
EE4 d: 0.179r: 0.754
EO1 d: 0.096r: 0.976
EO2 d: 0.111r: 0.928
EO3 d: 0.059r: 0.978
EO4 d: 0.114r: 0.954
OA1 d: 0.022r: 0.997
OA2 d: 0.083r: 0.954
OA3 d: 0.038r: 0.994
OA4 d: 0.139r: 0.886
OI1 d: 0.028r: 0.996
OI2 d: 0.106r: 0.881
OI3 d: 0.099r: 0.892
OI4 d: 0.143r: 0.760
OE1 d: 0.128r: 0.885
OE2 d: 0.114r: 0.915
OE3 d: 0.071r: 0.969
OE4 d: 0.124r: 0.956
OO1 d: 0.039r: 0.995
OO2 d: 0.075r: 0.953
OO3 d: 0.083r: 0.956
OO4 d: 0.042r: 0.987
A I E O N0
1
AA1 AA2
Fig. 10. Fit of the model to integrated data from eight experiments in the literature. Bars indicate data and lines indicate model predictions. Dark gray bars indicate validconclusions. Numerical values in each figure indicate RMSD (d) and Pearson’s correlation coefficient (r).
M. Hattori / Cognition 157 (2016) 296–320 309
p-mental model (21.43). As all of the models compared hereactually have the same number of parameters (i.e., six), the RMSDand r values can also be compared with one another. These alterna-tive criteria converge to the same conclusion. Considered together,the fact that the probabilistic representation model scored best infive out of eight experiments in terms of AIC and was superior interms of the other indices implies that it is the best overall model.
The parameter estimation results presented in Table 5 are alsosupportive of the proposed model. One of the merits of this modelis that, unlike the other models, the meaning of parameters is clearin terms of cognitive processes. First, the coverage parameter creflects how strongly people maintain the balancing principle inthe task. The weighted average estimation was c = 0.914. Thismeans that when people process A-type statements, it is highlyprobable that they implicitly assume that its conversion is alsotrue. More precisely, a statement ‘‘All X are Y” leads to the assump-
tion that ‘‘More than 90% of Y are X.” This result is totally consistentwith the set-size balancing hypothesis (Hattori & Nishida, 2009;Hattori & Oaksford, 2007).
Second, parameters uA, uI, uE, and uO reflect the max-heuristic.According to the analyses of Chater and Oaksford (1999), themax-heuristic predicts that the confidence in a conclusion shouldbe in accord with the expected informativeness of the syllogismswith the different max premise types: EI(A) = 1.99, EI(I) = 0.76, EI(E) = 0.00, and EI(O) = 0.05, resulting in the order A > I > O > E.Again, most of the parameter estimation results in Table 5 agreewith this prediction: uA > uI > uO > uE.
4.4. Immediate inference and Gricean interpretation
Although we have seen that the probabilistic representationmodel outperformed other signature models in quantitative evalu-
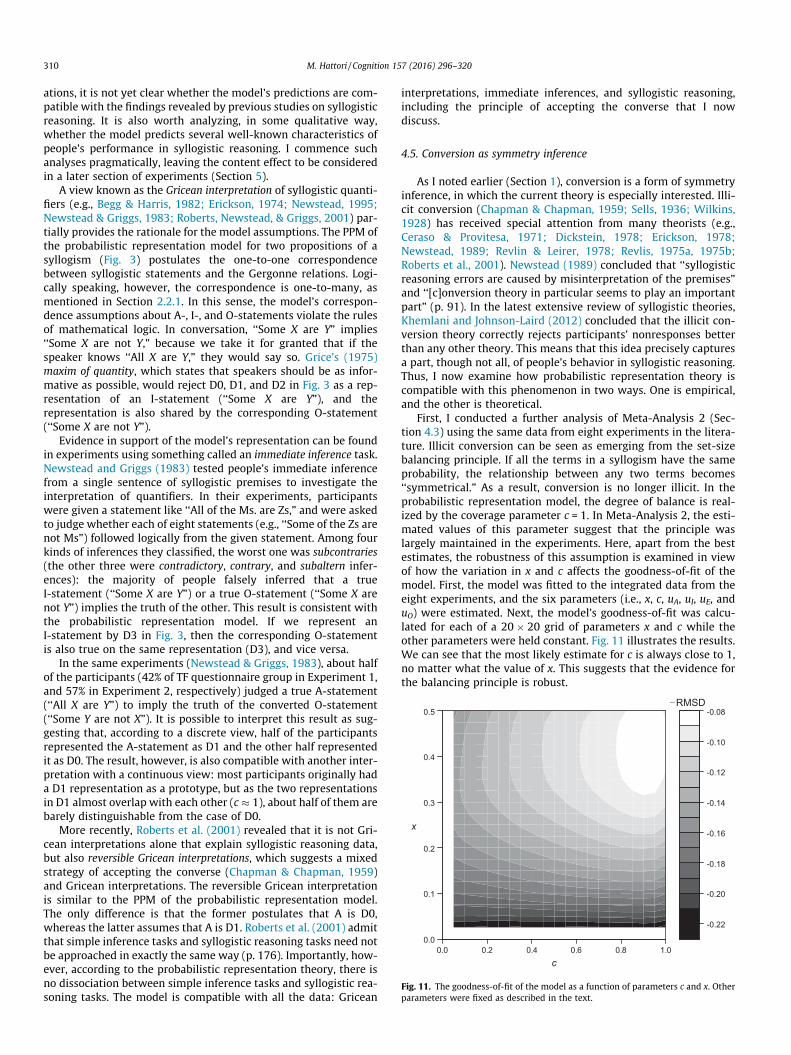
-0.22
-0.20
-0.18
-0.16
-0.14
-0.12
-0.10
-0.08
0.0 0.2 0.4 0.6 0.8 1.00.0
0.1
0.2
0.3
0.4
0.5
x
c
−RMSD
Fig. 11. The goodness-of-fit of the model as a function of parameters c and x. Otherparameters were fixed as described in the text.
310 M. Hattori / Cognition 157 (2016) 296–320
ations, it is not yet clear whether the model’s predictions are com-patible with the findings revealed by previous studies on syllogisticreasoning. It is also worth analyzing, in some qualitative way,whether the model predicts several well-known characteristics ofpeople’s performance in syllogistic reasoning. I commence suchanalyses pragmatically, leaving the content effect to be consideredin a later section of experiments (Section 5).
A view known as the Gricean interpretation of syllogistic quanti-fiers (e.g., Begg & Harris, 1982; Erickson, 1974; Newstead, 1995;Newstead & Griggs, 1983; Roberts, Newstead, & Griggs, 2001) par-tially provides the rationale for the model assumptions. The PPM ofthe probabilistic representation model for two propositions of asyllogism (Fig. 3) postulates the one-to-one correspondencebetween syllogistic statements and the Gergonne relations. Logi-cally speaking, however, the correspondence is one-to-many, asmentioned in Section 2.2.1. In this sense, the model’s correspon-dence assumptions about A-, I-, and O-statements violate the rulesof mathematical logic. In conversation, ‘‘Some X are Y” implies‘‘Some X are not Y,” because we take it for granted that if thespeaker knows ‘‘All X are Y,” they would say so. Grice’s (1975)maxim of quantity, which states that speakers should be as infor-mative as possible, would reject D0, D1, and D2 in Fig. 3 as a rep-resentation of an I-statement (‘‘Some X are Y”), and therepresentation is also shared by the corresponding O-statement(‘‘Some X are not Y”).
Evidence in support of the model’s representation can be foundin experiments using something called an immediate inference task.Newstead and Griggs (1983) tested people’s immediate inferencefrom a single sentence of syllogistic premises to investigate theinterpretation of quantifiers. In their experiments, participantswere given a statement like ‘‘All of the Ms. are Zs,” and were askedto judge whether each of eight statements (e.g., ‘‘Some of the Zs arenot Ms”) followed logically from the given statement. Among fourkinds of inferences they classified, the worst one was subcontraries(the other three were contradictory, contrary, and subaltern infer-ences): the majority of people falsely inferred that a trueI-statement (‘‘Some X are Y”) or a true O-statement (‘‘Some X arenot Y”) implies the truth of the other. This result is consistent withthe probabilistic representation model. If we represent anI-statement by D3 in Fig. 3, then the corresponding O-statementis also true on the same representation (D3), and vice versa.
In the same experiments (Newstead & Griggs, 1983), about halfof the participants (42% of TF questionnaire group in Experiment 1,and 57% in Experiment 2, respectively) judged a true A-statement(‘‘All X are Y”) to imply the truth of the converted O-statement(‘‘Some Y are not X”). It is possible to interpret this result as sug-gesting that, according to a discrete view, half of the participantsrepresented the A-statement as D1 and the other half representedit as D0. The result, however, is also compatible with another inter-pretation with a continuous view: most participants originally hada D1 representation as a prototype, but as the two representationsin D1 almost overlap with each other (c � 1), about half of them arebarely distinguishable from the case of D0.
More recently, Roberts et al. (2001) revealed that it is not Gri-cean interpretations alone that explain syllogistic reasoning data,but also reversible Gricean interpretations, which suggests a mixedstrategy of accepting the converse (Chapman & Chapman, 1959)and Gricean interpretations. The reversible Gricean interpretationis similar to the PPM of the probabilistic representation model.The only difference is that the former postulates that A is D0,whereas the latter assumes that A is D1. Roberts et al. (2001) admitthat simple inference tasks and syllogistic reasoning tasks need notbe approached in exactly the same way (p. 176). Importantly, how-ever, according to the probabilistic representation theory, there isno dissociation between simple inference tasks and syllogistic rea-soning tasks. The model is compatible with all the data: Gricean
interpretations, immediate inferences, and syllogistic reasoning,including the principle of accepting the converse that I nowdiscuss.
4.5. Conversion as symmetry inference
As I noted earlier (Section 1), conversion is a form of symmetryinference, in which the current theory is especially interested. Illi-cit conversion (Chapman & Chapman, 1959; Sells, 1936; Wilkins,1928) has received special attention from many theorists (e.g.,Ceraso & Provitesa, 1971; Dickstein, 1978; Erickson, 1978;Newstead, 1989; Revlin & Leirer, 1978; Revlis, 1975a, 1975b;Roberts et al., 2001). Newstead (1989) concluded that ‘‘syllogisticreasoning errors are caused by misinterpretation of the premises”and ‘‘[c]onversion theory in particular seems to play an importantpart” (p. 91). In the latest extensive review of syllogistic theories,Khemlani and Johnson-Laird (2012) concluded that the illicit con-version theory correctly rejects participants’ nonresponses betterthan any other theory. This means that this idea precisely capturesa part, though not all, of people’s behavior in syllogistic reasoning.Thus, I now examine how probabilistic representation theory iscompatible with this phenomenon in two ways. One is empirical,and the other is theoretical.
First, I conducted a further analysis of Meta-Analysis 2 (Sec-tion 4.3) using the same data from eight experiments in the litera-ture. Illicit conversion can be seen as emerging from the set-sizebalancing principle. If all the terms in a syllogism have the sameprobability, the relationship between any two terms becomes‘‘symmetrical.” As a result, conversion is no longer illicit. In theprobabilistic representation model, the degree of balance is real-ized by the coverage parameter c = 1. In Meta-Analysis 2, the esti-mated values of this parameter suggest that the principle waslargely maintained in the experiments. Here, apart from the bestestimates, the robustness of this assumption is examined in viewof how the variation in x and c affects the goodness-of-fit of themodel. First, the model was fitted to the integrated data from theeight experiments, and the six parameters (i.e., x, c, uA, uI, uE, anduO) were estimated. Next, the model’s goodness-of-fit was calcu-lated for each of a 20 � 20 grid of parameters x and c while theother parameters were held constant. Fig. 11 illustrates the results.We can see that the most likely estimate for c is always close to 1,no matter what the value of x. This suggests that the evidence forthe balancing principle is robust.

M. Hattori / Cognition 157 (2016) 296–320 311
Second, I analyzed what parameters of the probabilistic repre-sentation model make it compatible with the conversion theory.According to Chapman and Chapman’s (1959) principles, if thereis at least one valid conclusion in the four syllogisms that havethe same mood but different figures, participants tend to deriveone of the valid conclusions. For the sake of simplicity, I assumedthat if multiple conclusions were available by conversion, the mostinformative one would be adopted as a conclusion (i.e., in the orderA > I > E > O), following the analyses of Chater and Oaksford (1999).For example, although the only logically correct answer of AA3 is I,conversion makes a more informative A conclusion available, andso A was assumed to be the answer predicted by conversion the-ory. Conversion theory predicts a particular answer for only 32 syl-logisms, including four figures of AA, AI, IA, AE, EA, AO, OA, and EI.Comparing the model’s predictions with those given by conversiontheory, the rate of concordance among 32 syllogisms was plottedas a function of x and c (see Fig. 12). The results indicate that theconversion phenomenon is frequently observed (>85%) whenc > 0.9 and x > 0.25 (approximately).
This result may not be of great surprise given that the two setsare identical when they maximally overlap under the constraint ofthe same set size. The important point is that this result enables usto make new predictions: when x and c are not in this area (i.e.,the balancing principle is violated), conversion will no longerbe observed. This will be examined in Section 5 (Experiments 1and 2).
Finally, note that conversion makes the difference in the syllo-gistic figure (Fig. 2) ambiguous. As a result, conversion theory doesnot account for the figural effect discussed below, and this is one ofthe disadvantages of this theory, contrasting with the probabilisticrepresentation theory.
4.6. Figural effect
Many theorists have mentioned that differences in the figure(see, Fig. 2) can affect the difficulty of syllogistic reasoning (e.g.,Dickstein, 1978; Erickson, 1974; Espino, Santamaria, & Garcia-Madruga, 2000; Frase, 1966; Johnson-Laird & Steedman, 1978;Stupple & Ball, 2007). Generally, figure 1 is easiest and figure 4 isthe most difficult. Frase (1966) reported this effect half a centuryago. His experiments, which used 44 syllogistic yes/no questions
0.4
0.5
0.6
0.7
0.8
0.0 0.2 0.4 0.6 0.8 1.00.0
0.1
0.2
0.3
0.4
0.5
x
c
Fig. 12. The rate of agreement in predictions of conclusions as people’s responsesbetween theories of the probabilistic representation and illicit conversion.
consisting of 11 syllogistic moods (IA/O, IA/E, AI/E, AO/I, IE/I, II/I,EA/I, AE/I, EE/I, OE/O, and EI/O) and four figures, found that partici-pants made the fewest errors on figure 1 syllogisms and the mosterrors on figure 4 syllogisms. Using 19 valid syllogisms (see Table1), Erickson (1974) obtained a similar experimental result.Dickstein (1978) expressed caution about confounding factorsincluding illicit conversion (Chapman & Chapman, 1959), andreached the same conclusion through careful analyses of screenedsyllogisms (i.e., EI and IE). A similar claim was made by Johnson-Laird and Steedman (1978), who ran experiments in which partici-pants generated a conclusion for each syllogism. They pointed outthat, when the two premises are B–A and C–B, participants preferto generate a C–A type conclusion (that constitutes a figure 1 syl-logism as a result, see Table A.1) to an A–C type conclusion (figure4). Likewise, people prefer an A–C conclusion from A–B and B–Cpremises (constituting a figure 10 syllogism in Table A.1, a logicalequivalent of figure 1) to a C–A conclusion (figure 40).
In evaluating how well a model predicts the figural effect, it isnot obvious what measure should be used, despite the agreementon the conclusion that figure 1 is generally easier than figure 4. Iexamined how the model predicts the figural effect in two cases:using 19 valid syllogisms, following Erickson (1974), and usingall 64 syllogisms. The difference in correct solution rate betweenfigures 1 and 4 was examined as the two model parameters, xand c, varied. In the case of 19 valid syllogisms, the differencewas always positive for any combination of parameters, indicatinga stable figural effect whereby a figure 1 syllogism is always easierthan a figure 4. The results from the complete set of 64 syllogismsare shown in Fig. 13. This figure shows that the figural effect isalmost always observed, except for some special cases where c isapproximately 0.5 and x is large. Given that c is almost always sup-posed to be high, as we have seen above, the model predictions aregenerally compatible with the existing data.
4.7. Working memory capacity
One of the distinctive features of the probabilistic representa-tion model compared with other process models, including themental models theory, is that it explicitly incorporates the assump-tion of working memory capacity. Working memory is consideredto be an important component of cognitive processes(e.g., Baddeley, 2007), especially regarding conscious processing
Δ
-0.06
-0.04
-0.02
0.00
0.02
0.04
0.06
0.0 0.2 0.4 0.6 0.8 1.00.0
0.1
0.2
0.3
0.4
0.5
x
c
Figural effectFigural effect
Figural effect
Fig. 13. The figural effect as the degree of superiority in average correct solutionrate of figure 1 against figure 4 syllogisms for all 64 syllogisms.

312 M. Hattori / Cognition 157 (2016) 296–320
including syllogistic reasoning, and working memory capacitymust have some implications for reasoning processes. Therefore,it is important to evaluate the consistency of the model assump-tions with the current findings on working memory.
Thus far, although I have hard-coded the sample size in SMM tobe seven, this is not an intrinsic restriction of the model. I con-ducted a series of model fittings in which the sample size variedfrom 4 to 12 using the same dataset as in the conversion case inSection 4.5. As shown in Fig. 14, a sample size of six provided thebest fit when evaluated based on RMSD, whereas it was sevenbased on Pearson’s r. This result suggests that people sample sixor seven instances in working memory to derive a conclusion toa syllogism. Because the size accords with Miller’s (1956) magicalnumber (i.e., seven plus or minus two), the result is supportive ofprobabilistic representation theory, which provides a model of syl-logistic reasoning performed by people with a certain limitation ofworking memory capacity.
This evidence, however, may be controversial. Halford, Cowan,and Andrews (2007) claimed that the limit of working memorycapacity, which is actually three to five chunks (wittily describedas the ‘‘magical mystery four” by Cowan, 2010), reflects our capac-ity for attention in reasoning and restricts the relational represen-tations that enable inferences to be made. Fig. 14 indicates that thefit of the model to the data greatly deteriorates when the numberof samples is four, a pattern that does not seem to agree withrecent findings on working memory capacity.
There are two ways to resolve this apparent dissociation. First,the capacity for processing can be dependent on the tasks to beperformed. There may be a critical difference in cognitive loadbetween recognizing a target as an instance of logical status (i.e.,one SMM instance) and the process of a working memory task, inwhich people memorize each target precisely. There is also con-vincing evidence that the number of seven samples remains mean-ingful as our processing capacity when making decisions betweenmany options (Iyengar & Lepper, 2000) or detecting a correlationbetween two events from covariation information (Kareev, 2000).
Second, the number of samples in SMM may not precisely cor-respond to the pure capacity of working memory. Cowan (2000, p.112) pointed out that, while ‘‘the number seven estimates a com-monly obtained, compound capacity limit,” there is a possibilitythat ‘‘this number reflects a certain reasonable degree of chunk-ing.” The same thing might be true for SMM samples, as shownbelow.
-0.1
-0.098
-0.096
-0.094
-0.092
-0.09
-0.088
-0.086
-0.084
-0.082
-0.08
-0.078
-0.076
0.95
0.96
0.97
3 4 5 6 7 8 9 10 11 12 13
-RM
SD
Pers
on's
Cor
rela
�on
Coeffi
cien
t
Number of Samples
Pearson
-RMSD
Fig. 14. The goodness-of-fit of the probabilistic representation model to data as afunction of working memory capacity. Working memory capacity is assumed to bethe number of samples in the SMM. Data for model fitting were taken from eightexperiments in the literature, as introduced in Meta-Analysis 2.
The SMM sample distributes over the PPM, which basically con-sists of eight subsets corresponding to each logical status gener-ated by the combination of three terms, S, M, and P. As thisdistribution is based on a random process, some samples can dropto the same PPM area; this actually happens in most cases. Forexample, in the case of AA1, the PPM of this syllogism does nothave areas 2, 3, 4, and 6 (see Table 2 for the correspondencebetween the area number and the logical status), and only P1, P5,P7, and P8 can have a non-zero probability. If we use the best esti-mates obtained by Meta-Analysis 2 (i.e., x = 0.473 and c = 0.914),P1 = 0.43, P5 = 0.04, P7 = 0.05, and P8 = 0.48. The seven samples arethus dispersed throughout the four PPM subsets of AA1, but inreality, only two or three areas are generally occupied, especiallywhen some probabilities are very small (i.e., P5 and P7 in this exam-ple). If we regard samples in the same area as being subject tochunking, seven samples do not in turn consume as much capacityas seven chunks. This was examined by the following simulation.
In the simulation, I examined the number of areas of a PPMoccupied by seven SMM samples, which is assumed to be thecapacity of working memory. The number of areas occupied byseven SMM samples was counted for each of 16 PPMs, with themodel’s parameters fixed to the best-fit estimates from Meta-Analysis 2. This sampling process was iterated 100,000 times,and the values were averaged by PPM. As a result, the total meanof the 16 PPMs (Fig. 6) was 3.10 (the minimum was 2.46 for AA2,AE13, and EA32, while the maximum was 4.84 for II). This analysisindicates that the model’s behavior is also consistent with the find-ings of recent working memory studies.
4.8. Summary
In the literature, there are a few psychological theories of syllo-gistic reasoning that provide detailed quantitative predictions ofpeople’s performance in terms of a distribution of the proportionof answers. When such available models are compared with theprobabilistic representation model in terms of their fit to the data,the latter model was always superior to the others, as shown inMeta-Analysis 1 (Section 4.1). Notably, the model also gave thebest fit to the results reported by Guyote and Sternberg (1981) thathave been almost ignored by previous meta-analysis studies,despite being the first quantitative model of syllogistic reasoning.When several signal models were compared simultaneously usinga unified comprehensive dataset in Meta-Analysis 2, none was bet-ter than the probabilistic representation model (Section 4.3).
The probabilistic representation model does not only show agood fit to data. An obvious advantage of the model is that it isbased on a theory of representation, and the model’s parametersdefine reasoners’ internal states in terms of representations. In thisregard, it is distinctive among other probabilistic models. Themodel is an extension of Chapman and Chapman’s (1959) conver-sion theory, but an elaboration allows the model to make novelpredictions (Section 4.5), which are examined in the experimentsdescribed in the next section. The model also accounts for theeffect of working memory capacity (Section 4.7).
The probabilistic representation theory is an integration of theprobability heuristic model and the mental models theory, inherit-ing advantages from both theories. It also incorporates someaccounts of syllogistic reasoning based on Gricean interpretationand p-validity. As a result, it not only quantitatively fits the data,but also qualitatively accounts for well-known phenomena in theliterature, including immediate inferences (Section 4.4), illicit con-version (Section 4.5), and the figural effect (Section 4.6). Mostimportantly, it accounts for the background mechanisms of syllo-gistic reasoning. A psychological theory requires more than precisepredictions. Without the internal mechanism, the theory is notable to make new predictions in other situations. Probabilistic

M. Hattori / Cognition 157 (2016) 296–320 313
representation theory is a theory at a representational level thathandles mental mechanisms and accounts for data both quantita-tively and qualitatively.
5. Experiments on the content effect
One of the merits of theories based on internal representation isthat the effect of content is explained in terms of representationalchange. Probabilistic representation theory, in particular, expressesthe change in internal representation by parameter values. Twoexperiments were conducted to examine the difference in the pre-dictive powers of the models compared in the last section.Although the effect of content can be diverse, I concentrate hereon an aspect of syllogistic reasoning concerning symmetry infer-ence, an issue of particular interest for the current theory.
According to the set-size balancing hypothesis (Hattori &Nishida, 2009; Hattori & Oaksford, 2007), people assume thattwo target events are almost equal in their set sizes, unless thereis effective information to override this belief. The coverage param-eter c, which is responsible for the balancing assumption, onlyaffects A-statements in syllogisms, and the degree of balanceaffects only syllogistic reasoning that includes A-statements. Thedifference in performance among four figures sharpens as thevalue of c decreases, because the degree of asymmetry betweenterms in an A-statement moves from complete symmetry (‘‘All Xare Y, and all Y are X” when c = 1) toward greater asymmetry(P(Y|X)? 0 when c? 0). Thus, probabilistic representation theorypredicts that, if we somehow have people jettison the balancingprinciple, the syllogistic figure has a greater effect on the syllogisticreasoning performance. Such an influence of the figure is called aninclusion effect hereafter, and is a specific aspect of the figuraleffect, which is a somewhat ambiguous term (as mentioned inSection 4.6).
The predictions of the current model contrast impressively withthe probability heuristics model, which does not predict any inclu-sion effect: no difference among figures for traditional syllogistictasks with choice options. Although it is not necessarily easy toconsciously inhibit the default response, it is known to be defeasi-ble with the help of general knowledge stored in long-term mem-ory, as shown by Hattori and Nishida (2009). Politzer (2011)proposed a similar idea of natural syllogism that falls in line withthis. Applying this idea here, I examined whether the inclusioneffect could be altered by a semantic manipulation whereby therelationship between two terms in an A-statement agrees withtheir logical relationship in terms of inclusion.
5.1. Experiment 1
5.1.1. MethodA total of 89 undergraduates from Ritsumeikan University (55
female and 34 male, age: M = 20.2, SD = 1.0) took part in the exper-iment to fulfill a part of their course requirements. Of these, oneperson did not follow the instructions correctly, and so their datawere excluded.
In this experiment, only syllogisms that can have a greaterinclusion effect were used as tasks in order to lighten the burdenon participants and obtain clearer results. The potential of eachtype of syllogism (AA, AI, etc.) to exhibit the inclusion effect wasdefined by the average standard deviation of the proportion of eachanswer (A, I, E, O, and N) in all figures. Altering the value of c from0.1 to 0.9 in steps of 0.1 (other parameter values were fixed at thebest-fit estimates derived from Meta-Analysis 2), the index valueswere calculated and then averaged for each type of syllogism. As aresult, five types of syllogism (AA, AI, IA, AE, and EA, in descendingorder) were chosen. Among these, 12 syllogisms (AA1, AA2, AA3,
AA4, AI1, AI2, IA1, IA3, AE1, AE2, EA1, and EA3) that are differentin the PPM were selected as tasks.
The terms used in each syllogism were carefully selected to nul-lify people’s balancing assumption. Three levels of probability (low,middle, and high) were assumed. The ‘‘blood type Ph�” (low) wasintroduced as a fictitious category intended to remind people of thevery rare actual blood type Rh�. The ‘‘pollen allergy” (mid) is actu-ally quite common in Japan, but is no doubt less common than‘‘having a cough” (high). This kind of general knowledge aboutprevalence was an attempt to override the default probabilisticrepresentation and construct one that is consistent with the logicalstructure of a given task. For example, the AA1 syllogism wasstated in a form with two premises, ‘‘All who have a pollen allergy(M-mid) have a cough (P-high)” and ‘‘All who have blood typePh� (S-low) have a pollen allergy (M-mid).” Details of the materialare shown in Appendix B. All the syllogistic tasks were printed in abooklet in a randomized order, and two versions (in which theorder is reversed) were prepared and randomly assigned to theparticipants.
5.1.2. Results and discussionThe models were fitted to the data in the same way as in Meta-
Analysis 2. As we can see from Table 6, the AIC again indicates thatthe probabilistic representation model (8.08) performed best,followed by the probability heuristics model (8.17) and thep-mental model (14.15). The RMSD and Pearson’s correlationcoefficient are also listed in Table 6. These are similar for the prob-abilistic representation model and probability heuristics model,because both can predict the data with only three parameters(as the data are from a part of all 64 syllogisms), whereas thep-mental model requires all six parameters. Generally, the resultsare consistent with those based on AIC.
The best-fit parameter estimates are given in Table 5. Note thatthe estimate of the coverage parameter, which is relevant to thebalancing principle, is c = 0.805. The mean estimate of this param-eter value in standard tasks from Meta-Analysis 2 was 0.912,which is significantly larger than in the current experiment, t(7)= 3.72, p < 0.01. This result indicates both the success of the exper-imental manipulation and the model’s descriptive validity. I willdiscuss the degree of reduction in the value of c in Section 5.3.
5.2. Experiment 2
In this experiment, Experiment 1 was replicated with a widervariation of syllogisms.
5.2.1. MethodI used the same method as in Experiment 1, except for the fol-
lowing. Fifty undergraduate students from Kanazawa University(35 female and 15 male, age:M = 20.8, SD = 1.0) participated in thisexperiment, which was conducted as part of classwork in an ele-mentary cognitive psychology class, albeit participation was on avoluntary basis. The tasks considered 32 out of 64 syllogisms: allsyllogisms that can have the inclusion effect (i.e., syllogisms thatinclude at least one A-statement in their premises) were selected,and II1, 2, 3, and 4 were also included. The tasks were conducted ona computer.
5.2.2. Results and discussionParticipants’ responses to syllogisms IA2, II1, II2, and II4 were
not properly recorded because of a bug in the computer program,and the results of these tasks were excluded from the analysis.
Once again, the models ranked the same in terms of the AIC (seeTable 6): probabilistic representation model (10.374), probabilityheuristics model (10.422), and p-mental model (14.353). Theestimated value of c was 0.779, i.e., the mean estimate of this

Table 6Results of experiments 1 and 2.
Experiment 1 Experiment 2
Type PRM PHM pMM PRM PHM pMM
d r d r d r d r d r d r
AA1 0.097 0.977 0.159 0.969 0.067 1.000 0.134 0.963 0.234 0.914 0.074 1.000AA2 0.202 0.382 0.273 0.191 0.219 0.330 0.225 0.299 0.252 0.226 0.213 0.328AA3 0.079 0.916 0.172 0.716 0.267 0.540 0.061 0.938 0.078 0.926 0.243 0.699
AA4 0.118 0.898 0.217 0.471 0.301 0.330 0.115 0.884 0.167 0.576 0.313 0.320
AI1 0.083 0.977 0.115 0.973 0.024 0.999 0.111 0.959 0.176 0.923 0.021 0.999AI2 0.066 0.968 0.069 0.969 0.045 0.975 0.039 0.985 0.036 0.983 0.058 0.974
AI3 – – – – – – 0.090 0.943 0.112 0.907 0.088 0.985AI4 – – – – – – 0.031 0.989 0.025 0.996 0.083 0.952
IA1 0.034 0.997 0.026 0.998 0.086 0.971 0.033 0.988 0.039 0.985 0.074 0.974
IA3 0.057 0.982 0.074 0.985 0.048 0.989 0.074 0.972 0.132 0.945 0.039 0.995IA4 – – – – – – 0.044 0.993 0.063 0.975 0.112 0.969AE1 0.129 0.800 0.135 0.847 0.054 0.959 0.080 0.912 0.070 0.934 0.043 0.987AE2 0.040 0.993 0.096 0.986 0.032 0.996 0.103 0.972 0.204 0.920 0.047 0.999AE3 – – – – – – 0.121 0.788 0.125 0.778 0.036 0.971AE4 – – – – – – 0.074 0.980 0.176 0.925 0.033 0.996EA1 0.041 0.992 0.086 0.986 0.027 0.996 0.119 0.957 0.209 0.907 0.047 0.999EA2 – – – – – – 0.061 0.985 0.165 0.930 0.035 0.995EA3 0.138 0.809 0.179 0.717 0.054 0.916 0.097 0.883 0.123 0.784 0.084 0.835
EA4 – – – – – – 0.089 0.902 0.083 0.921 0.024 0.987AO1 – – – – – – 0.069 0.952 0.038 0.982 0.100 0.872
AO2 – – – – – – 0.158 0.852 0.067 0.944 0.104 0.794
AO3 – – – – – – 0.232 0.322 0.196 0.442 0.208 0.170
AO4 – – – – – – 0.204 0.676 0.109 0.833 0.130 0.653
OA1 – – – – – – 0.050 0.974 0.018 0.999 0.090 0.930
OA2 – – – – – – 0.221 0.358 0.187 0.461 0.181 0.317
OA3 – – – – – – 0.194 0.712 0.114 0.845 0.166 0.620
OA4 – – – – – – 0.285 0.191 0.190 0.411 0.191 0.164
II3 – – – – – – 0.034 0.993 0.040 0.987 0.100 0.856
All 0.090 0.959 0.133 0.942 0.102 0.976 0.113 0.931 0.122 0.923 0.105 0.978
AIC 8.080 8.170 14.146 10.374 10.422 14.353
Note: The top row indicates models and the ID indicates studies (see, note of Table 4). Underlined numbers are the index values that indicate the best fit in each experiment.d: root mean square deviation (RMSD), r: Pearson’s correlation coefficient.
314 M. Hattori / Cognition 157 (2016) 296–320
parameter in standard tasks from Meta-Analysis 2 was again sig-nificantly larger than that from the current experiment, t(7)= 4.622, p < 0.01. As for Experiment 1, the results are supportiveof the probabilistic representation theory.
5.3. Discussion
The results of these two experiments clearly show that people’srepresentational change, which was manipulated by task materialsin accordance with the set-size balancing hypothesis, alters theirsyllogistic reasoning. The variation in performance is predictedby the model as an adjustment of one parameter. This is the firstdemonstration of the inclusion effect, which is a clarified versionof the figural effect.
One might, however, wonder at the degree of reductions in thevalue of c: estimated values did not reach as low as 0.5, but werearound 0.8. The reason for this is not obvious, but there are severalpossibilities. First, it is possible that people’s behavior is usuallymore conservative than expected. Similar results were actuallyobtained from previous studies that manipulated probability infor-mation in the Wason selection task. In experiments by Oaksford,Chater, and Grainger (1999), probability information was not suffi-ciently effective on people’s performance. When Hattori (2002)estimated the probabilities of events that people conceive in thetask from their performances, the results were conservative,although the trends pointed in the predicted direction. As theseauthors suggested, if a certain default heuristic is almost always
useful in daily life, it may have become a hard-wired defaultoption. Not being excessively sensitive to case-dependent informa-tion can be adaptive in the environment.
Second, it is also possible that some particular property of thestimulus words is responsible for manipulating people’s proba-bilistic representations. In Hattori and Nishida’s (2009) experi-ments, statements such as ‘‘A patient who is infected with Xsyndrome has an 80% chance of having a cough” drastically alteredpeople’s performance in probability judgment tasks. In this case, Xsyndrome and a cough are a disease and a symptom, and they havea clear causal relationship. While some statements used as stimuliin Experiments 1 and 2 can be regarded as causal rules, others suchas ‘‘Some optimists have a pollen allergy” cannot. If probabilityinformation is more effective in the context of causality, the stim-ulus set might have made the results ambiguous.
Apart from these issues, the model itself might be too simple.Some assumptions, especially that P(M) is the same in all syllo-gisms, might be too strong. The validity of each assumption shouldbe carefully examined in future studies, and the model should berefined continuously.
6. Syllogisms with generalized quantifiers
Developments in the psychology of reasoning over recent dec-ades (e.g., Evans & Over, 2004; Oaksford & Chater, 2007) have madethe operational distinction between deduction and induction

M. Hattori / Cognition 157 (2016) 296–320 315
ambiguous (but, see, Rips, 2001). The traditional theoretical gap inphilosophy between deductive and inductive reasoning has beenbridged by several authors using probabilistic tools (e.g., Lassiter& Goodman, 2015; Oaksford & Chater, 2001; Tenenbaum, Kemp,Griffiths, & Goodman, 2011). In this regard, among several compre-hensive psychological theories of syllogism, Chater and Oaksford’s(1999) probability heuristics model has the distinctive advantageof dealing with generalized quantifiers (i.e., most and few), whichare not regarded as being deductive from a logical point of view.Here, I extend the probabilistic representation model to deal withnon-logical quantifiers, and compare it with the probability heuris-tics model.
6.1. Extension of the model
6.1.1. PPMAlthough the quantifiers most (M) and few (F) are considered to
express basically the same ‘‘logical” information as some (I), theyhave additional information. Therefore, I assume the Euler circlerepresenting M and F to be D3 in Fig. 3, whereas the probabilityinformation for each of them includes an extra parameter (seeTable 7). We can assume some kind of continuum from ‘‘No Xare Y” (E) to ‘‘All X are Y” (A): E—F—I—M—A. Correspondingly,parametersm (i.e.,manyness) and f (i.e., fewness) define the degree
Table 7Generalized Quantifiers Expressed by Probability Parameters.
No X are Y Few X are Y
YX X Y
f : f ¼ 1 0 < f < 1m: � �PðX;YÞ: PðX;YÞ ¼ 0 PðX;YÞ ¼ �f x2
Note. Probabilities of X and Y are expressed by a parameter x (i.e., PðXÞ ¼ PðYÞ ¼ x), and ptext in detail). Here, �m, �f , �x, and xþ stand for 1�m, 1� f , 1� x, and xþm�x, respectively
Table 8Probabilities of all areas in each PPM with generalized quantifiers.
No Name Type P(S) P(P)
5b AM13 AM1,3 x y5c AF13 AF1,3 x y
6b AM24 AM2,4 x cx6c AF24 AF2,4 x cx
7b MA12 MA1,2 cx x7c FA12 FA1,2 cx x
8b MA34 MA3,4 y x8c FA34 FA3,4 y x
13b ME ME⁄ x x13c FE FE⁄ x x
14b EM EM⁄ x x14c EF EF⁄ x x
16b MM MM⁄ x x
16c FF FF⁄ x x
16d MF MF⁄ x x
16e FM FM⁄ x x
16f MI MI⁄; MO⁄ x x16g IM IM⁄; OM⁄ x x16h FI FI⁄; FO⁄ x x
16i IF IF⁄;OF⁄ x x
Note. Parameters m and f indicate the degrees ofmanyness and fewness, respectively (seerespectively. For �x and y, see the note for Table 2.
of overlap between two Euler circles for two terms in a statement.As shown in Table 7, it is assumed that m runs from 0 (I) to 1 (A) inthe case of M, while f runs from 0 (I) to 1 (E) in the case of F. A set ofPPMs for syllogisms with generalized quantifiers is the same as thetraditional syllogisms shown in Fig. 6 (e.g., AI13 = AM13, etc.),although the probability assignment should be expanded for syllo-gisms including M or F, as given in Table 8.
6.1.2. Generating a conclusion and its probabilityThe test order for the consistency of candidate conclusions is A,
M, F, I, E, and O. This is based on the result that, under the rarity ofevents assumption, the order of informativeness is I(A) > I(M) > I(F) > I(I) > I(E) > I(O), as analyzed by Chater and Oaksford (1999).Additional criteria for testing the consistency of an SMM, and thetheoretical probability that each conclusion is not inconsistentwith the SMM, are as follows:
An M-conclusion is derived if there is at least one individualthat is both S and P. The theoretical probability that the M-conclusion is consistent with an SMM is ð1� P1 � P3Þn.
An F-conclusion is derived if there is at least one individual thatis not both S and P. The theoretical probability that the F-conclusion is consistent with an SMM is 1� ðP1 þ P3Þn. Newsemi-fixed parameters for the degree of confidence in a conclusionwith M or F, as in the cases of A, I, E, and O, are also introduced.
Some X are Y Most X are Y (All X are Y)
X Y YX X,Y
f ¼ 0 � �m ¼ 0 0 < m < 1 m ¼ 1PðX;YÞ ¼ x2 PðX;YÞ ¼ xxþ PðX;YÞ ¼ x
arameters m and f indicate the degrees of manyness and fewness, respectively (see.
1 2 3 5
PðS;M; PÞ PðS;M; P�Þ PðS;M
�; PÞ PðS
�;M; PÞ
xxþ 0 �c �mx�x �mx�x�f x2 0 �cx�x x�xþ
cxxþ �cxxþ 0 c �mx�x
c�f x2 �c�f x2 0 cx�xþ
cxxþ c �mx�x 0 �cxxþ
c�f x2 cx�xþ 0 c�f x2
xxþ �mx�x �c �mx�x 0�f x2 x�xþ �cx�x 00 0 �mx2 xxþ
0 0 x2�xþ=�x �f x2
0 xxþ �mx2 00 �f x2 x2�xþ=�x 0
xðxþÞ2 �mx�xxþ �m2x2�x �mx�xxþ
�f 2x3 f�f x2 x2ð�xþÞ2=�x f�f x2
�f x2xþ �m�f x2�x �mx2ð�xþÞ x�xþxþ
�f x2xþ xxþ�xþ �mx2ð�xþÞ �m�f x2�xx2xþ �mx2�x �mx2�x x�xxþ
x2xþ x�xxþ �mx2�x �mx2�x�f x3 x2�xþ x2�xþ �f x2�x�f x3 �f x2�x x2�xþ x2�xþ
text in detail). In this table, �m, �f , xþ , and �xþ , stand for 1�m, 1� f , xþm�x, and �xþ fx,

316 M. Hattori / Cognition 157 (2016) 296–320
6.2. Empirical tests: Meta-Analysis 3
The probabilistic representation model was compared with theprobability heuristics model using data from Chater and Oaksford’s(1999) Experiments 1 (AMFO) and 2 (MFIE) in the same way as inthe previous evaluations. The fitness of the probabilistic represen-tation model was inferior to that of the probability heuristicsmodel in both experiments: RMSDs were 0.152 vs. 0.106 (AMFO)and 0.123 vs. 0.093 (MFIE); Pearson’s r values were 0.899 vs.0.965 (AMFO) and 0.767 vs. 0.859 (MFIE). AICs were 28.0 vs. 10.5(AMFO) and 24.5 vs. 10.2 (MFIE), indicating much worse scoresfrom the former, as it contains two more parameters than thelatter.
There are some points to be noted regarding the tasks used inChater and Oaksford’s (1999) experiments, which are differentfrom those used in traditional syllogistic experiments. In theirexperiments, half of the premises in the task contained probabilis-tic quantifiers (i.e.,most or few), which clearly indicate that the tar-get statement is not to be logically considered. In fact, fewersyllogisms have correct solutions from the logical point of view(i.e., 13 and 12 in the AMFO and MFIE tasks, respectively) com-pared with the traditional AIEO task (i.e., 19, see Appendix A). Suchsettings might have encouraged participants to think in a differentway from ordinary syllogistic tasks. What is consistent with thisview is the suggestion by Rips (2001) that people have qualita-tively distinct ways of evaluating deduction and induction: adeductively correct argument is not an extreme form of an induc-tively strong argument.
While the distinction between deductive and inductive reason-ing is still controversial (e.g., Feeney, 2007), it is no doubt animportant issue for any current and future theories of syllogisms.Some anomalies observed even in the results of Chater andOaksford (1999) might be relevant to this issue. In their Experi-ment 1 with AMFO quantifiers, many more participants (68.75%)selected the O-conclusion for syllogisms with OO-type premisesthan in experiments with standard deductive AIEO quantifiers(18.04%), a phenomenon that they called the global context effect.Participants’ behavior changed in another way in their Experiment2 with MFIE quantifiers: the selection trend was more ambiguousin this experiment than others. The percentage of the most selectedconclusion types ranged from 25.0% to 75.0%, with an average of39.53% (Table E1 in Chater & Oaksford, 1999). This rate seems tobe significantly lower than for standard tasks, where the range is12.03–92.41% with an average of 47.44% according to theirTable C1. As a result, the fit of their model to the data is worse(r = 0.65) than the AMFO data (r = 0.94) and standard data(r = 0.90) according to their analyses. These phenomena seem tofall outside the scope of any current theories, and may have some-thing to do with people’s reasoning mode: deductive or inductive.
However, given that these results are from only two experi-ments with relatively few participants (i.e., 20 for each), and thatthe experiments were equipped with an insufficient set of syllo-
Table 9Summary of the all empirical tests: AIC as an index of goodness-of-fit of the model.
PRM
Meta-Analysis 1: CO99-AIEO 17.9Meta-Analysis 1: GS81 13.8Meta-Analysis 2: Weighted average 19.5Experiment 1 8.1Experiment 2 10.4Meta-Analysis 3: CO99-AMFO 28.0Meta-Analysis 3: CO99-MFIE 18.6
Note: A smaller AIC score indicates better fitness. The top row indicates models and theindicate Chater and Oaksford’s (1999) Meta-Analysis data using standard AIEO syllogismfrom Guyote and Sternberg (1981).
gisms (i.e., only four out of six quantifiers, AMFIEO), the resultsof the current model evaluation are not definitive on this issue.In future, to construct a comprehensive model incorporating a pos-sible distinction between deductive and inductive thinking modesand different types of processes, the method of the current modelin deriving a conclusion including that based on a set of small sam-ples in an SMM might require some elaboration.
7. General discussion
In this paper, I have proposed a model for syllogistic reasoningbased on probabilistic representations. Constructing a mental rep-resentation based on individual elements that corresponds to a‘‘probable” state of affairs, the model simulates a process to derivethe most informative ‘‘logical” conclusion. The model exhibited agood fit to the available data, and its validity was confirmed.Table 9 summarizes all the results of empirical tests so far forthe corresponding target models, picking up only AIC scores as arepresentative index of goodness-of-fit. This study can be charac-terized both as a true extension of the mental models theory thatenables the quantitative prediction of data for syllogistic reason-ing, and also as an attempt to elaborate the probability heuristicsmodel at the algorithmic/representational level.
The results of parameter estimation for the coverage parameterc suggest a previously unknown connection among various types ofreasoning and judgment. As c was estimated to be close to 1, S, M,and P are considered to be almost identical in size in our mind. Inthis relation, Hattori (2002) analyzed a version of information gainmodels and found that people assume the probabilities of the ante-cedent (p) and consequent (q) of a conditional ‘‘if p then q” inWason’s selection task to be almost equal. Similarly, Hattori andNishida (2009) presented evidence that an error known as the baserate fallacy in probabilistic reasoning is caused by the balancingprinciple, and that this error disappears when the principle isblocked. Moreover, Hattori and Oaksford (2007) showed that a‘‘fast and frugal” dual-factor heuristic embodying the principle isinstrumental in covariation detection as a fundamental step in cau-sal induction between two arbitrary events. All of these resultsindicate a particular aspect of general human cognition when peo-ple recognize the uncertainty of the real world. The balancing prin-ciple is a probabilistic interpretation of symmetry inference.Various biases and errors that have been identified in differentareas of human thinking, including categorical and conditionaldeduction, induction, and probability judgment, appear to beunrelated to each other, but may be caused by a single commoncharacteristic called symmetry.
Finally, I look at the justification for a particular assumption ofthe model. Random sampling, which is a mechanism for linking theprobabilistic representation and derivation of a logical conclusion,can be questioned: is it simply an expedient mechanism forobtaining an output that fits the data, or is it assumed to be
PHM pMM TCM
17.7 – –– – 16.6
20.3 21.4 –8.2 14.2 –
10.4 14.4 –10.5 – –10.2 – –
ID indicates studies (see, note of Table 4). CO99-AIEO, CO99-AMFO, and CO99-MFIEs, data from Experiments 1 (AMFO) and 2 (MFIE), respectively. GS81 indicates data

M. Hattori / Cognition 157 (2016) 296–320 317
psychologically real. The answer here is both yes and no. It is unde-niable that at least part of our mental processes involves intrinsicfluctuations, and that a mechanism seen as a virtual random num-ber generator is embodied in our minds (e.g., Glimcher, 2003). Inthis sense, the random sampling process in the model can beregarded as a model of a certain kind of psychological uncertainty.On the other hand, it may be unlikely that a particular person canbe assumed to make a sample at ‘‘random,” in the proper sense ofthe word, in the process of syllogistic reasoning. Rather, it wouldbe more realistic to consider the random sampling function to bea sufficient model of reasoning performance of a certain group ofpeople rather than a particular person. Although unpredictableuncertainty is surely involved in each individual’s reasoning pro-cess, this may not be exactly the same as a purely random process.However, if we combine the behavior of a certain number of peo-ple, the global behavior is simulated by a random process with sat-isfactory accuracy.
M – PS – MS – P
P – MS – MS – P
M – PM – SS – P
P – MM – SS – P
(1) (2) (3) (4)
S – MM – PS – P
S – MP – MS – P
M – SM – PS – P
M – SP – MS – P
(1’) (2’) (3’) (4’)
(I) Aristotelian Figures
(II) Exchanged Figures
Table A.1Logical equivalence among various syllogistic figures.
Aristotelian Exchanged Converted Johnson-Laird’s
XY1/Z YX10/Z YX4/Z0 XY2JL/Z0 (XbaYcb/Zca)XY2/Z YX20/Z YX2/Z0 XY3JL/Z0 (XabYcb/Zca)XY3/Z YX30/Z YX3/Z0 XY4JL/Z0 (XbaYbc/Zca)XY4/Z YX40/Z YX1/Z0 XY1JL/Z0 (XabYbc/Zca)YX1/Z XY10/Z XY4/Z0 XY1JL/Z (XabYbc/Zac)YX2/Z XY20/Z XY2/Z0 XY3JL/Z (XabYcb/Zac)YX3/Z XY30/Z XY3/Z0 XY4JL/Z (XbaYbc/Zac)YX4/Z XY40/Z XY1/Z0 XY2JL/Z (XbaYcb/Zac)
Note. Symbols (e.g., XY1/Z) consist of the moods of the first premise (X) and secondpremise (Y), the figure (1), and the mood of the conclusion (Z). Figure numbers witha prime (e.g., 10) indicate that the two premises are exchanged. Figure number witha superscript symbol JL indicates Johnson-Laird’s original numbering system.Conclusion symbols with a prime (i.e., Z0) indicate that the order of terms is con-verted (i.e., P–S instead of S–P).
8. Conclusions
The current study has presented a novel model based on prob-abilistic representations. The model was inspired by two precedingideas proposed decades ago: probabilistic inference (Chapman &Chapman, 1959) and individual-based mental models (Johnson-Laird & Steedman, 1978). The proposed model was also elaboratedusing three concepts, some of which are relevant to previous the-ories of syllogistic reasoning: minimal constraints, small samples,and informativeness. The model exhibited a good fit to the data.As a result, the model is a real integration of the two most repre-sentative current theories, the mental model theory and the prob-ability heuristic model (Chater & Oaksford, 1999). The mostimportant implication of this study is the model’s suggestion about(1) the process of syllogistic reasoning and (2) its relevance to othercognitive tasks or processes. The results suggest the proceduralvalidity of probabilistic approaches: people first construct an intu-itive probabilistic representation corresponding to the typical stateof affairs described by the premises, and secondly, they constructan individual-based model with a small number of elementsassuming minimal constraints on their logical relations. Thus, peo-ple try to convey information efficiently with such representations.The results also indicate that people observe the set-size balancingprinciple in syllogisms, as in other cognitive tasks, includinghypothesis testing, causal induction, and probability judgment.This means that deductive reasoning is not a special cognitive pro-cess in the sense that it is exclusively modeled by logic, but is oneof the ecologically justified processes regulated by adaptivelyrational probabilistic strategies.
Author note
This research was supported by JSPS KAKENHI Grant 22500247and 15H02717. The author is grateful to Hugo Mercier, KazuhisaMiwa, David Over, Henrik Singmann, and especially to Mike Oaks-ford, for their helpful comments.
A – BB – CA – CC – A
B – AC – BA – CC – A
A – BC – BA – CC – A
B – AB – CA – CC – A
(1) (2) (3) (4)(III) Johnson-Laird’s Figures
Fig. A.1. Syllogistic figures defined in traditional Aristotelian logic (I), modifiedfigures defined by exchanging the first and second premises from the Aristotelianfigures (II), and Johnson-Laird’s original figures (III). The former two fix the order ofterms in the conclusion, but the latter allows conclusions in any order.
Appendix A. Validity of syllogisms and syllogistic figures
In this paper, I presuppose that at least one individual of X existswhen asserting ‘‘All X are Y” (A) or ‘‘No X are Y” (E), following thetraditional Aristotelian manner (i.e., the existential presupposition).If this presupposition is omitted, the number of syllogisms thathave a valid conclusion is 15 instead of 19, as AA3, AA4, EA3, andEA4 do not have any valid conclusions. I adopt the Aristotelian cri-terion here because it is more natural from a psychological point ofview, considering the fact that we would not usually say ‘‘All X are
Y” when we already know there are no X at all. Johnson-Laird andSteedman (1978) regarded 27 syllogisms as having a valid conclu-sion (p. 67), and Chater and Oaksford (1999) regarded 31 syllo-gisms as being probabilistically valid (p. 203), because theyignored the order of terms in the conclusion. For example, AE1does not have a valid conclusion according to the Aristotelian cri-terion, but if we are allowed to exchange S and P, ‘‘Some P are S”(I) would be a valid conclusion, while ‘‘Some S are P” (I), whichhas an allowed order, is not valid. Note, however, that this syllo-gism is no longer regarded as a Fig. 1 syllogism, but is instead aFig. 4 syllogism (although the first and second premises areexchanged). That is, this syllogism is to be regarded as essentiallyEA4/O (Table A.1 shows XY1/Z0 = YX4/Z). I follow the traditionaltaxonomy of syllogisms to avoid confusion. Table 1 lists all 64 syl-logisms and their logical conclusions.
According to traditional Aristotelian logic, syllogistic figures aredefined as in Fig. A.1-I (including the conclusion, S and P). Thepredicate of the conclusion (P) is in the first premise (called amajor term), and the subject of the conclusion (S) is in the secondpremise (called a minor term). In a series of experimental papers,Johnson-Laird classified syllogisms according to the location ofterms in premises, as shown in Fig. A.1-III. In fact, this caused con-

318 M. Hattori / Cognition 157 (2016) 296–320
fusion because it had an independent numbering system under thesame name of figures. This definition depends solely on the pre-mises, and does not include the conclusion. As a consequence, cor-respondence between Aristotelian and Johnson-Laird’s figures inregard to logical equivalence varies according to the order of con-clusion terms. For example, now consider Johnson-Laird’s Fig. 1syllogism with A- and I-premises ‘‘All A are C” and ‘‘Some B areC” (AabIbc) in the form of Fig. A.1-III-(1). If it has an I-conclusion‘‘Some C are A” (AabIbc/Ica), it is identical to AI4/I [Fig. A.1-I-(4)](i.e., Fig. 4). However, if it has a conclusion ‘‘Some A are C”(AabIbc/Iac), it is actually logically equivalent to IA1/I (Fig. 1), asI now show. An AabIbc/Iac syllogism is identical to AI10/I[Fig. A.1-II-(10)]. Here, a figure number with a prime (e.g., 10) indi-cates that it is logically equivalent to that figure, but the order oftwo premises has been exchanged, which means that AI10/I is log-ically equivalent to IA1/I [Fig. A.1-I-(1)]. This kind of correspon-dence is listed in Table A.1.
Appendix B. Materials used in Experiments 1 and 2
Three levels of probability, low, middle, and high, were assignedto the syllogistic terms. Terms for low probability were ‘‘havingblood type Ph� (B)” and ‘‘be exposed to phi-rays (R).” Terms forthe middle probability were ‘‘having a pollen allergy (P),” ‘‘havingX syndrome (X),” and ‘‘being an optimist (O).” Terms for the highprobability were ‘‘having a cough (C)” and ‘‘having a stuffy nose(N).” The correspondence between syllogisms and the terms usedis given in Table B.1.
Table B.1Syllogistic terms used in experiments 1 and 2.
S M P
AA1⁄ L (B) M (P) H (C)AA2⁄ L (B) M (P) L (F)AA3⁄ H (C) M (P) H (N)AA4⁄ H (C) M (P) L (B)AI1⁄ M (X) M (P) H (C)AI2⁄ M (X) M (P) L (B)AI3 M (X) M (P) H (C)AI4 M (X) M (P) L (B)IA1⁄ L (B) M (P) M (X)IA2 L (B) M (P) M (X)IA3⁄ H (C) M (P) M (X)IA4 H (C) M (P) M (X)AE1⁄ M (X) M (P) H (C)AE2⁄ M (X) M (P) L (B)AE3 M (X) M (P) H (C)AE4 M (X) M (P) L (B)EA1⁄ L (B) M (P) M (X)EA2 L (B) M (P) M (X)EA3⁄ H (C) M (P) M (X)EA4 H (C) M (P) M (X)AO1 M (X) M (P) H (C)AO2 M (X) M (P) L (B)AO3 M (X) M (P) H (C)AO4 M (X) M (P) L (B)OA1 L (B) M (P) M (X)OA2 L (B) M (P) M (X)OA3 H (C) M (P) M (X)OA4 H (C) M (P) M (X)II1 M (O) M (P) M (X)II2 M (O) M (P) M (X)II3 M (O) M (P) M (X)II4 M (O) M (P) M (X)
Note. Stimuli with an asterisk were used in Experiment 1, and all stimuli were usedin Experiment 2. L, M, and H indicate low, middle, and high probability, respec-tively. B, F, P, X, O, C, and N in parentheses indicate ‘‘blood type Ph�,” ‘‘phi-rayexposure,” ‘‘pollen allergy,” ‘‘X syndrome,” ‘‘optimist,” ‘‘having a cough,” and‘‘having a stuffy nose,” respectively. See details in text.
References
Adams, E. W. (1975). The logic of conditionals: An application of probability todeductive logic. Dordrecht, Holland: Reidel.
Baddeley, A. (2007). Working memory, thought, and action. Oxford University Press.Bara, B. G., Bucciarelli, M., & Johnson-Laird, P. N. (1995). Development of syllogistic
reasoning. The American Journal of Psychology, 108, 157–193. http://dx.doi.org/10.2307/1423127.
Begg, I., & Harris, G. (1982). On the interpretation of syllogisms. Journal of VerbalLearning and Verbal Behavior, 21, 595–620. http://dx.doi.org/10.1016/S0022-5371(82)90800-3.
Bonatti, L. (1994). Propositional reasoning by model? Psychological Review, 101,725–733. http://dx.doi.org/10.1037/0033-295X.101.4.725.
Braine, M. D. S., Connell, J., Freitag, J., & O’Brien, D. P. (1990). Is the base rate fallacyan instance of asserting the consequent? In K. J. Gilhooly, M. T. G. Keane, R. H.Logie, & G. Erdos (Eds.). Lines of thinking: Reflections on the psychology of thought(Vol. 1, pp. 165–180). Chichester, England: John Wiley & Sons.
Byrd, R. H., Lu, P., Nocedal, J., & Zhu, C. (1995). A limited memory algorithm forbound constrained optimization. SIAM Journal on Scientific Computing, 16,1190–1208. http://dx.doi.org/10.1137/0916069.
Ceraso, J., & Provitesa, A. (1971). Sources of error in syllogistic reasoning.Cognitive Psychology, 2, 400–410. http://dx.doi.org/10.1016/0010-0285(71)90023-5.
Chapman, L. J., & Chapman, J. P. (1959). Atmosphere effect re-examined. Journal ofExperimental Psychology, 58, 220–226. http://dx.doi.org/10.1037/h0041961.
Chater, N., & Oaksford, M. (1999). The probability heuristics model of syllogisticreasoning. Cognitive Psychology, 38, 191–258. http://dx.doi.org/10.1006/cogp.1998.0696.
Copeland, D. E. (2006). Theories of categorical reasoning and extended syllogisms.Thinking and Reasoning, 12, 379–412.
Copeland, D. E., & Radvansky, G. A. (2004). Working memory and syllogisticreasoning. The Quarterly Journal of Experimental Psychology: Section A, 57,1437–1457. http://dx.doi.org/10.1080/02724980343000846.
Cowan, N. (2000). The magical number 4 in short-term memory: A reconsiderationof mental storage capacity. Behavioral and Brain Sciences, 24, 87–114. http://dx.doi.org/10.1017/S0140525X01003922.
Cowan, N. (2010). The magical mystery four: How is working memory capacitylimited, and why? Current Directions in Psychological Science, 19, 51–57. http://dx.doi.org/10.1177/0963721409359277.
D’Amato, M. R., Salmon, D. P., Loukas, E., & Tomie, A. (1985). Symmetry andtransitivity of conditional relations in monkeys (Cebus apella) and pigeons(Columba livia). Journal of the Experimental Analysis of Behavior, 44, 35–47. http://dx.doi.org/10.1901/jeab.1985.44-35.
Dickstein, L. S. (1978). The effect of figure on syllogistic reasoning. Memory &Cognition, 6, 76–83. http://dx.doi.org/10.3758/BF03197431.
Dugdale, N., & Lowe, C. F. (2000). Testing for symmetry in the conditionaldiscriminations of language-trained chimpanzees. Journal of the ExperimentalAnalysis of Behavior, 73, 5–22. http://dx.doi.org/10.1901/jeab.2000.73-5.
Dugdale, N., & Lowe, C. F. (1990). Naming and stimulus equivalence. In D. E.Blackman & H. Lejeune (Eds.), Behaviour analysis in theory and practice:Contributions and controversies (pp. 115–138). Hillsdale, NJ: Erlbaum.
Eddy, D. M. (1982). Probabilistic reasoning in clinical medicine: Problems andopportunities. In D. Kahneman, P. Slovic, & A. Tversky (Eds.), Judgment underuncertainty: Heuristics and biases (pp. 249–267). Cambridge, UK: CambridgeUniversity Press.
Elqayam, S., & Over, D. E. (2013). New paradigm psychology of reasoning: Anintroduction to the special issue edited by Elqayam, Bonnefon, and Over.Thinking & Reasoning, 19, 249–265. http://dx.doi.org/10.1080/13546783.2013.841591.
Erickson, J. R. (1978). Research on syllogistic reasoning. In R. Revlin & R. E. Mayer(Eds.), Human reasoning (pp. 39–50). New York: Wiley.
Erickson, J. R. (1974). A set analysis theory of behavior in formal syllogisticreasoning tasks. In R. L. Solso (Ed.), Theories in cognitive psychology: The Loyolasymposium (pp. 305–329). Potomac, MD: Lawrence Erlbaum Associates.
Espino, O., Santamaria, C., & Garcia-Madruga, J. A. (2000). Activation of end-terms insyllogistic reasoning. Thinking & Reasoning, 6, 67–89. http://dx.doi.org/10.1080/135467800393939.
Evans, J. St. B. T., Handley, S. J., Harper, C. N. J., & Johnson-Laird, P. N. (1999).Reasoning about necessity and possibility: A test of the mental model theory ofdeduction. Journal of Experimental Psychology: Learning, Memory, and Cognition,25, 1495–1513.
Evans, J. St. B. T., & Over, D. E. (2004). If. New York, NY: Oxford University Press.Faris, J. A. (1955). The Gergonne relations. The Journal of Symbolic Logic, 20, 207–231.Feeney, A. (2007). Individual differences, dual processes, and induction. In A. Feeney
& E. Heit (Eds.), Inductive reasoning: Experimental, developmental, andcomputational approaches (pp. 302–327). Cambridge, UK: CambridgeUniversity Press.
Ford, M. (1994). Two modes of mental representation and problem solution insyllogistic reasoning. Cognition, 54, 1–71. http://dx.doi.org/10.1016/0010-0277(94)00625-U.
Frase, L. T. (1966). Validity judgments of syllogisms in relation to two sets of terms.Journal of Educational Psychology, 57, 239–245. http://dx.doi.org/10.1037/h0023778.

M. Hattori / Cognition 157 (2016) 296–320 319
Garnham, A. (1993). A number of questions about a question of number. Behavioraland Brain Sciences, 16, 350–351. http://dx.doi.org/10.1017/S0140525X00030454.
Gavanski, I., & Hui, C. (1992). Natural sample spaces and uncertain belief. Journal ofPersonality and Social Psychology, 63, 766–780. http://dx.doi.org/10.1037/0022-3514.63.5.766.
Geis, M. L., & Zwicky, A. M. (1971). On invited inferences. Linguistic Inquiry, 2,561–566.
Gigerenzer, G., & Hoffrage, U. (1995). How to improve Bayesian reasoning withoutinstruction: Frequency formats. Psychological Review, 102, 684–704. http://dx.doi.org/10.1037/0033-295X.102.4.684.
Glimcher, P. W. (2003). Decisions, uncertainty, and the brain: The science ofneuroeconomics. Cambridge, MA: MIT Press.
Grice, H. P. (1975). Logic and conversation. In Syntax and semantics. In P. Cole & J. L.Morgan (Eds.). Speech acts (Vol. 3, pp. 41–58). London: Academic Press.Reprinted from: Reprinted as.
Guyote, M. J., & Sternberg, R. J. (1981). A transitive-chain theory of syllogisticreasoning. Cognitive Psychology, 13, 461–525. http://dx.doi.org/10.1016/0010-0285(81)90018-9.
Halford, G. S., Cowan, N., & Andrews, G. (2007). Separating cognitive capacity fromknowledge: A new hypothesis. Trends in Cognitive Sciences, 11, 236–242. http://dx.doi.org/10.1016/j.tics.2007.04.001.
Hammerton, M. (1973). A case of radical probability estimation. Journal ofExperimental Psychology, 101, 252–254. http://dx.doi.org/10.1037/h0035224.
Hattori, M. (2002). A quantitative model of optimal data selection in Wason’sselection task. The Quarterly Journal of Experimental Psychology A, 55,1241–1272. http://dx.doi.org/10.1080/02724980244000053.
Hattori, M. (2008). Suiron to handan no toukakuritsusei kasetsu: Shikou notaishousei to sono tekiouteki imi. [The equiprobability hypothesis ofreasoning and judgment: Symmetry in thinking and its adaptiveimplications.]. Cognitive Studies, 15, 408–427. http://dx.doi.org/10.11225/jcss.15.408.
Hattori, M. (2016). Model fitting data from syllogistic reasoning experiments. Datain Brief (in press). http://dx.doi.org/10.1016/j.dib.2016.09.053.
Hattori, M., & Nishida, Y. (2009). Why does the base rate appear to be ignored? Theequiprobability hypothesis. Psychonomic Bulletin & Review, 16, 1065–1070.http://dx.doi.org/10.3758/PBR.16.6.1065.
Hattori, M., & Oaksford, M. (2007). Adaptive non-interventional heuristics forcovariation detection in causal induction: Model comparison and rationalanalysis. Cognitive Science, 31, 765–814. http://dx.doi.org/10.1080/03640210701530755.
Horne, P. J., & Lowe, C. F. (1996). On the origins of naming and other symbolicbehavior. Journal of the Experimental Analysis of Behavior, 65, 185–241. http://dx.doi.org/10.1901/jeab.1996.65-185.
Iyengar, S. S., & Lepper, M. R. (2000). When choice is demotivating: Can one desiretoo much of a good thing? Journal of Personality and Social Psychology, 79,995–1006. http://dx.doi.org/10.1037/0022-3514.79.6.995.
Johnson-Laird, P. N. (1980). Mental models in cognitive science. Cognitive Science, 4,71–115. http://dx.doi.org/10.1207/s15516709cog0401_4.
Johnson-Laird, P. N. (1983). Mental models: Towards a cognitive science of language,inference and consciousness. Cambridge, UK: Cambridge University Press.
Johnson-Laird, P. N., & Bara, B. G. (1984). Syllogistic inference. Cognition, 16, 1–61.http://dx.doi.org/10.1016/0010-0277(84)90035-0.
Johnson-Laird, P. N., & Byrne, R. M. J. (1991). Deduction. Hove, UK: LawrenceErlbaum Associates.
Johnson-Laird, P. N., Khemlani, S. S., & Goodwin, G. P. (2015). Logic, probability, andhuman reasoning. Trends in Cognitive Sciences, 19, 201–214. http://dx.doi.org/10.1016/j.tics.2015.02.006.
Johnson-Laird, P. N., Legrenzi, P., Girotto, V., Legrenzi, M. S., & Caverni, J.-P. (1999).Naive probability: A mental model theory of extensional reasoning.Psychological Review, 106, 62–88. http://dx.doi.org/10.1037/0033-295X.106.1.62.
Johnson-Laird, P. N., & Steedman, M. (1978). The psychology of syllogisms. CognitivePsychology, 10, 64–99. http://dx.doi.org/10.1016/0010-0285(78)90019-1.
Kareev, Y. (2000). Seven (indeed, plus or minus two) and the detection ofcorrelations. Psychological Review, 107, 397–402. http://dx.doi.org/10.1037/0033-295X.107.2.397.
Khemlani, S. S., & Johnson-Laird, P. N. (2012). Theories of the syllogism: A meta-analysis. Psychological Bulletin, 138, 427–457. http://dx.doi.org/10.1037/a0026841.
Khemlani, S. S., Lotstein, M., & Johnson-Laird, P. N. (2015). Naive probability: Model-based estimates of unique events. Cognitive Science, 39, 1216–1258. http://dx.doi.org/10.1111/cogs.12193.
Khemlani, S. S., Lotstein, M., Trafton, J. G., & Johnson-Laird, P. N. (2015). Immediateinferences from quantified assertions. The Quarterly Journal of ExperimentalPsychology, 68, 2073–2096. http://dx.doi.org/10.1080/17470218.2015.1007151.
Koehler, J. J. (1996). The base rate fallacy reconsidered: Descriptive, normative, andmethodological challenges. Behavioral and Brain Sciences, 19, 1–53. http://dx.doi.org/10.1017/S0140525X00041157.
Lassiter, D., & Goodman, N. D. (2015). How many kinds of reasoning? Inference,probability, and natural language semantics. Cognition, 136, 123–134. http://dx.doi.org/10.1016/j.cognition.2014.10.016.
Lecoutre, M.-P. (1992). Cognitive models and problem spaces in ‘‘purely random”situations. Educational Studies in Mathematics, 23, 557–568. http://dx.doi.org/10.1007/BF00540060.
Macchi, L. (1995). Pragmatic aspects of the base-rate fallacy. The Quarterly Journal ofExperimental Psychology A, 48, 188–207.
Marr, D. (1982). Vision: A computational investigation into the human representationand processing of visual information. San Francisco, CA: W.H. Freeman.
Miller, G. A. (1956). The magical number seven, plus or minus two: Some limits onour capacity for processing information. Psychological Review, 63, 81–97. http://dx.doi.org/10.1037/h0043158.
Newstead, S. E. (1989). Interpretational errors in syllogistic reasoning. Journal ofMemory and Language, 28, 78–91. http://dx.doi.org/10.1016/0749-596X(89)90029-6.
Newstead, S. E. (1993). Do mental models provide an adequate account of syllogisticreasoning performance? Behavioral and Brain Sciences, 16, 359–360. http://dx.doi.org/10.1017/S0140525X00030557.
Newstead, S. E. (1995). Gricean implicatures and syllogistic reasoning. Journal ofMemory and Language, 34, 644–664. http://dx.doi.org/10.1006/jmla.1995.1029.
Newstead, S. E., & Griggs, R. A. (1983). Drawing inferences from quantifiedstatements: A study of the square of opposition. Journal of Verbal Learningand Verbal Behavior, 22, 535–546. http://dx.doi.org/10.1016/S0022-5371(83)90328-6.
Oaksford, M. (2008). Stimulus equivalence and the origins of reasoning, language,and working memory. Cognitive Studies, 15, 392–407. http://dx.doi.org/10.11225/jcss.15.392.
Oaksford, M., & Chater, N. (1994). A rational analysis of the selection task as optimaldata selection. Psychological Review, 101, 608–631. http://dx.doi.org/10.1037/0033-295X.101.4.608.
Oaksford, M., & Chater, N. (2001). The probabilistic approach to human reasoning.Trends in Cognitive Sciences, 5, 349–357. http://dx.doi.org/10.1016/S1364-6613(00)01699-5.
Oaksford, M., & Chater, N. (2007). Bayesian rationality: The probabilistic approach tohuman reasoning. New York, NY: Oxford University Press.
Oaksford, M., Chater, N., & Grainger, B. (1999). Probabilistic effects in data selection.Thinking & Reasoning, 5, 193–243. http://dx.doi.org/10.1080/135467899393986.
Over, D. E. (2009). New paradigm psychology of reasoning. Thinking & Reasoning, 15,431–438. http://dx.doi.org/10.1080/13546780903266188.
Pearl, J. (1988). Probabilistic reasoning in intelligent systems. San Mateo, CA: MorganKaufman.
Politzer, G. (2011). Solving natural syllogisms. In K. Manktelow, D. Over, & S.Elqayam (Eds.), The science of reason: A festschrift for Jonathan St. B.T. Evans(pp. 19–36). Hove: Psychology Press.
Revlin, R., & Leirer, V. (1978). The effect of personal biases on syllogistic reasoning:Rational decisions from personalized representations. In R. Revlin & R. E. Mayer(Eds.), Human reasoning (pp. 51–81). New York: Wiley.
Revlis, R. (1975b). Two models of syllogistic reasoning: Feature selection andconversion. Journal of Verbal Learning and Verbal Behavior, 14, 180–195. http://dx.doi.org/10.1016/S0022-5371(75)80064-8.
Revlis, R. (1975a). Syllogistic reasoning: Logical decisions from a complex database.In R. J. Falmagne (Ed.), Reasoning: Representation and process in children andadults (pp. 93–133). Hillsdale, NJ: Erlbaum.
Rips, L. J. (1994). The psychology of proof: Deductive reasoning in human thinking.Cambridge, MA: MIT Press.
Rips, L. J. (2001). Two kinds of reasoning. Psychological Science, 12, 129–134. http://dx.doi.org/10.1111/1467-9280.00322.
Roberts, M. J., Newstead, S. E., & Griggs, R. A. (2001). Quantifier interpretation andsyllogistic reasoning. Thinking & Reasoning, 7, 173–204. http://dx.doi.org/10.1080/13546780143000008.
Sells, S. B. (1936). The atmosphere effect: An experimental study of reasoning.Archives of Psychology, 200, 1–72.
Sidman, M., Rauzin, R., Lazar, R., Cunningham, S., Tailby, W., & Carrigan, P. (1982). Asearch for symmetry in the conditional discriminations of rhesus monkeys,baboons, and children. Journal of the Experimental Analysis of Behavior, 37,23–44. http://dx.doi.org/10.1901/jeab.1982.37-23.
Staudenmayer, H. (1975). Understanding conditional reasoning with meaningfulpropositions. In R. J. Falmagne (Ed.), Reasoning: Representation and process inchildren and adults (pp. 55–79). Hillsdale, NJ: Erlbaum.
Stenning, K., & Oberlander, J. (1993). Nonsentential representation andnonformality. Behavioral and Brain Sciences, 16, 365–366. http://dx.doi.org/10.1017/S0140525X00030612.
Stenning, K., & Oberlander, J. (1995). A cognitive theory of graphical and linguisticreasoning: Logic and implementation. Cognitive Science, 19, 97–140. http://dx.doi.org/10.1207/s15516709cog1901_3.
Stupple, E. J. N., & Ball, L. J. (2007). Figural effects in a syllogistic evaluationparadigm: An inspection-time analysis. Experimental Psychology, 54, 120–127.http://dx.doi.org/10.1027/1618-3169.54.2.120.
Tenenbaum, J. B., Kemp, C., Griffiths, T. L., & Goodman, N. D. (2011). How to grow amind: Statistics, structure, and abstraction. Science, 331, 1279–1285. http://dx.doi.org/10.1126/science.1192788.
Tversky, A., & Kahneman, D. (1980). Causal schemas in judgments underuncertainty. In M. Fishbein (Ed.). Progress in social psychology (Vol. 1,pp. 49–72). Hillsdale, NJ: Erlbaum.
Villejoubert, G., & Mandel, D. R. (2002). The inverse fallacy: An account of deviationsfrom Bayes’s theorem and the additivity principle. Memory & Cognition, 30,171–178. http://dx.doi.org/10.3758/BF03195278.
Wetherrick, N. E. (1993). More models just means more difficulty. Behavioral andBrain Sciences, 16, 367–368. http://dx.doi.org/10.1017/S0140525X00030648.

320 M. Hattori / Cognition 157 (2016) 296–320
Wilkins, M. C. (1928). The effect of changed material on ability to do formalsyllogistic reasoning. Archives of Psychology, 102, 1–88.
Wolfe, C. R. (1995). Information seeking on Bayesian conditional probabilityproblems: A fuzzy-trace theory account. Journal of Behavioral Decision Making, 8,85–108.
Woodworth, R. S., & Sells, S. B. (1935). An atmosphere effect in formal syllogisticreasoning. Journal of Experimental Psychology, 18, 451–460. http://dx.doi.org/10.1037/h0060520.