probabilistic causal analysis for system safety risk ... · 17 probabilistic causal analysis for...
TRANSCRIPT
17
Probabilistic Causal Analysis for System Safety Risk Assessments in Commercial Air Transport
James T. Luxhøj, Ph.D.; Department of Industrial and Systems Engineering, Rutgers University;96 Frelinghuysen Road, Piscataway, NJ 08854-8018 USA
Keywords: Aviation Safety, Risk Management
Abstract
Aviation is one of the critical modes of our national transportation system. As such, it is essentialthat new technologies be continually developed to ensure that a safe mode of transportationbecomes even safer in the future. The NASA Aviation Safety Program (AvSP) is managing thedevelopment of new technologies and interventions aimed at reducing the fatal aviation accidentrate by a factor of 5 by year 2007 and by a factor of 10 by year 2022. A portfolio assessment iscurrently being conducted to determine the projected impact that the new technologies and/orinterventions may have on reducing aviation safety system risk. This paper reports on advancedrisk analytics that combine the use of a human error taxonomy, probabilistic Bayesian BeliefNetworks, and case-based scenarios to assess a relative risk intensity metric. A sample case isused for illustrative purposes.
Introduction
Commercial air transportation in the United States is a complex array of many diverse, yetinterrelated system components. There is a plethora of varied human, technical, environmental,and organizational factors that affect the performance of the National Airspace System (NAS).Through the years, numerous qualitative and quantitative approaches to aviation riskidentification, modeling, and evaluation have been developed and have contributed in a seminalway to the understanding of aviation safety risk [1]. However, while methods exist foridentifying aviation risk factors, there is a paucity of analytical methods for analyzing andinterpreting the complex interactions of the various system risk factors. There has been apersistent need to develop advanced risk analytics that move beyond the essential identification ofrisk factors to enhanced system modeling and evaluation of complex causality as well as toassessing various combinations of risk mitigation strategies [2-8].
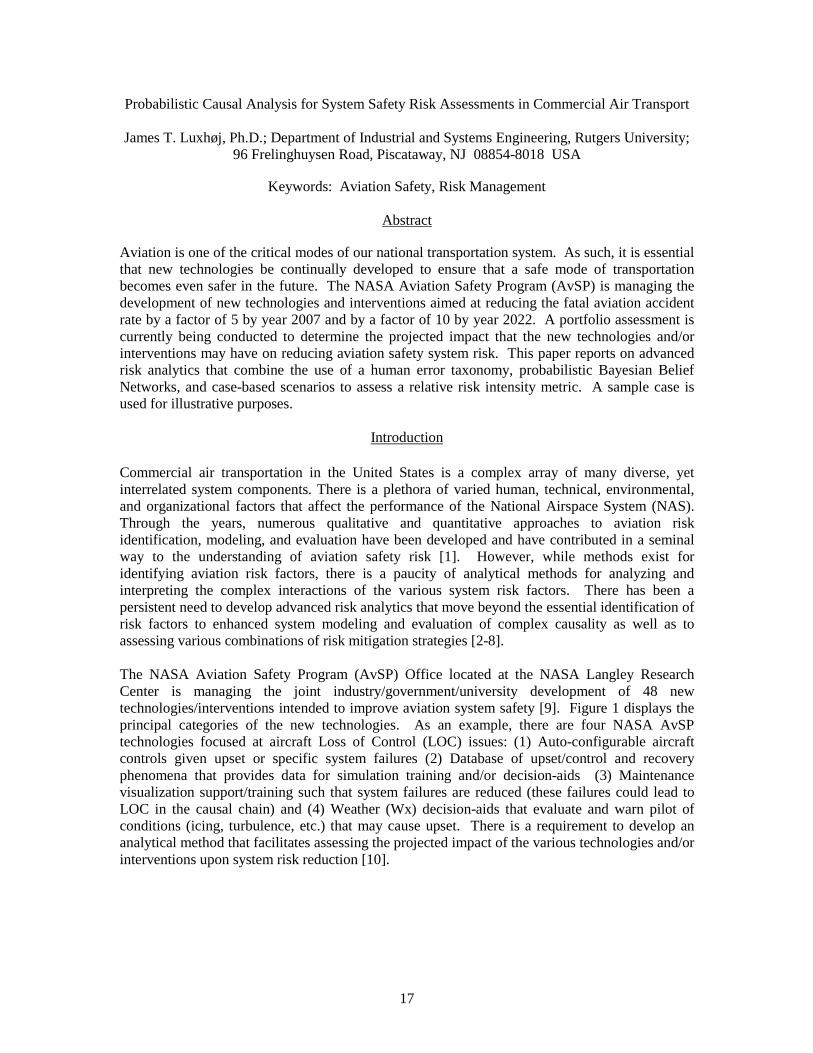
The NASA Aviation Safety Program (AvSP) Office located at the NASA Langley ResearchCenter is managing the joint industry/government/university development of 48 newtechnologies/interventions intended to improve aviation system safety [9]. Figure 1 displays theprincipal categories of the new technologies. As an example, there are four NASA AvSPtechnologies focused at aircraft Loss of Control (LOC) issues: (1) Auto-configurable aircraftcontrols given upset or specific system failures (2) Database of upset/control and recoveryphenomena that provides data for simulation training and/or decision-aids (3) Maintenancevisualization support/training such that system failures are reduced (these failures could lead toLOC in the causal chain) and (4) Weather (Wx) decision-aids that evaluate and warn pilot ofconditions (icing, turbulence, etc.) that may cause upset. There is a requirement to develop ananalytical method that facilitates assessing the projected impact of the various technologies and/orinterventions upon system risk reduction [10].
18
Figure 1 - Categorical Overview of NASA Technologies
Luxhøj, et al. [11-14] report on the development of an Aviation System Risk Model (ASRM) thatuses the underlying probabilistic methodology of Bayesian Belief Networks (BBNs) andinfluence diagrams to graphically portray causal factor interactions. The ASRM uses theInformation Technology (IT) embedded in the HUGIN BBN software as an enabling technology[14]. HUGIN is software to facilitate BBN modeling [15-17]. The ASRM is being modified tographically portray a risk metric, termed the relative risk intensity, to illustrate perturbations froma baseline period. In Phase 1 of this research, aircraft accident scenarios, such as Loss of Control(LOC) and Maintenance (MAIN)-related, have been developed using the combined approach ofanalytic generalization from case studies [18] and from knowledge engineering sessions withsubject matter experts (SMEs). van Vurren [19] uses a similar approach in his study of mishaps inthe steel industry and medical domain.
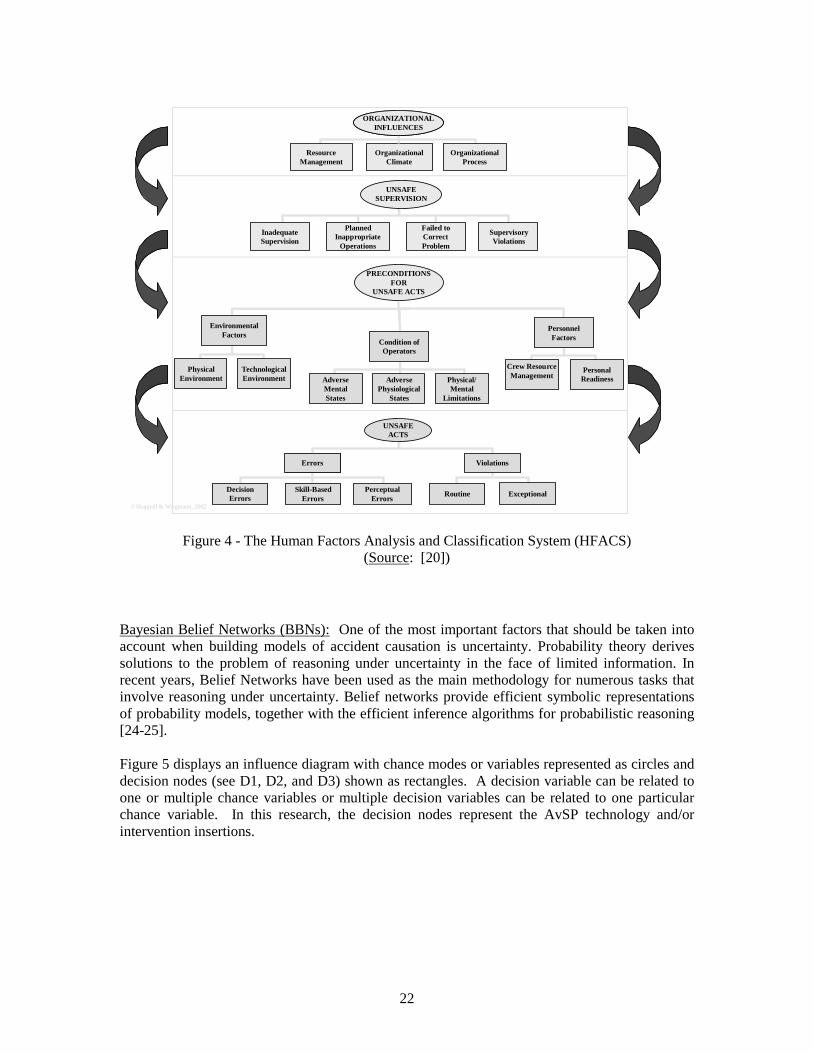
Typically, 60%-80% of all accidents are attributed to human error. While mechanical,environmental, and operational factors are necessarily to be included in a full system precursoranalysis, certainly, understanding human error is essential to aviation system risk modeling. In arecent research modification, the ASRM has been adapted to include the Human Factors Analysisand Classification System (HFACS) [20-22] taxonomy to expand the examination of humancausal factors and to support the identification of safety risk intervention strategies. HFACS [21]focuses on human error modeling and includes organizational influences (resource management,organizational climate, and organizational processes), preconditions for unsafe acts (adversemental states, adverse physiological states, physical/mental limitations, crew resourcesmanagement, and personal readiness), and individual unsafe acts (decision errors, skill-basederrors, perceptual errors, routine violations, and exceptional violations). While other generaldomain taxonomies exist for the classification of human error, such as the EindhovenClassification Method (ECM) [19], HFACS is becoming widely disseminated in both military
Aviation Safety Program (Aviation Safety Program (AvSPAvSP) Products) Products
Vehicle Safety
Technologies
Vehicle Safety
Technologies
Weather Safety
Technologies
Weather Safety
Technologies
System Safety
Technologies
System Safety
Technologies
Single AircraftAccident Prevention
(SAAP)
Single AircraftAccident Prevention
(SAAP)
AccidentMitigation (AM)
AccidentMitigation (AM)
Synthetic VisionSystems (SVS)
Synthetic VisionSystems (SVS)
Weather AccidentPrevention (WxAP)
Weather AccidentPrevention (WxAP)
System-WideAccident Prevention
(SWAP)
System-WideAccident Prevention
(SWAP)
Aviation SystemMonitoring & Modeling
(ASMM)
Aviation SystemMonitoring & Modeling
(ASMM)
Aircraft Icing (AI)Aircraft Icing (AI)
19
and commercial organizations as a tool for understanding the role of human error in aviationaccident analysis. Shappell and Wiegmann have led an effort to code all military, commercialand general aviation accidents in the United States using the HFACS framework. The databaseconsists of over 16,000 aviation accidents involving human error and includes all the Parts 121and 135, scheduled and non-scheduled, airline accidents since 1990. These data are being used inthe ASRM to initially seed the model and to facilitate exercising the model.
The ASRM prototype methodology and tool have been through an initial testing and evaluationperiod and offer promise. However, additional analytical research and tool development arerequired in order to realize the full potential of this new type of system risk model. The jointresearch between the Federal Aviation Administration (FAA), NASA, and Rutgers Universityinvolves extending the ASRM to modeling the complex interactions of the many diverse human,technical, environmental, and organizational factors that affect commercial air transportation.The intent of the new research is to develop more comprehensive ASRM case studies reflectiveof multiple accident scenarios selected by the NASA Aviation Safety Program (AvSP). The casestudies model the change in system safety risk within the accident scenarios due to risk mitigationstrategies proposed by NASA AvSP by examining the impact that technology insertions and/orinterventions may have on reducing the relative system safety risk. For example, it is envisionedthat the size of the HFACS database will exercise the ASRM and yield a model capable ofevaluating the NASA AvSP intervention/mitigation strategies focused on human factors beforethey are fielded. Eventually, other data sources dealing with mechanical, software,environmental, and operational risk factors will be integrated into the ASRM as these datasources become available.
Risk Analytics
Risk is a mathematical expression that has two components - likelihood and severity. Risk is anexpression that attempts to answer two questions at the same time; how likely? and with whatconsequence? These components of risk can be defined as follows:
HazardA hazard implies any event that has the potential to produce an adverse outcome with respect
to the system. The system can refer to a piece of equipment or a single engine or an entireairplane [23]. In most situations, the fact that a hazard is present does not necessarily mean thatthere will be an adverse outcome with respect to a system. A “successful” hazard is an eventwhen a hazard attacks the system and results in damages.
LikelihoodLikelihood or probability represents the chance that a given hazard will lead to an adverse
impact on a system. It can be described qualitatively as well as quantitatively.
SeveritySeverity represents the damages that result in the case of successful hazard event. The severitycould be measured in terms of dollar value, human life or etc. Risk, in its quantitative form, riskcan be expressed as follows:
R = P * S
where R is risk, P is probability or likelihood of an event and S is severity.
20
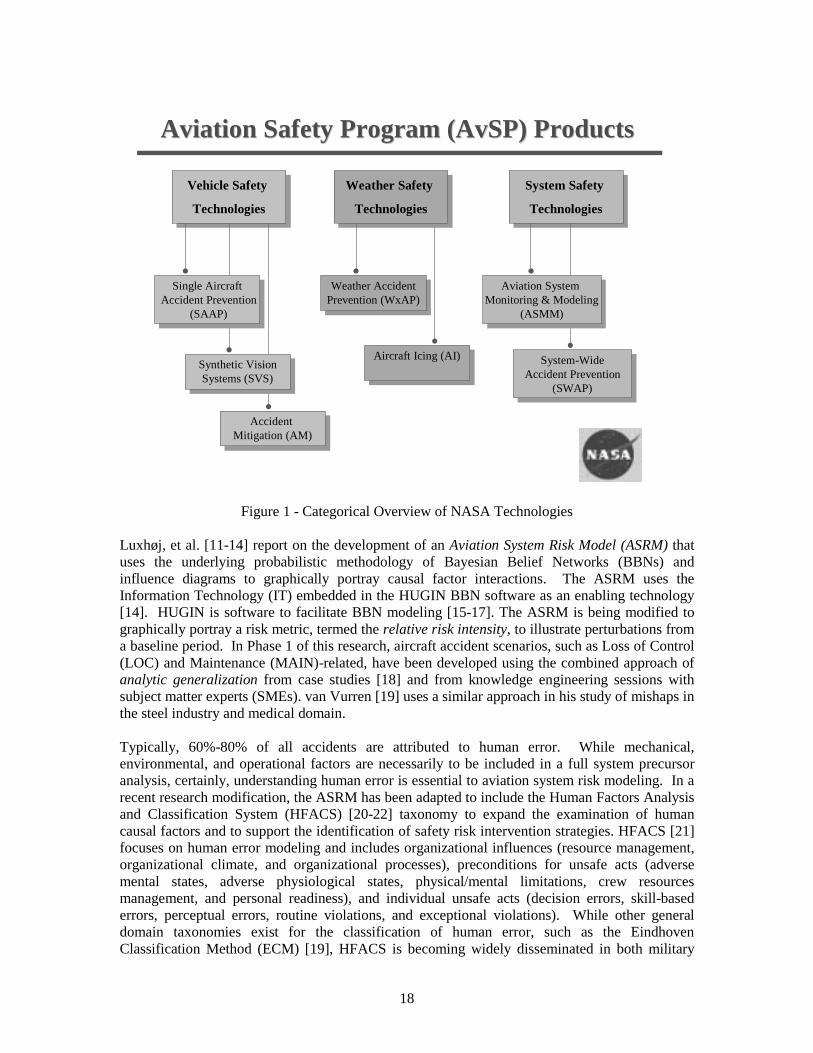
Since it is not always possible to calculate the risk quantitatively or since it is sometimesnecessary to assign qualitative descriptions to likelihood and damages, risk is frequentlyexpressed in relative or qualitative terms. Figure 2 illustrates qualitative descriptions oflikelihood, severity and risk developed by the FAA’s Office of System Safety (ASY-300).
FAA Order 8040.4 establishes the safety risk management policy and prescribes procedures forimplementing safety risk management as a decisionmaking tool within the FAA (seehttp://www.asy.faa.gov). This document provides general guidelines and principles for safety riskassessment and risk characterization.
Figure 2 - Risk Matrix(Source: ASY–300, Office of System Safety, FAA)
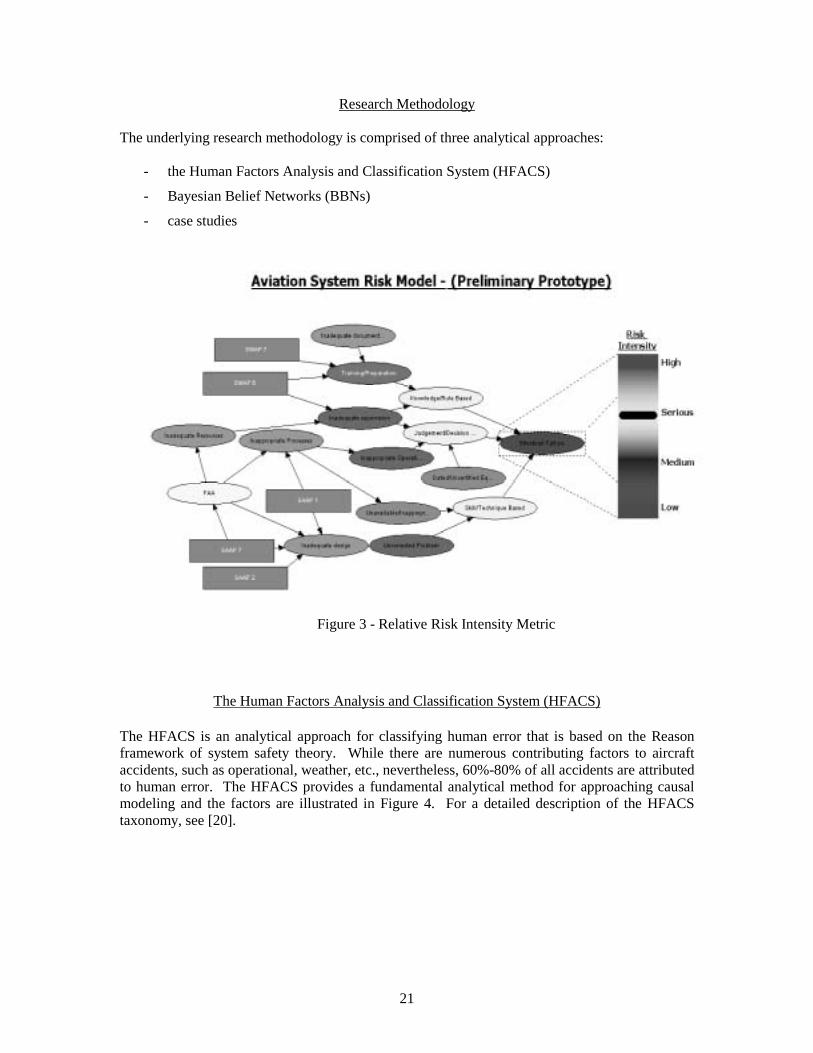
Relative Risk Intensity Metric: This research introduces the notion of a relative risk intensitymetric. This metric uses the matrix cells of Figure 2 to create a visual profile of risk relative tosome baseline. Note that the risk matrix in Figure 2 is a 5 x 4 matrix. Thus, from observingFigure 2, the following risk intensity levels are computed:
# of cells Risk Intensity Level3/20 0%-15% Low8/20 15% - 55% Medium4/20 55% - 75% Serious5/20 75% - 100% High
Figure 3 displays the use of the relative risk intensity combined with an influence diagram. TheASRM itself facilitates the computation of the likelihood portion of risk, or notionally, the“intensity”. To fully understand risk, the ASRM software prototype is also being updated toenable the user to view a severity histogram per accident type (e.g., LOC, Controlled Flight IntoTerrain (CFIT), etc.) as determined by data analysis.
21
Research Methodology
The underlying research methodology is comprised of three analytical approaches:
- the Human Factors Analysis and Classification System (HFACS)
- Bayesian Belief Networks (BBNs)
- case studies
The Human Factors Analysis and Classification System (HFACS)
The HFACS is an analytical approach for classifying human error that is based on the Reasonframework of system safety theory. While there are numerous contributing factors to aircraftaccidents, such as operational, weather, etc., nevertheless, 60%-80% of all accidents are attributedto human error. The HFACS provides a fundamental analytical method for approaching causalmodeling and the factors are illustrated in Figure 4. For a detailed description of the HFACStaxonomy, see [20].
Figure 3 - Relative Risk Intensity Metric
22
Figure 4 - The Human Factors Analysis and Classification System (HFACS)(Source: [20])
Bayesian Belief Networks (BBNs): One of the most important factors that should be taken intoaccount when building models of accident causation is uncertainty. Probability theory derivessolutions to the problem of reasoning under uncertainty in the face of limited information. Inrecent years, Belief Networks have been used as the main methodology for numerous tasks thatinvolve reasoning under uncertainty. Belief networks provide efficient symbolic representationsof probability models, together with the efficient inference algorithms for probabilistic reasoning[24-25].
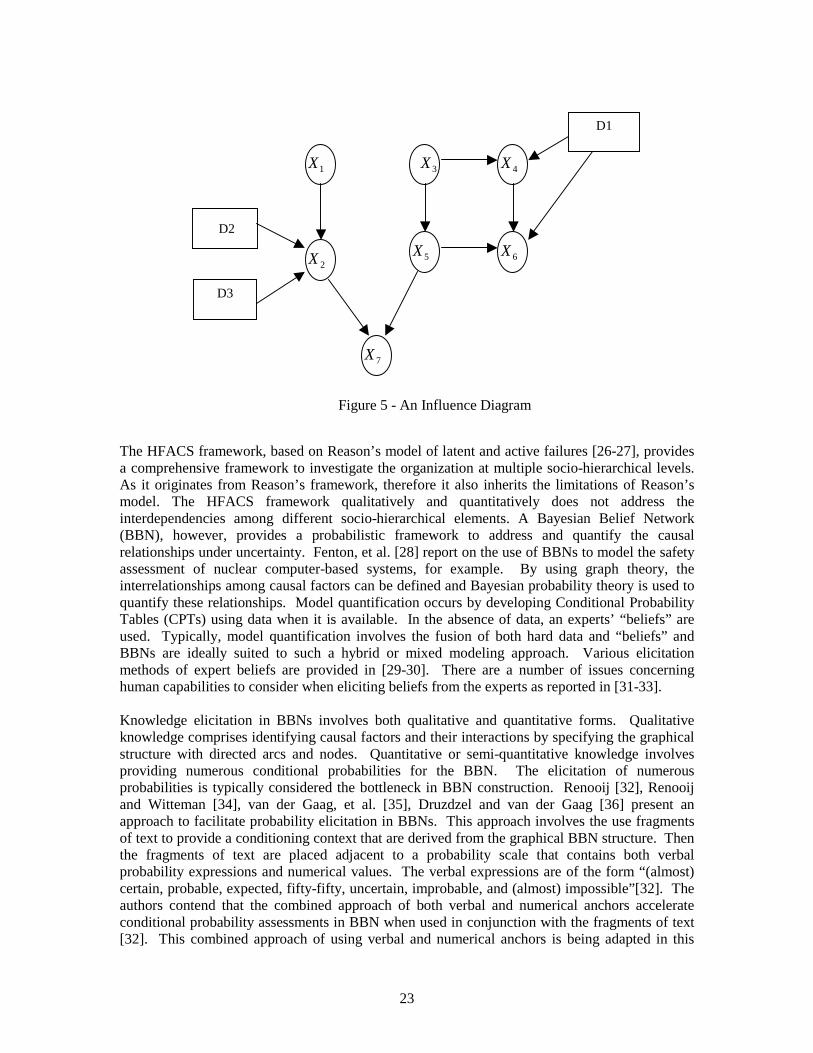
Figure 5 displays an influence diagram with chance modes or variables represented as circles anddecision nodes (see D1, D2, and D3) shown as rectangles. A decision variable can be related toone or multiple chance variables or multiple decision variables can be related to one particularchance variable. In this research, the decision nodes represent the AvSP technology and/orintervention insertions.
Shappell & Wiegmann, 2002
Errors
UNSAFEACTS
Errors
PerceptualErrors
Skill-BasedErrors
DecisionErrors
ExceptionalRoutine
Violations
InadequateSupervision
PlannedInappropriate
Operations
Failed toCorrectProblem
SupervisoryViolations
UNSAFESUPERVISION
ResourceManagement
OrganizationalClimate
OrganizationalProcess
ORGANIZATIONALINFLUENCES
PRECONDITIONSFOR
UNSAFE ACTS
Condition ofOperators
Physical/Mental
Limitations
AdverseMentalStates
TechnologicalEnvironment
PhysicalEnvironment
PersonalReadiness
Crew ResourceManagement
PersonnelFactors
AdversePhysiological
States
EnvironmentalFactors
23
The HFACS framework, based on Reason’s model of latent and active failures [26-27], providesa comprehensive framework to investigate the organization at multiple socio-hierarchical levels.As it originates from Reason’s framework, therefore it also inherits the limitations of Reason’smodel. The HFACS framework qualitatively and quantitatively does not address theinterdependencies among different socio-hierarchical elements. A Bayesian Belief Network(BBN), however, provides a probabilistic framework to address and quantify the causalrelationships under uncertainty. Fenton, et al. [28] report on the use of BBNs to model the safetyassessment of nuclear computer-based systems, for example. By using graph theory, theinterrelationships among causal factors can be defined and Bayesian probability theory is used toquantify these relationships. Model quantification occurs by developing Conditional ProbabilityTables (CPTs) using data when it is available. In the absence of data, an experts’ “beliefs” areused. Typically, model quantification involves the fusion of both hard data and “beliefs” andBBNs are ideally suited to such a hybrid or mixed modeling approach. Various elicitationmethods of expert beliefs are provided in [29-30]. There are a number of issues concerninghuman capabilities to consider when eliciting beliefs from the experts as reported in [31-33].
Knowledge elicitation in BBNs involves both qualitative and quantitative forms. Qualitativeknowledge comprises identifying causal factors and their interactions by specifying the graphicalstructure with directed arcs and nodes. Quantitative or semi-quantitative knowledge involvesproviding numerous conditional probabilities for the BBN. The elicitation of numerousprobabilities is typically considered the bottleneck in BBN construction. Renooij [32], Renooijand Witteman [34], van der Gaag, et al. [35], Druzdzel and van der Gaag [36] present anapproach to facilitate probability elicitation in BBNs. This approach involves the use fragmentsof text to provide a conditioning context that are derived from the graphical BBN structure. Thenthe fragments of text are placed adjacent to a probability scale that contains both verbalprobability expressions and numerical values. The verbal expressions are of the form “(almost)certain, probable, expected, fifty-fifty, uncertain, improbable, and (almost) impossible”[32]. Theauthors contend that the combined approach of both verbal and numerical anchors accelerateconditional probability assessments in BBN when used in conjunction with the fragments of text[32]. This combined approach of using verbal and numerical anchors is being adapted in this
1X
2X
3X 4X
5X 6X
7X
D1
D2
D3
Figure 5 - An Influence Diagram
24
research to assist with probability elicitations for the BBNs dealing with risk assessments of theAvSP technologies/interventions.
The ASRM research uses a case study approach. With a case study approach, statisticalgeneralization is not used. In statistical generalization the samples are chosen randomly and thengeneralization is observed as a replication of a specific behavior. However, cases are not randomsamples and each case study represents a unique portrayal. Rather, with case study research,analytic generalization and a replication logic is used to generalize to a theory, in this case,system safety theory [18]. Therefore, multiple case studies can be considered as multipleexperiments. If two or more case studies show the same behavior, replication can be claimed;however if contrasting results are produced, there should be predictable reasons for this divergentbehavior. While specific case studies are used to initiate a dialogue-based process, the resultinginfluence diagram represents a realistic portrayal of a more generalized model.
Data Analysis: Some key data sources are briefly described below:
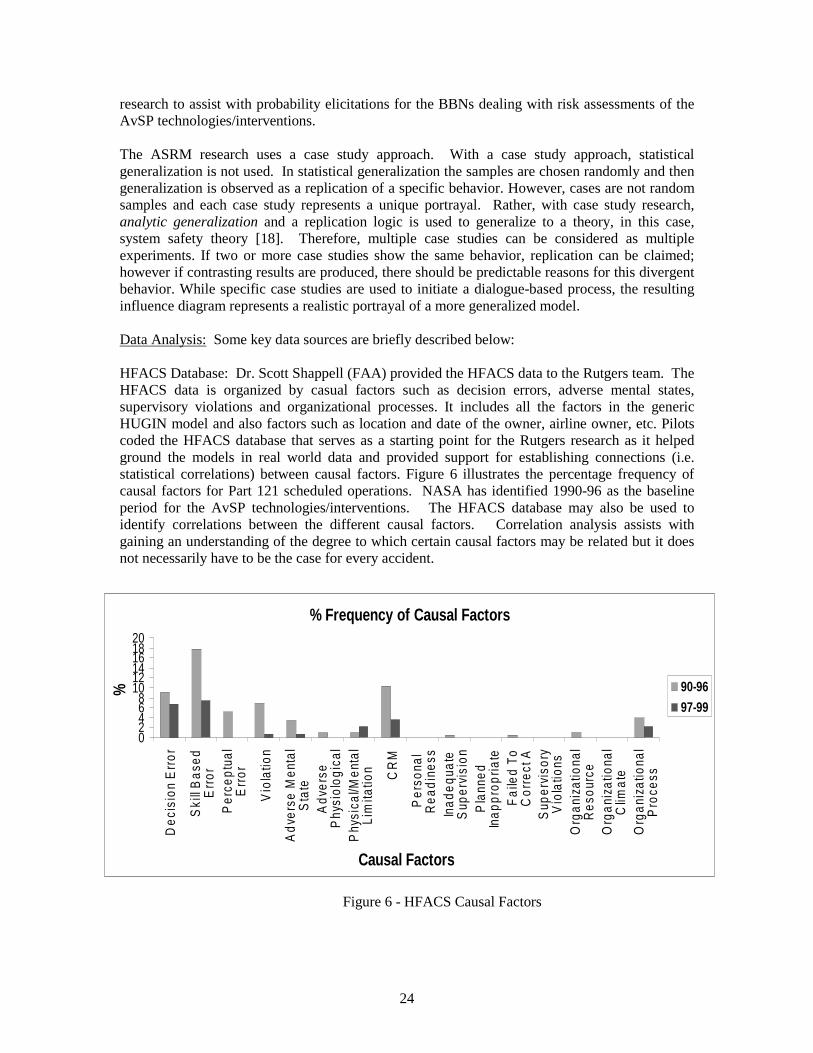
HFACS Database: Dr. Scott Shappell (FAA) provided the HFACS data to the Rutgers team. TheHFACS data is organized by casual factors such as decision errors, adverse mental states,supervisory violations and organizational processes. It includes all the factors in the genericHUGIN model and also factors such as location and date of the owner, airline owner, etc. Pilotscoded the HFACS database that serves as a starting point for the Rutgers research as it helpedground the models in real world data and provided support for establishing connections (i.e.statistical correlations) between causal factors. Figure 6 illustrates the percentage frequency ofcausal factors for Part 121 scheduled operations. NASA has identified 1990-96 as the baselineperiod for the AvSP technologies/interventions. The HFACS database may also be used toidentify correlations between the different causal factors. Correlation analysis assists withgaining an understanding of the degree to which certain causal factors may be related but it doesnot necessarily have to be the case for every accident.
3.5 Summary of Research Approach
% Frequency of Causal Factors
02468
101214161820
Dec
isio
nE
rror
Ski
llB
ased
Err
orP
erce
ptua
lE
rror
Vio
latio
n
Adv
erse
Men
tal
Sta
teA
dver
seP
hysi
olog
ical
Phy
sica
l/Men
tal
Lim
itatio
n CR
M
Per
sona
lR
eadi
ness
Inad
equa
teS
uper
visi
onP
lann
edIn
appr
opria
teF
aile
dTo
Cor
rect
AS
uper
viso
ryV
iola
tions
Org
aniz
atio
nal
Res
ourc
eO
rgan
izat
iona
lC
limat
eO
rgan
izat
iona
lP
roce
ss
Causal Factors
% 90-96
97-99
Figure 6 - HFACS Causal Factors
25
National Aviation Safety Data Analysis Center (NASDAC): The National Aviation Safety DataAnalysis Center (NASDAC) [37] is managed by the FAA. The database identifies several causalfactors and provides the possibility of identifying different types of accidents. The NASDACdatabase has a uniform data format and draws on several data sources including the NTSB.Internet accessible, it is possible to specify numerous criteria to limit the results from our datasearch. The results of the search are displayed in a Microsoft Excel sheet format. It is possible toclick on a particular accident report to access a summary description of the final NTSB report forthat accident. In this research, the NASDAC database is used to identify LOC cases and todevelop an understanding of the overall accident rates for different types of accidents.
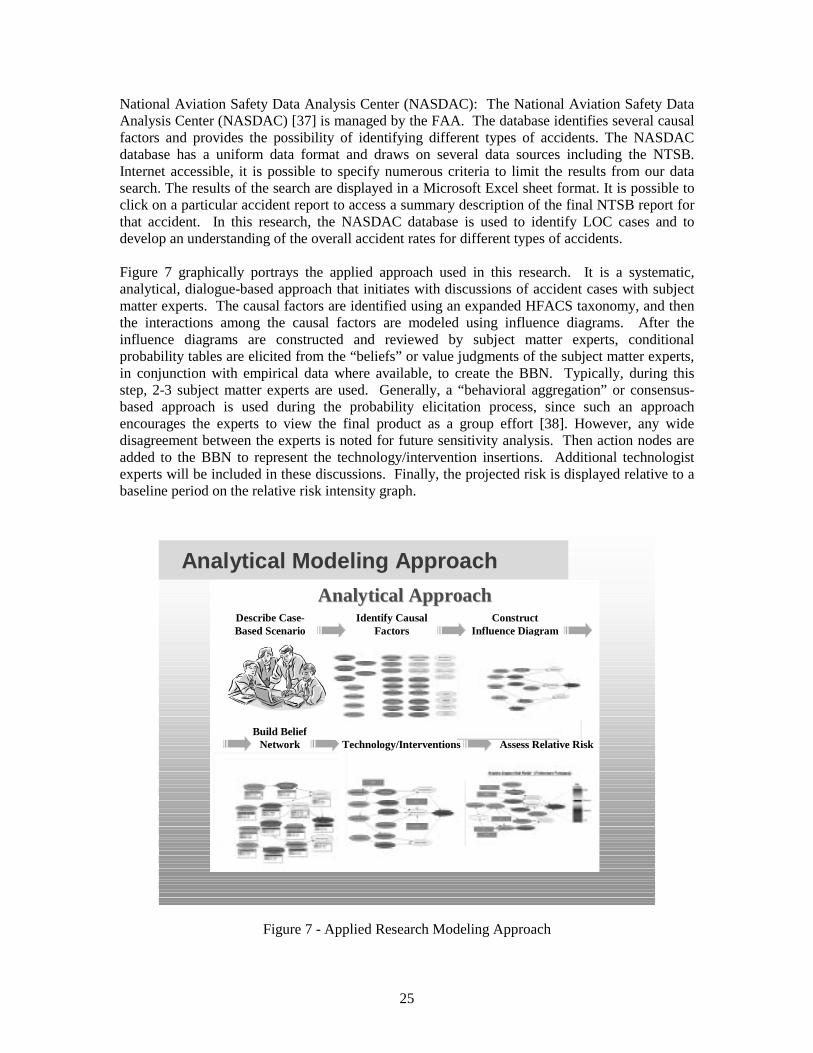
Figure 7 graphically portrays the applied approach used in this research. It is a systematic,analytical, dialogue-based approach that initiates with discussions of accident cases with subjectmatter experts. The causal factors are identified using an expanded HFACS taxonomy, and thenthe interactions among the causal factors are modeled using influence diagrams. After theinfluence diagrams are constructed and reviewed by subject matter experts, conditionalprobability tables are elicited from the “beliefs” or value judgments of the subject matter experts,in conjunction with empirical data where available, to create the BBN. Typically, during thisstep, 2-3 subject matter experts are used. Generally, a “behavioral aggregation” or consensus-based approach is used during the probability elicitation process, since such an approachencourages the experts to view the final product as a group effort [38]. However, any widedisagreement between the experts is noted for future sensitivity analysis. Then action nodes areadded to the BBN to represent the technology/intervention insertions. Additional technologistexperts will be included in these discussions. Finally, the projected risk is displayed relative to abaseline period on the relative risk intensity graph.
Analytical Modeling Approach
Analytical ApproachAnalytical ApproachDescribe Case-Based Scenario
Identify CausalFactors
ConstructInfluence Diagram
Build BeliefNetwork
InsertTechnology/Interventions Assess Relative Risk
Figure 7 - Applied Research Modeling Approach
26
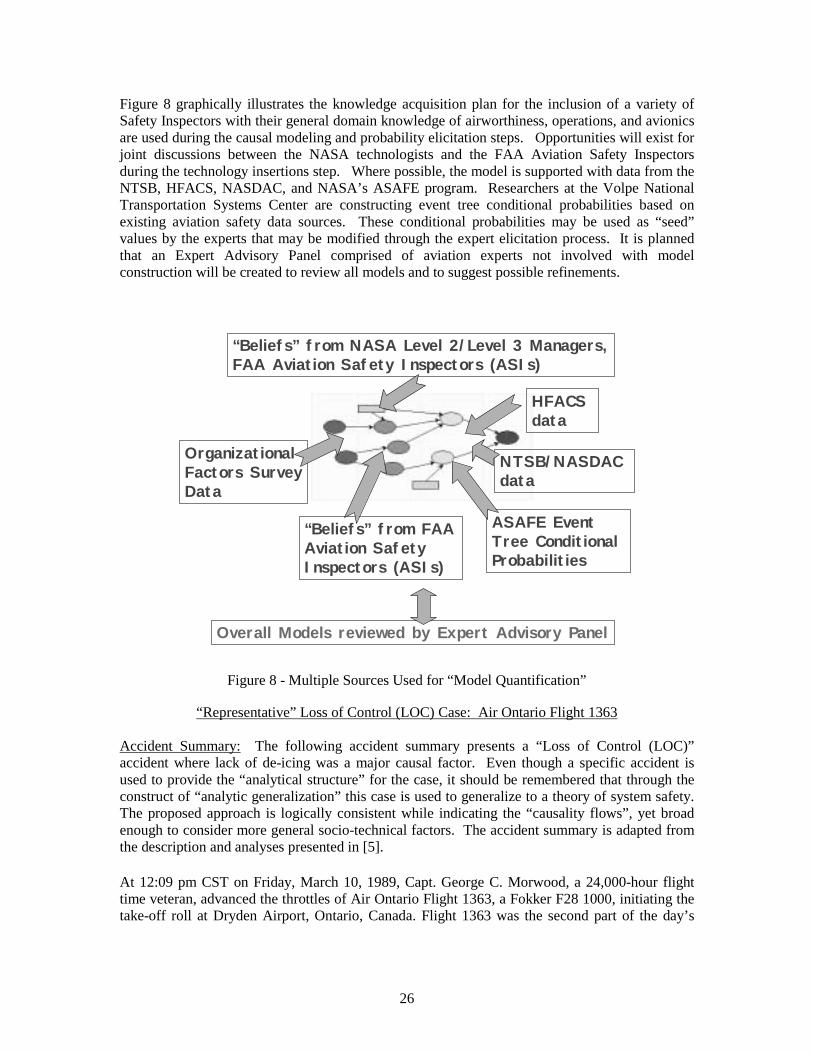
Figure 8 graphically illustrates the knowledge acquisition plan for the inclusion of a variety ofSafety Inspectors with their general domain knowledge of airworthiness, operations, and avionicsare used during the causal modeling and probability elicitation steps. Opportunities will exist forjoint discussions between the NASA technologists and the FAA Aviation Safety Inspectorsduring the technology insertions step. Where possible, the model is supported with data from theNTSB, HFACS, NASDAC, and NASA’s ASAFE program. Researchers at the Volpe NationalTransportation Systems Center are constructing event tree conditional probabilities based onexisting aviation safety data sources. These conditional probabilities may be used as “seed”values by the experts that may be modified through the expert elicitation process. It is plannedthat an Expert Advisory Panel comprised of aviation experts not involved with modelconstruction will be created to review all models and to suggest possible refinements.
“Beliefs” from FAA Aviation Safety Inspectors (ASIs)
“Beliefs” from NASA Level 2/Level 3 Managers, FAA Aviation Safety Inspectors (ASIs)
Organizational Factors Survey Data
ASAFE Event Tree Conditional Probabilities
Overall Models reviewed by Expert Advisory Panel
HFACS data
NTSB/NASDAC data
Figure 8 - Multiple Sources Used for “Model Quantification”
“Representative” Loss of Control (LOC) Case: Air Ontario Flight 1363
Accident Summary: The following accident summary presents a “Loss of Control (LOC)”accident where lack of de-icing was a major causal factor. Even though a specific accident isused to provide the “analytical structure” for the case, it should be remembered that through theconstruct of “analytic generalization” this case is used to generalize to a theory of system safety.The proposed approach is logically consistent while indicating the “causality flows”, yet broadenough to consider more general socio-technical factors. The accident summary is adapted fromthe description and analyses presented in [5].
At 12:09 pm CST on Friday, March 10, 1989, Capt. George C. Morwood, a 24,000-hour flighttime veteran, advanced the throttles of Air Ontario Flight 1363, a Fokker F28 1000, initiating thetake-off roll at Dryden Airport, Ontario, Canada. Flight 1363 was the second part of the day’s
27
flying schedule that consisted of a Winnipeg to Thunder Bay round trip, with intermediate stopsat Dryden (Flights 1362/1363).
Capt. Morwood reviewed the operational status of the aircraft before departing Winnipeg (Flight1362) and verified, among other maintenance deferred detects, that the Auxiliary Power Unit(APU) was unserviceable. The operational implications of this defect were that the engines had tobe started from an external power unit, or one engine had to be kept running to cross-start theother engine. If both engines were shut down at a station where no external power unit wasavailable, the aircraft would be stranded until the APU was fixed or an external power unitbecame available. There was no external power source at Dryden and therefore one engine wouldhave to be kept running. The manufacturer, Fokker, and Air Ontario strictly prohibited de-icingwith either engine running.
Since the original flight release from Thunder Bay to Dryden prepared by the Air OntarioSystems Operations Control (SOC) had not been updated, ten passengers were added to Flight1363 after it had been refueled. Now overweight for take-off, Capt. Morwood elected to off-loadthe ten passengers and their baggage. However, the Air Ontario SOC duty manager overrode thecaptain’s decision and chose to achieve weight reduction by off-loading fuel. The de-fuelingcaused an additional 35-minute delay in the departure of Flight 1363 from Thunder Bay andincreased the “hot refueling” time at Dryden. Flight 1363 departed Thunder Bay with a full loadof passengers and arrived in Dryden one hour behind the schedule.
The hot refueling process started with passengers on board, which is considered to be an unsafepractice, and is difficult to reconcile with Capt. Morwood’s style of decision-making,characterized by conservatism and strict adherence to rules and procedures. The Commission ofInquiry indicated that Capt. Morwood had a heated conversation with the SOC over the telephoneregarding the passenger load and weather conditions in Winnipeg prior to the departure fromDryden. The Commission established that the demeanor of Capt. Morwood deteriorated visiblywhile in the terminal after his telephone contact with the SOC, and that, clearly frustrated, hebriskly walked back to the aircraft.
Upon his return to the aircraft Capt. Morwood asked the ground handler whether de-icing wasavailable; however he did not request de-icing after being told that it was. When the aircraft wasabout to leave the terminal platform, snow was falling heavily, and its wings were covered insnow to depths varying from one-eighth to one-quarter of an inch. While taxiing out, FSS advisedFlight 1363 of a Cessna 150 in a VFR recreational flight, which was due to land at Dryden. Thepilot of this aircraft had requested that Flight 1363 hold its departure until he had landed, becauseof the deteriorating weather. The request was eventually granted and the ground hold furthercompounded the delay of Flight 1363.
The combination of the one-half inch deep slush on the ground and the wet snow, which hadfrozen into opaque ice on the forward half of the wings, significantly degraded the performancecapabilities of the F-28. After a longer than normal take-off roll, the aircraft rotated, lifted offslightly, began to shudder and settled back onto the runway. It rotated a second time, lifting off atthe 5,700 ft point of the 6,000 ft runway. It flew briefly, clearing the end of the runway atapproximately 15 ft above the ground. It failed to gain altitude and crashed, coming to restapproximately one km. away from the end of the runway.
A Commission of Inquiry was formed on March 29, 1989 to investigate the accident. The DrydenReport, as it has become widely known as, represents one of the first large-scale applications of asystemic, organizational approach to the investigation of an aviation accident.
28
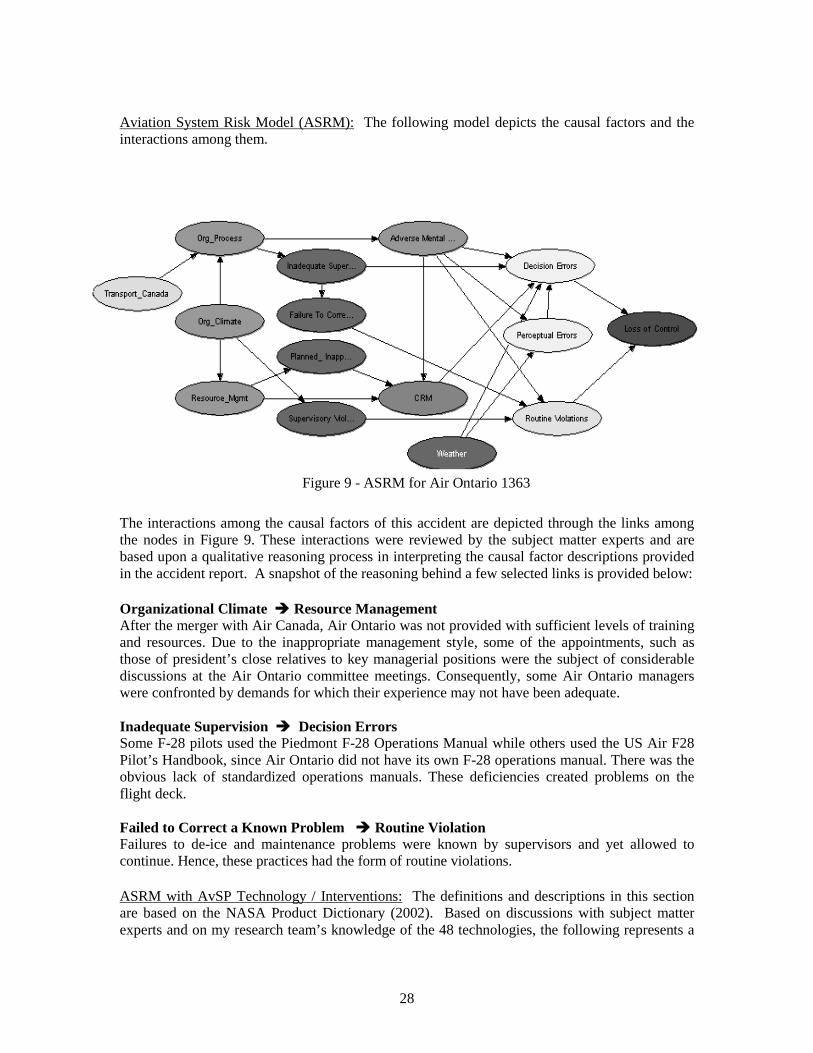
Aviation System Risk Model (ASRM): The following model depicts the causal factors and theinteractions among them.
The interactions among the causal factors of this accident are depicted through the links amongthe nodes in Figure 9. These interactions were reviewed by the subject matter experts and arebased upon a qualitative reasoning process in interpreting the causal factor descriptions providedin the accident report. A snapshot of the reasoning behind a few selected links is provided below:
Organizational Climate ! Resource ManagementAfter the merger with Air Canada, Air Ontario was not provided with sufficient levels of trainingand resources. Due to the inappropriate management style, some of the appointments, such asthose of president’s close relatives to key managerial positions were the subject of considerablediscussions at the Air Ontario committee meetings. Consequently, some Air Ontario managerswere confronted by demands for which their experience may not have been adequate.
Inadequate Supervision ! Decision ErrorsSome F-28 pilots used the Piedmont F-28 Operations Manual while others used the US Air F28Pilot’s Handbook, since Air Ontario did not have its own F-28 operations manual. There was theobvious lack of standardized operations manuals. These deficiencies created problems on theflight deck.
Failed to Correct a Known Problem ! Routine ViolationFailures to de-ice and maintenance problems were known by supervisors and yet allowed tocontinue. Hence, these practices had the form of routine violations.
ASRM with AvSP Technology / Interventions: The definitions and descriptions in this sectionare based on the NASA Product Dictionary (2002). Based on discussions with subject matterexperts and on my research team’s knowledge of the 48 technologies, the following represents a
Figure 9 - ASRM for Air Ontario 1363
29
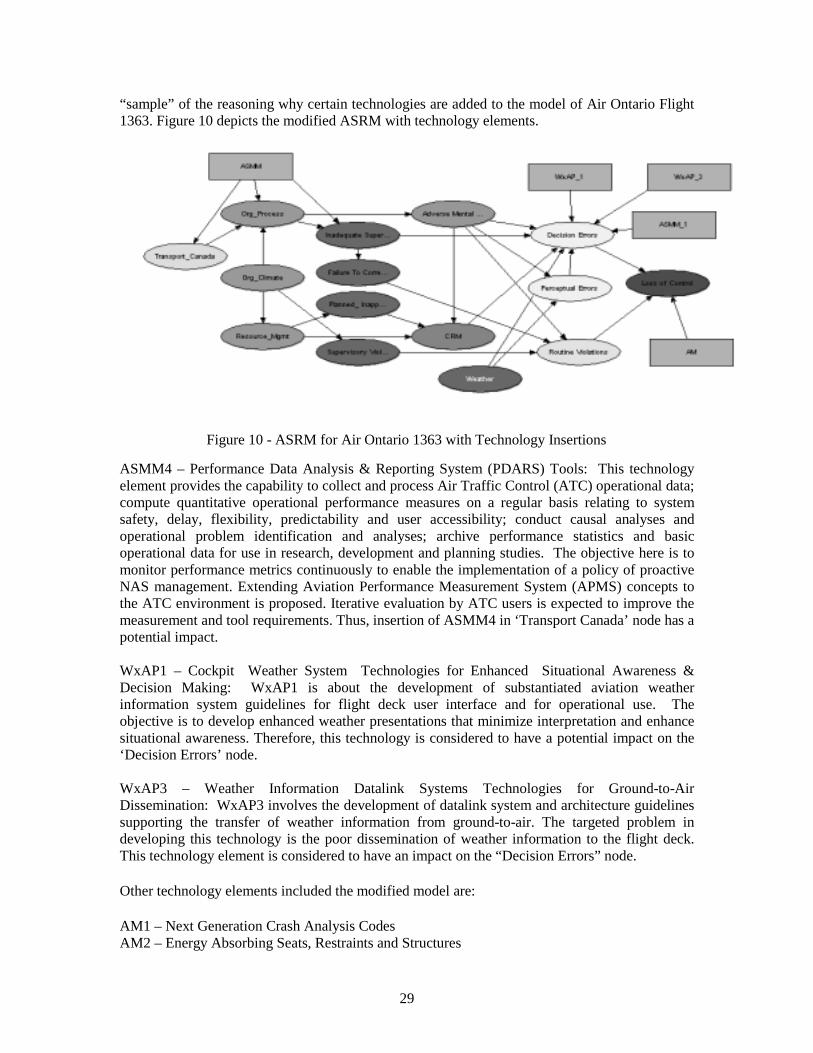
“sample” of the reasoning why certain technologies are added to the model of Air Ontario Flight1363. Figure 10 depicts the modified ASRM with technology elements.
ASMM4 – Performance Data Analysis & Reporting System (PDARS) Tools: This technologyelement provides the capability to collect and process Air Traffic Control (ATC) operational data;compute quantitative operational performance measures on a regular basis relating to systemsafety, delay, flexibility, predictability and user accessibility; conduct causal analyses andoperational problem identification and analyses; archive performance statistics and basicoperational data for use in research, development and planning studies. The objective here is tomonitor performance metrics continuously to enable the implementation of a policy of proactiveNAS management. Extending Aviation Performance Measurement System (APMS) concepts tothe ATC environment is proposed. Iterative evaluation by ATC users is expected to improve themeasurement and tool requirements. Thus, insertion of ASMM4 in ‘Transport Canada’ node has apotential impact.
WxAP1 – Cockpit Weather System Technologies for Enhanced Situational Awareness &Decision Making: WxAP1 is about the development of substantiated aviation weatherinformation system guidelines for flight deck user interface and for operational use. Theobjective is to develop enhanced weather presentations that minimize interpretation and enhancesituational awareness. Therefore, this technology is considered to have a potential impact on the‘Decision Errors’ node.
WxAP3 – Weather Information Datalink Systems Technologies for Ground-to-AirDissemination: WxAP3 involves the development of datalink system and architecture guidelinessupporting the transfer of weather information from ground-to-air. The targeted problem indeveloping this technology is the poor dissemination of weather information to the flight deck.This technology element is considered to have an impact on the “Decision Errors” node.
Other technology elements included the modified model are:
AM1 – Next Generation Crash Analysis CodesAM2 – Energy Absorbing Seats, Restraints and Structures
Figure 10 - ASRM for Air Ontario 1363 with Technology Insertions

30
AM4 – Next Generation Crashworthiness Design GuidelinesASMM1 – Incident Reporting Enhancement ToolsASMM2 – National Aviation System Operational Monitoring System (NAOMS)
Preliminary Results
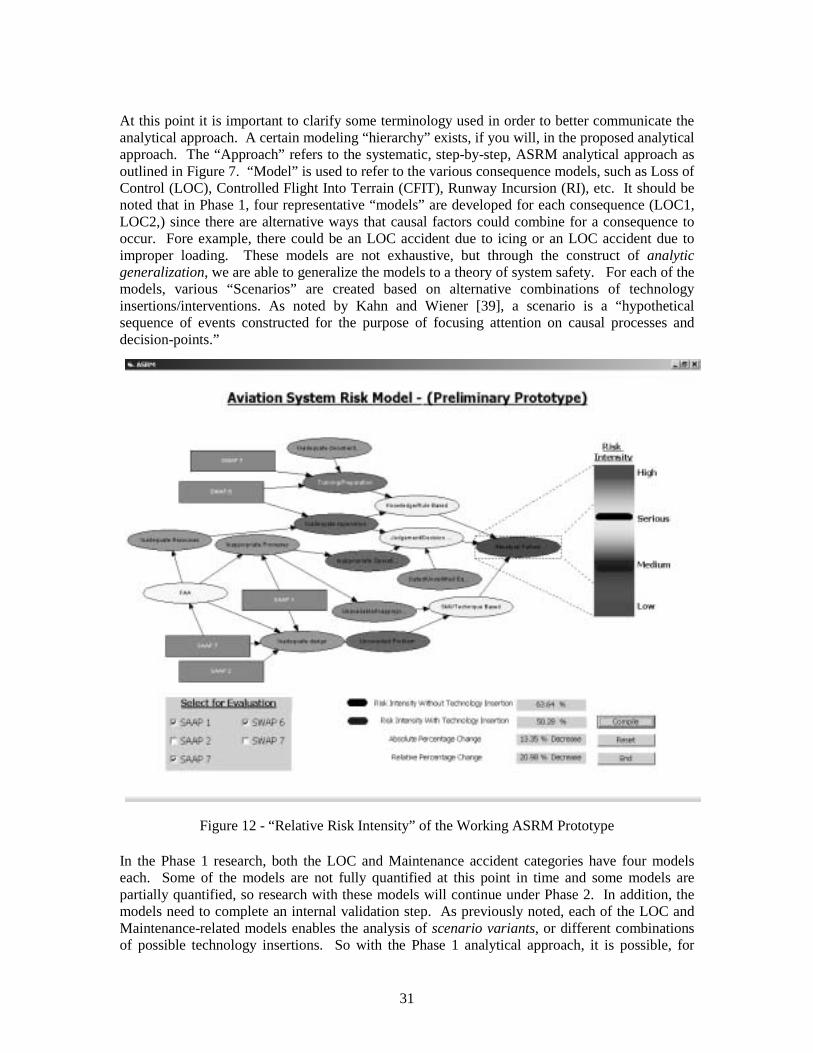
Figures 11-12 display screens from the working ASRM prototype that were developed during thePhase 1 research. Figure 12 displays, in general, how the interactions of various causal factorsmay be depicted, but does not correspond to the aforementioned LOC model. Possible technologyinsertions are easily portrayed. The working prototype enables sensitivity analyses for bothsingle- and multiple technology insertions. Note that one technology may impact a single and/ormultiple causal factors and that multiple technologies may also impact a single and/or multiplecausal factors. Changes in relative risk intensity may be displayed on the color-coded bar chart.Both absolute and relative perturbations from a baseline are reported.
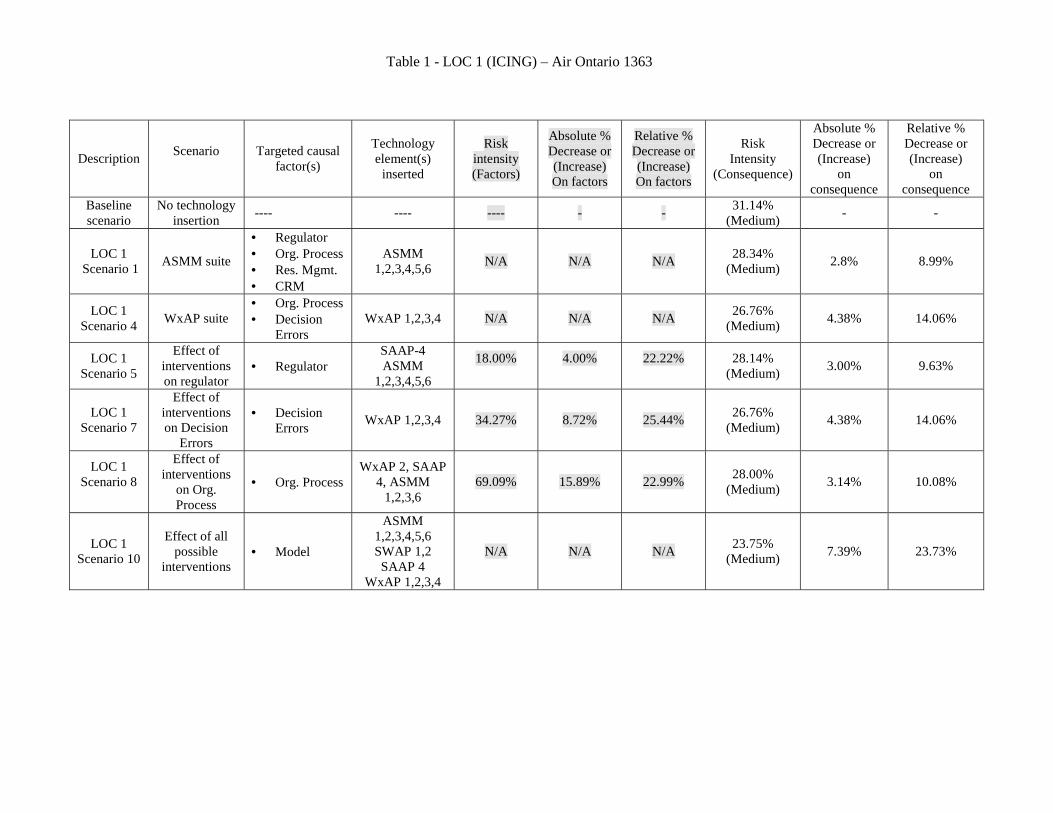
Preliminary Risk Assessments: Table 1 illustrates some “representative” preliminary riskassessments using the analytical approach as described previously. The current LOC model hasonly been through one complete iteration including model quantification with the subject matterexperts and thus, any risk assessments should be considered as preliminary. Also, it is intendedthat an advisory panel will be formed to review all models as well as the beliefs of the experts.
Figure 11 - Initial Screen for the ASRM Prototype
An important point to note from Table 1 is that the overall relative risk reduction on aconsequence, such a LOC, may not be as high as the relative risk reduction on a particular causalfactor or set of causal factors. The real value of a proposed AvSP technology insertion and/orintervention may lie on the impact on causal factors.
31
At this point it is important to clarify some terminology used in order to better communicate theanalytical approach. A certain modeling “hierarchy” exists, if you will, in the proposed analyticalapproach. The “Approach” refers to the systematic, step-by-step, ASRM analytical approach asoutlined in Figure 7. “Model” is used to refer to the various consequence models, such as Loss ofControl (LOC), Controlled Flight Into Terrain (CFIT), Runway Incursion (RI), etc. It should benoted that in Phase 1, four representative “models” are developed for each consequence (LOC1,LOC2,) since there are alternative ways that causal factors could combine for a consequence tooccur. Fore example, there could be an LOC accident due to icing or an LOC accident due toimproper loading. These models are not exhaustive, but through the construct of analyticgeneralization, we are able to generalize the models to a theory of system safety. For each of themodels, various “Scenarios” are created based on alternative combinations of technologyinsertions/interventions. As noted by Kahn and Wiener [39], a scenario is a “hypotheticalsequence of events constructed for the purpose of focusing attention on causal processes anddecision-points.”
Figure 12 - “Relative Risk Intensity” of the Working ASRM Prototype
In the Phase 1 research, both the LOC and Maintenance accident categories have four modelseach. Some of the models are not fully quantified at this point in time and some models arepartially quantified, so research with these models will continue under Phase 2. In addition, themodels need to complete an internal validation step. As previously noted, each of the LOC andMaintenance-related models enables the analysis of scenario variants, or different combinationsof possible technology insertions. So with the Phase 1 analytical approach, it is possible, for

32
example, that with 3 models, approximately 30 different scenario variants may be analyzed. Thisenables both a literal replication of cases and a theoretical replication of cases [18] and leads toan enrichment of and support for the proposed system safety theoretical approach.
Remaining Research
Over the next three years, the proposed analytical approach and the ASRM software will be usedto perform risk assessments for all 48 new technologies/interventions in NASA’s AvSP portfolio.The development of these risk assessments will be based on numerous meetings with subjectmatter experts in the aviation community. In addition, an expert advisory panel will be created toassist with model validation by examining construct validity, internal validity, and externalvalidity as well as repeatability [18]. Belief assessment remains an emerging and developingresearch field [40].
As an update to the ASRM, it is planned to provide severity distributions for each accident type.As the risk intensity is notionally the likelihood portion of risk, the prototype software will enablethe user to drill down to view a “representative” severity distribution and the corresponding riskmatrix as illustrated in Figure 13.
Figure 13 - Inclusion of “Representative” Severity Distribution
Eventually, a suite of models will be developed by accident type, such as Controlled Flight IntoTerrain (CFIT), Runway Incursions (RI), etc. Collectively, these models will paint a mosaic ofthe various contributions that the new technologies/interventions make towards system safety riskreduction in the National Airspace System (NAS).

33
Acknowledgements
Dr. Luxhøj acknowledges the support of the Federal Aviation Administration (FAA) and NASAthrough FAA grant number 00-G-006. This research has been extended under NASA contractnumber NAS1-03057. He also acknowledges the contributions of his research assistants: Mr.Songwut Apirakkhit, Mr. Apichart Choopavang, Mr. Muhammad Jalil, Mr. Erim Kardes, Ms.Kimberlee Kauffeld, Mr. Ram Kuturu, Mr. Ahmet Oztekin, Mr. Ryan Dickey, Mr. NathanGreenhut, Ms. Denise Andres, as well as Dr. David Coit. Dr. Luxhøj and his research team arealso grateful to the FAA’s Aviation Safety Inspectors who served as initial subject matter expertsfor this research. This paper is based on the research performed at Rutgers University. Thecontents of this paper reflect the views of the author who is solely responsible for the accuracy ofthe facts, analyses, conclusions, and recommendations represented herein, and do not necessaryreflect the official view or policy of either the Federal Aviation Administration or NASA.
DescriptionScenario Targeted causal
factor(s)
Technologyelement(s)
inserted
Riskintensity(Factors)
Absolute %Decrease or(Increase)On factors
Relative %Decrease or(Increase)On factors
RiskIntensity
(Consequence)
Absolute %Decrease or(Increase)
onconsequence
Relative %Decrease or(Increase)
onconsequence
Baselinescenario
No technologyinsertion
---- ---- ---- - -31.14%
(Medium)- -
LOC 1Scenario 1
ASMM suite
• Regulator• Org. Process• Res. Mgmt.• CRM
ASMM1,2,3,4,5,6
N/A N/A N/A28.34%
(Medium)2.8% 8.99%
LOC 1Scenario 4
WxAP suite• Org. Process• Decision
ErrorsWxAP 1,2,3,4 N/A N/A N/A
26.76%(Medium)
4.38% 14.06%
LOC 1Scenario 5
Effect ofinterventionson regulator
• RegulatorSAAP-4ASMM
1,2,3,4,5,6
18.00% 4.00% 22.22% 28.14%(Medium)
3.00% 9.63%
LOC 1Scenario 7
Effect ofinterventionson Decision
Errors
• DecisionErrors
WxAP 1,2,3,4 34.27% 8.72% 25.44%26.76%
(Medium)4.38% 14.06%
LOC 1Scenario 8
Effect ofinterventions
on Org.Process
• Org. ProcessWxAP 2, SAAP
4, ASMM1,2,3,6
69.09% 15.89% 22.99%28.00%
(Medium)3.14% 10.08%
LOC 1Scenario 10
Effect of allpossible
interventions• Model
ASMM1,2,3,4,5,6SWAP 1,2SAAP 4
WxAP 1,2,3,4
N/A N/A N/A23.75%
(Medium)7.39% 23.73%
Table 1 - LOC 1 (ICING) – Air Ontario 1363
35
References
1. Leveson, N., “A New Foundation for System Safety” (http://sunnyday.mit.edu), 2002.
2. Leplat, J., “Occupational Accident Research and Systems Approach,” in New Technology andHuman Error (J. Rasmussen, K. Duncan, and J. Leplat, eds.) New York: John Wiley and Sons,Inc., 1987, pp. 181-191.
3. Pate-Cornell, M.E., “Organizational Aspects of Engineering System Safety: The Case ofOffshore Platforms,” Science 250, 1990, pp. 1210-1217.
4. Pidgeon, N. and M. O’Leary, “Organizational Safety Culture: Implications for AviationPractice,” in Aviation Psychology in Practice (N. Johnston, N. McDonald, and R. Fuller, eds.),Hove, The Netherlands: Lawrence Erlbaum, 1994.
5. Maurino, D.E., J. Reason, N. Johnston, and R.B. Lee, Beyond Aviation Human Factors,Vermont: Ashgate Publishing Company, 1997.
6. Reason, J., Managing the Risks of Organizational Accidents. England: Ashgate PublishingLimited, 1997.
7. Sarsfield, L.P., “Aviation in the Next Millennium: A National R&D Plan for Improving AirTransportation Safety and Security in the 21st Century”, Draft, RAND Science and TechnologyPolicy Institute, October 1, 1998.
8. Strauch, B., Investigating Human Error: Incidents, Accidents, and Complex Systems, England:Ashgate Publishing Limited, 2002.
9. NASA Aviation Safety Program (AvSP) Product Dictionary, February 2002.
10. NASA Aviation Safety (AvSP) Program Commitment Agreement, July, 2000.
11. Luxhøj, J.T., D.N. Arendt, T.P. Williams, and T.G. Horton, “An Application of AdvancedInformation Technology for Assessing Aircraft Accident Causation,” Proceedings ofInternational Society of Air Safety Investigators, Anchorage, Alaska, September 29 - October 3,1997.
12. Luxhøj, J.T., D.N. Arendt, and T.G. Horton, “An Intelligent Computer-Based Tool forEvaluating Aircraft Accident Causation,” Proceedings of European Safety and ReliabilityInternational Conference ESREL ‘98, Trondheim, Norway, June 17-19, 1998, pp. 839-846.
13. Luxhøj, J.T., K. Bansal, A. Choopavang, A., T.G. Horton, and D. N. Arendt, “An AviationSystem Safety Model for Improved Risk and Management,” Proceedings of the European Safetyand Reliability Conference ESREL’99, Munich, Germany, September 13-17, 1999, pp. 1285-1290.
14. Luxhøj, J.T., A. Choopavang, and D.N. Arendt, “Risk Assessment of Organizational Factorsin Aviation Systems,” Air Traffic Control Quarterly, 9 (3), (Special Issue on Flight Safety), 2001,pp. 135-174.
36
15. Andersen, S.K., F.V. Jensen, and K.G. Olesen, “The HUGIN Core – PreliminaryConsiderations on Systems for Fast Manipulation of Probabilities,” in Proceedings of Workshopon Inductive Reasoning: Managing Empirical Information in AI-Systems, Risø NationalLaboratory, Roskilde, Denmark, April, 1987.
16. Andersen, S.K., K.G. Olesen, F.V. Jensen, and F. Jensen , “HUGIN - A Shell for BuildingBayesian Belief Universes for Expert Systems,” in Proceedings of the Eleventh InternationalJoint Conference on Artificial Intelligence, Detroit, Michigan, August 20-25, 1989, pp. 1080-1085.
17. Jensen, F.V., S.L. Lauritzen, and K.G. Olesen, “Bayesian Updating in Causal ProbabilisticNetworks by Local Computations,” Computational Statistics Quarterly, 4, 1990, pp. 327-352.
18. Yin, R., Case Study Research: Design and Methods, 3rd ed., London: Sage Publications, 2003.
19. van Vuuren, W., Organizational Failure: An Exploratory Study in the Steel Industry andMedical Domain, Institute of Business Engineering and Technology Application, EindhovenUniversity of Technology, Eindhoven, Netherlands, 1998.
20. Shappell, S.A., and D.A. Wiegmann, “The Human Factors Analysis and ClassificationSystem-HFACS,” Office of Aviation Medicine Technical Report No, DOT/FAA/AM-00/7, CivilAeromedical Institute, Oklahoma City, OK, February, 2000.
21. Shappell, S.A. and D.A. Wiegmann, “Applying Reason: The Human Factors Analysis andClassification System (HFACS),” Human Factors and Aerospace Safety, 1 (1), 2001, pp. 59-86.
22. Wiegmann, D.A., and S.A. Shappell, "A Human Error Analysis of Commercial AviationAccidents Using the Human Factors Analysis and Classification System (HFACS),” ReportNumber DOT/FAA/AM-01/3, Washington DC: Federal Aviation Administration, 2001.
23. Gardiner, P., and R. Wood, “Operational Risk Management,” Handbook of AirlineOperations, New York: McGraw-Hill, 2000.
24. Pearl, J., Probabilistic Reasoning in Intelligent Systems: Networks of Plausible Inference, SanFrancisco: Morgan Kaufmann, 1988.
25. Jensen, F.V., Introduction to Bayesian Networks, New York: Springer-Verlag, 1996.
26. Reason, J., Human Error, Cambridge, UK: Cambridge University Press, 1990.
27. Reason, J., “A System Approach to Organizational Error,” Ergonomics 38(8), 7, 1995, pp.1708-1721.
28. Fenton, N.E., B. Littlewood, M. Neil, L. Strigini, D.R. Wright, and P.J. Courtois, “BayesianBelief Network Model for the Safety Assessment of Nuclear Computer-based Systems, ESPRITDeVa Project 20072, Center for Software Reliability, City University, London, January, 1998.
29. Ayyub, B.M., Elicitation of Expert Opinions for Uncertainty and Risks, New York: CRCPress, 2001.
37
30. Vick, S., Degrees of Belief: Subjective Probability and Engineering Judgment, Reston, VA:ASCE Press, 2002.
31. Wilson, A.G., “Cognitive Factors Affecting Subjective Probability Assessment,” ISDSDiscussion Paper # 94-02, Institute of Statistics and Decision Sciences, Duke University,February, 1994.
32. Renooij, S., “Probability Elicitation for Belief Networks: Issues to Consider,” TheKnowledge Engineering Review, 16(3), 2001, pp. 255-269.
33. Gilovich, T., D. Griffin, and D. Kahneman, Heuristics and Biases: The Psychology ofIntuitive Judgment, New York: Cambridge University Press, 2002.
34. Renooij, S. and C.L.M. Witteman, “Talking Probabilities: Communicating ProbabilisticInformation With Words and Numbers,” International Journal of Approximate Reasoning, 22,1999, pp. 169-194.
35. van der Gaag, L.C., S. Rennoij, C.L.M. Witteman, B.M.P. Aleman, and B.G. Taal, “How toElicit Many Probabilities,” Proceedings of the Fifteenth Conference on Uncertainty in ArtificialIntelligence,1999, pp. 647-654.
36. Druzdzel, M.J. and L.C. van der Gaag, “Elicitation of Probabilities for Belief Networks:Combining Qualitative and Quantitative Information,” IEEE Transactions on Knowledge andData Engineering, 12(4), 2000. pp. 481-486.
37. NASDAC Database Report No. AAR 96-06, National Aviation Safety Data Analysis Center,Federal Aviation Administration, Washington DC, 1996.
38. Meyer, M.A., and J.M. Booker, Eliciting and Analyzing Expert Judgment: A Practical Guide,New York: Academic Press, 1991.
39. Kahn, W. and A.J. Wiener, The Year 2000: A Framework for Speculation on the Next Thirty-Three Years, New York: Macmillan, 1968.
40. Benson, P.G., S.P. Curley, and G.F. Smith, “Belief Assessment: An Underdeveloped Phaseof Probability Elicitation,” Management Science, Vol. 41, No. 10, October 1995, pp. 1639-1653.
Biography
J.T. Luxhøj, Rutgers University, Department of Industrial and Systems Engineering, Piscataway,NJ 08854-8018 U.S.A.; telephone 732.445.3625; fax 732.445.5467; e-mail –[email protected]
Dr. James T. Luxhøj is Associate Professor of Industrial and Systems Engineering at RutgersUniversity. In 1994-95 and Fall 2001 he was a Visiting Professor at Aalborg University inDenmark. He received his Ph.D. in industrial engineering and operations research from VirginiaPolytechnic Institute and State University in 1986. He has been involved in aviation systemsanalysis over the past 12 years. He served as the Principal Investigator on Federal AviationAdministration (FAA) research grants to develop an intelligent decision support system foraviation safety analysis and to develop analytical methods for aviation safety risk modeling,assessment, and management. Jim is currently collaborating with NASA’s Aviation Safety
38
Program to apply risk modeling techniques to evaluate the impact of technology insertion uponsystem risk in the National Airspace System. He is the former Co-Chair for the internationalGAIN Working Group B: Analytical Methods and Tools and has served as the Co-Chair of theFAA’s recent National Workshops on Risk Analysis and Safety Performance Measurement inAviation. He has published extensively on topics such as risk analysis, reliability andmaintenance modeling, econometric modeling, and decision support systems. Dr. Luxhøj servesas a Department Editor for IIE Transactions on Operations Engineering, and as Associate Editorsfor the Journal of Design and Manufacturing Automation and the Journal of EngineeringValuation and Cost Analysis. Jim resides in Somerset, New Jersey with his wife and twochildren.