private equity - actuaries institute · • venture capital fund managers bring capital, contacts,...
TRANSCRIPT

Private Equity
Chris Condon
Chief Investment Officer, MLC
2
Private Equity – Agenda
• Characteristics
• A private equity bubble?
• What’s important

3
Private equity is “managed entrepreneurship”
• Venture capital fund managers bring capital, contacts, and skills in a potent cocktail to help drive growth in their investments
• Buyout fund managers take majority stakes in companies to enact significant strategic and operational change
Buy Widgets Inc. Purchase price
of business = $150 m
Sell Widgets Inc. Sale price
of business = $300 m
Inject capex/hire
staff to
commercialise
new products Outsource
component
manufacturing
Change
product mix to
emphasise
high margin
products
Close/divest
loss making
businesses
Pro
fit = $20 m
Return Multiple = 2 x Cost
IRR = 20% p.a. over 4 yrs
Pro
fit = $10 m
Growth in company profit
of Widgets Inc.
Return comes from activist value creation not just passive capital investment

4
Definitions: Closed End Funds
Commitment: Investors commit to investing a fixed amount during the life of the fund.
Drawdown: When the fund acquires a business, committed capital is drawndown
Fund term: Funds have a fixed term, usually 10-12 years and is wound up after that
period.
Vintage Year: The year the fund was formed. Due to the cyclicality of the asset class,
the best comparisons are with other funds of the same vintage year.
Difficult to forecast the timing of drawdowns and distributions
5
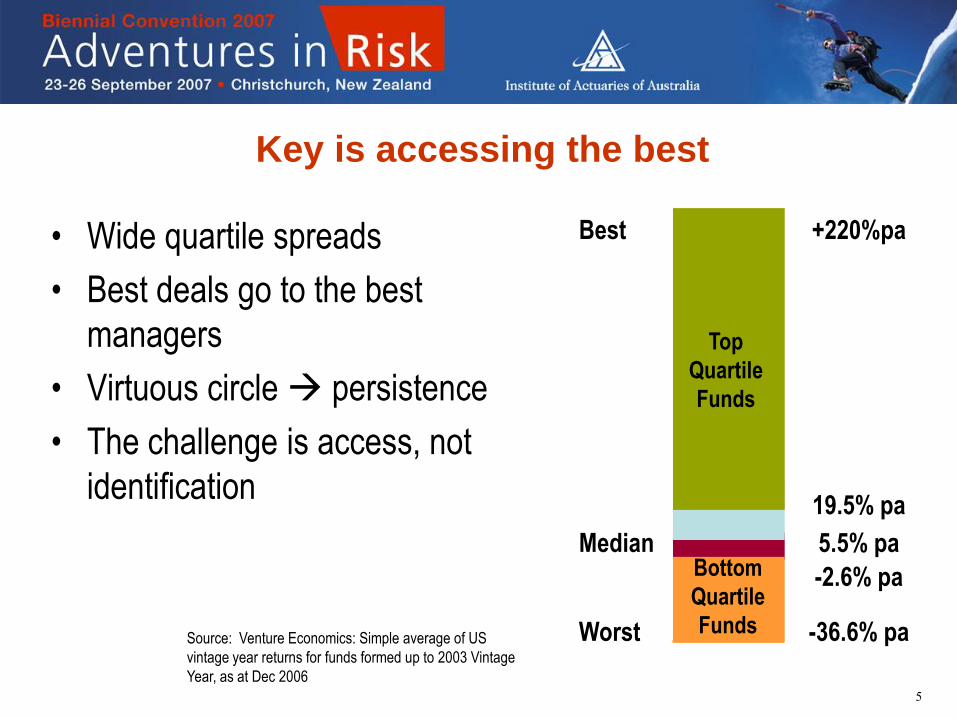
Source: Venture Economics: Simple average of US
vintage year returns for funds formed up to 2003 Vintage
Year, as at Dec 2006
Median 5.5% pa
-2.6% pa Bottom
Quartile
Funds
19.5% pa
Top
Quartile
Funds
Best +220%pa
Worst -36.6% pa
Key is accessing the best
• Wide quartile spreads
• Best deals go to the best
managers
• Virtuous circle persistence
• The challenge is access, not
identification

6
A private equity bubble?
Global LBO Activity by Region
Total Enterprise Value of LBO Transactions, USD Billions
0
100
200
300
400
500
600
1980
1981
1982
1983
1984
1985
1986
1987
1988
1989
1990
1991
1992
1993
1994
1995
1996
1997
1998
1999
2000
2001
2002
2003
2004
2005
2006
2007*
Australian LBO
Asian LBO
Euro LBO
US LBO
*2007 is annualised year to date at 1 May 2007
Source: S&P, JPMorgan, Dealogic
7
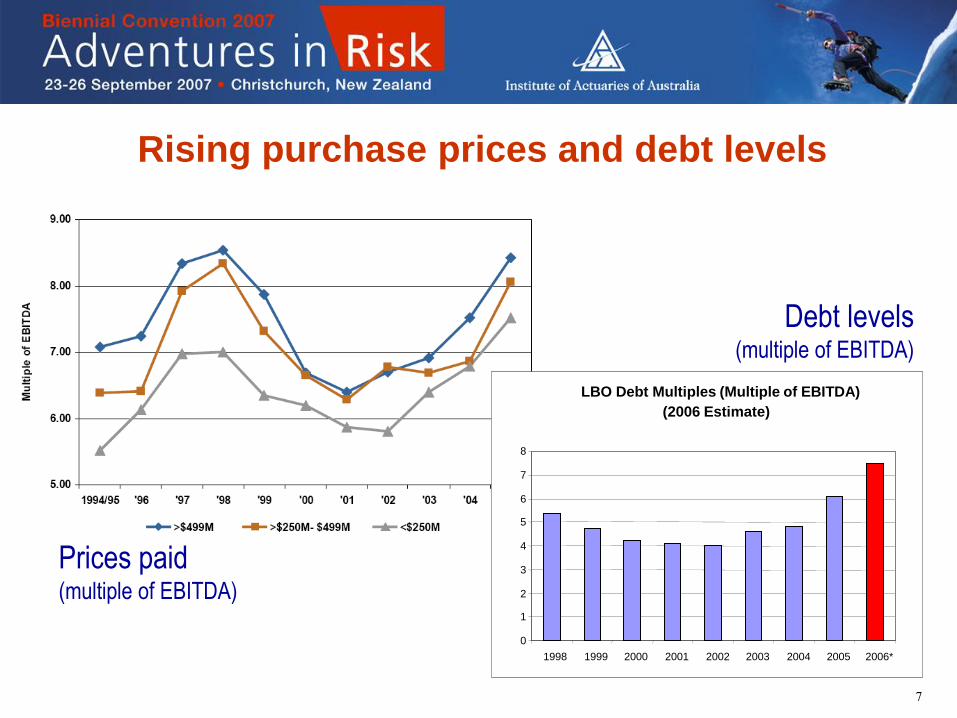
Rising purchase prices and debt levels
LBO Debt Multiples (Multiple of EBITDA)
(2006 Estimate)
0
1
2
3
4
5
6
7
8
1998 1999 2000 2001 2002 2003 2004 2005 2006*
Debt levels (multiple of EBITDA)
Prices paid (multiple of EBITDA)

8
Quadrupling of private equity’s share of M&A
PE as a Percentage of Total M&A Activity, Global
0
5
10
15
20
25
1999 2000 2001 2002 2003 2004 2005 2006
PE as a % of M&A
Source: Citigroup Global Markets
9
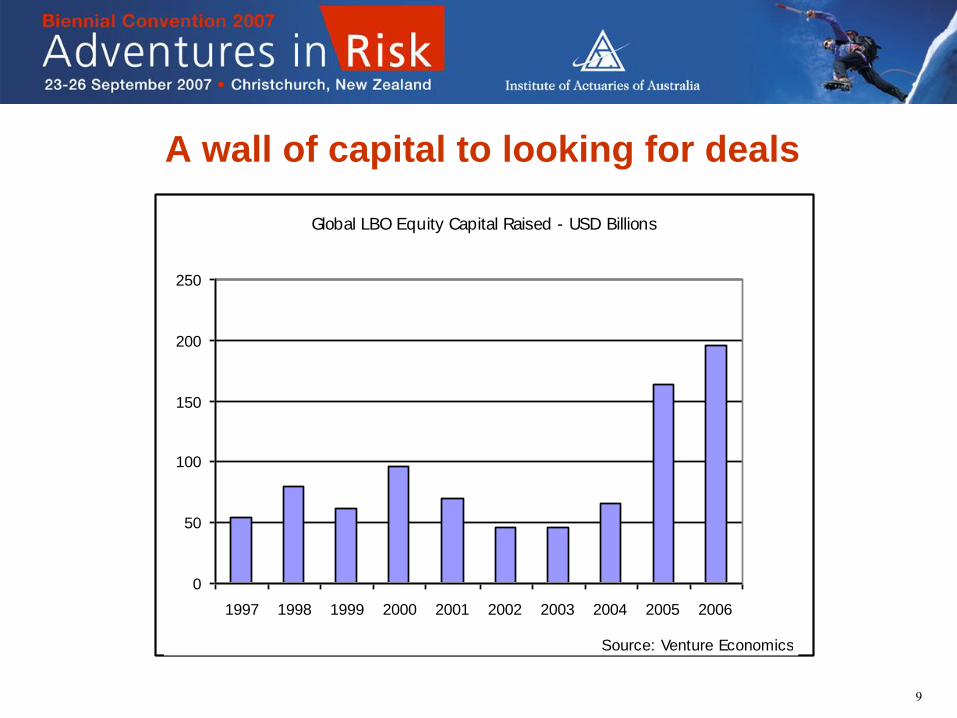
A wall of capital to looking for deals
Global LBO Equity Capital Raised - USD Billions
0
50
100
150
200
250
1997 1998 1999 2000 2001 2002 2003 2004 2005 2006
Source: Venture Economics

10
Higher prices funded by leverage
Acquisition Multiples for Large Cap Deals showing Equity and Leverage-
Average Multiple of EBITDA for Winning Bids
4 .74 .2 4 .1 4
4 .6 4 .95.4 5.5 5.7
8 .3
7.0 6 .7 7.0 7.3
7.9
8 .8 8 .8 9 .1
0
1
2
3
4
5
6
7
8
9
10
19 9 9 2 0 0 0 2 0 0 1 2 0 0 2 2 0 0 3 2 0 0 4 2 0 0 5 2 0 0 6 2 0 0 7*
Equity
Debt
Source: S&P, LCD

11
Margins ain’t what they used to be
LEV ERA G ED LO A N INTERES T RA TE & LB O PURC HA S E YIELD S
0%
2%
4%
6%
8%
10%
12%
14%
16%
18%
Ma
r-9
8
Se
p-9
8
Ma
r-9
9
Se
p-9
9
Ma
r-0
0
Se
p-0
0
Ma
r-0
1
Se
p-0
1
Ma
r-0
2
Se
p-0
2
Ma
r-0
3
Se
p-0
3
Ma
r-0
4
Se
p-0
4
Ma
r-0
5
Se
p-0
5
Ma
r-0
6
Se
p-0
6
Ma
r-0
7
Se
p-0
7
%
A V E R A G E L O A N R A T E *
P U R C H A S E Y I E L D * *
* O N LEVERAGED LO AN S
* * O N EBITD A, FO R LBO TRAN S AC TIO N S
S O U RC E: S TAN D ARD & PO O R'S
Source: Morgan Stanley

12
20 is today’s 30
Comparitive US Investment Returns - IRR%
0
5
10
15
20
25
30
35
40
1 Year 3 Year 5 Year 7 Year 15 Year
US Buy-out Top Quartile
All US Buyout
S&P 500
Source: Thomson, Venture Economics

13
The bubble has now been pricked!
Source: Bridgewater® Daily Observations 21 August 2007

14
Venture Capital – ugly sister or opportunity?
VC Investments by Region, USD Billions
$41
$22 $20$23 $23
$15
$6
$4
$5 $3
$5
$3
$3
$3 $7
$0
$10
$20
$30
$40
$50
$60
$70
2001 2002 2003 2004 2005
Asia
Europe
US
Source: HRJ, PwC, Venture Source, IVC Online
US Venture Capital IRRs by Vintage Year
-20%
0%
20%
40%
60%
80%
100%
120%
140%
1969
1971
1973
1975
1977
1979
1981
1983
1985
1987
1989
1991
1993
1995
1997
1999
2001
2003
2005
Note that the "J-Curve" effect is apparent from 2005 onward.
Source: Venture Economics
VC investments
halved since 2001
And returns
evaporated

15
What’s important…
• Access to top tier managers is key – Sophistication, discipline, consistency, quick decisions
• Vintage year diversification – Today’s commitments invested over 1-3 years
– You can’t time the cycle
• But be prepared to say no
• Today? – don’t confuse leveraged luck for skill
– look for fundamental value creation