price movements in the stock market
TRANSCRIPT
This article was downloaded by: [University of Arizona]On: 10 October 2014, At: 10:04Publisher: Taylor & FrancisInforma Ltd Registered in England and Wales Registered Number: 1072954Registered office: Mortimer House, 37-41 Mortimer Street, London W1T 3JH,UK
Scandinavian Actuarial JournalPublication details, including instructions for authorsand subscription information:http://www.tandfonline.com/loi/sact20
Price movements in the stockmarketKarl Borch aa BergenPublished online: 22 Dec 2011.
To cite this article: Karl Borch (1964) Price movements in the stockmarket, Scandinavian Actuarial Journal, 1964:1-2, 41-50, DOI:10.1080/03461238.1964.10413252
To link to this article: http://dx.doi.org/10.1080/03461238.1964.10413252
PLEASE SCROLL DOWN FOR ARTICLE
Taylor & Francis makes every effort to ensure the accuracy of all theinformation (the “Content”) contained in the publications on our platform.However, Taylor & Francis, our agents, and our licensors make norepresentations or warranties whatsoever as to the accuracy, completeness,or suitability for any purpose of the Content. Any opinions and viewsexpressed in this publication are the opinions and views of the authors, andare not the views of or endorsed by Taylor & Francis. The accuracy of theContent should not be relied upon and should be independently verified withprimary sources of information. Taylor and Francis shall not be liable for anylosses, actions, claims, proceedings, demands, costs, expenses, damages,and other liabilities whatsoever or howsoever caused arising directly orindirectly in connection with, in relation to or arising out of the use of theContent.
This article may be used for research, teaching, and private study purposes.Any substantial or systematic reproduction, redistribution, reselling, loan,

sub-licensing, systematic supply, or distribution in any form to anyone isexpressly forbidden. Terms & Conditions of access and use can be found athttp://www.tandfonline.com/page/terms-and-conditions
Dow
nloa
ded
by [
Uni
vers
ity o
f A
rizo
na]
at 1
0:04
10
Oct
ober
201
4
Price Movements in the Stock Marketl
By Karl Borch (Bergen)
1. Introduction
1.1. To a casual observer of the stock m9.rket prices will probably seem to move in a completely random fashion. Stock brokers and others operating in the market appear, however, to believe very firmly that there is some system in these movements, and that people who know or can guess how the system works, stand to make a profit. So far there is little or no shtistical evidence to support such assumptions, and Granger and Morgenstern [4] seem quite justified in referring to these widely held beliefs as "stockmarket folklore".
1.2. There is on the other hand an increasing amount of statistical evidence which indicates that price movements may well be completely random.
The first substantial piece of evidence is probably Cowles' study from 1933. Cowles [2] showed that by buying and selling at random one would do just as well as by following the advice of recognized (and highly paid) professional investment advisers.
Twenty ye9.rs later Kendall [5] found that a number of stock price indices behaved as if generated by a random walk process. Kendall comments as follows on his findings: "Investors can, perhaps, make money on the Stock Exchange, but not, apparently, by watching price-movements and coming in on what looks like a good thing." However, he adds, a little sadly: "But it is unlikely that anything I
say or demonstrate will destroy the illusion that the outside investor
can make money by playing the markets, so let us leave him to his own devices." Alexander [1] who analyzed Kendall's data, using dif
ferent statistical techniques, arrived at substantially the same conclu-
1 The research described in this paper was supported in part by The Rockefeller Foundation and in part by The Carnegie Foundation of New York.
Dow
nloa
ded
by [
Uni
vers
ity o
f A
rizo
na]
at 1
0:04
10
Oct
ober
201
4
42
sion. Osborne [6] found that prices in the New York Stock Exchange seemed to behave in a random manner, similar to that of Brownian motion in statistical mechanics. Recently Granger and Morgernstern [4] used some of the most advanced available statistical techniques to analyze a vast amount of stock market statistics, and found practically nothing which could throw doubt on the random walk hypothesis.
1.3. In the light of the evidence just cited, it appears to be of some significance just to find something in the stock market which is not purely random. This paper has no higher aspiration level than doing just this.
2. Description of the data
2.1. For the period July 1, 1958-June 29, 1962 we recorded the number of stock prices which advanced, declined or remained unchanged on each trading day at the New York Stock Exchange. There were 1007 trading days in the period, and the number of stocks listed was above 1500, so in a sense we obtained a sample of more than 1.5 million observations.
It is obviously not practical to reproduce the data in full, but a sample is given in Table 1. This extract includes the latter half of May 1962 when prices fell dramatically, and the first half of June 1962 which showed the beginning of a recovery,
2.2. In the crudest possible form we can summarize the data as follows:
505,095 519,494
227,089
Advances
Declines
Unchanged
The Standard and Poor's index of 500 common stocks stood at
45.98 in July 1958, and at 55.63 in June 1962. This index includes almost half the common stocks of U.S. companies which are listed
on the New York Stock Exchange. Preferred stocks and stocks in
foreign companies may not behave in the same way as common U.S. stocks, but it seems nevertheless safe to assume that stock prices in
general have increased by about twenty per cent during the four year
Dow
nloa
ded
by [
Uni
vers
ity o
f A
rizo
na]
at 1
0:04
10
Oct
ober
201
4
43
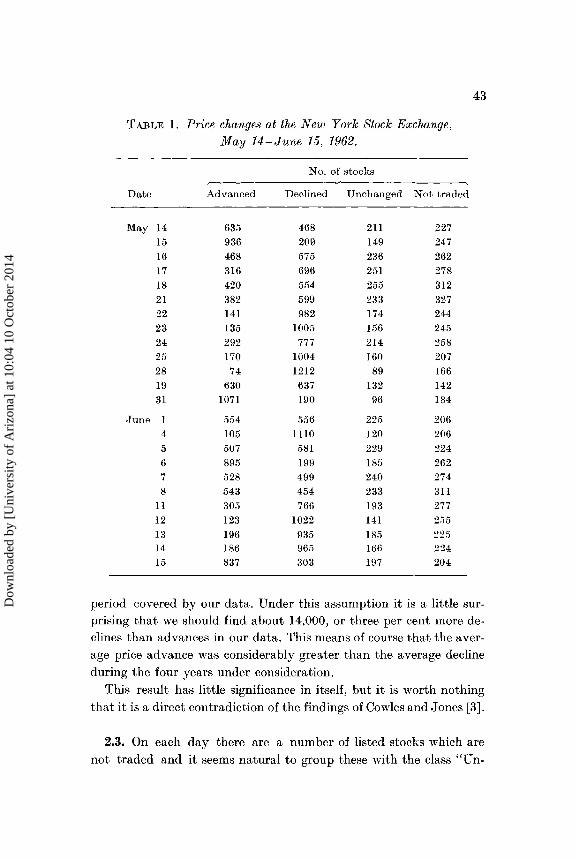
TABLE l. Price changes at the New York Stock Exchange, May 14-June 15, 1962.
No. of stocks
Date Advanced Declined Unchanged Not traded
May 14 635 468 211 227 15 936 209 149 247 16 468 575 236 262 17 316 696 251 278 18 420 554 255 312 21 382 599 233 327 22 141 982 174 244 23 135 1005 156 245 24 292 777 214 258 25 170 1004 160 207 28 74 1212 89 166 19 630 637 132 142 31 1071 190 96 184
.June 554 556 225 206 4 105 1110 120 206 5 507 581 229 224 6 895 199 185 262 7 528 499 240 274 8 543 454 233 311
11 305 766 193 277 12 123 1022 141 255 13 196 935 185 225 14 186 965 166 224 15 837 303 197 204
period covered by our data. Under this assumption it is a little sur-prising that we should find about 14,000, or three per cent more de-clines than advances in our data. This means of course that the aver-age price advance was considerably greater than the average decline
during the four years under consideration.
This result has little significance in itself, but it is worth nothing
that it is a direct contradiction of the findings of Cowles and Jones [3].
2.3. On each day there are a number of listed stocks which are
not traded and it seems natural to group these with the class "Un-
Dow
nloa
ded
by [
Uni
vers
ity o
f A
rizo
na]
at 1
0:04
10
Oct
ober
201
4
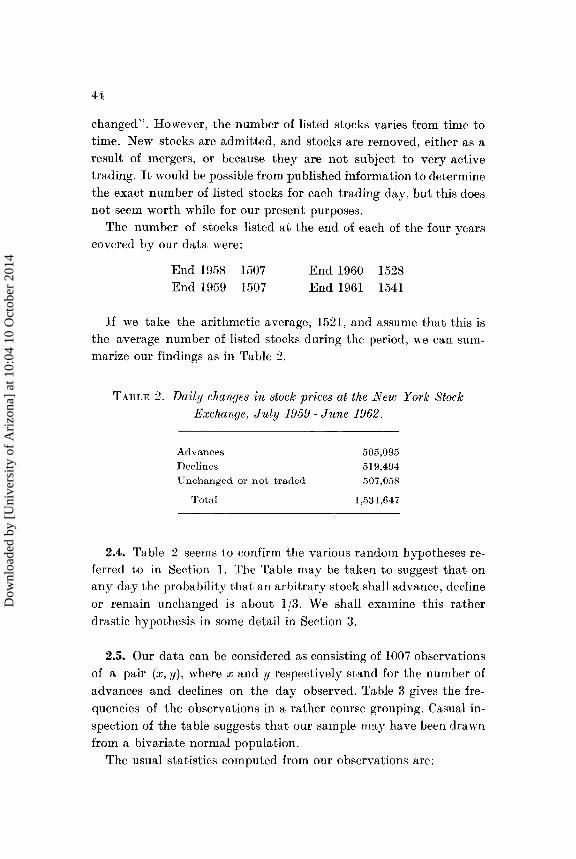
changed". However, the number of listed stocks varies from time to time. New stocks are admitted, and stocks are removed, either as a result of mergers, or because they are not subject to very active trading. It would be possible from published information to determine the exact number of listed stocks for each trading day, but this does not seem worth while for our present purposes.
The number of stocks listed at the end of each of the four years covered by our data were:
End 1958 1507 End 1959 1507
End 1960 End 1961
1528 1541
If we take the arithmetic average, 1521, and assume that this is the average number of listed stocks during the period, we can summarize our findings as in Table 2.
TABLE 2. Daily changes in stock prices at the New York Stock Exchange, July 1959-June 1962.
Advances
Declines
Unchanged or not traded
Total
505,095
519,494
507,058
1,531,647
2.4. Table 2 seems to confirm the various random hypotheses referred to in Section 1. The Table may be taken to suggest that on any day the probability that an arbitrary stock shall advance, decline
or remain unchanged is about 1/3. We shall examine this rather
drastic hypothesis in some detail in Section 3.
2.5. Our data can be considered as consisting of 1007 observations
of a pair (x, y), where x and y respectively stand for the number of
advances and declines on the day observed. Table 3 gives the frequencies of the observations in a rather course grouping. Casual in
spection of the table suggests that our sample may have been drawn from a bivariate normal population.
The usual statistics computed from our observations are:
Dow
nloa
ded
by [
Uni
vers
ity o
f A
rizo
na]
at 1
0:04
10
Oct
ober
201
4
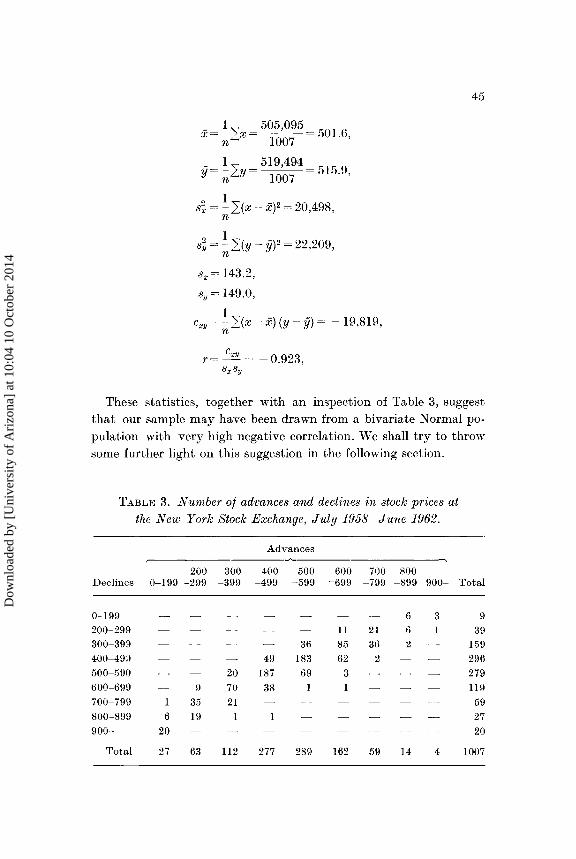
x = ~ LX = 505,095 = 501.6 n 1007 '
_ 1" 519,494 y= ;,LY= 1007 515.9,
1 s~ = - L(X - X)2 = 20,498,
n
1 s~ = - L(Y - fj)2 = 22,209,
n
sx = 143.2,
Sy = 149.0,
1 CXY = - L(X - x) (y - fj) = - 19,819,
n
45
These statistics, together with an inspection of Table 3, suggest that our sample may have been drawn from a bivariate Normal population with very high negative correlation. We shall try to throw some further light on this suggestion in the follm,ying section.
TABLE 3. Number of advances and declines in stock prices at the New York Stock Exchange, July 1958-June 1962.
Advances
200 300 400 500 600 700 800 Declines 0-199 -299 -399 -499 -599 -699 -799 -899 900- Total
0-199 6 3 9 200-299 II 21 6 39 300-399 36 85 36 2 159 400-49g 49 183 62 2 296 500-590 20 187 69 3 279 600-699 9 70 38 1I9 700-799 1 35 21 59 800-899 6 19 27 900- 20 20
Total 27 63 112 277 289 162 59 14 4 1007
Dow
nloa
ded
by [
Uni
vers
ity o
f A
rizo
na]
at 1
0:04
10
Oct
ober
201
4
46
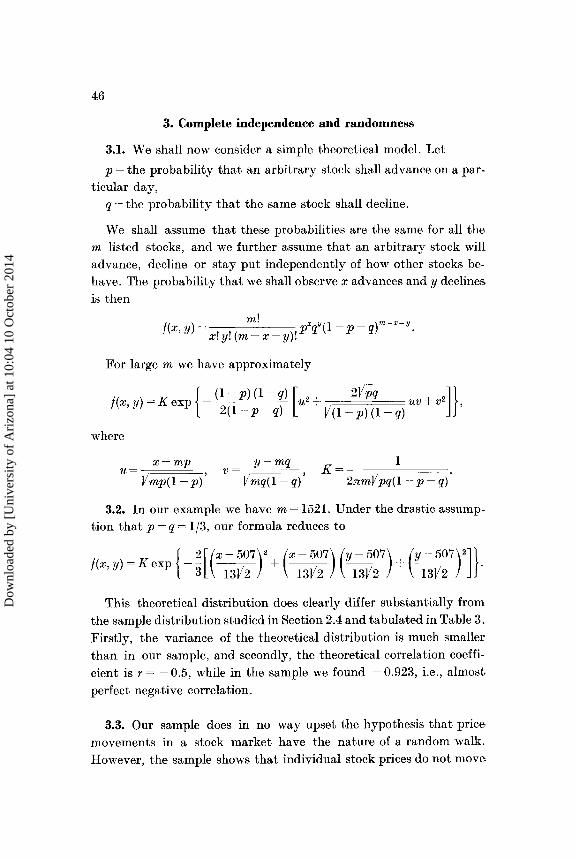
3. Complete independence and randomness
3.1. We shall now consider a simple theoretical model. Let
p = the probability that an arbitrary stock shall advance on a particular day,
q = the probability that the same stock shall decline.
We shall assume that these probabilities are the same for all the m listed stocks, and we further assume that an arbitrary stock will advance, decline or stay put independently of how other stocks behave. The probability that we shall observe x advances and y declines is then
For large m we have approximately
f(x, y) =K exp {- (l-p) (1- q) [U2 +- V 2VJ;q uv +-V2]}, 2(1-p-q) (l-p)(l-q)
where
x-mp '/1,= ,
Vmp(l-p)
v= y-mq JV m=q=(=l -==q) ,
K= 1 2nmV pq(l - P - q)
3.2. In our example we have m = 1521. Under the drastic assumption that p = q = 1/3, our formula reduces to
f(x, ) = K ex {_ ~[(x - 5~7)2 +- (x - 5~2) (y - 5~7) +- (y - 5~7)2]}. Y P 3 13V2 13V2 13V2 13V2
This theoretical distribution does clearly differ substantially from the sample distribution studied in Section 2.4 and tabulated in Table 3.
Firstly, the variance of the theoretical distribution is much smaller
than in our sample, and secondly, the theoretical correlation coefficient is r = - 0.5, while in the sample we found - 0.923, i.e., almost
perfect negative correlation.
3.3. Our sample does in no way upset the hypothesis that price movements in a stock market have the nature of a random walk.
However, the sample shows that individual stock prices do not move
Dow
nloa
ded
by [
Uni
vers
ity o
f A
rizo
na]
at 1
0:04
10
Oct
ober
201
4
47
independently. If the hypothesis of complete independence was true, we should get a far stronger concentration around the central values than shown by Table 3; in fact, the odds would be less than 1 to 1000 of finding any observations at all outside the four central cells of Table 3.
Our sample shows that there is a strong tendency for stock prices
to move together---either up or down. This is not really surprising. Concepts like "rally" and "crash" are familiar in most stock markets. However, rallies and crashes would be extremely unlikely if all
stock prices moved independently in a random manner.
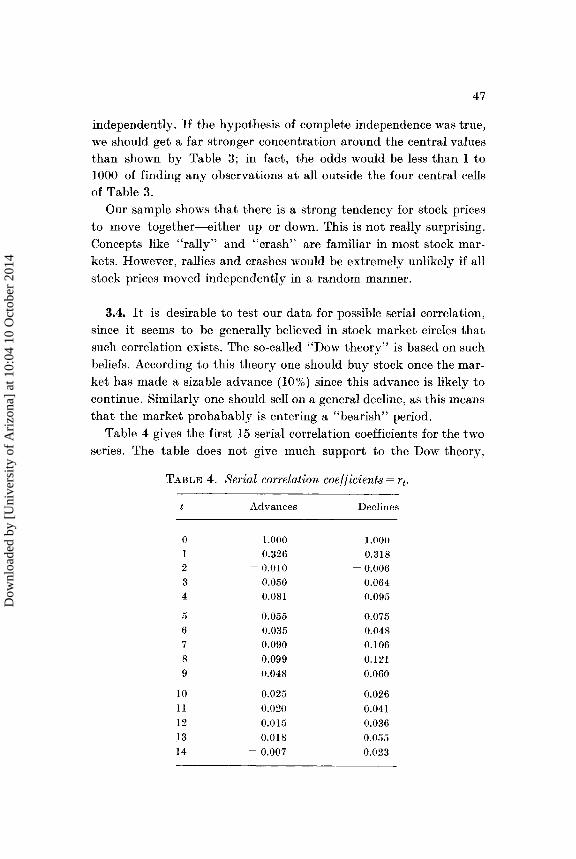
3.4. It is desirable to test our data for possible serial correlation, since it seems to be generally believed in stock market circles that such correlation exists. The so-called "Dow theory" is based on such beliefs. According to this theory one should buy stock once the market has made a sizable advance (10%) since this advance is likely to
continue. Similarly one should sell on a general decline, as this means that the market probabably is entering a "bearish" period.
Table 4 gives the first 15 serial correlation coefficients for the two series. The table does not give much support to the Dow theory,
TABLE 4. Serial correlation coefficients = rt.
Advances Declines
0 1.000 1.000 1 0.326 0.318 2 - 0.010 - 0.006
3 0.050 0.064 4 0.081 0.095
5 0.055 0.075 6 0.035 0.048 7 0.090 0.106
8 0.099 0.121 9 0.048 0.060
10 0.025 0.026 11 0.020 0.041 12 0.015 0.036 13 0.018 0.055 14 - 0.007 0.023
Dow
nloa
ded
by [
Uni
vers
ity o
f A
rizo
na]
at 1
0:04
10
Oct
ober
201
4
48
although it appears that a substantial advance or decline is likely to continue on the following day. However, this is the end of the story. The apparent tendency of the market to reverse itself on the third day can hardly be considered as significant.
It is, however, remarkable that practically all coefficients are positive although generally very small. This means that there appears to be a weak tendency for market advances and declines to continue for some time once they have started. Hence the traditional beliefs of the stock market may-like most folklore-have some empirical foundation.
4. Concluding remarks
4.1. The evidence that stock prices move in a random manner is
obviously-to put it mildly-disturbing to security analysts, investment counselors and economists wedded to the more orthodox ways of thinking. These groups have objected, often in very strong terms, Weintraub [7] for instance, states: "The random-walk hypothesis flies in the face of common sense and the facts and, moreover, suggests a degree of naivete on the part of its advocates as to the rules of the game which professional speculators are playing." Such strong statements are, however, usually backed by weak statistics.
With the present state of our knowledge it seems quite fair to consider security analysts, at least those who belong to the "technical" school, as the astrologers of our century. The horoscopes they prepare for individual stocks are based on price behavior in the past, but they may equally well be based on the constellation of the stars when the companies were founded. There is no scientific proof that
this will make any difference. Security analysts are respected members of our society, like astrologers once were, and they are amply
rewarded when their predictions prove right-as they are bound to
be in about half the cases.
4.2. The random walk hypothesis does not mean that it is impossible to devise a "system" which will be profitable in the stock mar
ket. The hypothesis in fact implies that it is virtually certain (i.e., probability equal to one) that any stock will, some time in the future,
sell at a price higher than today's. The hypothesis even implies that
Dow
nloa
ded
by [
Uni
vers
ity o
f A
rizo
na]
at 1
0:04
10
Oct
ober
201
4
49
this will happen infinitely often. This means that one is virtually certain to make a profit by using any system of the type: "Buy stock X every time the price is lower than 10, and sell it every time the price is higher than 20."
In order to evaluate a system of this kind it is usual to consider an index or another stock, and calculate the profits one would have made by buying and selling the index at the times when according to the system one should have bought or sold stock X. If the index is stochastically independent of the price of stock X, the expected profit of buying and selling the index will obviously be zero. If there is some stochastic dependence, as indicated earlier in this paper, the index operations can be expected to give a positive profit, but lower than the profit of the system based on stock X.
Most proofs that the various systems work are of this nature, and they can obviously not discredit the random walk hypothesis.
Whether these proofs have any other significance is just a matter of taste.
Summary
This paper contains an analysis of the number of stock prices which advanced and declined on The New York Stock Exchange on each
trading day during a four year period. The analysis confirms the findings of a number of other authors,
that price movements in a stock market are of an essentially random nature.
It appears, however, that prices of individual stocks do not move independently. There is a strong tendency for prices to move in unison, either up or down.
References
[1] ALEXANDER, S. S.: Price movements in speculative markets. Industrial AIanagement Review Vol. 2, No.2 (1961), pp. 7-26.
[2] COWLES, A.: Can market forecasters forecast? Econometrica, Vol. 1 (1933), pp. 309-324.
[3] COWLES, A., and H. E. JONES: Some a posteriori probabilities in stock market action. Econometrica, Vol. 5 (1937), pp. 280-294.
[4] GRANGER, C., and O. MORGENSTERN: Spectral analysis of New York Stock Market prices. Kyklos, Vol. XVI (1963), pp. 1-27.
4 - 643829 Skandinavisk A ktuarietidskrift 1964
Dow
nloa
ded
by [
Uni
vers
ity o
f A
rizo
na]
at 1
0:04
10
Oct
ober
201
4
50
[5] KE~DALL, M. G.: The analysis of economic time series. Journal of the Royal Statist1:cal Society, Series A, Vol. 96 (1953), pp. 11-25.
[6] OSBORNE, M. F. M.: Brownian motion in the stock market. Operations Research, Vol. 7 (1959), pp. 145-173.
[7] VVEINTRAUB, R. E.: On speculative prices and random walks: A denial. The Journal of Finance, Vol. 18 (1963), pp. 59-66.
Dow
nloa
ded
by [
Uni
vers
ity o
f A
rizo
na]
at 1
0:04
10
Oct
ober
201
4