pressure drop measurements in microchannel heat exchanger · pressure drop measurements in a...
TRANSCRIPT

Pressure Drop Measurements in Microchannel Heat Exchanger
J. M. Yin, C. W. Bullard and P. S. Hrnjak
ACRC CR-30
For additional information:
Air Conditioning and Refrigeration Center University of Illinois Mechanical & Industrial Engineering Dept. 1206 West Green Street Urbana, IL 61801
(217) 333-3115
April 2000
The Air Conditioning and Refrigeration Center was founded in 1988 with a grant from the estate of Richard W. Kritzer, the founder of Peerless of America Inc. A State of Illinois Technology Challenge Grant helped build the laboratory facilities. The ACRC receives continuing support from the Richard W. Kritzer Endowment and the National Science Foundation. The following organizations have also become sponsors of the Center.
Amana Refrigeration, Inc. Ar~elik A. S. Brazeway, Inc. Carrier Corporation Copeland Corporation DaimlerChrysler Corporation Delphi Harrison Thermal Systems Frigidaire Company General Electrlc Company General Motors Corporation Hill PHOENIX Honeywell, Inc. Hussmann Corporation Hydro Aluminum Adrian, Inc. Indiana Tube Corporation Invensys Climate Controls Lennox International, Inc. Modine Manufacturing Co. Parker Hannifin Corporation Peerless of America, Inc. The Trane Company Thermo King Corporation Visteon Automotive Systems Whirlpool Corporation Wolverine Tube, Inc. York International, Inc.
For additional information:
Air Conditioning & Refrigeration Center Mechanical & Industrial Engineering Dept. University of Illinois 1206 West Green Street Urbana IL 61801
2173333115

Pressure Drop Measurements in a Microchannel Heat Exchanger
J. M Yin, C. W. Bullard and P. S Hrnjak
ABSTRACT
Single-phase pressure drops inside a microchannel heat exchanger were tested systematically.
Local pressure drop coefficients were determined from the experimental data and compared with
published correlations. Results confirmed the Moody Chart to be applicable for the sub
millimeter channel flows used in heat exchangers explored. Based on nonintrusive testing
followed by destructive evaluation, two types of manufacturing defects were quantified:
variation of microchannel port diameters; and port blockage by brazing flux. A pressure drop
model for the whole heat exchanger was developed, and predicted the pressure and mass flow
rate distribution inside the heat exchanger. It can also be used as a design tool to optimize
microchannel tube dimensions and heat exchanger circuiting. Most importantly, simple nitrogen
flow tests can now be used to control the quality of the brazing process by detecting the presence
of blocked or deformed ports in the finished product.
INTRODUCTION
Compact heat exchangers already have extensive applications in the process industries,
especially in mobile air conditioning systems. They are now being evaluated for use in unitary
air conditioning systems for residential and commercial applications. Studies in the literature
report about this kind of heat exchanger are mainly focused on heat transfer performance (Heun,
1995, Olsson, 1994, Wang and Peng, 1994 and Peng and Peterson 1996). The pressure drop test
was mainly focused on single microchannel tube. Graham (1995) found that nitrogen tests
provide the most accurate determination of port diameters and tube roughness. Heun (1995)
measured the nitrogen pressure drop for circular, square, triangle and "H" shaped ports with
hydraulic diameter from 0.696 to 1.494mm, and found that all results agreed well with the
prediction of Churchill (1977) in both the laminar and turbulent flow regimes, but in the
transitional region, the results for noncircular tubes were not predicted accurately.
1

Because of the header configurations and mUlti-pass circuiting, there are more "minor" losses in
microchannel heat exchangers than for conventional circular tube, flat fin designs. Although
there are handbooks (Idelchik, 1994) with correlations for pressure drop calculation for different
kinds of channels, the complexity of microchannel designs suggests the need for careful
experimental verification.
During the process of developing a gas cooler model based on extensive data using supercritical
carbon dioxide (Yin et al. 2000), it was found that the model could predict the capacity quite
accurately, but could account for only about 30% of the total measured pressure drop. Since
there was no reason to doubt the validity of the published correlations for single-phase flow, it
was suspected that some dimensions of the heat exchanger might be wrong, or the "minor"
pressure losses were somehow accounting that 70% difference. Since our heat exchanger was
made from first-of-a-kind prototype tubes to handle the high pressures of R744, it was known the
port diameters may have been reduced by excessive die wear during the extrusion process. It
was also expected that the unique double-barreled header design might make the middle ports
vulnerable to blockage by flux during the brazing process (Baldantoni, 2000).
The purpose of this study was to develop, through an extensive set of experiments, pressure drop
prediction models for microchannel heat exchangers. The experiment included a series of tests
to separate the different local pressure drop factors. The model initially underpredicted the
pressure drop, and then an optimization algorithm was used to estimate the actual number of
unblocked ports and their actual diameter. All the dimensions of the heat exchanger components
were then checked after cutting the heat exchanger apart following completion of all the pressure
drop tests.
PRESSURE DROP EQUATIONS FOR PARALLEL FLOW MICROCHANNEL HEAT EXCHANGER
Figure 1 shows a schematic of a microchannel heat exchanger. The flow follows the inlet tube,
through the inlet elbow to the inlet header, is distributed into each port and then to exit header,
collected and mixed in the exit header, and then proceeds through exit elbow and out of the heat
exchanger through the exit tube. The total pressure drop for the heat exchanger is the sum of inlet
2
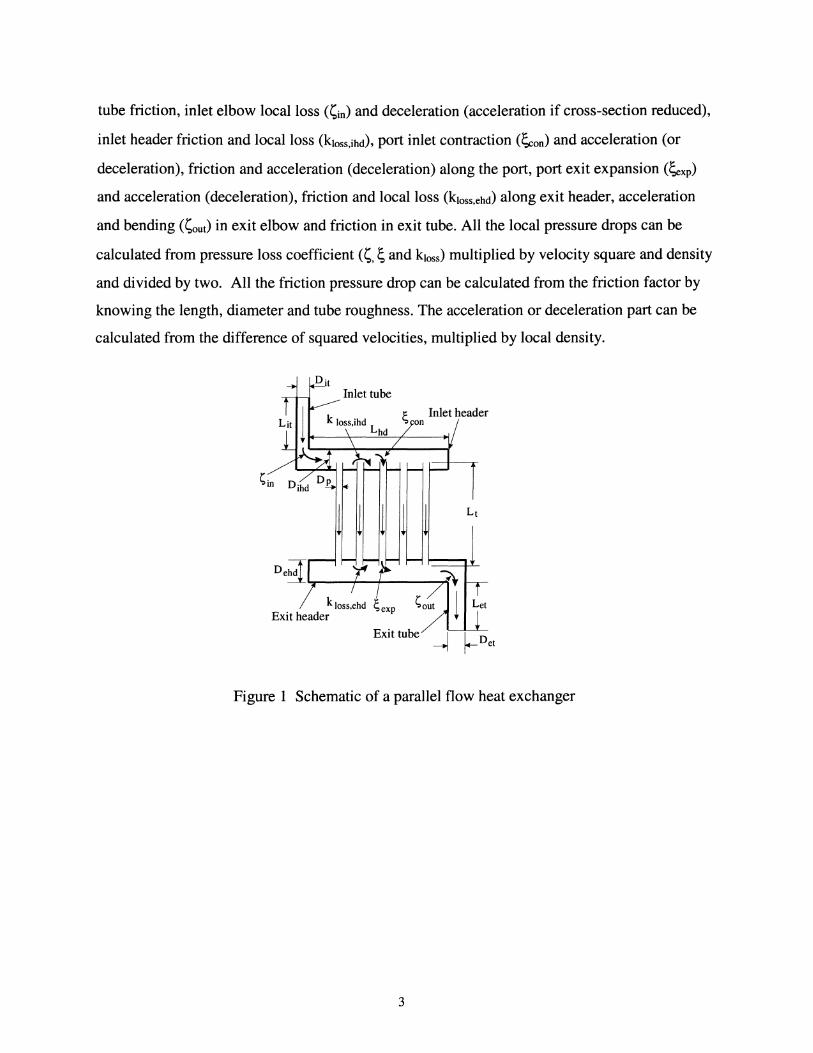
tube friction, inlet elbow local loss (~in) and deceleration (acceleration if cross-section reduced),
inlet header friction and local loss (k1oss,ihd), port inlet contraction (/;con) and acceleration (or
deceleration), friction and acceleration (deceleration) along the port, port exit expansion (~xp)
and acceleration (deceleration), friction and local loss (k1oss,ehd) along exit header, acceleration
and bending (~out) in exit elbow and friction in exit tube. All the local pressure drops can be
calculated from pressure loss coefficient (~, ~ and k1oss) multiplied by velocity square and density
and divided by two. All the friction pressure drop can be calculated from the friction factor by
knowing the length, diameter and tube roughness. The acceleration or deceleration part can be
calculated from the difference of squared velocities, multiplied by local density.
Figure 1 Schematic of a parallel flow heat exchanger
3
Using the mass flux instead of velocity, the total pressure drop for this kind of heat exchanger can be expressed as:
P P fLit Gi; in - exit = it D. ~
II PII
G2 +_ie_(Sin -1+ 0- 2 )
2Pie
~ Mhd Gi~d,i + ~(fihd,i D+kIOSS,ihd) 2
,=1 ihd P ihd ,i
G~,N 2 + (~con,N+l-r)
2Pin,N
+~ft'NG~'N Dport 2PaVg,N
G~,N 2 + (~exp,N -1 + r )
2Pout,N
41 M G 2 ~(f hd k ) ehd,i + ~ ehd,i V + loss,ed 2
i=N+1 ehd Pehd,i
G2 + __ ee_(Sout +1-0- 2 )
2Peie
f Let G~ + ---et D et 2Pet
(Inlet tube friction)
(Inlet elbow with expansion)
(Inlet header)
(Port inlet with contraction) (1)
(Port friction)
(Port exit with expansion)
(Exi t header)
(Exit elbow with contraction)
(Exit tube with friction)
here Pin is the pressure at inlet, Pexit is the pressure at heat exchanger exit, G is the mass flux, p is
the density, f is the friction factor, 0' is the area ratio of header tube cross section to inlet/exit
tube and y is the area ratio of header tube cross section to single microchannel tube ports cross
section area. The geometric variables were shown in Figure 1.
In addition to the friction pressure drop terms in Eq. 1, there are six local pressure drop terms
which were characterized by six local pressure drop coefficients. These coefficients usually are
related to the geometry and Reynolds number of a particular part. If these six coefficients were
known for this heat exchanger, Eq. 1 could be used to predict the pressure drop and flow
distribution, or used to check the dimensions such as port numbers and diameter of the heat
exchanger by comparing with nitrogen pressure drop test.
4
HEAT EXCHANGER, EXPERIMENTAL SETUP AND PROCEDURES
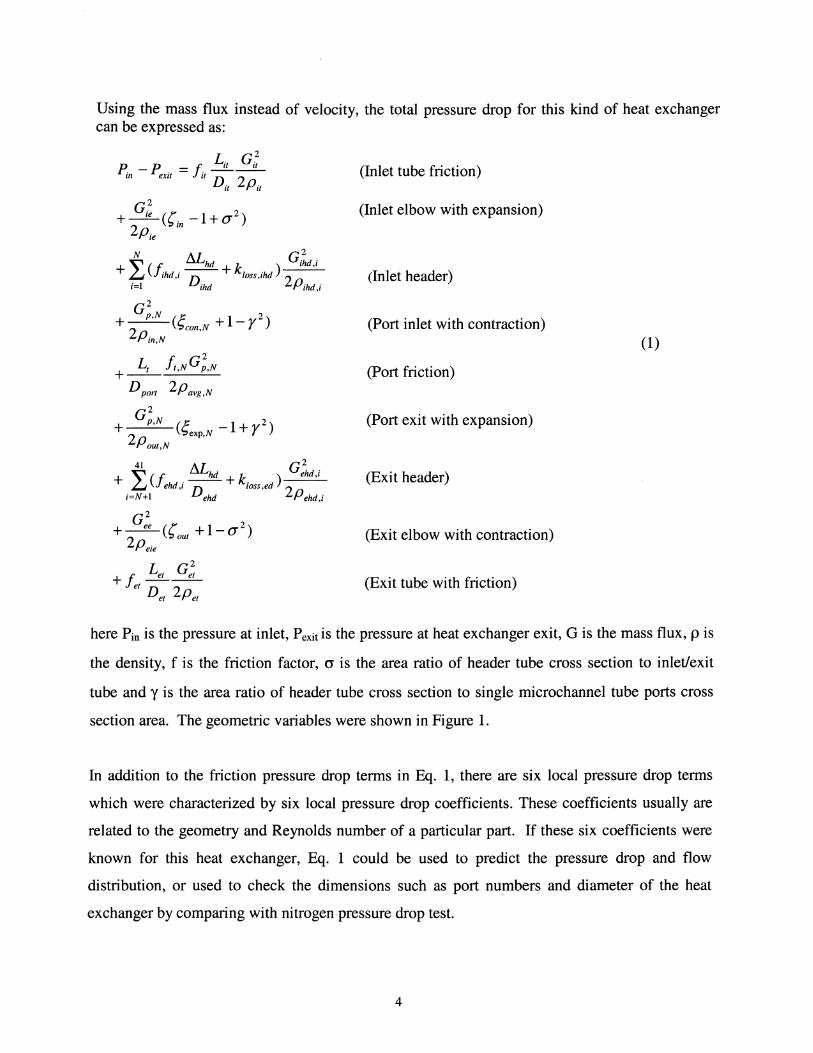
Figure 2 shows the schematic of the heat exchanger used in this study, with dimensions shown in
mm.
Connected to tube
1 815
Header tube
Figure 2 Schematics of the heat exchanger
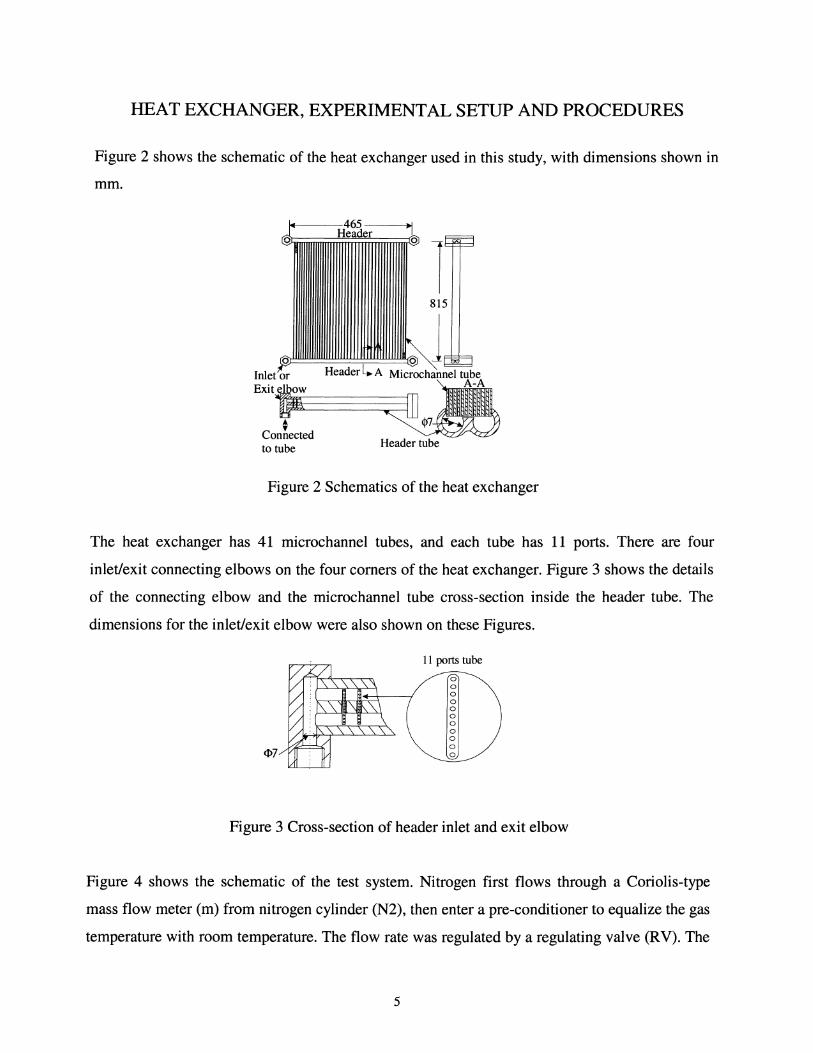
The heat exchanger has 41 microchannel tubes, and each tube has 11 ports. There are four
inlet/exit connecting elbows on the four comers of the heat exchanger. Figure 3 shows the details
of the connecting elbow and the microchannel tube cross-section inside the header tube. The
dimensions for the inlet/exit elbow were also shown on these Figures.
11 ports tube
Figure 3 Cross-section of header inlet and exit elbow
Figure 4 shows the schematic of the test system. Nitrogen first flows through a Coriolis-type
mass flow meter (m) from nitrogen cylinder (N2), then enter a pre-conditioner to equalize the gas
temperature with room temperature. The flow rate was regulated by a regulating valve (RV). The
5
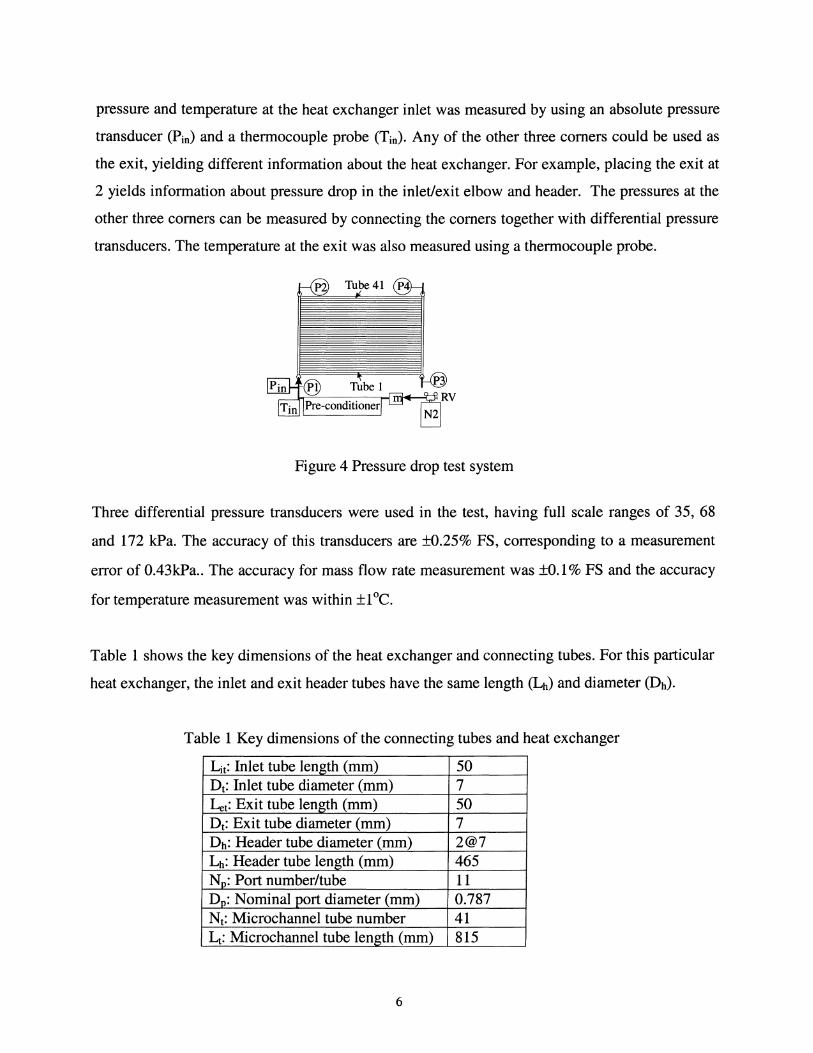
pressure and temperature at the heat exchanger inlet was measured by using an absolute pressure
transducer (Pin) and a thermocouple probe (Tin). Any of the other three comers could be used as
the exit, yielding different information about the heat exchanger. For example, placing the exit at
2 yields information about pressure drop in the inlet/exit elbow and header. The pressures at the
other three comers can be measured by connecting the comers together with differential pressure
transducers. The temperature at the exit was also measured using a thermocouple probe.
Figure 4 Pressure drop test system
Three differential pressure transducers were used in the test, having full scale ranges of 35, 68
and 172 kPa. The accuracy of this transducers are ±0.25% FS, corresponding to a measurement
error of 0.43kPa .. The accuracy for mass flow rate measurement was ±0.1 % FS and the accuracy
for temperature measurement was within ±1°C.
Table 1 shows the key dimensions of the heat exchanger and connecting tubes. For this particular
heat exchanger, the inlet and exit header tubes have the same length (Lb) and diameter (Db).
Table 1 Key dimensions of the connecting tubes and heat exchanger
~t: Inlet tube length (mm) 50 Dt: Inlet tube diameter (mm) 7 Let: Exit tube length (mm) 50 Dt: Exit tube diameter (mm) 7 Db: Header tube diameter (mm) 2@7 Lb: Header tube length (mm) 465 N~: Port number/tube 11 Do: Nominal port diameter (mm) 0.787 Nt: Microchannel tube number 41 Lt: Microchannel tube length (mm) 815
6
Of the six local pressure drop coefficients in Eq. 1, the contraction and expansion coefficients
could be obtained from Idelchik (1994). However it was necessary to determine the local
pressure drop coefficients experimentally for the inlet/exit headers and elbows, because no
published correlations were available for that special configuration. The friction factors for the
connecting tubes, header tubes and microchannel tubes will be calculated from Churchill's
(1977) correlation, which span the whole region from laminar to turbulent flow with roughness
correction. The relatively large connecting tubes and headers were treated as smooth tubes. For
microchannel tube, a 5J..lm absolute roughness was assumed at this stage of the analysis
(Memory, 1999).
PRESSURE DROP COEFFICIENTS FOR INLET AND EXIT ELBOWS
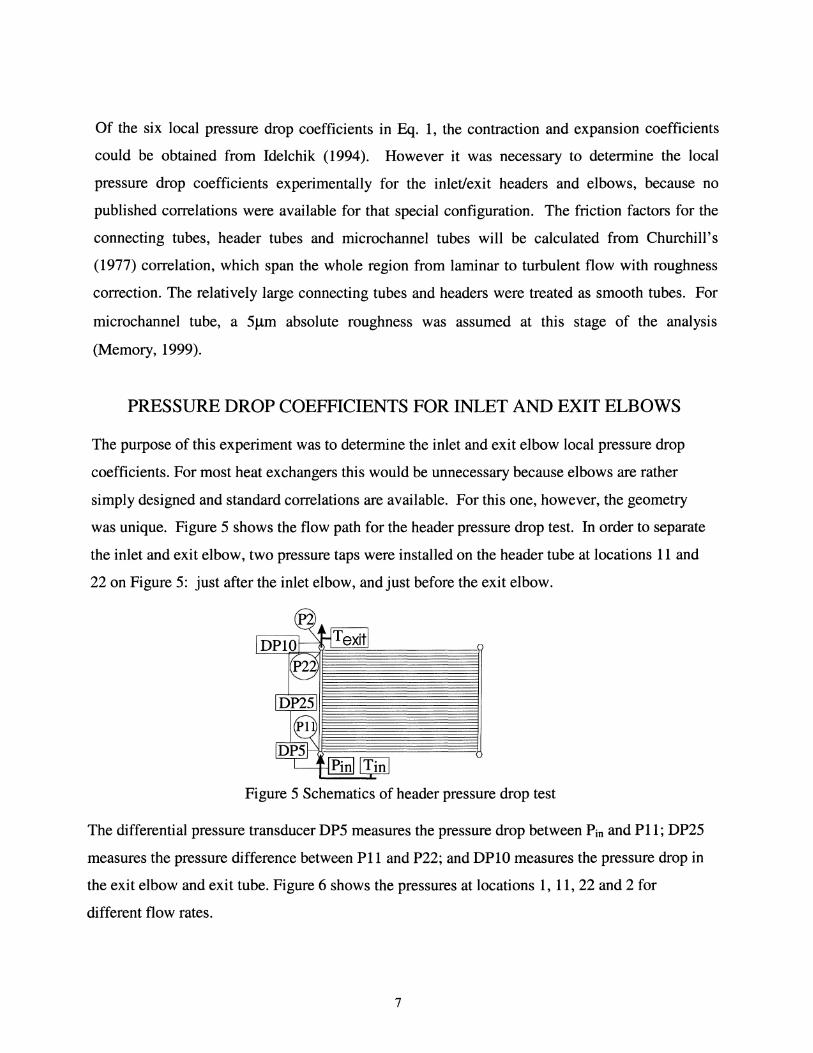
The purpose of this experiment was to determine the inlet and exit elbow local pressure drop
coefficients. For most heat exchangers this would be unnecessary because elbows are rather
simply designed and standard correlations are available. For this one, however, the geometry
was unique. Figure 5 shows the flow path for the header pressure drop test. In order to separate
the inlet and exit elbow, two pressure taps were installed on the header tube at locations 11 and
22 on Figure 5: just after the inlet elbow, and just before the exit elbow.
Figure 5 Schematics of header pressure drop test
The differential pressure transducer DP5 measures the pressure drop between Pin and Pll; DP25
measures the pressure difference between Pll and P22; and DPlO measures the pressure drop in
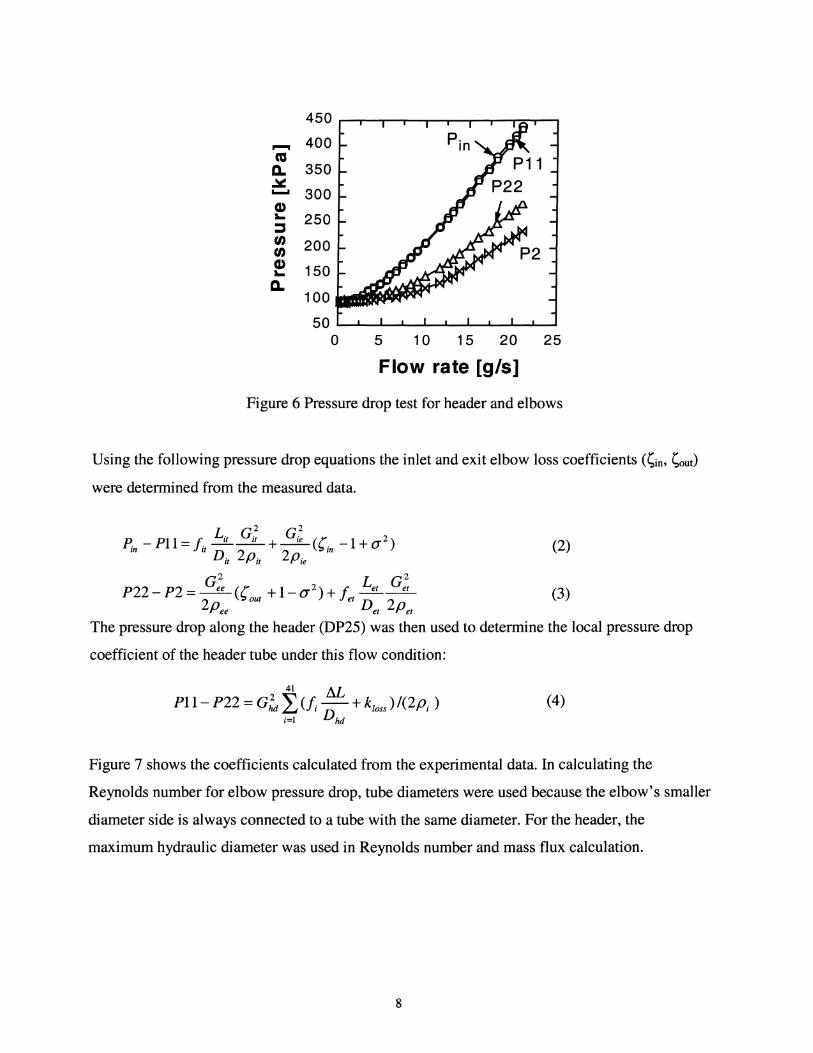
the exit elbow and exit tube. Figure 6 shows the pressures at locations 1, 11,22 and 2 for
different flow rates.
7
450
..... 400 CO a. 350 ~ ...... 300 CI) a.. 250 ~ 0 200 0 CI)
150 a.. a.
100
50 0 5 10 15 20 25
Flow rate [9/S]
Figure 6 Pressure drop test for header and elbows
Using the following pressure drop equations the inlet and exit elbow loss coefficients (Sin, Sout)
were determined from the measured data.
P _ Pll = F. Lit Gi; + Gi; (I'. -1 + 0- 2 ) In JII D 2 2 ~In
it Pit Pie (2)
P22-P2= G:e (I' +1-0-2)+/. Let G:r 2 ~out et D 2
Pee et Pet (3)
The pressure drop along the header (DP25) was then used to determine the local pressure drop
coefficient of the header tube under this flow condition:
2 41 M Pll- P22 = Ghd L(f; -+ k/oss )/(2Pi )
i;1 Dhd
(4)
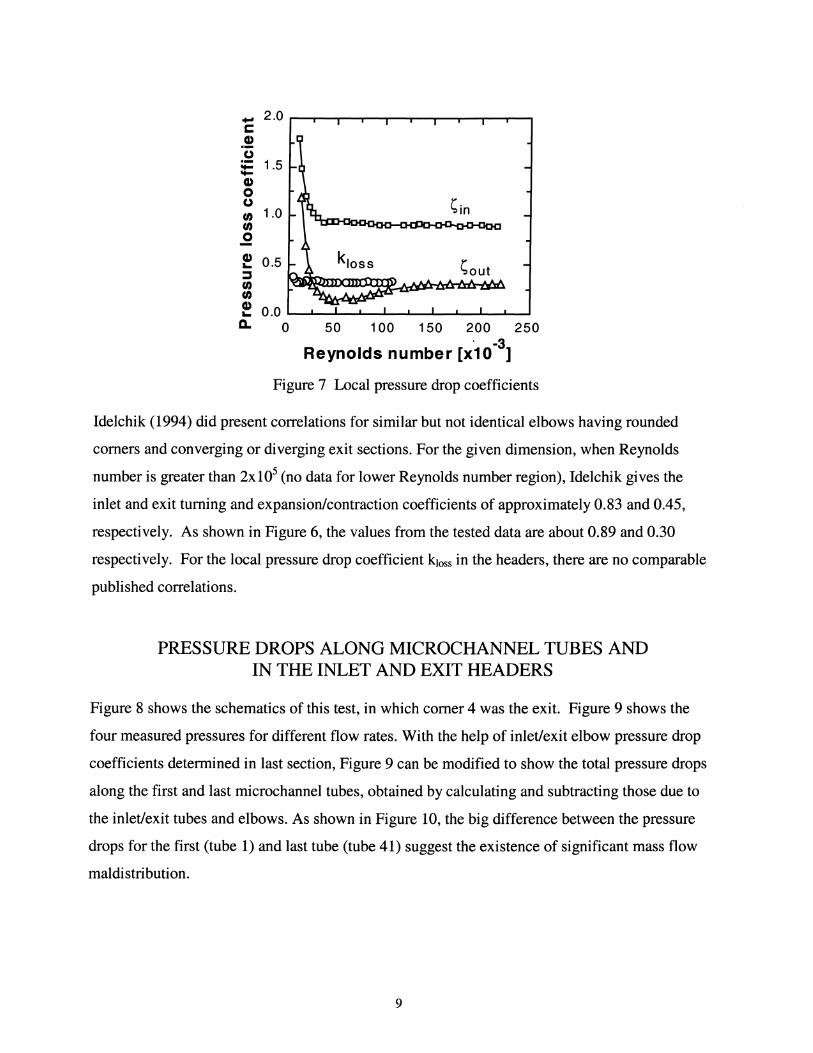
Figure 7 shows the coefficients calculated from the experimental data. In calculating the
Reynolds number for elbow pressure drop, tube diameters were used because the elbow's smaller
diameter side is always connected to a tube with the same diameter. For the header, the
maximum hydraulic diameter was used in Reynolds number and mass flux calculation.
8
_ 2.0 r---.-.....,.-r---r-.......,.-,...--r-.......,.--r---. C .! u :;: 1.5 -CI) o u U) 1.0 U)
o
f 0.5 :::J U) U)
~in
~out
CI) ... 0.0 '---'--........ _'--...&....---L._.L.-....&....---L._.&...... .....
Q. 0 50 100 150 200 250 , -3
Reynolds number [x10 ]
Figure 7 Local pressure drop coefficients
Idelchik (1994) did present correlations for similar but not identical elbows having rounded
corners and converging or diverging exit sections. For the given dimension, when Reynolds
number is greater than 2x10⁵ (no data for lower Reynolds number region), Idelchik gives the
inlet and exit turning and expansion/contraction coefficients of approximately 0.83 and 0.45,
respectively. As shown in Figure 6, the values from the tested data are about 0.89 and 0.30
respectively. For the local pressure drop coefficient k10ss in the headers, there are no comparable
published correlations.
PRESSURE DROPS ALONG MICROCHANNEL TUBES AND IN THE INLET AND EXIT HEADERS
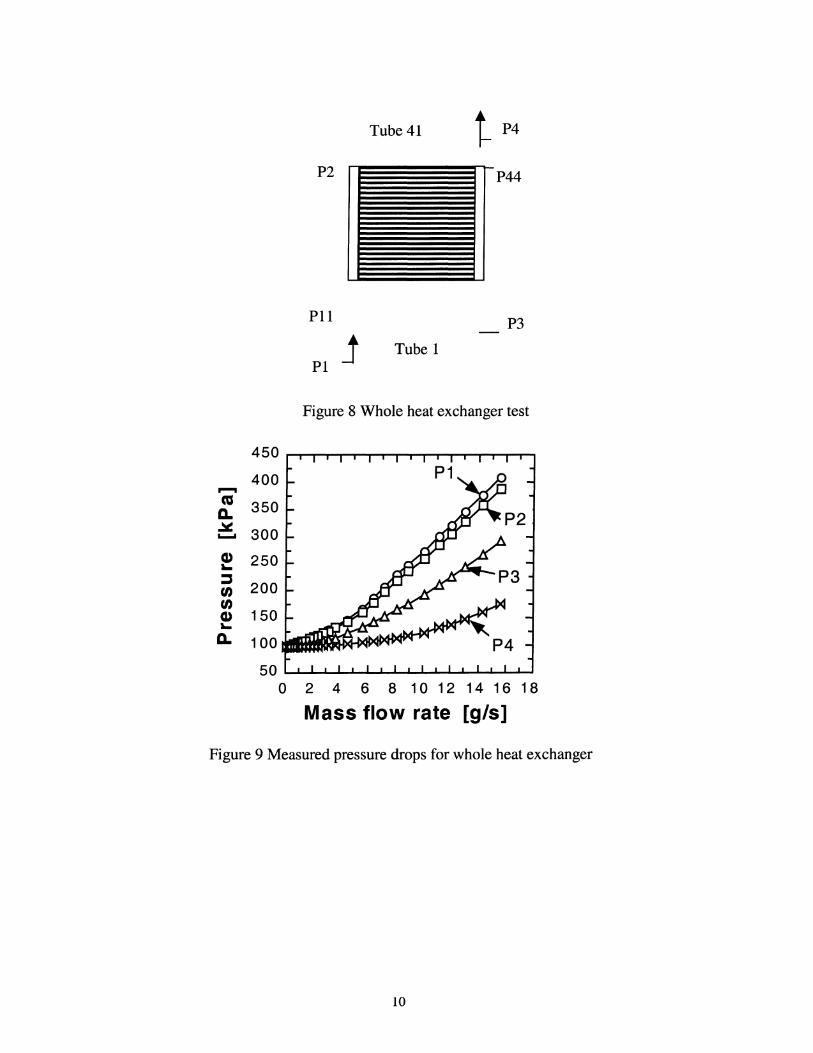
Figure 8 shows the schematics of this test, in which corner 4 was the exit. Figure 9 shows the
four measured pressures for different flow rates. With the help of inlet/exit elbow pressure drop
coefficients determined in last section, Figure 9 can be modified to show the total pressure drops
along the first and last microchannel tubes, obtained by calculating and subtracting those due to
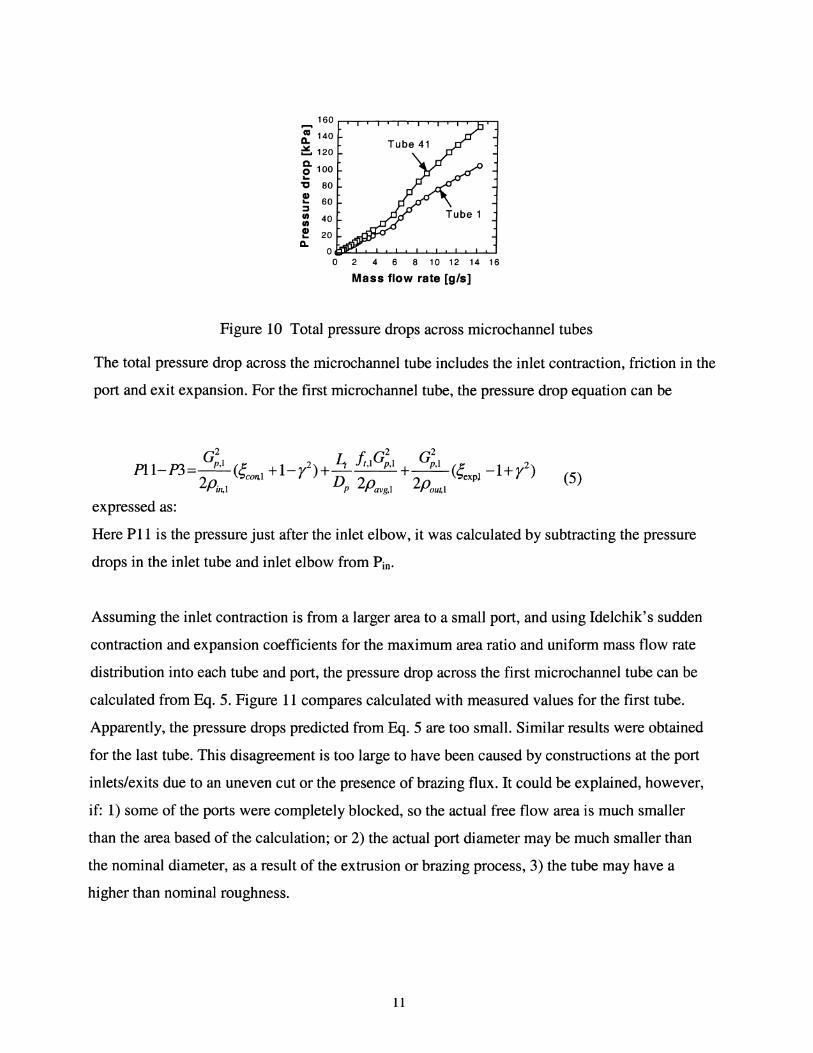
the inlet/exit tubes and elbows. As shown in Figure 10, the big difference between the pressure
drops for the first (tube 1) and last tube (tube 41) suggest the existence of significant mass flow
maldistribution.
9
Tube 41
P2
Pl1 P3
PI j Tube 1
Figure 8 Whole heat exchanger test
450
400 1""""1
C'O 350 c.. ~ 300 ...... CI> 250 '-:::::J
200 0 0 CI> 150 '-c.. 100
50 0 2 4 6 8 10 12 14 16 18
Mass flow rate [g/s]
Figure 9 Measured pressure drops for whole heat exchanger
10
m 140 a. ~ 120
g- 100 ... 'g 80
!! 60 :::J :: 40
!! 20 a.
2 4 6 8 10 12 14 16
Mass flow rate [g/s]
Figure 10 Total pressure drops across microchannel tubes
The total pressure drop across the microchannel tube includes the inlet contraction, friction in the
port and exit expansion. For the first microchannel tube, the pressure drop equation can be
G2 ~ G2 G2 PlI-P3=~(f: +1_y2)+ 4 Jt,l p,l +_p,_l (f: _1+y2)
2 '='con,l D 2 2 '='expl (5) Pin,l P Pavg,l Poud
expressed as:
Here PH is the pressure just after the inlet elbow, it was calculated by subtracting the pressure
drops in the inlet tube and inlet elbow from Pin.
Assuming the inlet contraction is from a larger area to a small port, and using Idelchik's sudden
contraction and expansion coefficients for the maximum area ratio and uniform mass flow rate
distribution into each tube and port, the pressure drop across the first microchannel tube can be
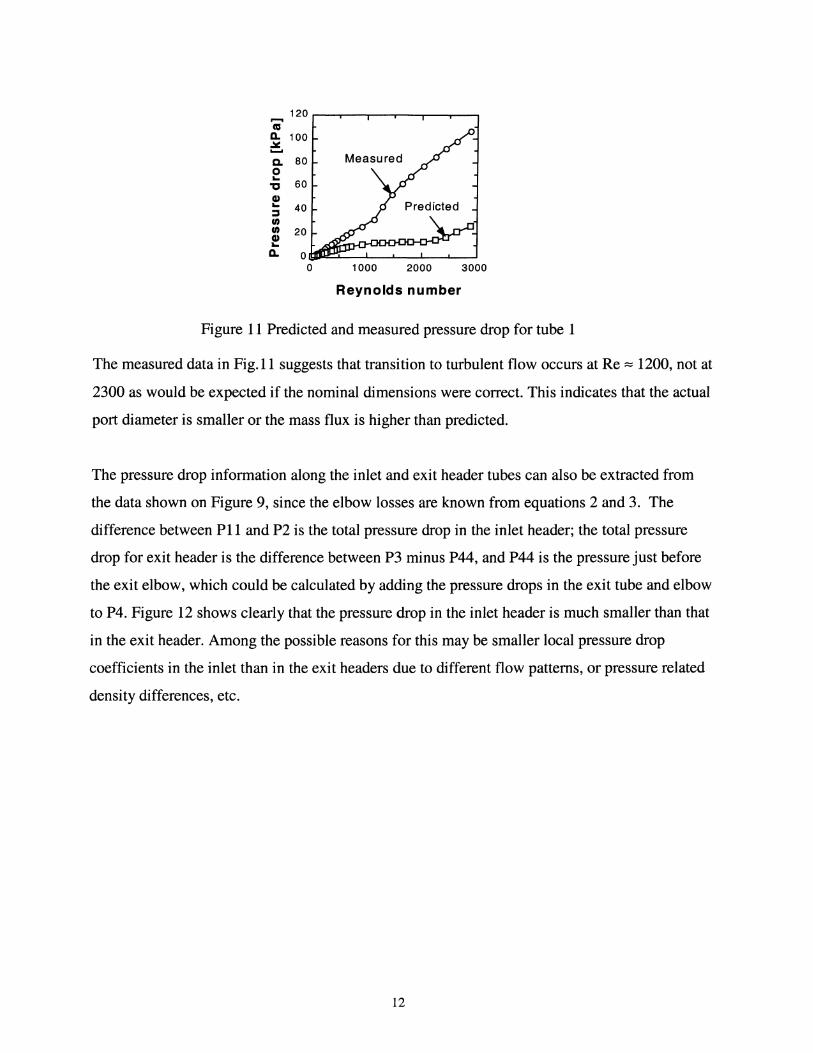
calculated from Eq. 5. Figure 11 compares calculated with measured values for the first tube.
Apparently, the pressure drops predicted from Eq. 5 are too small. Similar results were obtained
for the last tube. This disagreement is too large to have been caused by constructions at the port
inlets/exits due to an uneven cut or the presence of brazing flux. It could be explained, however,
if: 1) some of the ports were completely blocked, so the actual free flow area is much smaller
than the area based of the calculation; or 2) the actual port diameter may be much smaller than
the nominal diameter, as a result of the extrusion or brazing process, 3) the tube may have a
higher than nominal roughness.
11
120 ....... «I a.. 100 ~ ...... 0- 80 0 ...
60 'tJ CI) ... 40 :::J In In 20 CI) ...
a.. 0 0 1000 2000 3000
Reynolds number
Figure 11 Predicted and measured pressure drop for tube 1
The measured data in Fig. 11 suggests that transition to turbulent flow occurs at Re:::: 1200, not at
2300 as would be expected if the nominal dimensions were correct. This indicates that the actual
port diameter is smaller or the mass flux is higher than predicted.
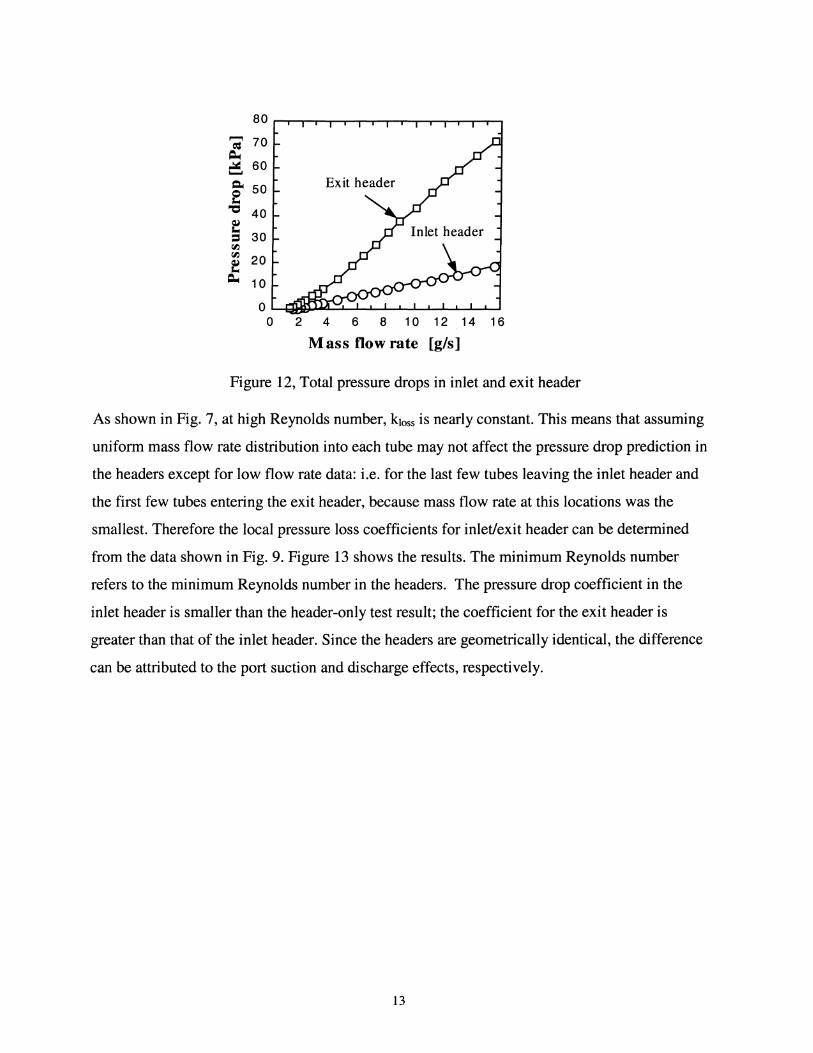
The pressure drop information along the inlet and exit header tubes can also be extracted from
the data shown on Figure 9, since the elbow losses are known from equations 2 and 3. The
difference between Pll and P2 is the total pressure drop in the inlet header; the total pressure
drop for exit header is the difference between P3 minus P44, and P44 is the pressure just before
the exit elbow, which could be calculated by adding the pressure drops in the exit tube and elbow
to P4. Figure 12 shows clearly that the pressure drop in the inlet header is much smaller than that
in the exit header. Among the possible reasons for this may be smaller local pressure drop
coefficients in the inlet than in the exit headers due to different flow patterns, or pressure related
density differences, etc.
12
80 ,....,
70 = ~ ..::.:: 60 ........ Q.. 50 e
"0 40 ~
"" 30 = rI.l rI.l 20 ~ ~ 10
0 0 2 4 6 8 10 12 14 16
Mass flow rate [g/s]
Figure 12, Total pressure drops in inlet and exit header
As shown in Fig. 7, at high Reynolds number, k10ss is nearly constant. This means that assuming
uniform mass flow rate distribution into each tube may not affect the pressure drop prediction in
the headers except for low flow rate data: i.e. for the last few tubes leaving the inlet header and
the first few tubes entering the exit header, because mass flow rate at this locations was the
smallest. Therefore the local pressure loss coefficients for inlet/exit header can be determined
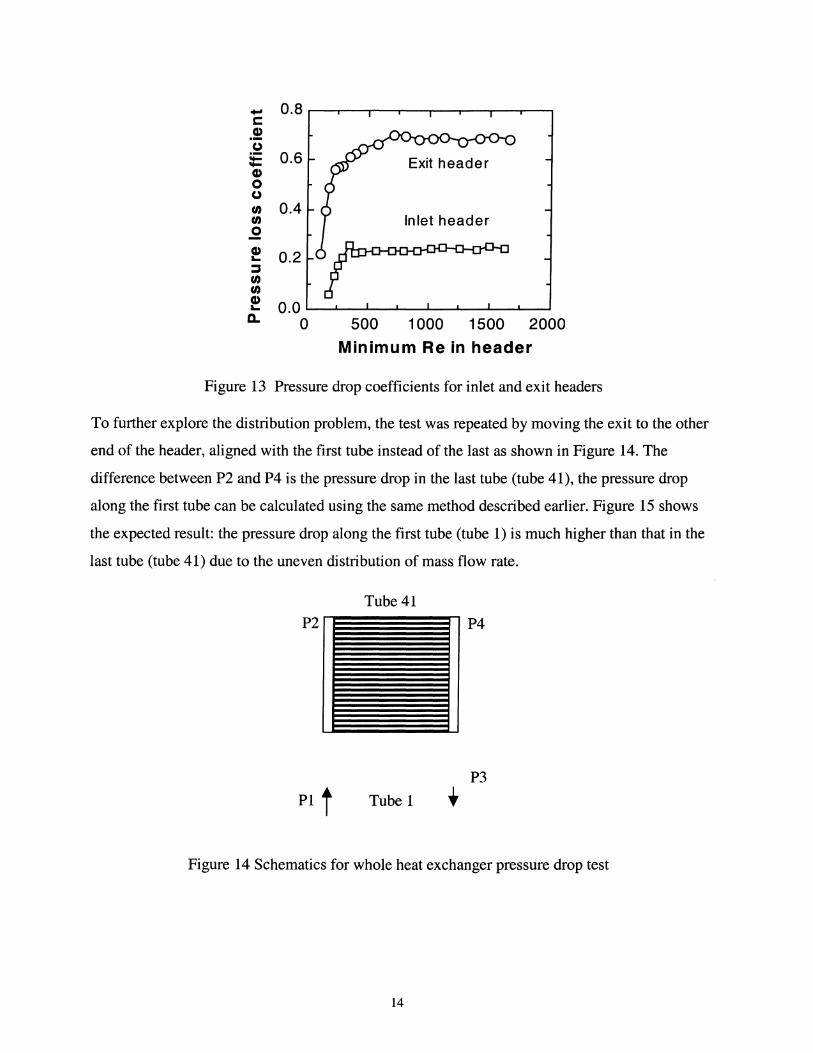
from the data shown in Fig. 9. Figure 13 shows the results. The minimum Reynolds number
refers to the minimum Reynolds number in the headers. The pressure drop coefficient in the
inlet header is smaller than the header-only test result; the coefficient for the exit header is
greater than that of the inlet header. Since the headers are geometrically identical, the difference
can be attributed to the port suction and discharge effects, respectively.
13
- 0.8 c
.S! ()
~ 0.6 -CD 0 ()
UJ 0.4 UJ Inlet header .2 CD I- 0.2 ::::s UJ UJ CD 0.0 l-
n. 0 500 1000 1500 2000 Minimum Re in header
Figure 13 Pressure drop coefficients for inlet and exit headers
To further explore the distribution problem, the test was repeated by moving the exit to the other
end of the header, aligned with the first tube instead of the last as shown in Figure 14. The
difference between P2 and P4 is the pressure drop in the last tube (tube 41), the pressure drop
along the first tube can be calculated using the same method described earlier. Figure 15 shows
the expected result: the pressure drop along the first tube (tube 1) is much higher than that in the
last tube (tube 41) due to the uneven distribution of mass flow rate.
Tube 41
P4
P3
Tube 1
Figure 14 Schematics for whole heat exchanger pressure drop test
14

...... CO a. ~ ...... C. 0 ...
"C Q) ... :::J tn tn tn Q) ... a.
180
160
140
120
100
80
60
40
20
500 1000 1500 2000 2500 3000
Reynolds number at port inlet
Figure 15 Measured pressure drops along tubes
PORT NUMBER AND DIAMETER DETERMINATION
After the four coefficients were determined, Eq. 1 could be used to predict the pressure drop
along the heat exchanger, for comparison with the tested data. The equations could also be used
as constraints in an optimization analysis to find the "actual" number of open ports and their
average diameter from the test data - the values that minimize the mean squared errors between
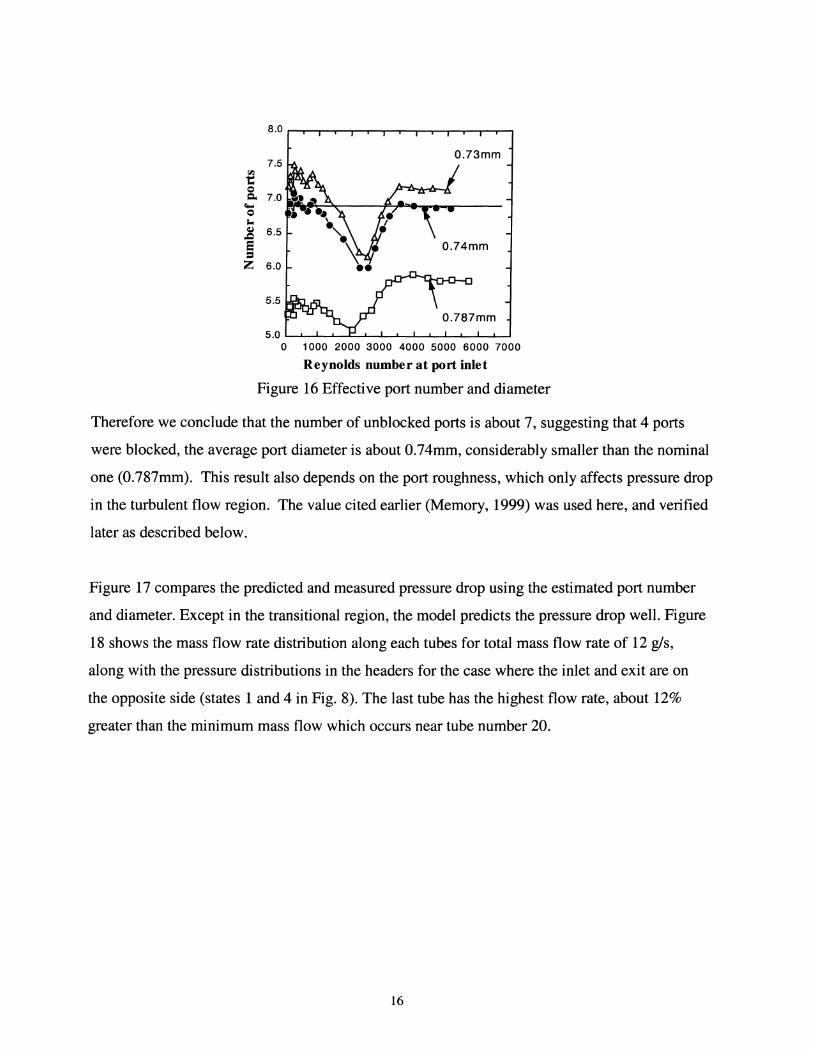
calculations and data. Figure 16 shows the optimized port diameter and port number. The results
are illustrated below using a heuristic approach: given a port diameter, use the test data calculate
the number f ports; when the number of ports calculated from both turbulent and "high-Re
laminar data are equal, the error-minimizing value of average diameter is identified. This port
number is assumed to be close to the actual port number that was not blocked - an assumption
that will be verified later. The data in the laminar flow region with very low flow rate is
expected to be "noisy", as can be seen from figurel3 and 15. Because the flow condition in the
header is also laminar, so the local pressure drop coefficient was not constant along the length of
the header. The calculated results in Fig. 16 show clearly that the laminar and turbulent flow
data contain the same information when the parameter values are estimated to be Dp=O.74 mm
and Np=7.
15
t Q C.
eo.. Q
'" ~ .c E :I Z
8.0
7.5
7.0
6.5
6.0
5.5
O.73mm
1000 2000 3000 4000 5000 6000 7000
Reynolds number at port inlet
Figure 16 Effective port number and diameter
Therefore we conclude that the number of unblocked ports is about 7, suggesting that 4 ports
were blocked, the average port diameter is about 0.74mm, considerably smaller than the nominal
one (0.787mm). This result also depends on the port roughness, which only affects pressure drop
in the turbulent flow region. The value cited earlier (Memory, 1999) was used here, and verified
later as described below.
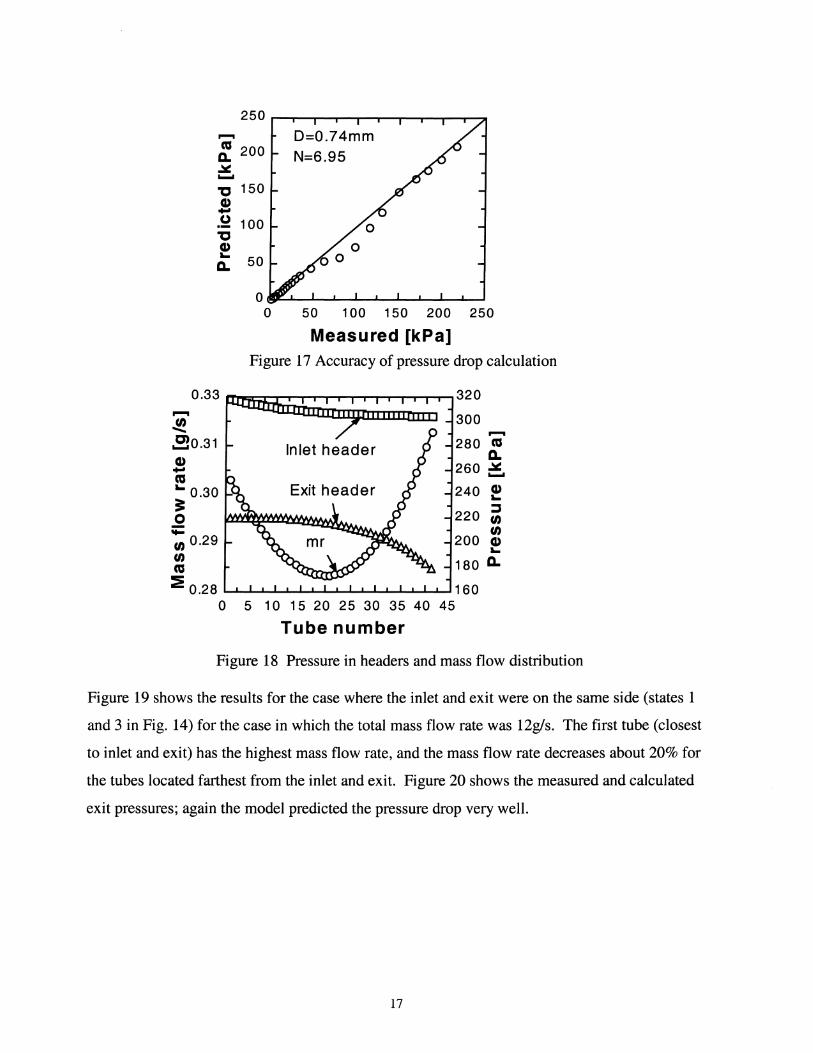
Figure 17 compares the predicted and measured pressure drop using the estimated port number
and diameter. Except in the transitional region, the model predicts the pressure drop well. Figure
18 shows the mass flow rate distribution along each tubes for total mass flow rate of 12 gis,
along with the pressure distributions in the headers for the case where the inlet and exit are on
the opposite side (states 1 and 4 in Fig. 8). The last tube has the highest flow rate, about 12%
greater than the minimum mass flow which occurs near tube number 20.
16
...... ~ 200 ~ ...... 'C 150 CI) -.2 100 'C CI)
a:. 50
D=O.74mm N=6.95
o~~~~~~~~~~~~
o 50 100 150 200 250
Measured [kPa] Figure 17 Accuracy of pressure drop calculation
0.33 fllliIi1nnnnm;~;~~~;;]320 ...... L 300 .!! ...... SO.31 280 ca
Q.
! 260 ~ ca ... 0.30 240 2:! ~ 220 ~ ;:: tn tn 0.29 200 2:! : 180 Q.
:E 0.28 L..J.......L......IL.....L.....L...J.....L...L....L.....L...JL..J......L.....I--L-..L..L....I 1 60 o 5 10 15 20 25 30 35 40 45
Tube number
Figure 18 Pressure in headers and mass flow distribution
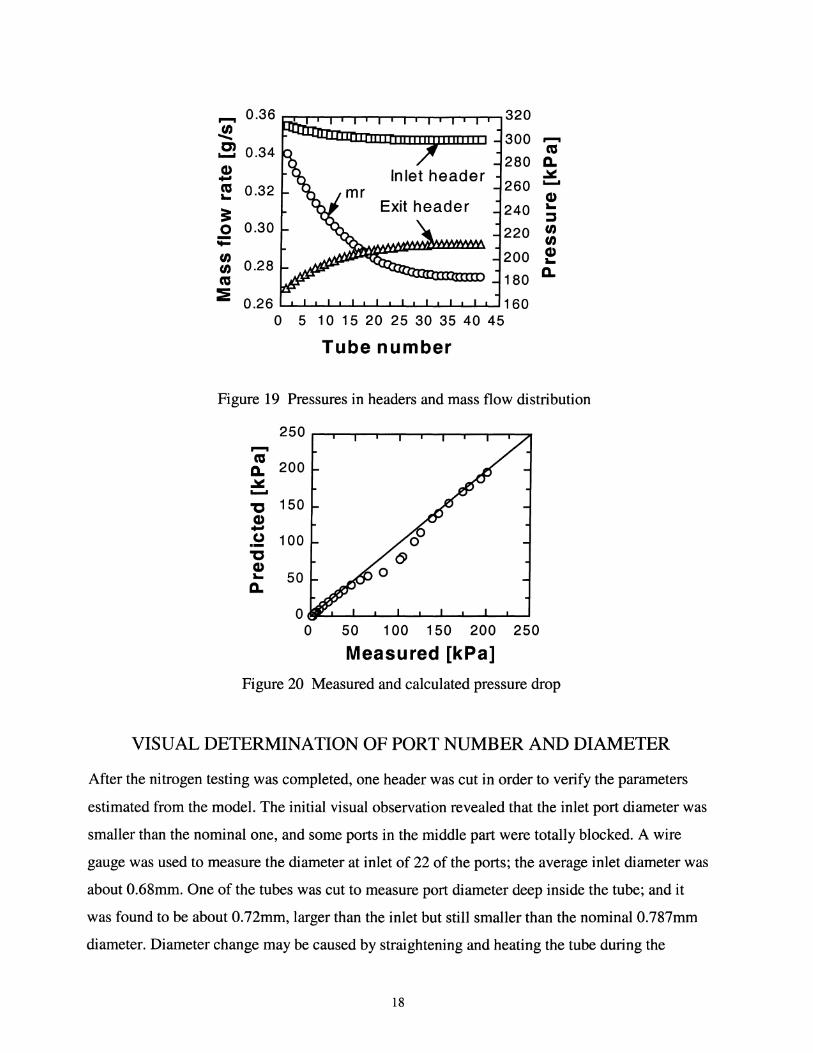
Figure 19 shows the results for the case where the inlet and exit were on the same side (states 1
and 3 in Fig. 14) for the case in which the total mass flow rate was 12g1s. The first tube (closest
to inlet and exit) has the highest mass flow rate, and the mass flow rate decreases about 20% for
the tubes located farthest from the inlet and exit. Figure 20 shows the measured and calculated
exit pressures; again the model predicted the pressure drop very well.
17
...... 0.36 320
.!!! 300 ...... C) 0.34 CO ......
280 a. CD ~ ...
260 ...... CO 0.32 ... CD
:: ... ::::J
0 0.30 0 ;: 0 0 200 CD
0.28 ... 0 a. CO 180 ::E 0.26 160
0 5 10 15 20 25 30 35 40 45
Tube number
Figure 19 Pressures in headers and mass flow distribution
...... CO a. ~ ...... "C CD ... . !:! "C CD ... a.
250
200
150
100
50
50 100 150 200 250
Measured [kPa]
Figure 20 Measured and calculated pressure drop
VISUAL DETERMINATION OF PORT NUMBER AND DIAMETER
After the nitrogen testing was completed, one header was cut in order to verify the parameters
estimated from the model. The initial visual observation revealed that the inlet port diameter was
smaller than the nominal one, and some ports in the middle part were totally blocked. A wire
gauge was used to measure the diameter at inlet of 22 of the ports; the average inlet diameter was
about 0.68mm. One of the tubes was cut to measure port diameter deep inside the tube; and it
was found to be about 0.72mm, larger than the inlet but still smaller than the nominal 0.787mm
diameter. Diameter change may be caused by straightening and heating the tube during the
18
manufacturing process (Baldantoni, 2000) so the port may no longer be circular. Its perimeter
may be unchanged, but the hydraulic diameter will be smaller.
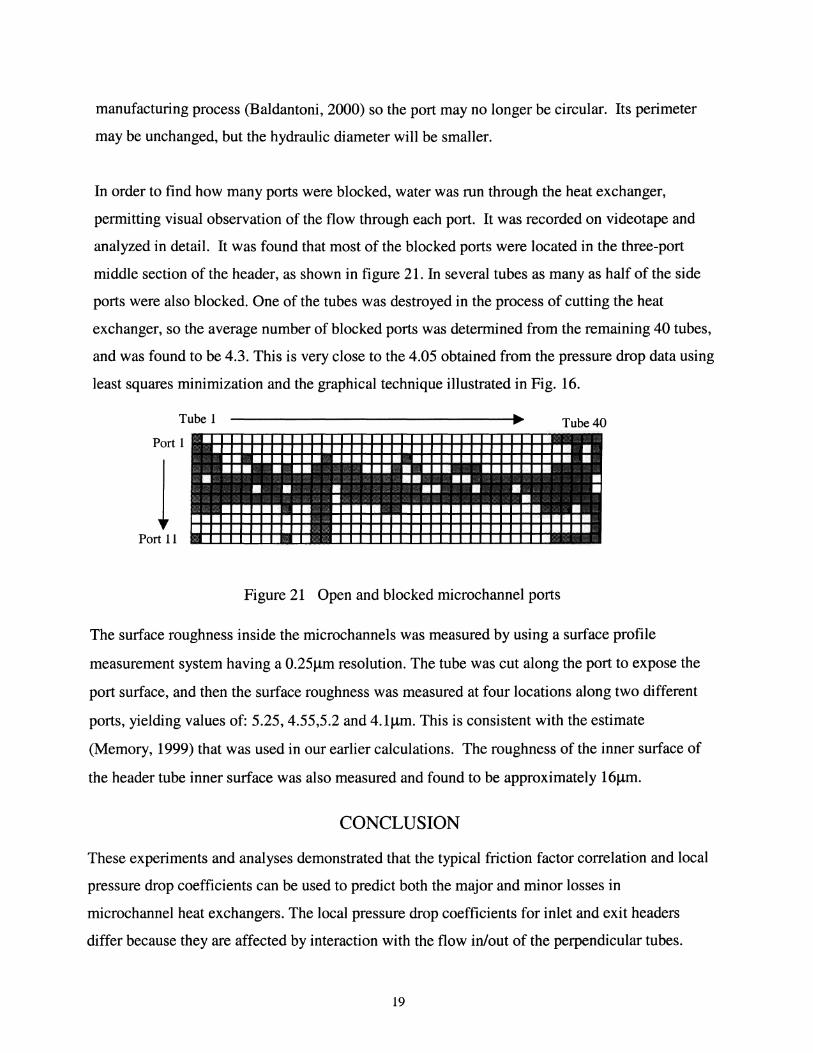
In order to find how many ports were blocked, water was run through the heat exchanger,
permitting visual observation of the flow through each port. It was recorded on videotape and
analyzed in detail. It was found that most of the blocked ports were located in the three-port
middle section of the header, as shown in figure 21. In several tubes as many as half of the side
ports were also blocked. One of the tubes was destroyed in the process of cutting the heat
exchanger, so the average number of blocked ports was determined from the remaining 40 tubes,
and was found to be 4.3. This is very close to the 4.05 obtained from the pressure drop data using
least squares minimization and the graphical technique illustrated in Fig. 16.
Tube 1
Port 1
1 Port 11
Tube 40
Figure 21 Open and blocked microchannel ports
The surface roughness inside the microchannels was measured by using a surface profile
measurement system having a 0.25J..lm resolution. The tube was cut along the port to expose the
port surface, and then the surface roughness was measured at four locations along two different
ports, yielding values of: 5.25, 4.55,5.2 and 4.1J..lm. This is consistent with the estimate
(Memory, 1999) that was used in our earlier calculations. The roughness of the inner surface of
the header tube inner surface was also measured and found to be approximately 16J..lm.
CONCLUSION
These experiments and analyses demonstrated that the typical friction factor correlation and local
pressure drop coefficients can be used to predict both the major and minor losses in
microchannel heat exchangers. The local pressure drop coefficients for inlet and exit headers
differ because they are affected by interaction with the flow in/out of the perpendicular tubes.
19
The pressure drop model presented here can be used to predict or optimize pressure and mass
flow distribution inside the heat exchanger tubes. If published correlations are unavailable for
some of the minor loss coefficients due to geometric uniqueness, they can be estimated using
least squares methods from simple nitrogen flow tests as described here. Finally in the more
common situation where those coefficients are known or easily estimated, the simulation model
can be used for quality control purposes -- as a baseline from which to identify such
manufacturing defects as port blockage or deviations from nominal port diameter.
ACKNOWLEDGEMENT
We are grateful to Hydro Aluminum A. S. and The Trane Company for supporting this research.
NOMENCLATURE
I) =diameter,mm f = friction factor, G = mass flux, kglm2.s L = length, mm N = number P = pressure, kPa T = temperature, °c
Greek letters
~ = local pressure loss coefficient ~ = expansion or contraction pressure drop coefficient p = density, kglm3
0', y = area ratio
Subscripts
avg = average con = contraction ee = exit elbow ehd = exit header et = exit tube exp = expansion ie = inlet elbow ihd = inlet header it = inlet tube
20

hd = header p = port t = tube
REFERENCES
Baldantoni, A. 2000. Personal communication. Hydro Aluminum A. S. Adrian MI.
Churchill, S. W. 1977. Friction-factor Equation Spans all Fluid-Flow Regimes. Chemical Engineering, November 7: 91-92
Graham, T. P. 1995. Friction and Heat Transfer Characteristics for Single-phase Flow in Microchannel Condenser Tubes. M. S. thesis, University of lllinois
Heun, M. K. 1995. Performance and Optimization of Microchannel Condensers. Ph.D. thesis, University of lllinois
Idelchik, I. E., Handbook of Hydraulic Resistance. 3rd Edition, CRC Press (1994).
Memory, S. 1999. Personal communication. Modine Manufacturing Co. Racine WI.
Olsson, C. O. 1994. Pressure Drop Characteristics of Small-sized Tubes. Paper number 94-W AIHT -1 presented at the Winter Annual Meeting of the American Society of Mechanical Engineers.
Peng, X. F., and G. P. Peterson. 1996. Convective Heat Transfer and Flow Friction for Water Flow in Microchannel Structures. Int. J. of Heat Mass Transfer 39 (12): 2599-2608
Wang, B. X., and X. F. Pengo 1994. Experimental Investigation on Liquid Forced-Convection Heat Transfer Through Microchannels. Int. J. Heat Mass Transfer 37 (suppl. 1): 73-82
Yin, J. M., Bullard, C. W. and Hmjak, P. S., "Model development for R744 Gas Cooler", University of lllinois at Urbana-Champaign, CR-29, 2000
21