presentation1.pptx, abdominal film reading, lecture 11
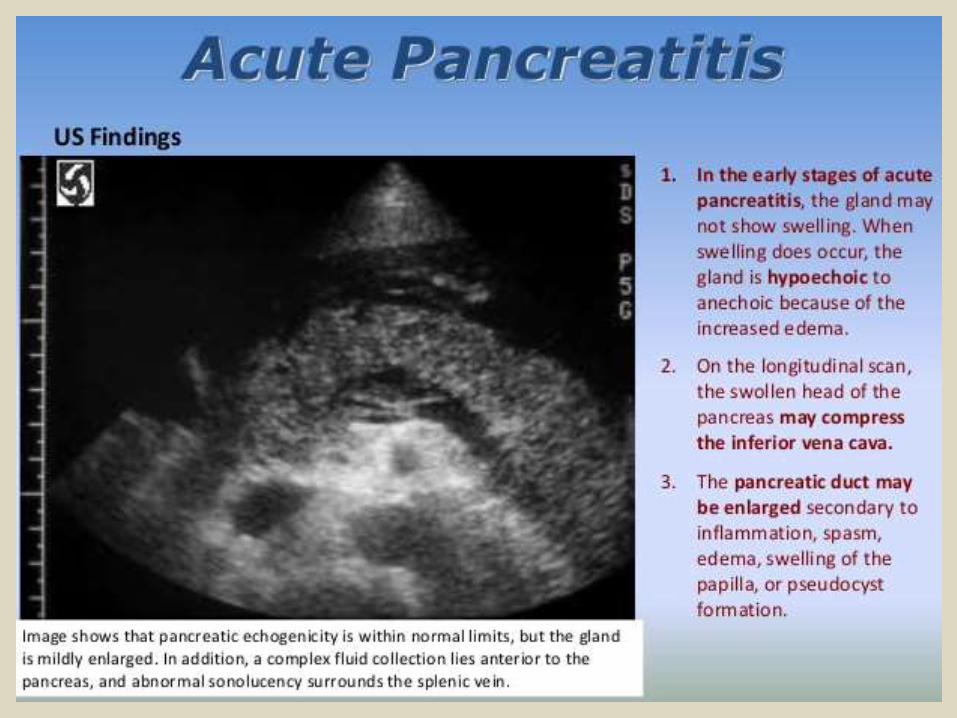
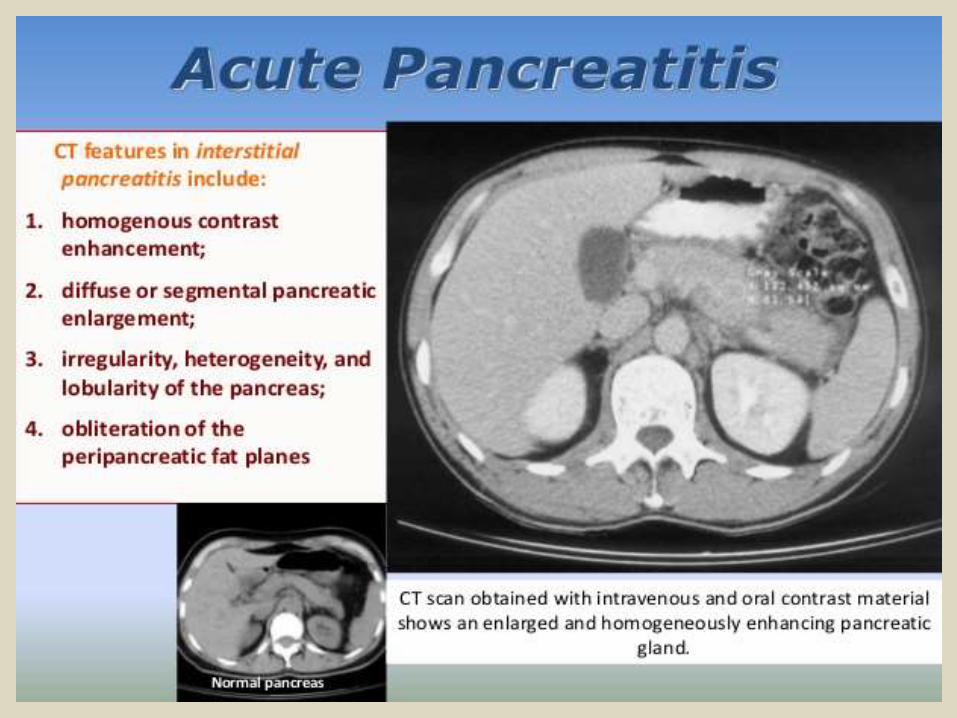
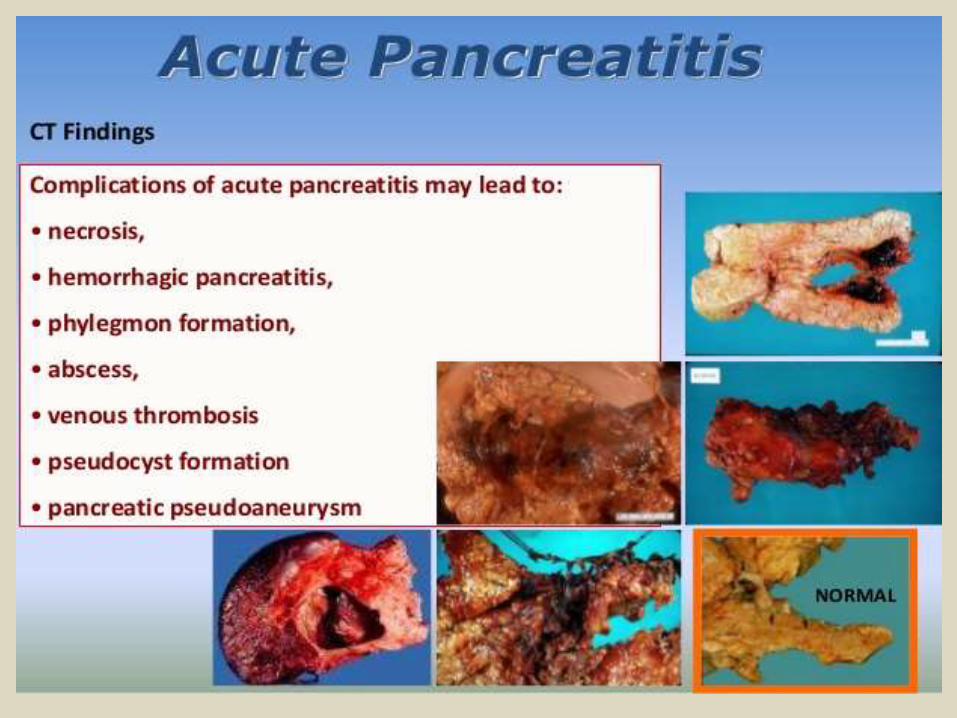
TRANSCRIPT
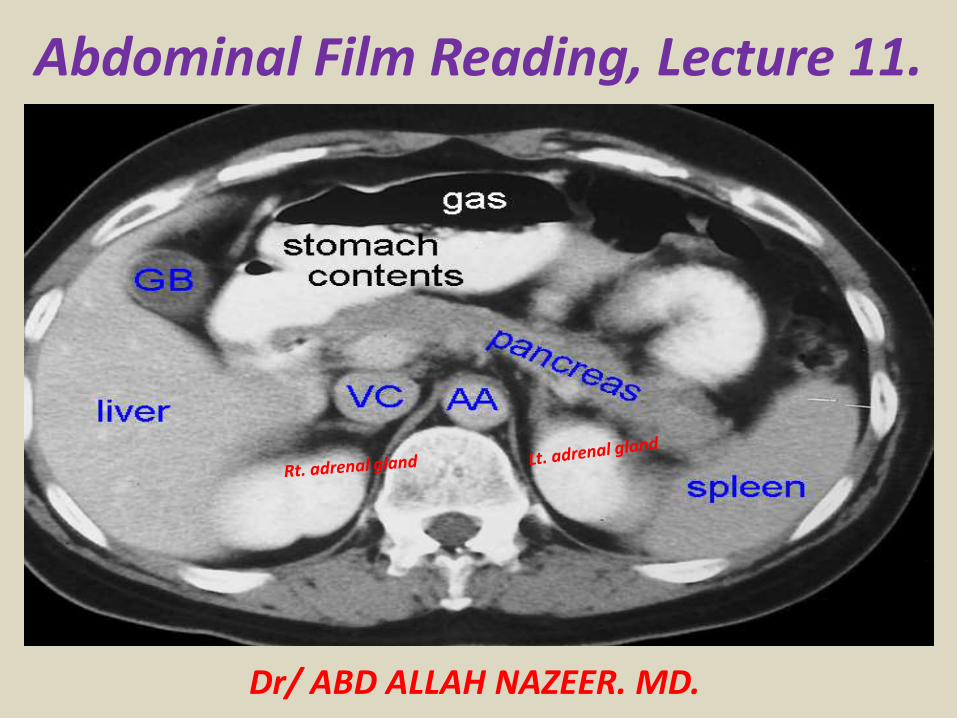
Abdominal Film Reading, Lecture 11.
Dr/ ABD ALLAH NAZEER. MD.
Diagnostic imaging of splenic disease.Primary diseases of the spleen are relatively rare. More frequently, the spleen is involved secondarily in hematological, oncological, infectious, immunological, vascular, and other systemic diseases. The spleen is the most commonly injured organ in blunt abdominal trauma. Anatomical and physiological basics are explained, in addition to embryological facts with resulting abnormalities, such as accessory and "wandering" spleen, and polysplenia. The most frequent primary and secondary diseases of the spleen, including rare diagnoses, are presented and illustrated. Hemangioma represents the most common primary benign tumor, and lymphoma the most common primary malignant tumor of the spleen. Diagnostic imaging does not a allow safe differentiation between Hodgkin's and non-Hodgkin's lymphoma. Simple cysts and calcifications need neither clarification nor a follow-up examination. Atypical cysts should be controlled within 3-6 months. Additional clarification using CT or MRT should be reserved for cases with a strong suspicion of clinically relevant primary or secondary splenic disease.
Gross AnatomyThe spleen is an intraperitoneal organ with a smooth serosal surface and is attached to the retroperitoneum by fatty ligaments that also contain its vascular supply. The splenic surfaces are described relative to their locations and are termed the diaphragmatic (phrenic) and visceral surfaces. The visceral surface is divided into an anterior or gastric ridge and a posterior or renal portion. The splenic hilum is directed anteromedially. The splenic artery and vein emerge from the splenic hilum in the form of six or more branches; the splenic artery is remarkable for its large size and turtuosity. The splenic artery is slightly superior to the vein.
Microscopic AnatomyThe spleen is divided into two compartments, namely, the red and white pulps, separated by the marginal zone. The white pulp is made up of T and B lymphocytes and located centrally, while the red pulp is composed of rich plexuses of tortuous venous sinuses.
Normal Variants and Congenital DiseasesAccessory SpleenFound in 10% of individuals, accessory spleens may be solitary or multiple and usually measure no more than 4 cm in diameter. The most common location is the splenic hilum . An accessory spleen should be distinguished from enlarged lymph nodes, as it follows the signal intensity and enhancement of the spleen on images obtained with various pulse sequences.
PolyspleniaPolysplenia is seen in association with abdominal Situs and cardiovascular anomalies. This condition is more common in females. Classically, numerous small splenic masses are seen in the right or left hypochondrium.
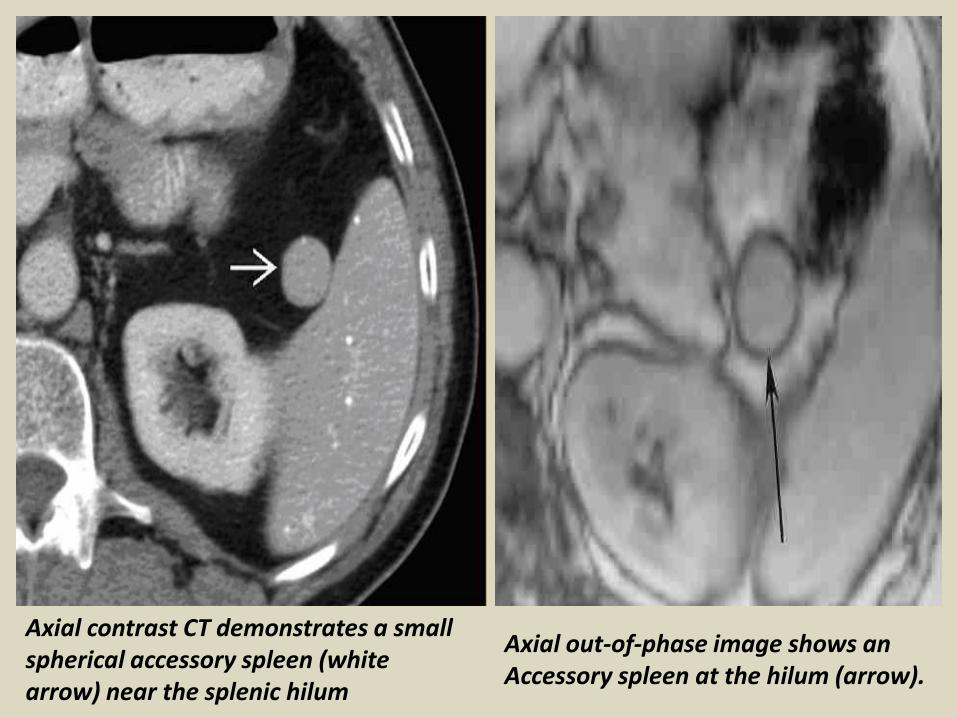
Axial out-of-phase image shows an Accessory spleen at the hilum (arrow).
Axial contrast CT demonstrates a small spherical accessory spleen (white arrow) near the splenic hilum
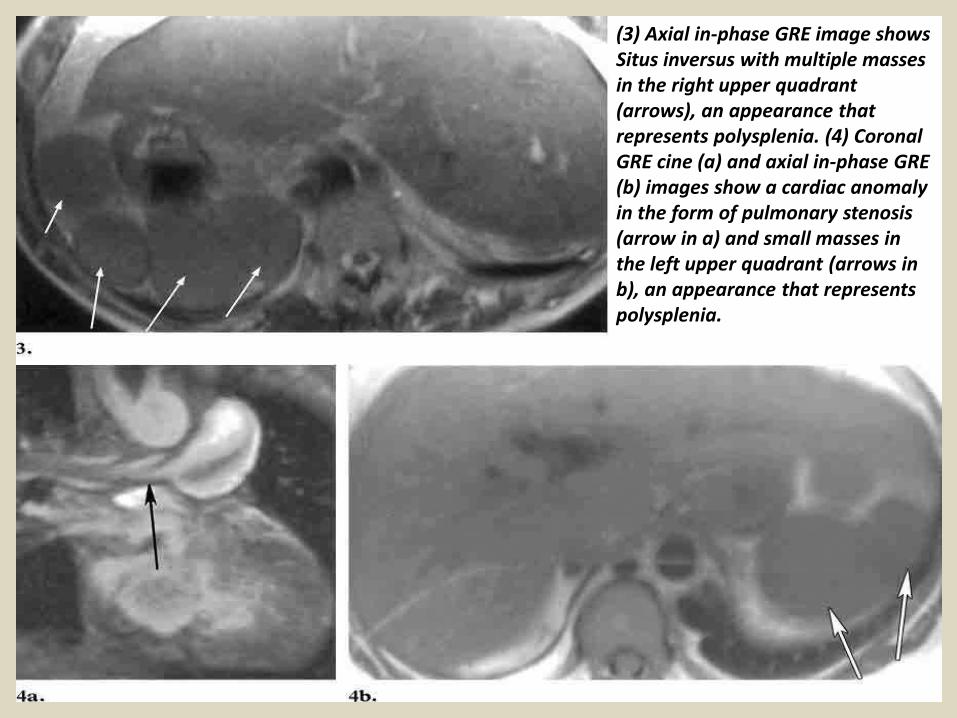
(3) Axial in-phase GRE image shows Situs inversus with multiple masses in the right upper quadrant (arrows), an appearance that represents polysplenia. (4) Coronal GRE cine (a) and axial in-phase GRE (b) images show a cardiac anomaly in the form of pulmonary stenosis (arrow in a) and small masses in the left upper quadrant (arrows in b), an appearance that represents polysplenia.
TraumaThe spleen is the most commonly ruptured intra-abdominal organ in the setting of trauma, being particularly susceptible to injury after blunt trauma due to its complex ligamentous attachments and spongy parenchymal consistency. The MR imaging characteristics of splenic hematomas follow those of heme and heme products, with evolution like hematomas in other parts of the body. Compared to splenic signal intensity, acute hematomas demonstrate prolonged T2. Blood products evolve over time into methemoglobin, deoxyhemoglobin, and other paramagnetic degradation products with concomitant signal intensity changes. The evolving concepts in trauma care promoting nonsurgical management of liver and splenic injuries create the need for follow-up cross-sectional imaging studies in these patients.
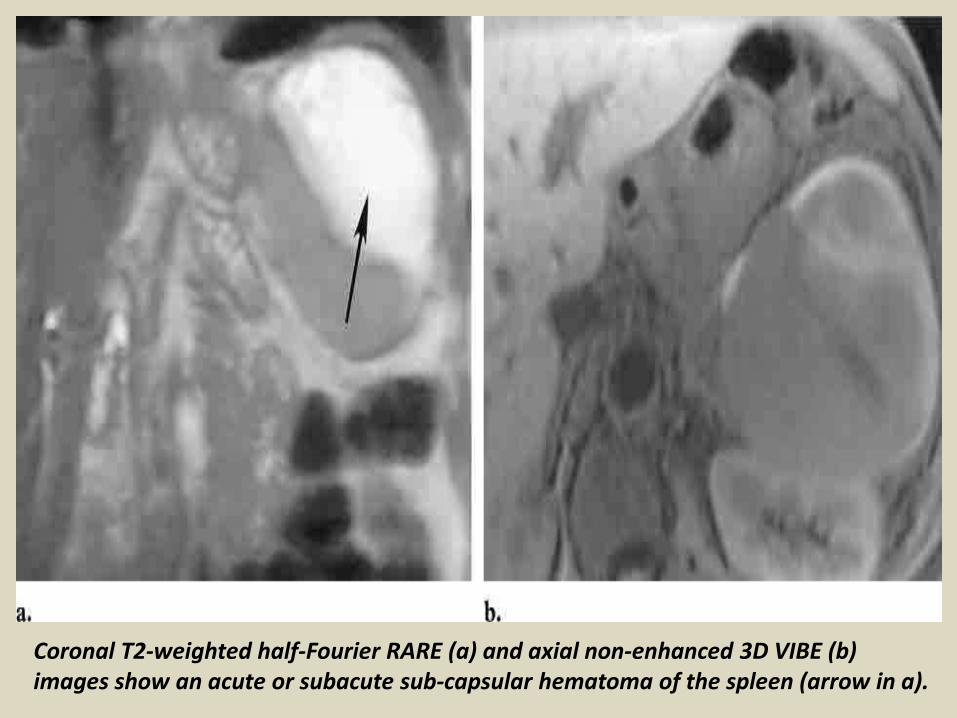
Coronal T2-weighted half-Fourier RARE (a) and axial non-enhanced 3D VIBE (b) images show an acute or subacute sub-capsular hematoma of the spleen (arrow in a).
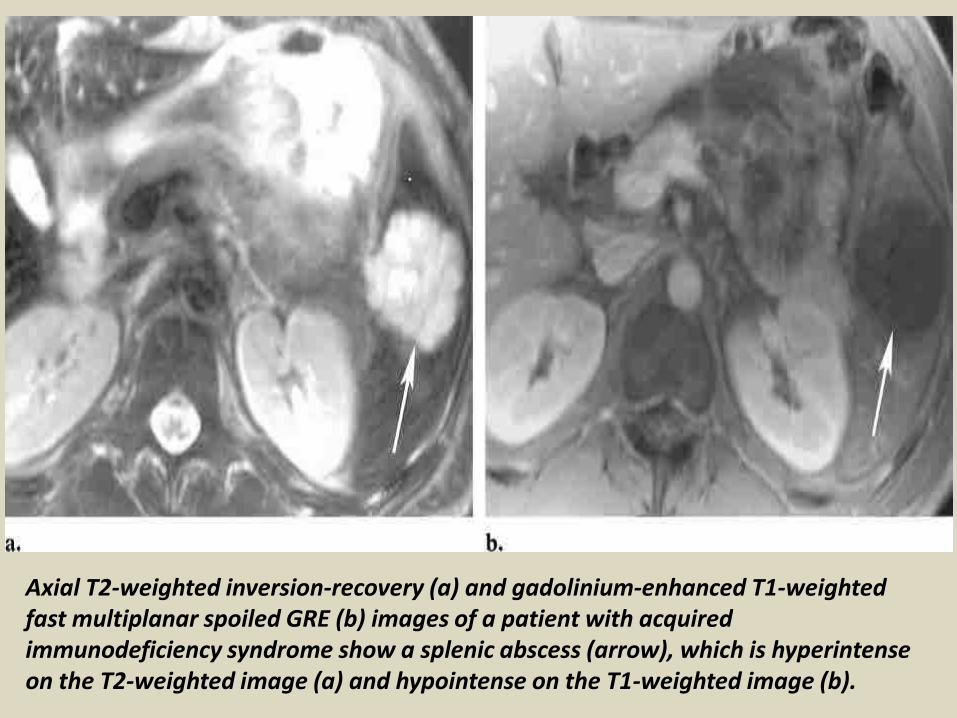
Axial T2-weighted inversion-recovery (a) and gadolinium-enhanced T1-weighted fast multiplanar spoiled GRE (b) images of a patient with acquired immunodeficiency syndrome show a splenic abscess (arrow), which is hyperintense on the T2-weighted image (a) and hypointense on the T1-weighted image (b).
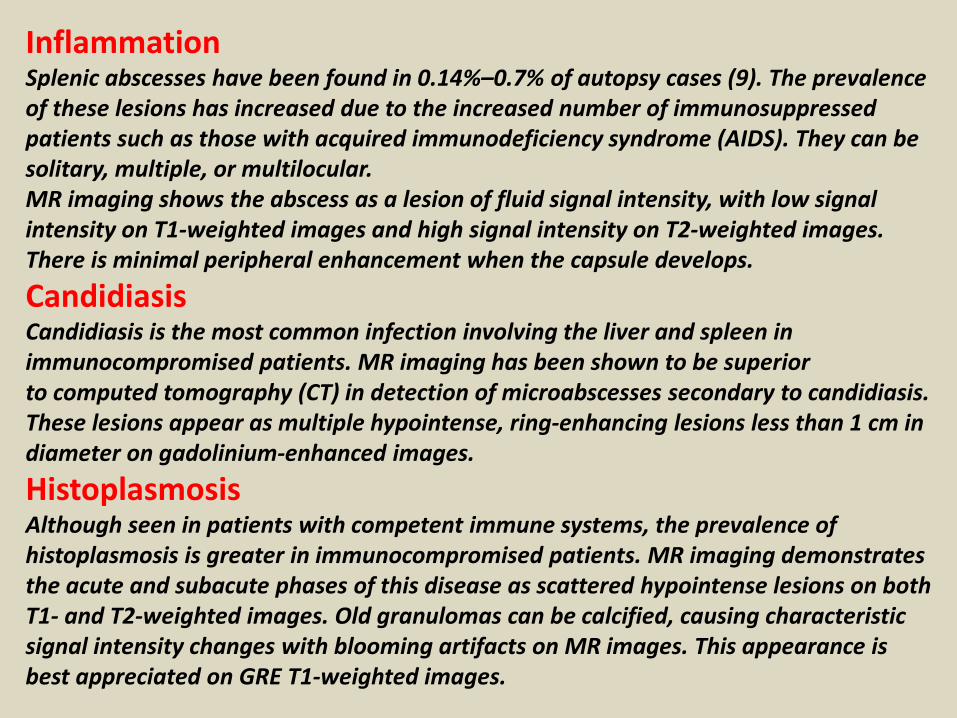
InflammationSplenic abscesses have been found in 0.14%–0.7% of autopsy cases (9). The prevalence of these lesions has increased due to the increased number of immunosuppressed patients such as those with acquired immunodeficiency syndrome (AIDS). They can be solitary, multiple, or multilocular. MR imaging shows the abscess as a lesion of fluid signal intensity, with low signal intensity on T1-weighted images and high signal intensity on T2-weighted images. There is minimal peripheral enhancement when the capsule develops.
CandidiasisCandidiasis is the most common infection involving the liver and spleen in immunocompromised patients. MR imaging has been shown to be superiorto computed tomography (CT) in detection of microabscesses secondary to candidiasis. These lesions appear as multiple hypointense, ring-enhancing lesions less than 1 cm in diameter on gadolinium-enhanced images.
HistoplasmosisAlthough seen in patients with competent immune systems, the prevalence of histoplasmosis is greater in immunocompromised patients. MR imaging demonstrates the acute and subacute phases of this disease as scattered hypointense lesions on both T1- and T2-weighted images. Old granulomas can be calcified, causing characteristic signal intensity changes with blooming artifacts on MR images. This appearance is best appreciated on GRE T1-weighted images.
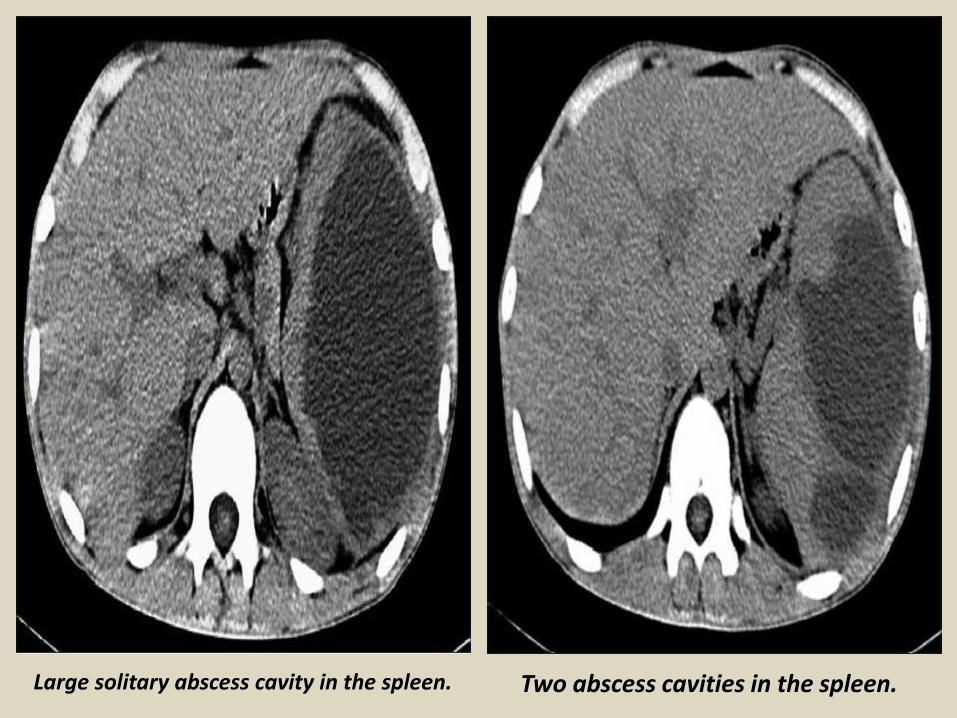
Large solitary abscess cavity in the spleen. Two abscess cavities in the spleen.
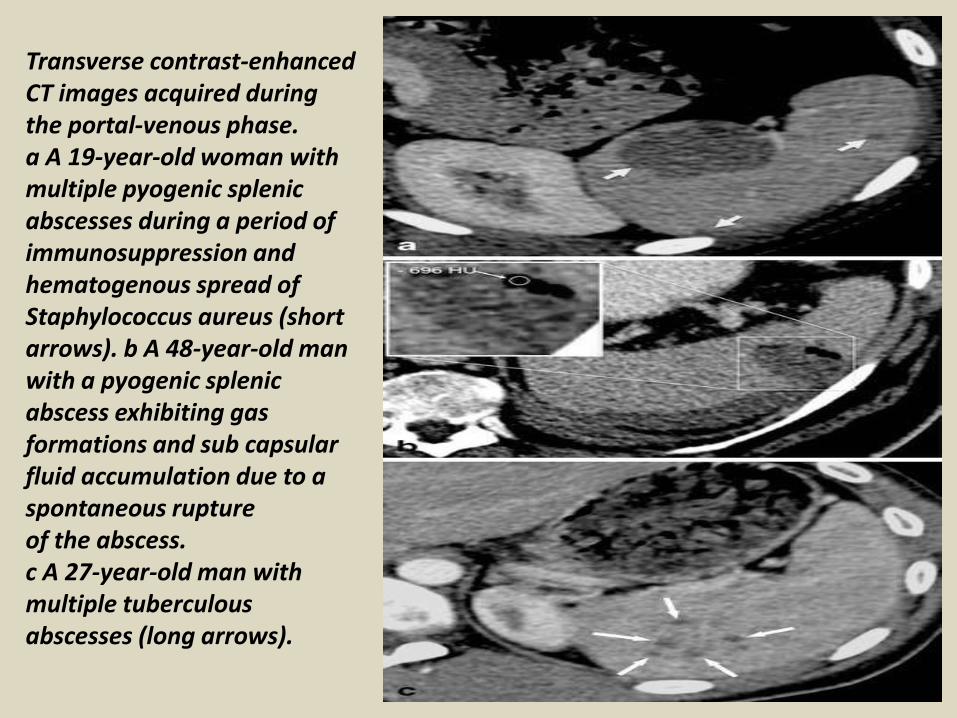
Transverse contrast-enhanced CT images acquired during the portal-venous phase. a A 19-year-old woman with multiple pyogenic splenic abscesses during a period of immunosuppression and hematogenous spread of Staphylococcus aureus (short arrows). b A 48-year-old man with a pyogenic splenic abscess exhibiting gas formations and sub capsular fluid accumulation due to a spontaneous rupture of the abscess. c A 27-year-old man with multiple tuberculous abscesses (long arrows).
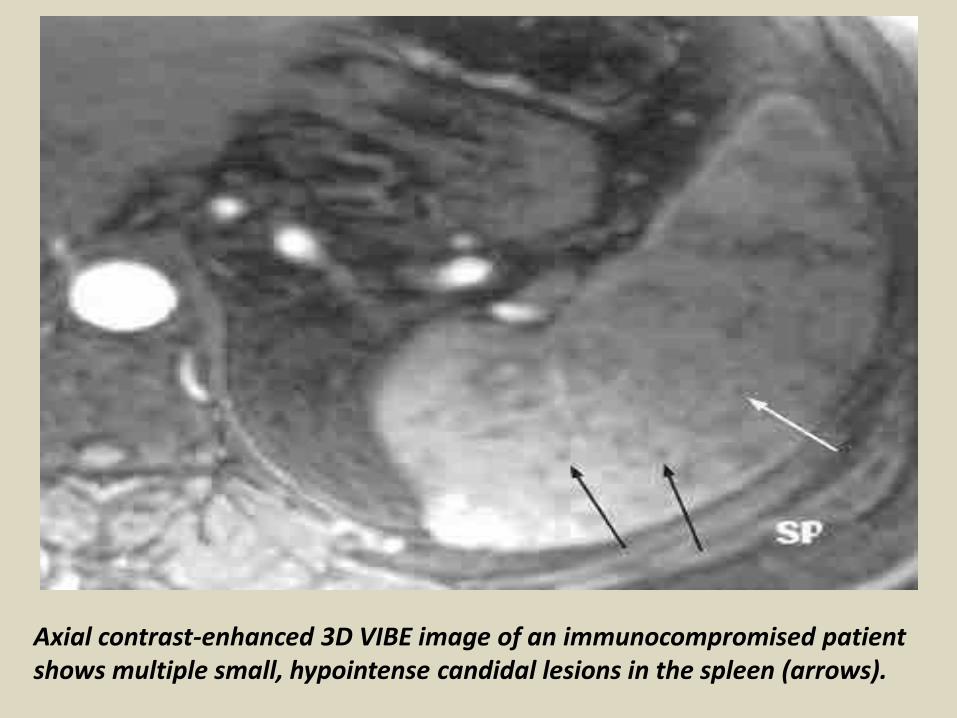
Axial contrast-enhanced 3D VIBE image of an immunocompromised patient shows multiple small, hypointense candidal lesions in the spleen (arrows).
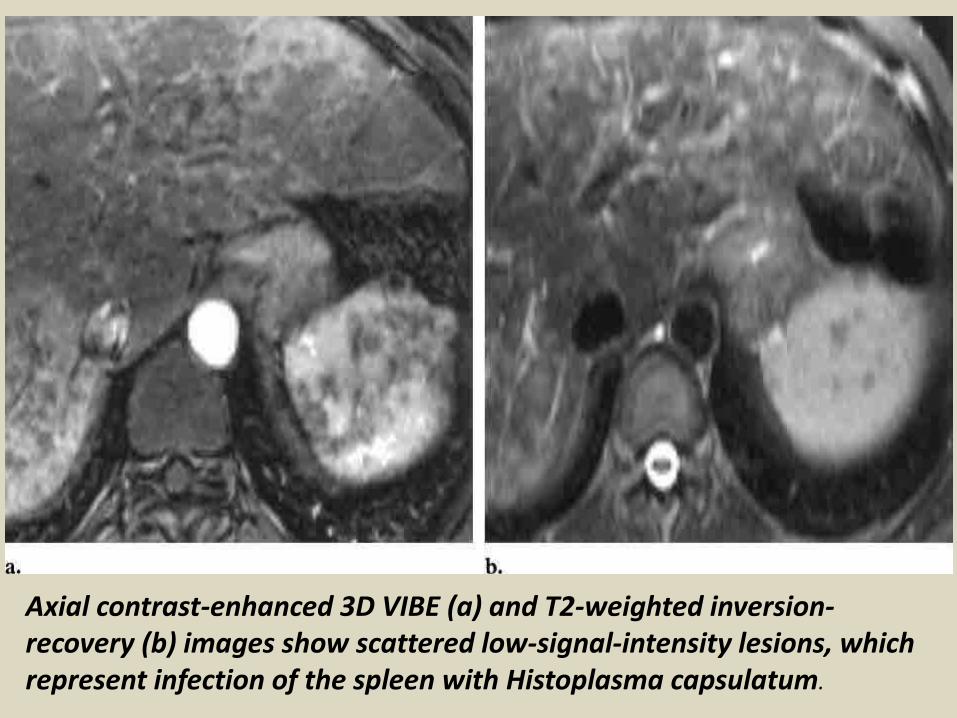
Axial contrast-enhanced 3D VIBE (a) and T2-weighted inversion-recovery (b) images show scattered low-signal-intensity lesions, which represent infection of the spleen with Histoplasma capsulatum.
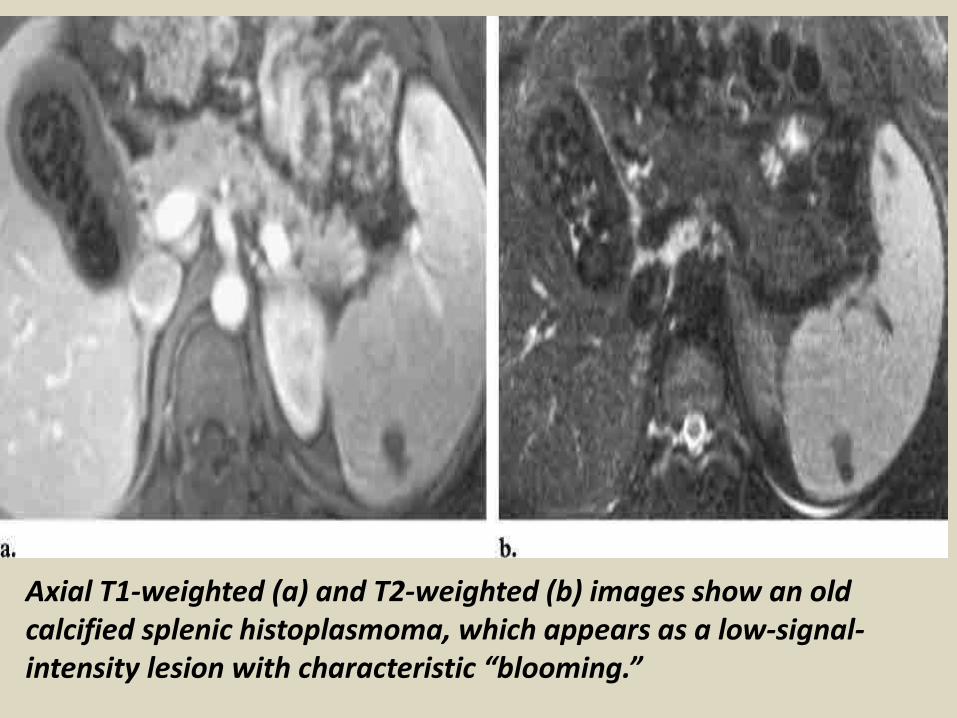
Axial T1-weighted (a) and T2-weighted (b) images show an old calcified splenic histoplasmoma, which appears as a low-signal-intensity lesion with characteristic “blooming.”
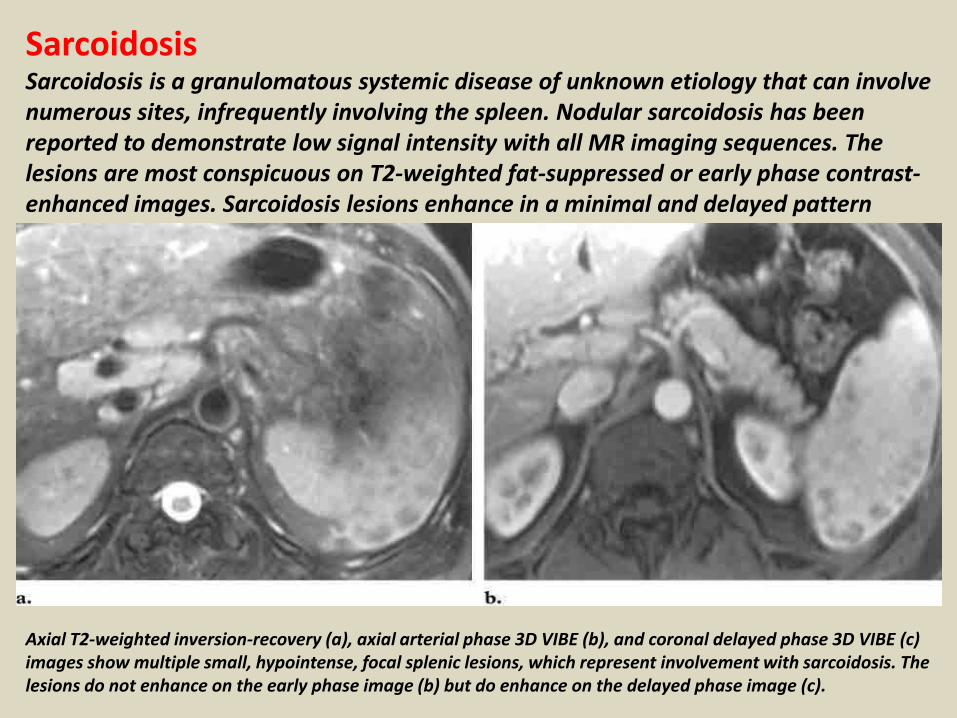
SarcoidosisSarcoidosis is a granulomatous systemic disease of unknown etiology that can involve numerous sites, infrequently involving the spleen. Nodular sarcoidosis has been reported to demonstrate low signal intensity with all MR imaging sequences. The lesions are most conspicuous on T2-weighted fat-suppressed or early phase contrast-enhanced images. Sarcoidosis lesions enhance in a minimal and delayed pattern
Axial T2-weighted inversion-recovery (a), axial arterial phase 3D VIBE (b), and coronal delayed phase 3D VIBE (c) images show multiple small, hypointense, focal splenic lesions, which represent involvement with sarcoidosis. The lesions do not enhance on the early phase image (b) but do enhance on the delayed phase image (c).
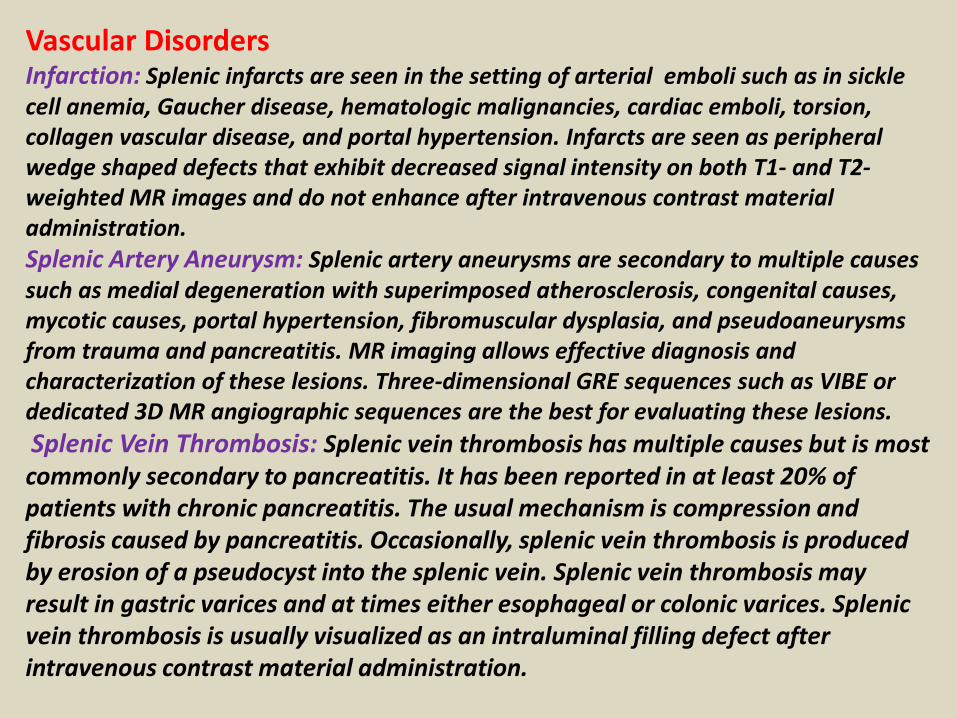
Vascular DisordersInfarction: Splenic infarcts are seen in the setting of arterial emboli such as in sickle cell anemia, Gaucher disease, hematologic malignancies, cardiac emboli, torsion, collagen vascular disease, and portal hypertension. Infarcts are seen as peripheral wedge shaped defects that exhibit decreased signal intensity on both T1- and T2-weighted MR images and do not enhance after intravenous contrast material administration.
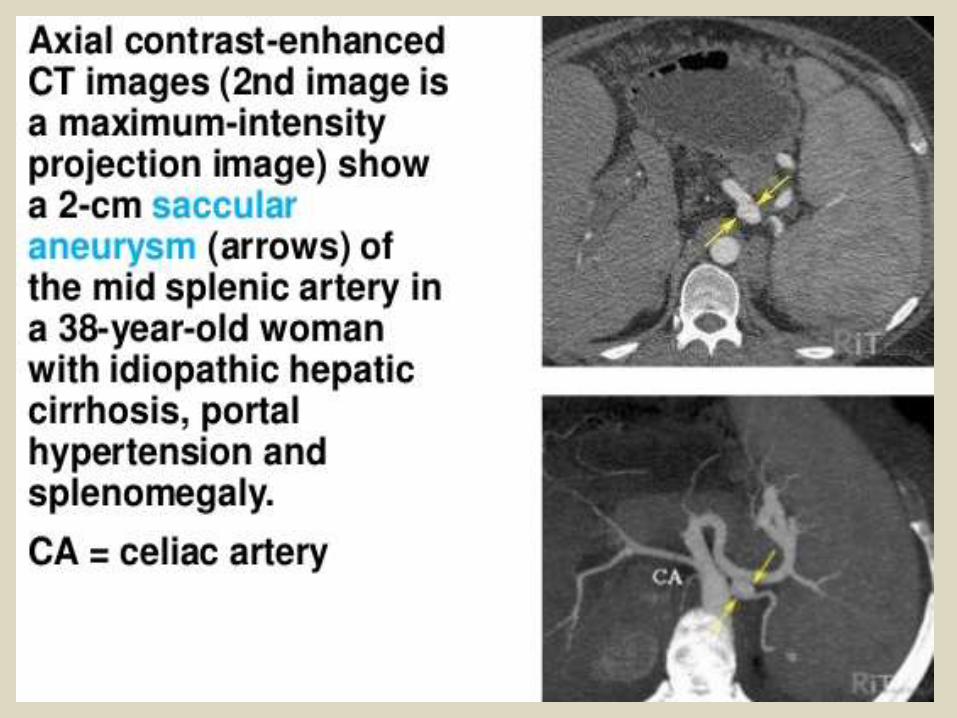
Splenic Artery Aneurysm: Splenic artery aneurysms are secondary to multiple causes such as medial degeneration with superimposed atherosclerosis, congenital causes, mycotic causes, portal hypertension, fibromuscular dysplasia, and pseudoaneurysms from trauma and pancreatitis. MR imaging allows effective diagnosis and characterization of these lesions. Three-dimensional GRE sequences such as VIBE or dedicated 3D MR angiographic sequences are the best for evaluating these lesions.
Splenic Vein Thrombosis: Splenic vein thrombosis has multiple causes but is most commonly secondary to pancreatitis. It has been reported in at least 20% of patients with chronic pancreatitis. The usual mechanism is compression and fibrosis caused by pancreatitis. Occasionally, splenic vein thrombosis is produced by erosion of a pseudocyst into the splenic vein. Splenic vein thrombosis may result in gastric varices and at times either esophageal or colonic varices. Splenic vein thrombosis is usually visualized as an intraluminal filling defect after intravenous contrast material administration.
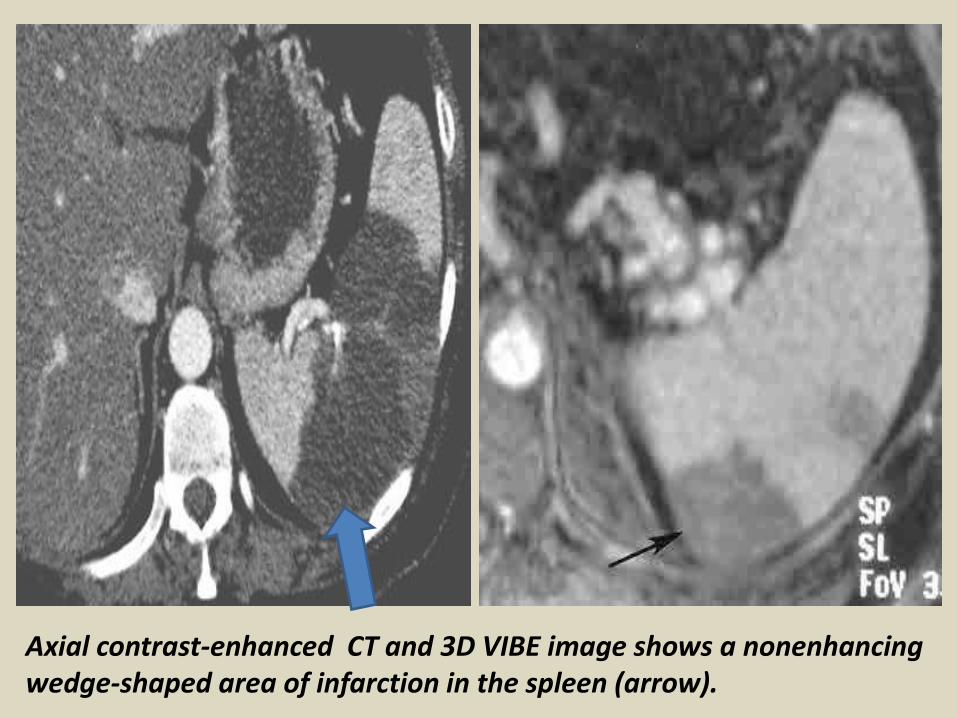
Axial contrast-enhanced CT and 3D VIBE image shows a nonenhancing wedge-shaped area of infarction in the spleen (arrow).
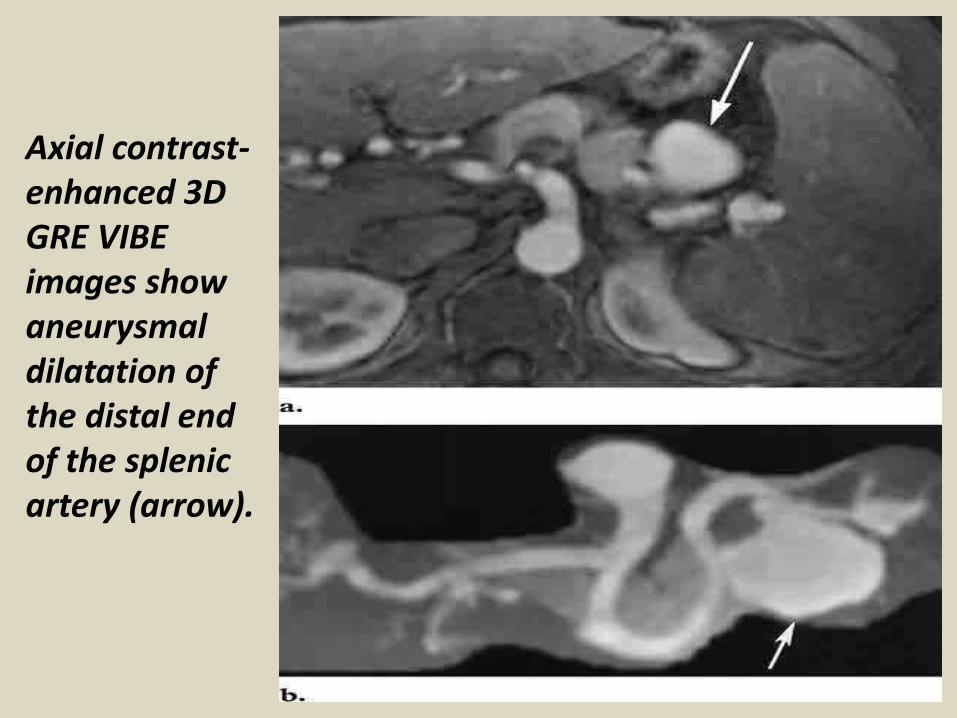
Axial contrast-enhanced 3D GRE VIBEimages show aneurysmal dilatation of the distal end of the splenic artery (arrow).
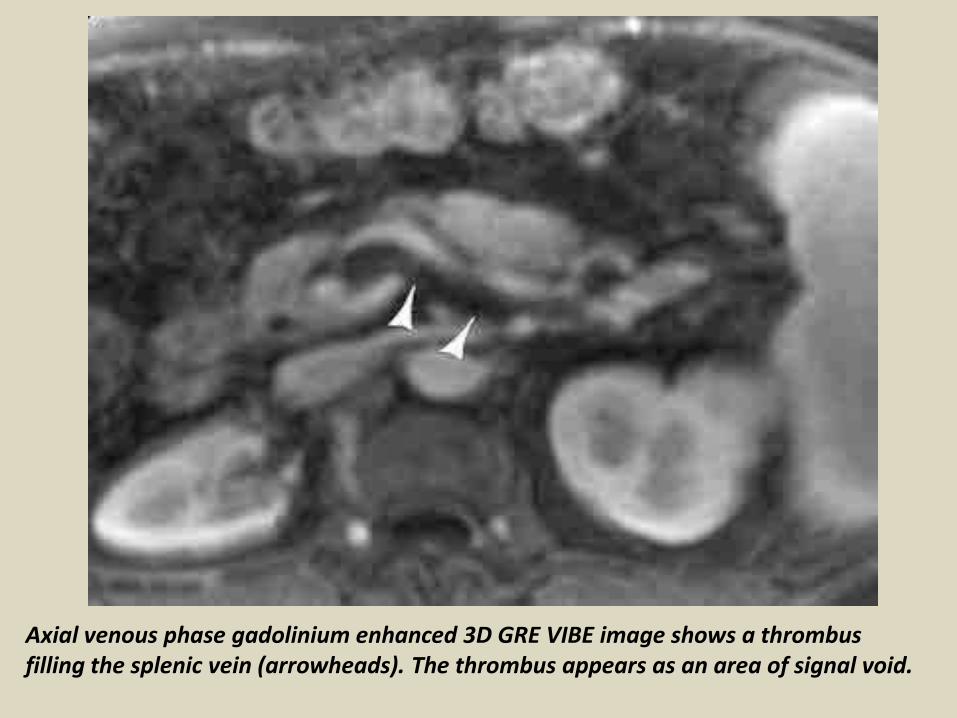
Axial venous phase gadolinium enhanced 3D GRE VIBE image shows a thrombusfilling the splenic vein (arrowheads). The thrombus appears as an area of signal void.
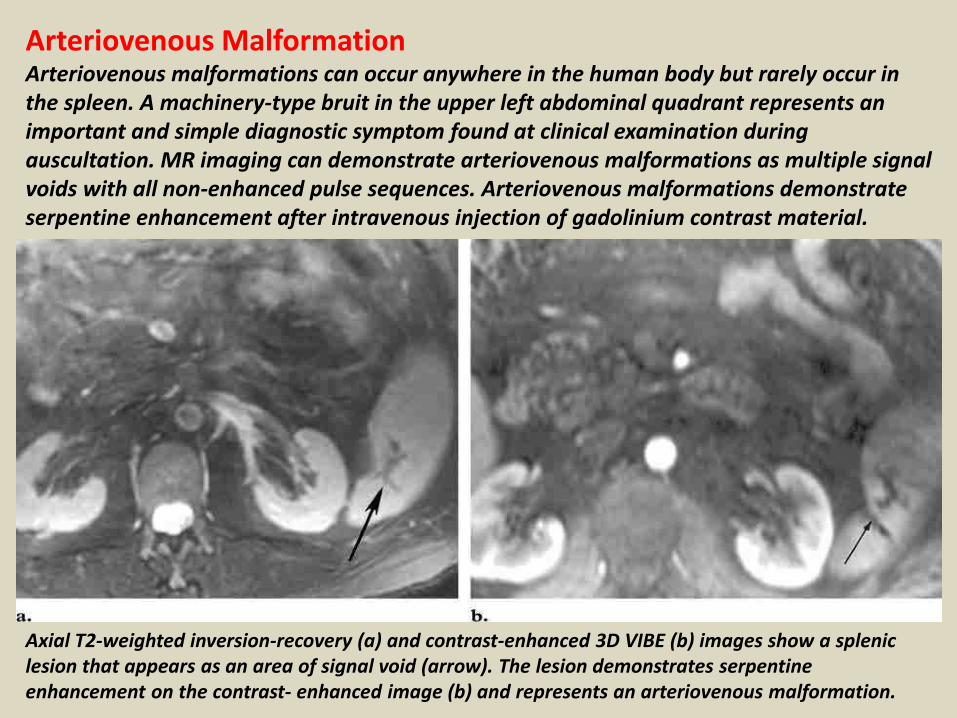
Arteriovenous MalformationArteriovenous malformations can occur anywhere in the human body but rarely occur in the spleen. A machinery-type bruit in the upper left abdominal quadrant represents an important and simple diagnostic symptom found at clinical examination during auscultation. MR imaging can demonstrate arteriovenous malformations as multiple signal voids with all non-enhanced pulse sequences. Arteriovenous malformations demonstrate serpentine enhancement after intravenous injection of gadolinium contrast material.
Axial T2-weighted inversion-recovery (a) and contrast-enhanced 3D VIBE (b) images show a splenic lesion that appears as an area of signal void (arrow). The lesion demonstrates serpentine enhancement on the contrast- enhanced image (b) and represents an arteriovenous malformation.
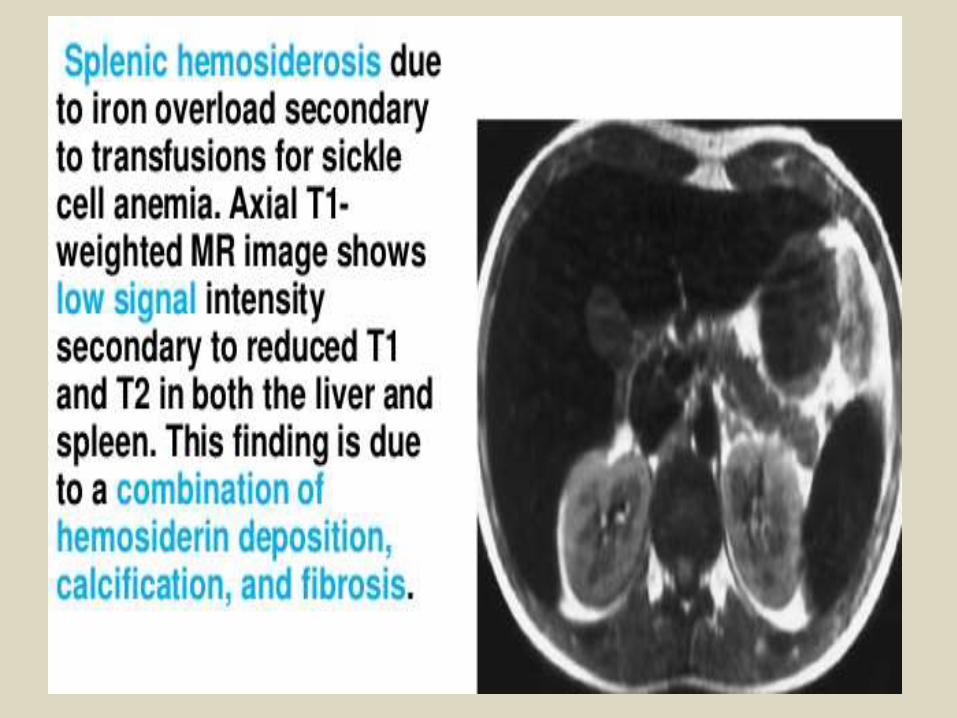
Hematologic DisordersSickle Cell DiseaseSickle cell disease is common in the black population with a prevalence of 0.2% (homozygous form) and 8%–10% (heterozygous form). The spleen is the organ most commonly involved by sickle cell disease. In patients with sickle cell disease, the spleen appears as a nearly signal void area due to iron deposition from blood transfusion. Autosplenectomy is often found in patients with homozygous sickle cell disease.
Extramedullary HematopoiesisExtramedullary hematopoiesis is a compensatory response to deficient bone marrow cells. It predominantly affects the spleen and liver. Although it usually shows diffuse infiltration microscopically, there may be focal mass like involvement of the liver and spleen. The signal intensity of the mass depends on the evolution of the hematopoiesis.Active lesions show intermediate signal intensity on T1-weighted images, high signal intensity on T2-weighted images, and some enhancement after intravenous contrast medium injection. Older lesions may show low signal intensity on T1- and T2-weighted images and may not show any enhancement. These lesions usually exhibit reduced signal intensity on in-phase T1-weighted GRE images compared with that on opposed phase images owing to the presence of iron (the opposite of fat on chemical shift images).
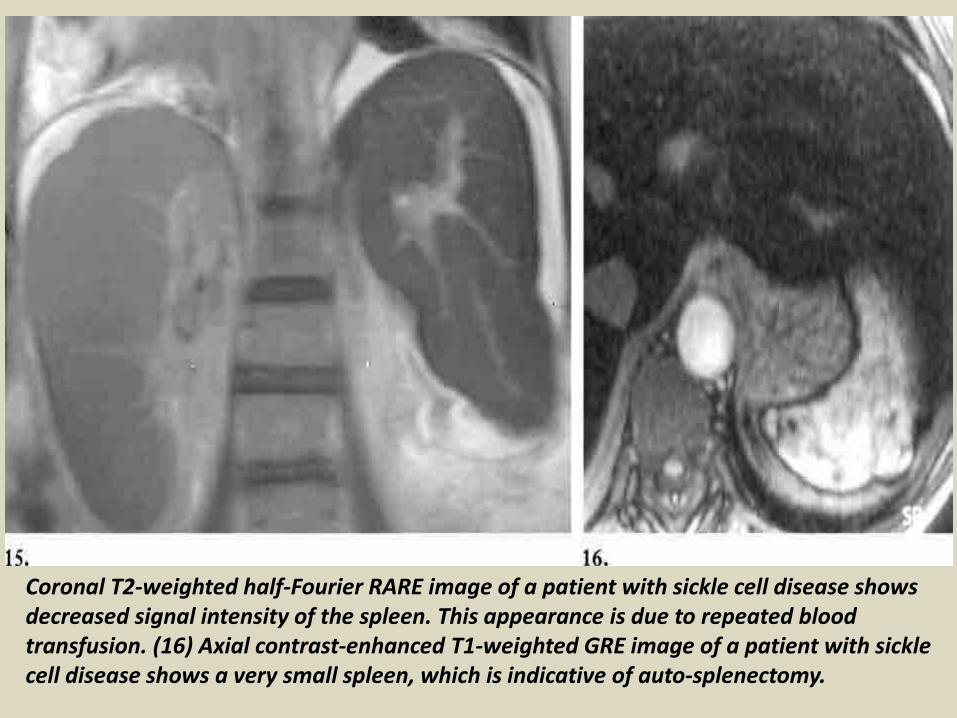
Coronal T2-weighted half-Fourier RARE image of a patient with sickle cell disease shows decreased signal intensity of the spleen. This appearance is due to repeated blood transfusion. (16) Axial contrast-enhanced T1-weighted GRE image of a patient with sickle cell disease shows a very small spleen, which is indicative of auto-splenectomy.
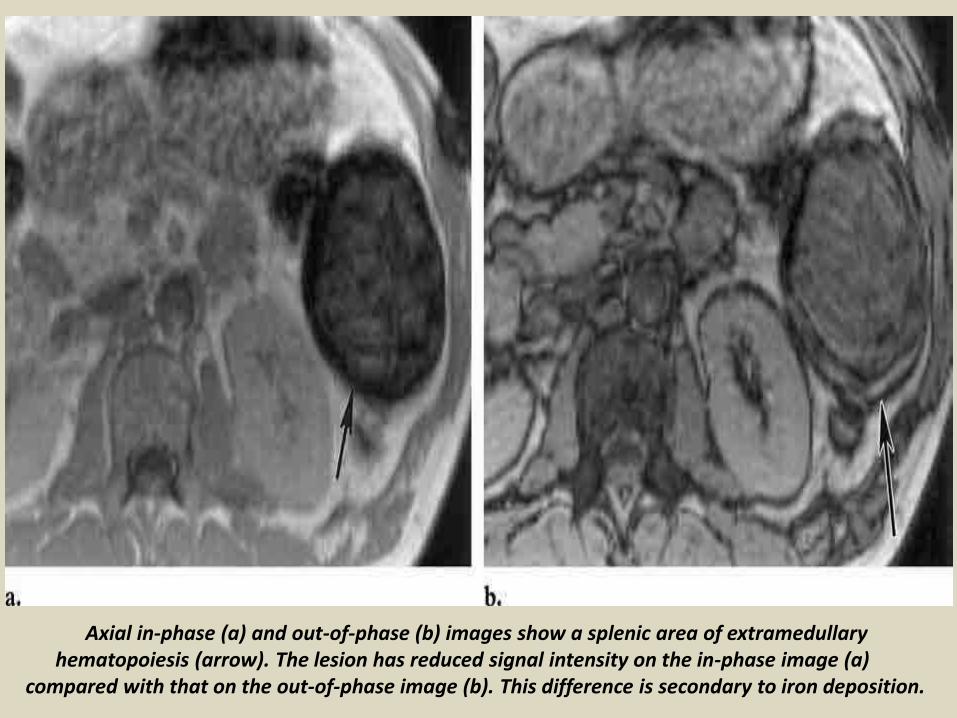
Axial in-phase (a) and out-of-phase (b) images show a splenic area of extramedullary hematopoiesis (arrow). The lesion has reduced signal intensity on the in-phase image (a)
compared with that on the out-of-phase image (b). This difference is secondary to iron deposition.
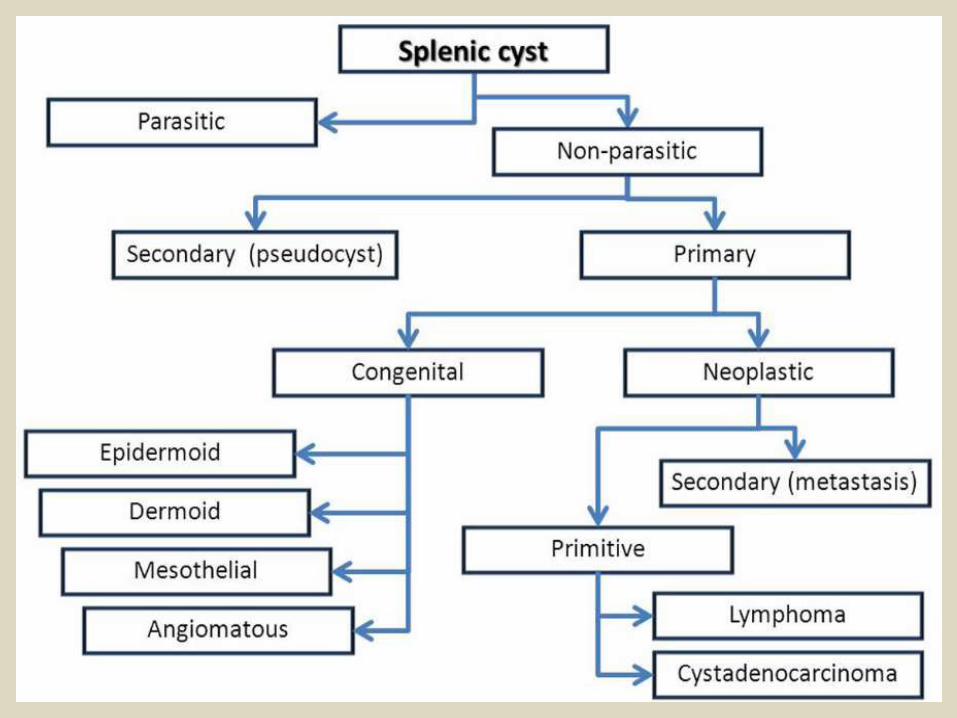
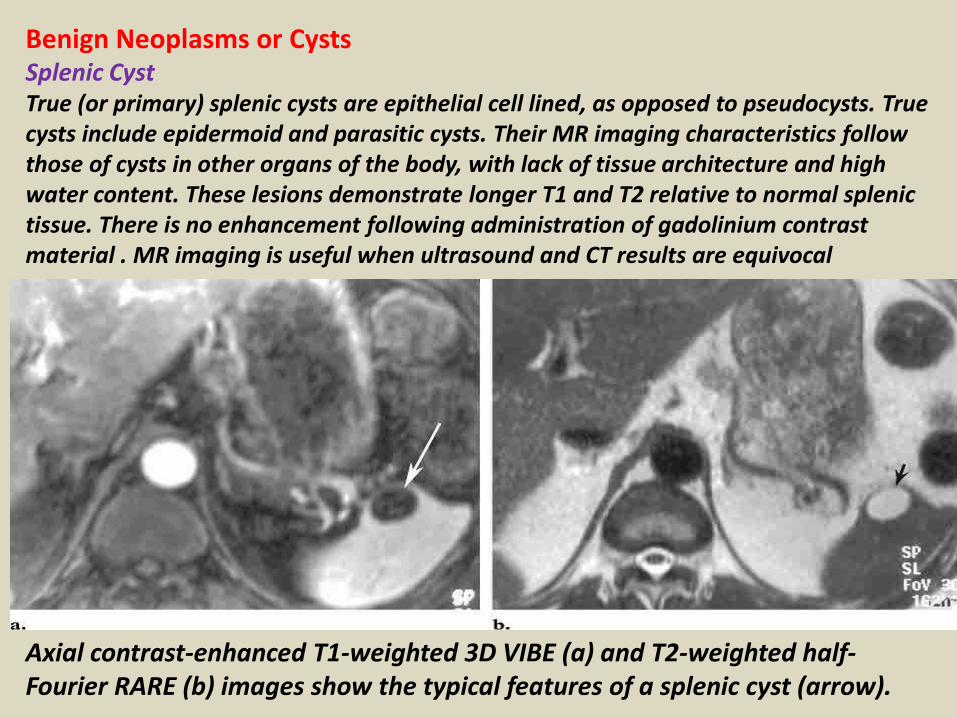
Benign Neoplasms or CystsSplenic CystTrue (or primary) splenic cysts are epithelial cell lined, as opposed to pseudocysts. True cysts include epidermoid and parasitic cysts. Their MR imaging characteristics follow those of cysts in other organs of the body, with lack of tissue architecture and high water content. These lesions demonstrate longer T1 and T2 relative to normal splenic tissue. There is no enhancement following administration of gadolinium contrast material . MR imaging is useful when ultrasound and CT results are equivocal
Axial contrast-enhanced T1-weighted 3D VIBE (a) and T2-weighted half-Fourier RARE (b) images show the typical features of a splenic cyst (arrow).
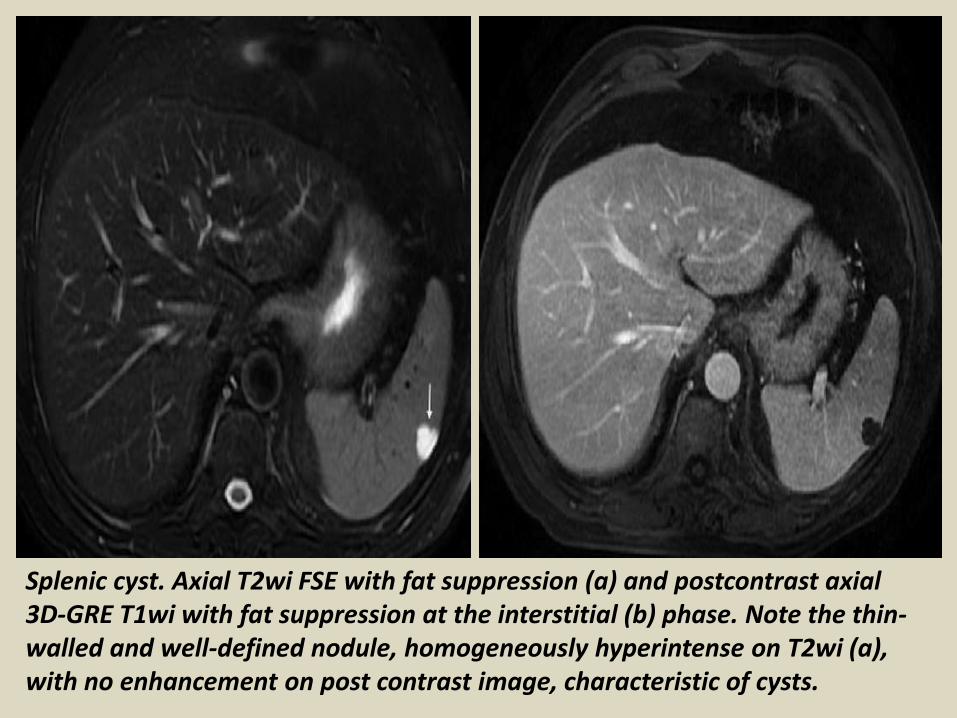
Splenic cyst. Axial T2wi FSE with fat suppression (a) and postcontrast axial 3D-GRE T1wi with fat suppression at the interstitial (b) phase. Note the thin-walled and well-defined nodule, homogeneously hyperintense on T2wi (a), with no enhancement on post contrast image, characteristic of cysts.
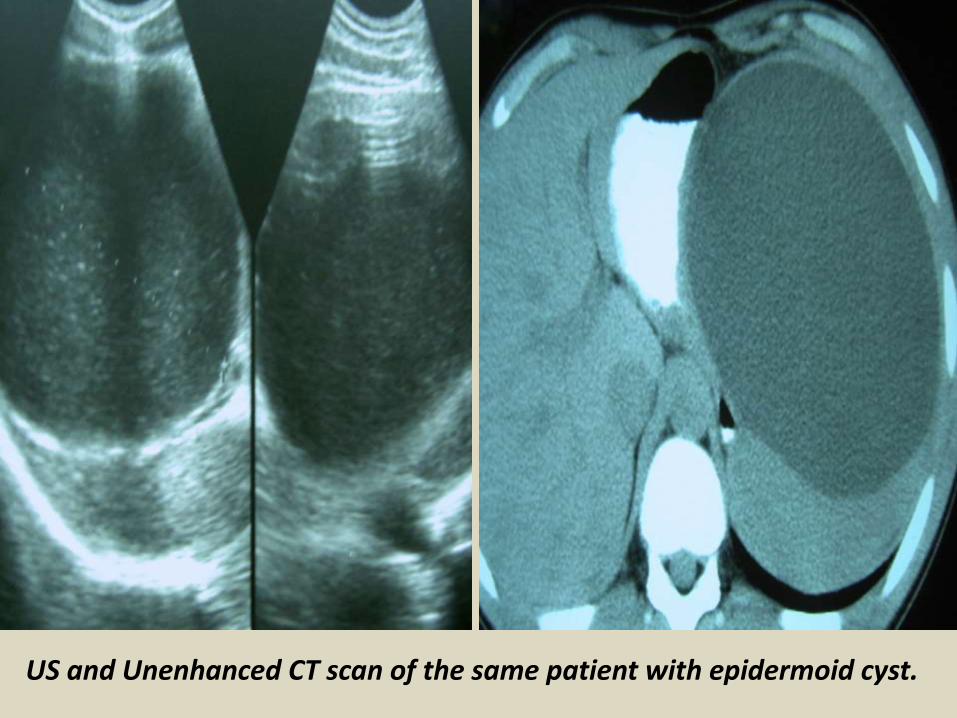
US and Unenhanced CT scan of the same patient with epidermoid cyst.
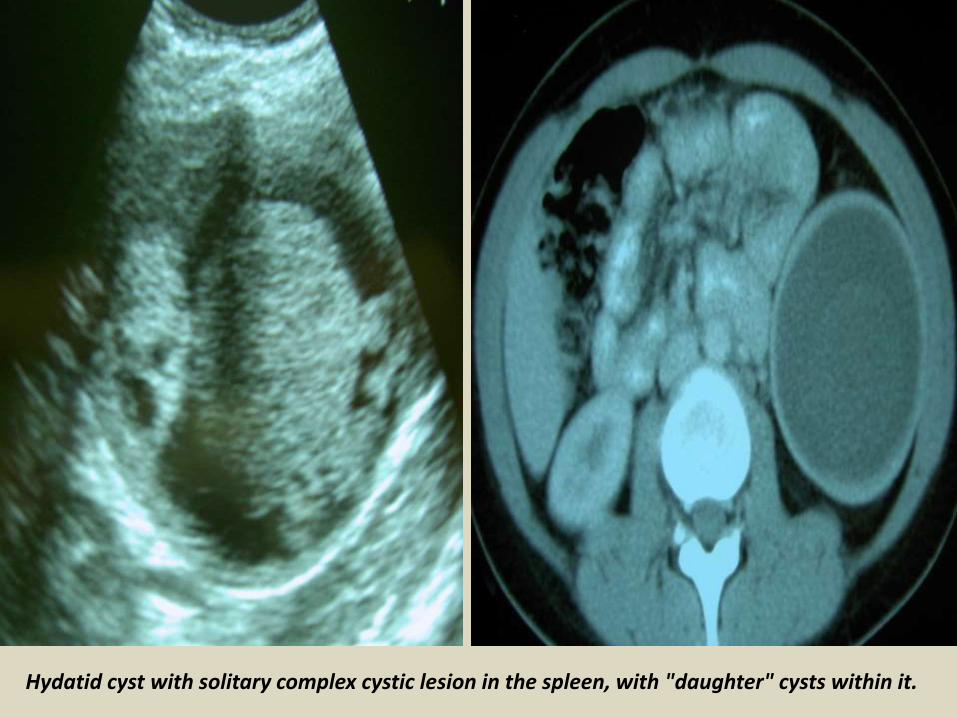
Hydatid cyst with solitary complex cystic lesion in the spleen, with "daughter" cysts within it.
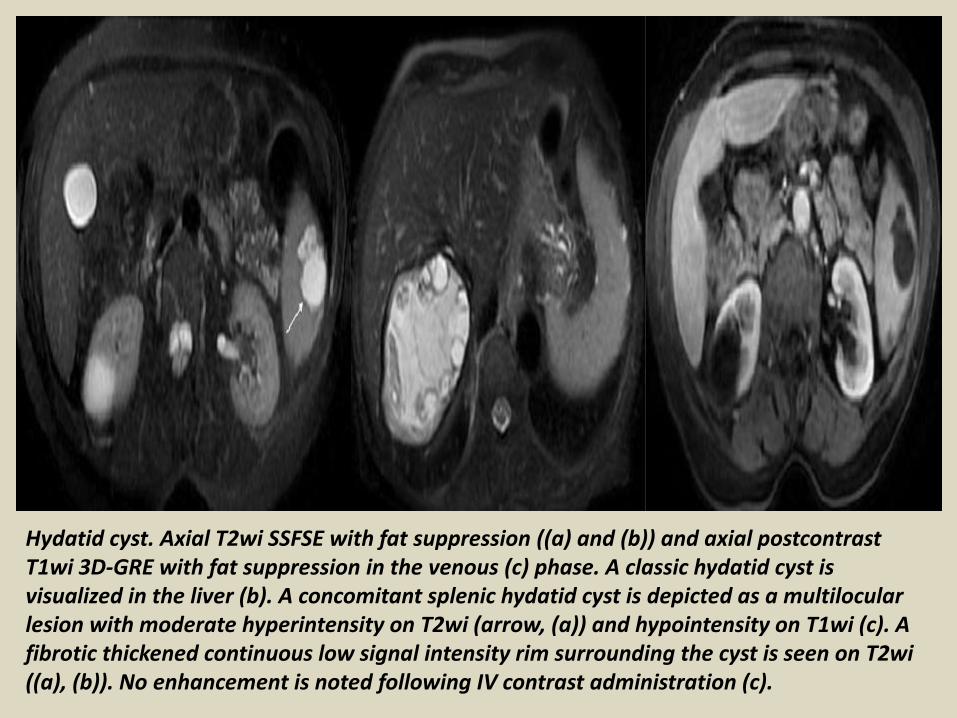
Hydatid cyst. Axial T2wi SSFSE with fat suppression ((a) and (b)) and axial postcontrast T1wi 3D-GRE with fat suppression in the venous (c) phase. A classic hydatid cyst is visualized in the liver (b). A concomitant splenic hydatid cyst is depicted as a multilocular lesion with moderate hyperintensity on T2wi (arrow, (a)) and hypointensity on T1wi (c). A fibrotic thickened continuous low signal intensity rim surrounding the cyst is seen on T2wi ((a), (b)). No enhancement is noted following IV contrast administration (c).
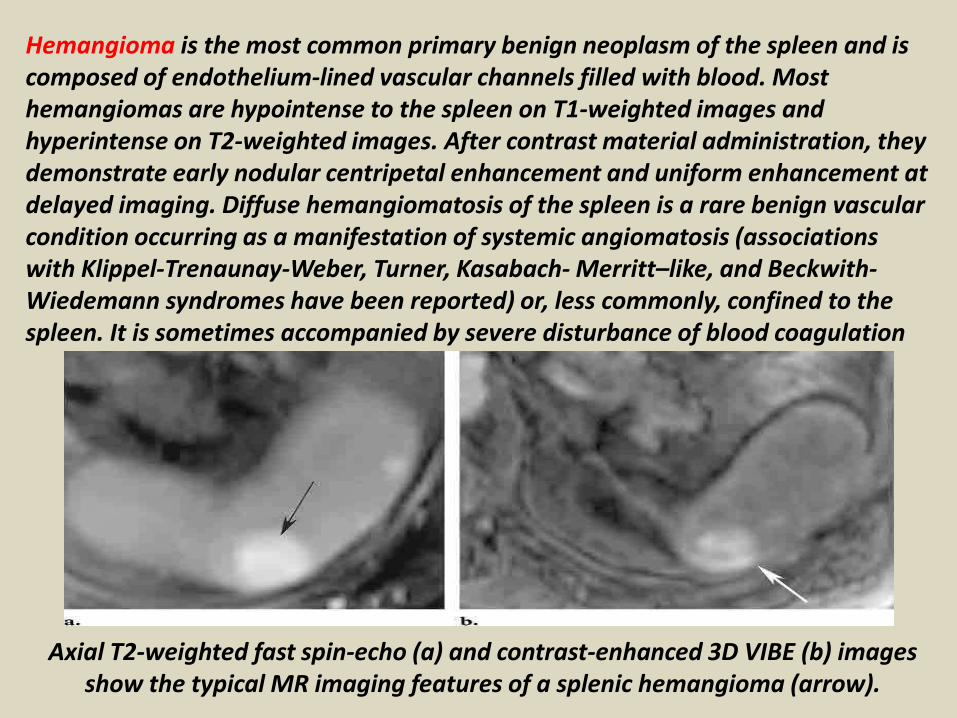
Hemangioma is the most common primary benign neoplasm of the spleen and is composed of endothelium-lined vascular channels filled with blood. Most hemangiomas are hypointense to the spleen on T1-weighted images and hyperintense on T2-weighted images. After contrast material administration, they demonstrate early nodular centripetal enhancement and uniform enhancement at delayed imaging. Diffuse hemangiomatosis of the spleen is a rare benign vascular condition occurring as a manifestation of systemic angiomatosis (associations with Klippel-Trenaunay-Weber, Turner, Kasabach- Merritt–like, and Beckwith-Wiedemann syndromes have been reported) or, less commonly, confined to the spleen. It is sometimes accompanied by severe disturbance of blood coagulation
Axial T2-weighted fast spin-echo (a) and contrast-enhanced 3D VIBE (b) imagesshow the typical MR imaging features of a splenic hemangioma (arrow).
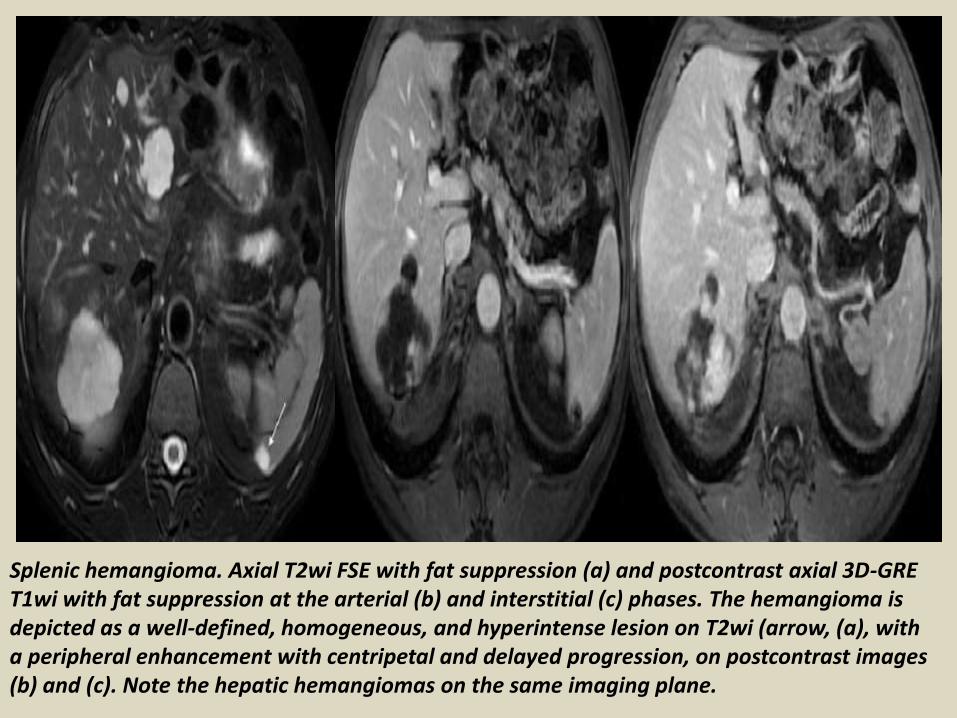
Splenic hemangioma. Axial T2wi FSE with fat suppression (a) and postcontrast axial 3D-GRE T1wi with fat suppression at the arterial (b) and interstitial (c) phases. The hemangioma is depicted as a well-defined, homogeneous, and hyperintense lesion on T2wi (arrow, (a), with a peripheral enhancement with centripetal and delayed progression, on postcontrast images (b) and (c). Note the hepatic hemangiomas on the same imaging plane.
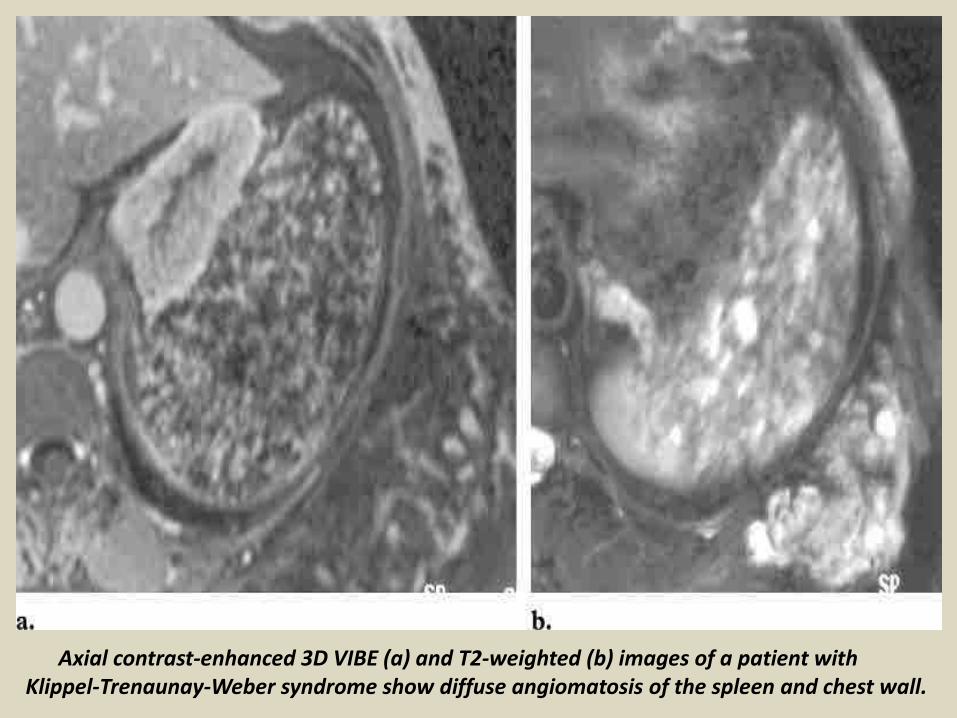
Axial contrast-enhanced 3D VIBE (a) and T2-weighted (b) images of a patient withKlippel-Trenaunay-Weber syndrome show diffuse angiomatosis of the spleen and chest wall.
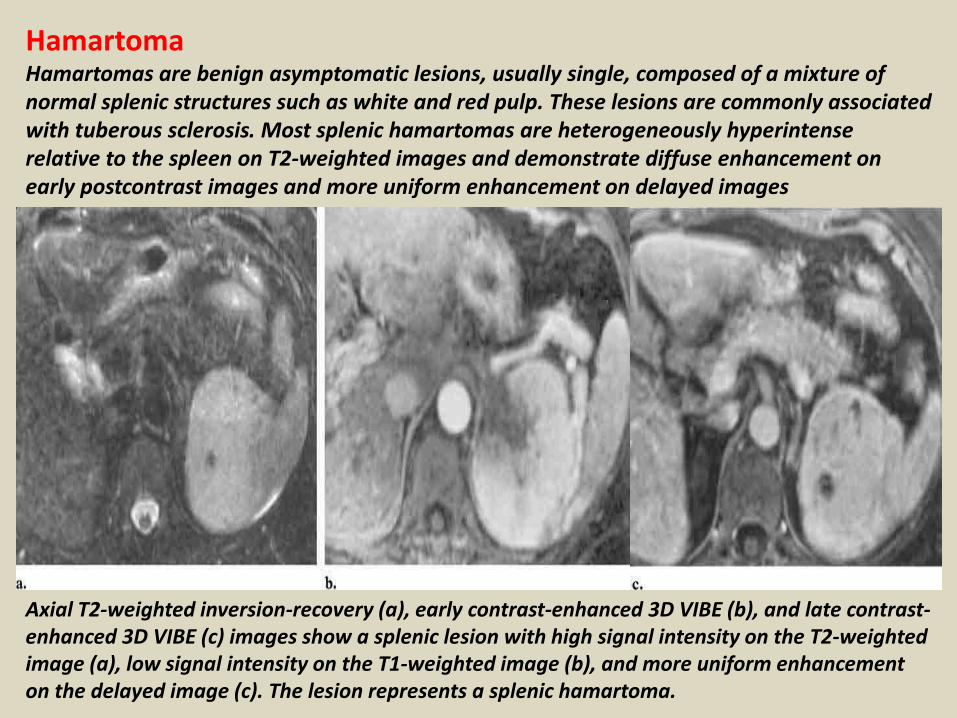
HamartomaHamartomas are benign asymptomatic lesions, usually single, composed of a mixture of normal splenic structures such as white and red pulp. These lesions are commonly associated with tuberous sclerosis. Most splenic hamartomas are heterogeneously hyperintense relative to the spleen on T2-weighted images and demonstrate diffuse enhancement on early postcontrast images and more uniform enhancement on delayed images
Axial T2-weighted inversion-recovery (a), early contrast-enhanced 3D VIBE (b), and late contrast-enhanced 3D VIBE (c) images show a splenic lesion with high signal intensity on the T2-weighted image (a), low signal intensity on the T1-weighted image (b), and more uniform enhancement on the delayed image (c). The lesion represents a splenic hamartoma.
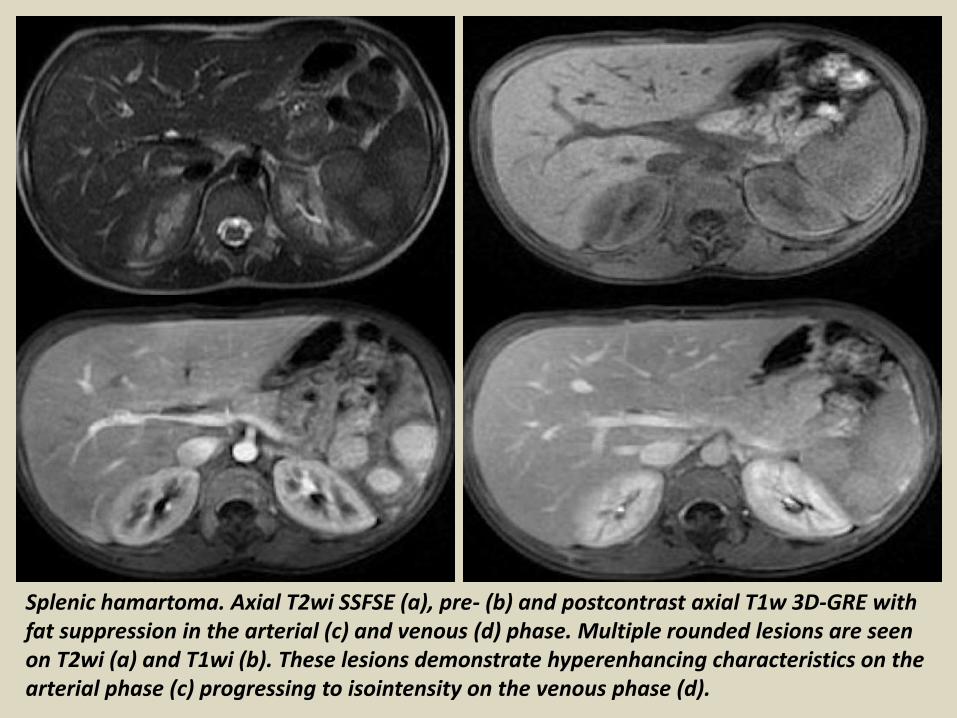
Splenic hamartoma. Axial T2wi SSFSE (a), pre- (b) and postcontrast axial T1w 3D-GRE with fat suppression in the arterial (c) and venous (d) phase. Multiple rounded lesions are seen on T2wi (a) and T1wi (b). These lesions demonstrate hyperenhancing characteristics on the arterial phase (c) progressing to isointensity on the venous phase (d).
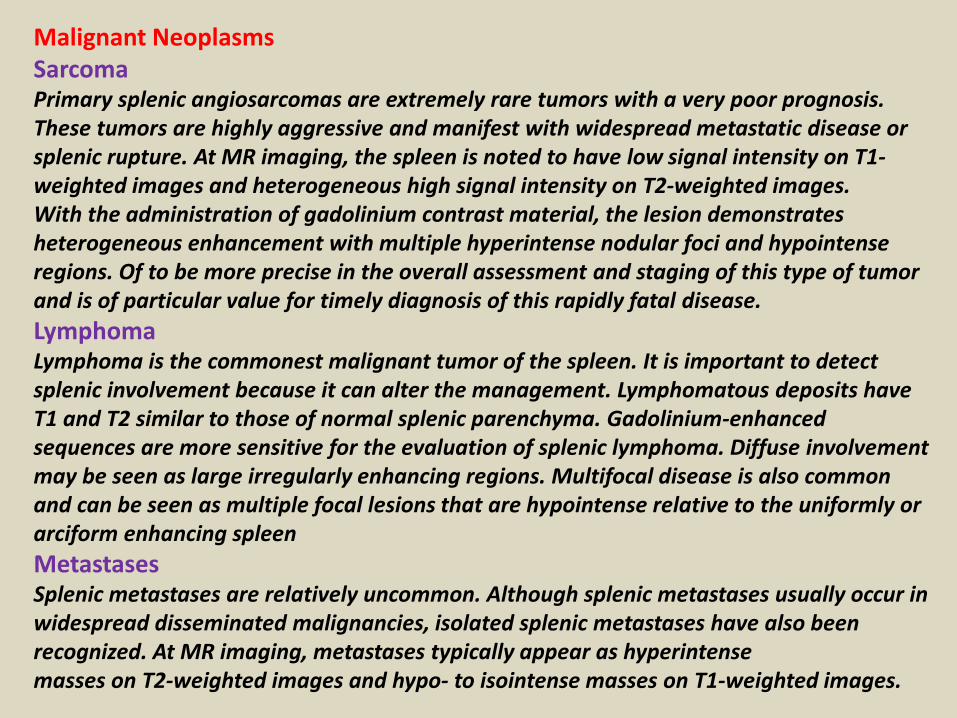
Malignant NeoplasmsSarcomaPrimary splenic angiosarcomas are extremely rare tumors with a very poor prognosis. These tumors are highly aggressive and manifest with widespread metastatic disease or splenic rupture. At MR imaging, the spleen is noted to have low signal intensity on T1-weighted images and heterogeneous high signal intensity on T2-weighted images.With the administration of gadolinium contrast material, the lesion demonstrates heterogeneous enhancement with multiple hyperintense nodular foci and hypointense regions. Of to be more precise in the overall assessment and staging of this type of tumor and is of particular value for timely diagnosis of this rapidly fatal disease.
LymphomaLymphoma is the commonest malignant tumor of the spleen. It is important to detect splenic involvement because it can alter the management. Lymphomatous deposits have T1 and T2 similar to those of normal splenic parenchyma. Gadolinium-enhanced sequences are more sensitive for the evaluation of splenic lymphoma. Diffuse involvement may be seen as large irregularly enhancing regions. Multifocal disease is also common and can be seen as multiple focal lesions that are hypointense relative to the uniformly or arciform enhancing spleen
MetastasesSplenic metastases are relatively uncommon. Although splenic metastases usually occur in widespread disseminated malignancies, isolated splenic metastases have also been recognized. At MR imaging, metastases typically appear as hyperintensemasses on T2-weighted images and hypo- to isointense masses on T1-weighted images.
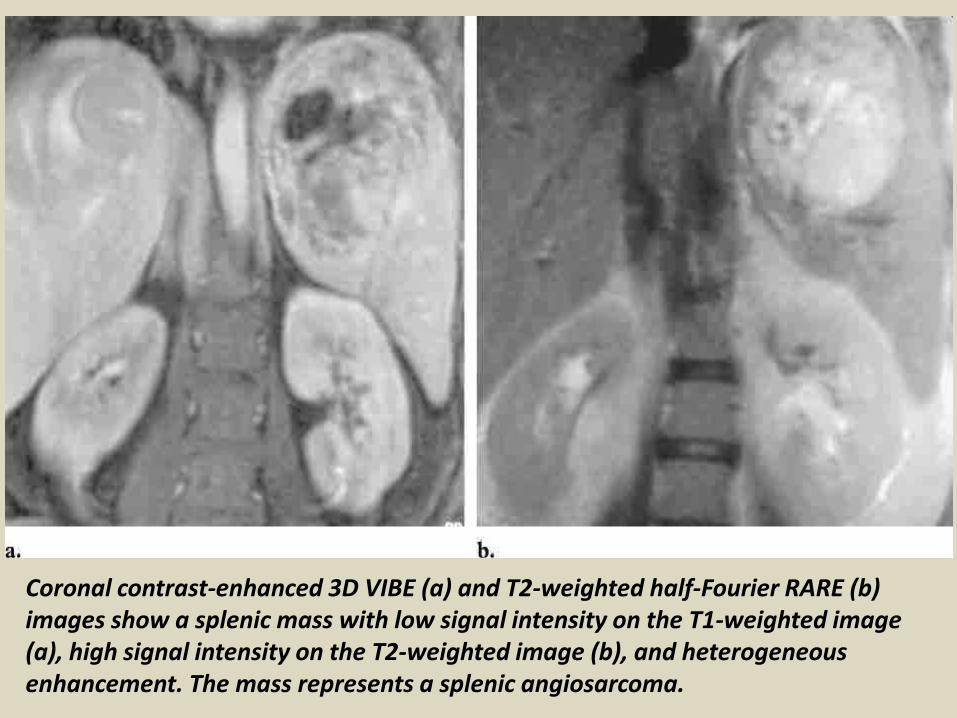
Coronal contrast-enhanced 3D VIBE (a) and T2-weighted half-Fourier RARE (b) images show a splenic mass with low signal intensity on the T1-weighted image (a), high signal intensity on the T2-weighted image (b), and heterogeneous enhancement. The mass represents a splenic angiosarcoma.
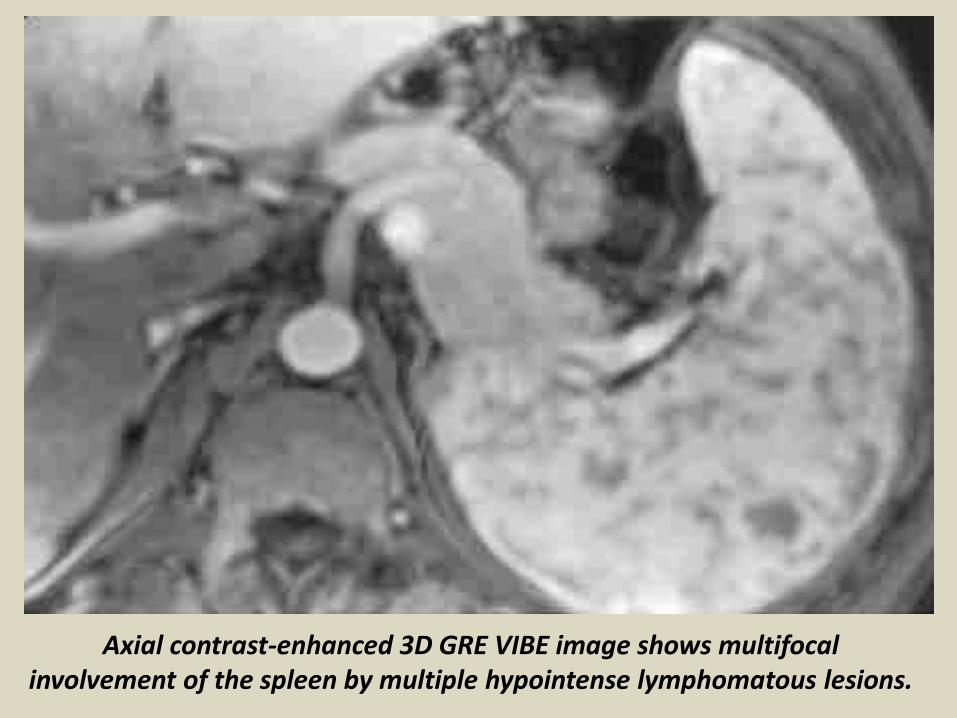
Axial contrast-enhanced 3D GRE VIBE image shows multifocal involvement of the spleen by multiple hypointense lymphomatous lesions.
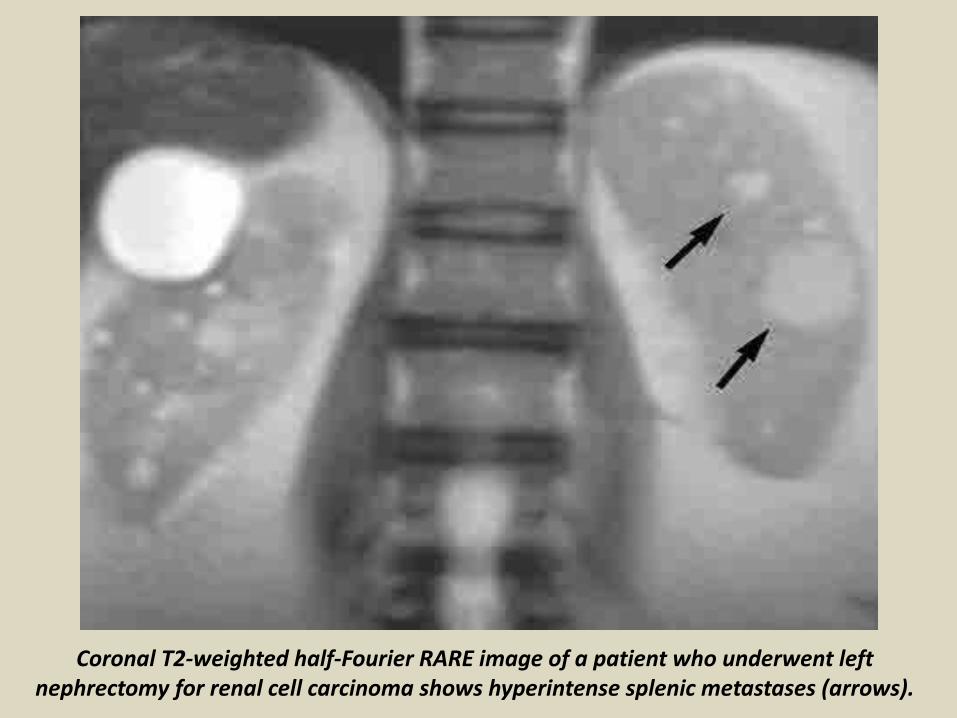
Coronal T2-weighted half-Fourier RARE image of a patient who underwent left nephrectomy for renal cell carcinoma shows hyperintense splenic metastases (arrows).
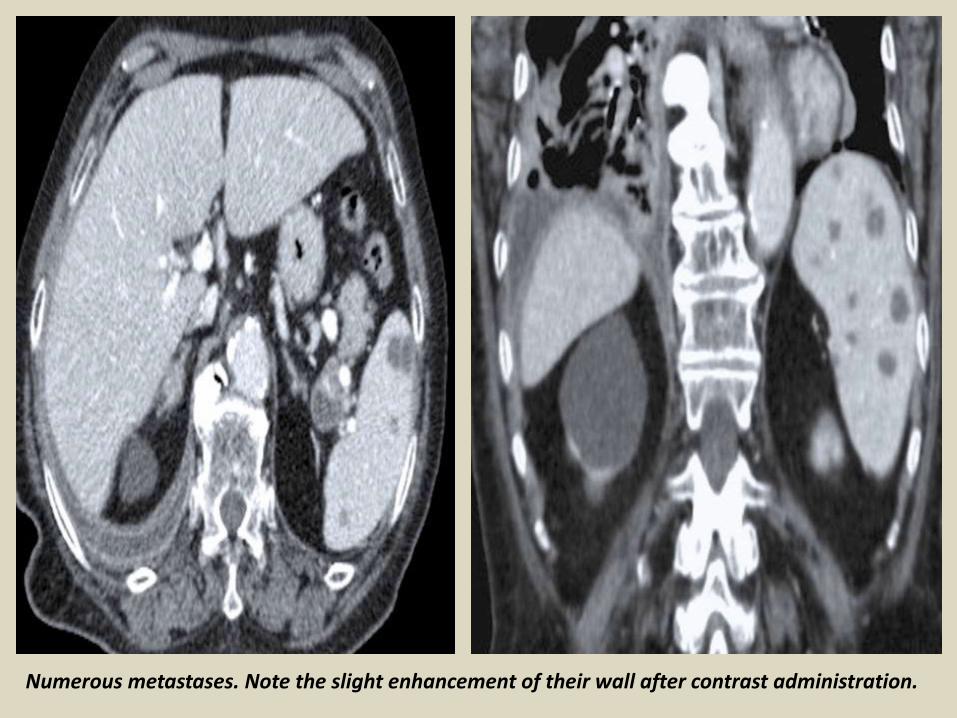
Numerous metastases. Note the slight enhancement of their wall after contrast administration.
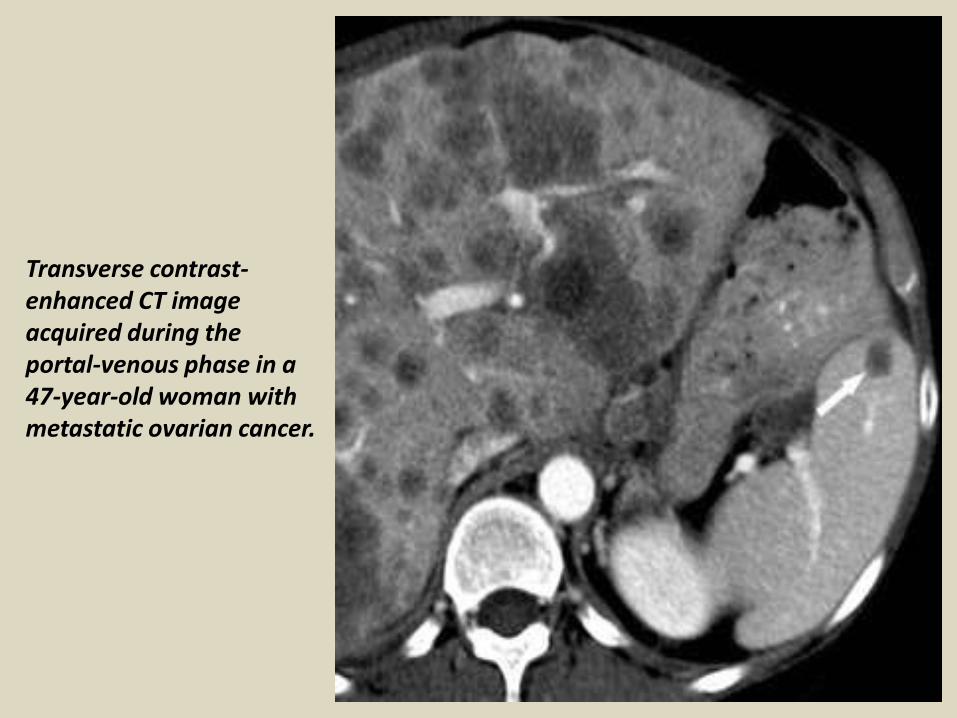
Transverse contrast-enhanced CT image acquired during the portal-venous phase in a 47-year-old woman with metastatic ovarian cancer.
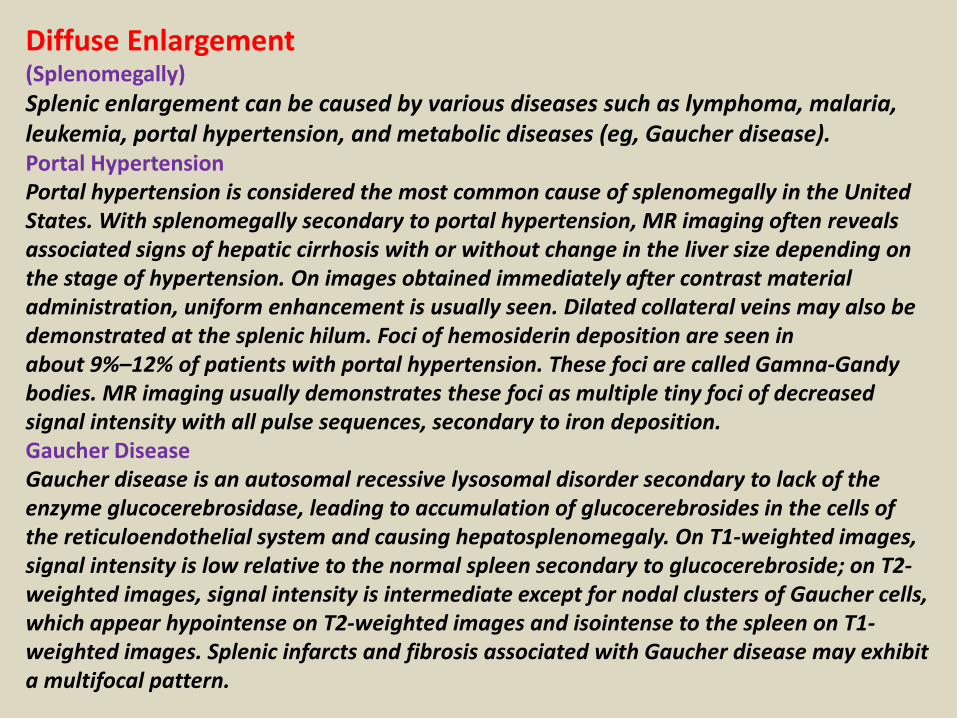
Diffuse Enlargement(Splenomegally)
Splenic enlargement can be caused by various diseases such as lymphoma, malaria, leukemia, portal hypertension, and metabolic diseases (eg, Gaucher disease).Portal HypertensionPortal hypertension is considered the most common cause of splenomegally in the United States. With splenomegally secondary to portal hypertension, MR imaging often reveals associated signs of hepatic cirrhosis with or without change in the liver size depending on the stage of hypertension. On images obtained immediately after contrast materialadministration, uniform enhancement is usually seen. Dilated collateral veins may also be demonstrated at the splenic hilum. Foci of hemosiderin deposition are seen inabout 9%–12% of patients with portal hypertension. These foci are called Gamna-Gandy bodies. MR imaging usually demonstrates these foci as multiple tiny foci of decreased signal intensity with all pulse sequences, secondary to iron deposition.Gaucher DiseaseGaucher disease is an autosomal recessive lysosomal disorder secondary to lack of the enzyme glucocerebrosidase, leading to accumulation of glucocerebrosides in the cells of the reticuloendothelial system and causing hepatosplenomegaly. On T1-weighted images, signal intensity is low relative to the normal spleen secondary to glucocerebroside; on T2-weighted images, signal intensity is intermediate except for nodal clusters of Gaucher cells, which appear hypointense on T2-weighted images and isointense to the spleen on T1-weighted images. Splenic infarcts and fibrosis associated with Gaucher disease may exhibita multifocal pattern.
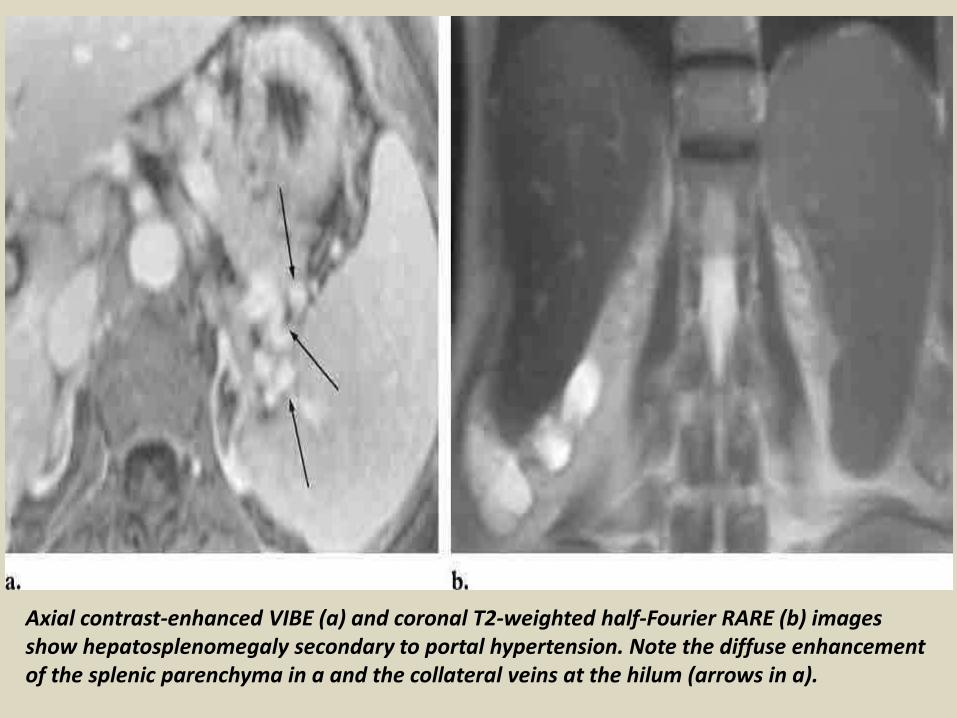
Axial contrast-enhanced VIBE (a) and coronal T2-weighted half-Fourier RARE (b) images show hepatosplenomegaly secondary to portal hypertension. Note the diffuse enhancement of the splenic parenchyma in a and the collateral veins at the hilum (arrows in a).
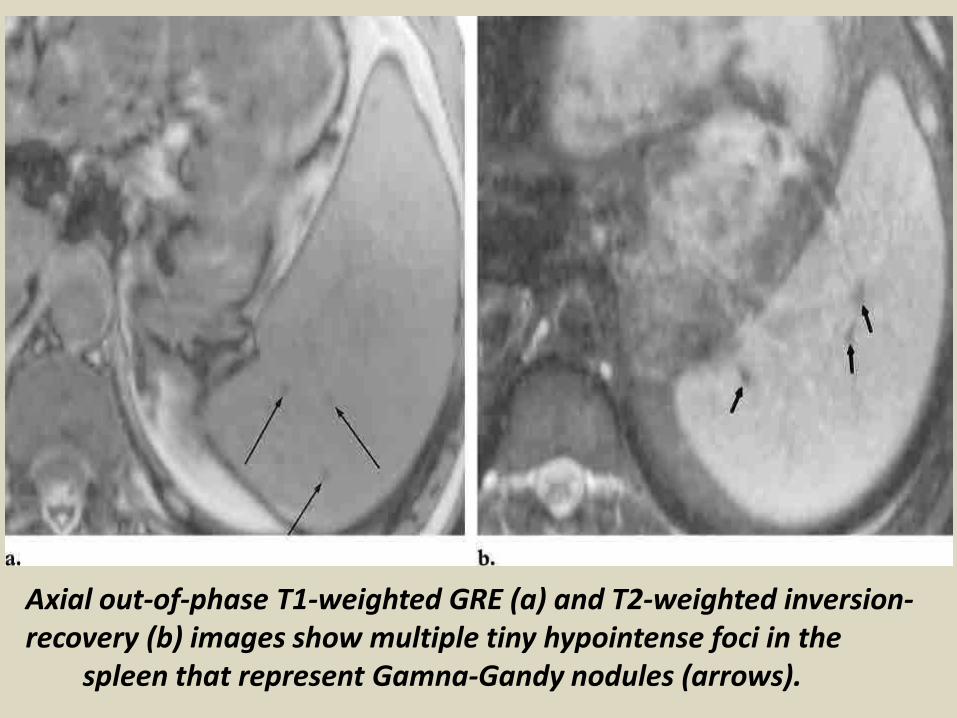
Axial out-of-phase T1-weighted GRE (a) and T2-weighted inversion-recovery (b) images show multiple tiny hypointense foci in the
spleen that represent Gamna-Gandy nodules (arrows).
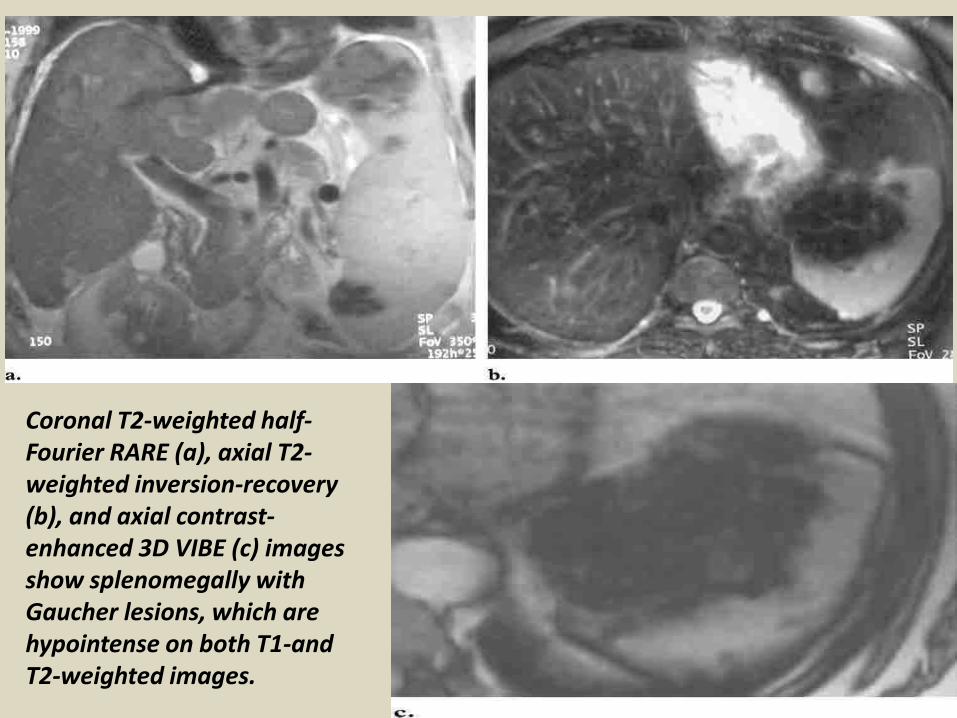
Coronal T2-weighted half-Fourier RARE (a), axial T2-weighted inversion-recovery (b), and axial contrast-enhanced 3D VIBE (c) images show splenomegally with Gaucher lesions, which are hypointense on both T1-and T2-weighted images.
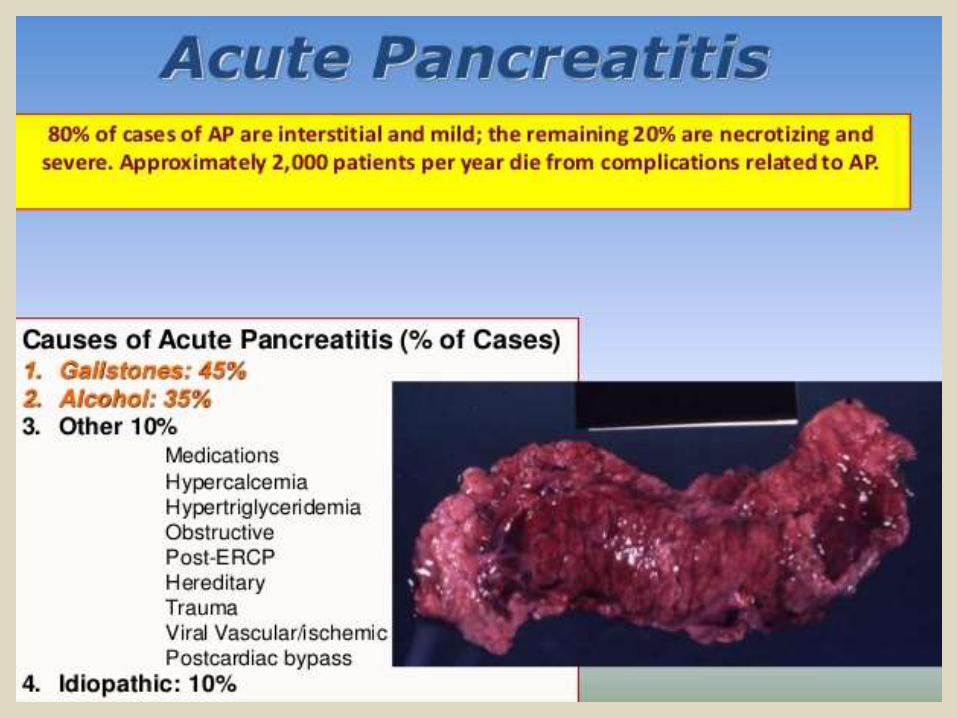
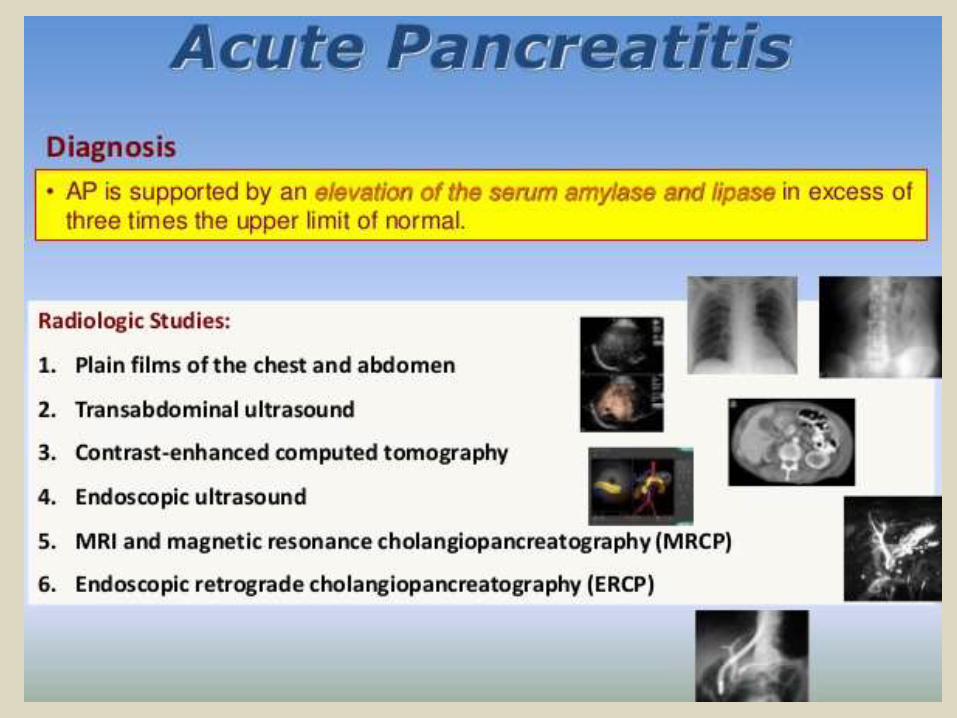
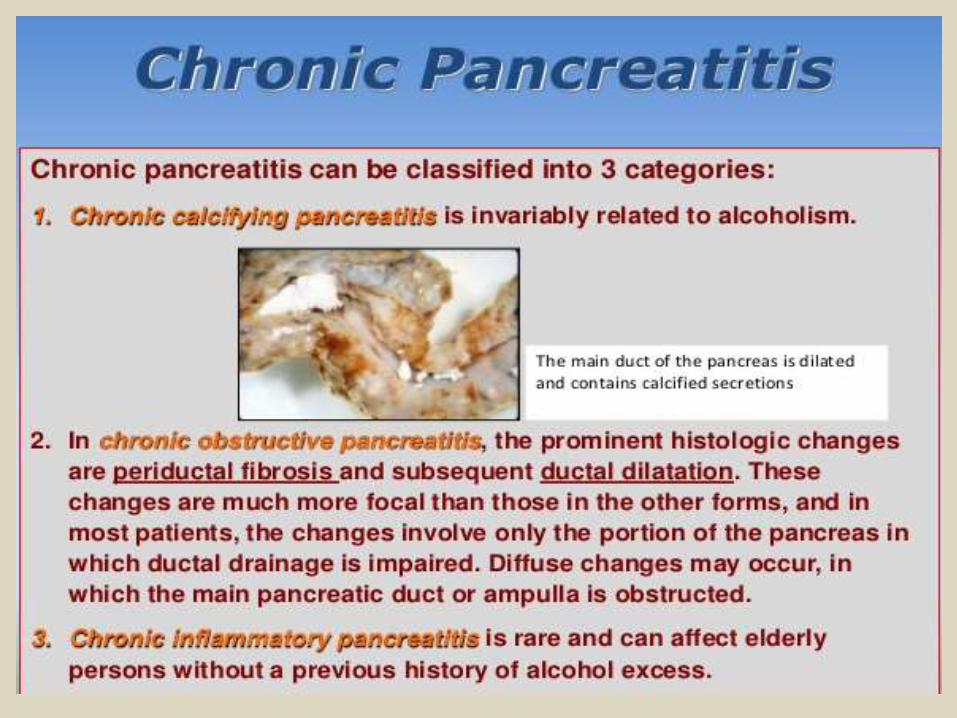
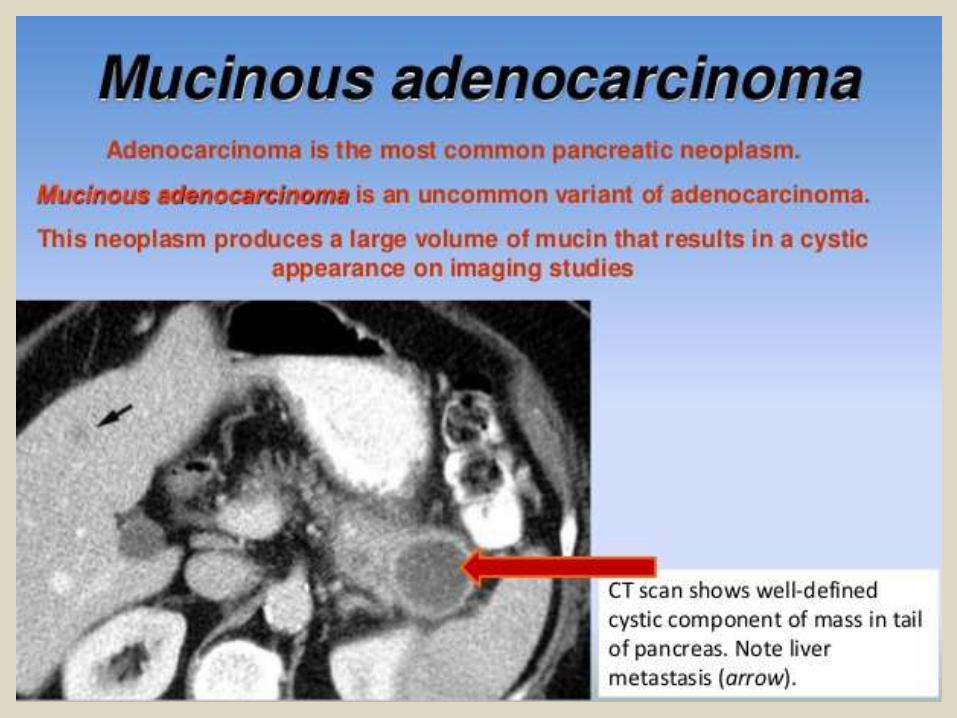
Pancreatic diseases.
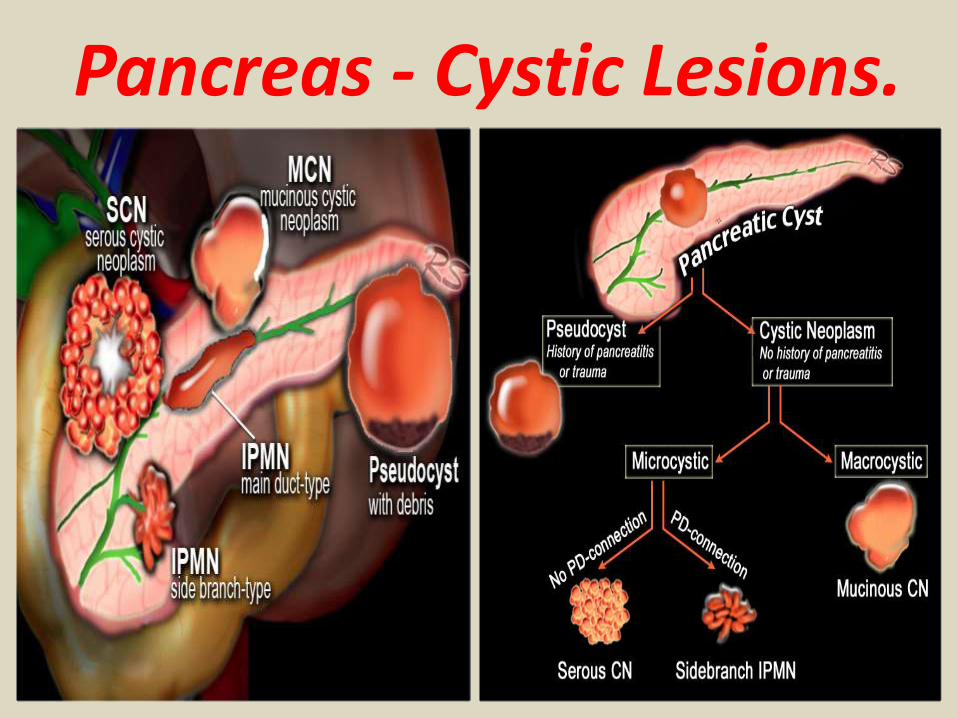
Pancreas - Cystic Lesions.
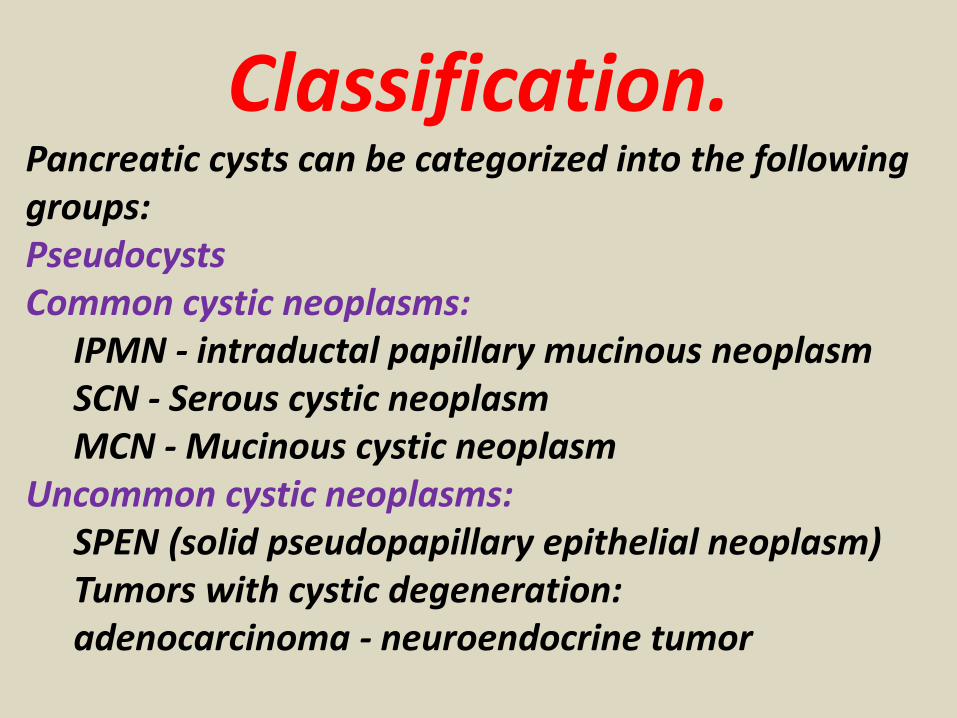
Classification.Pancreatic cysts can be categorized into the following groups: Pseudocysts Common cystic neoplasms:
IPMN - intraductal papillary mucinous neoplasm SCN - Serous cystic neoplasm MCN - Mucinous cystic neoplasm
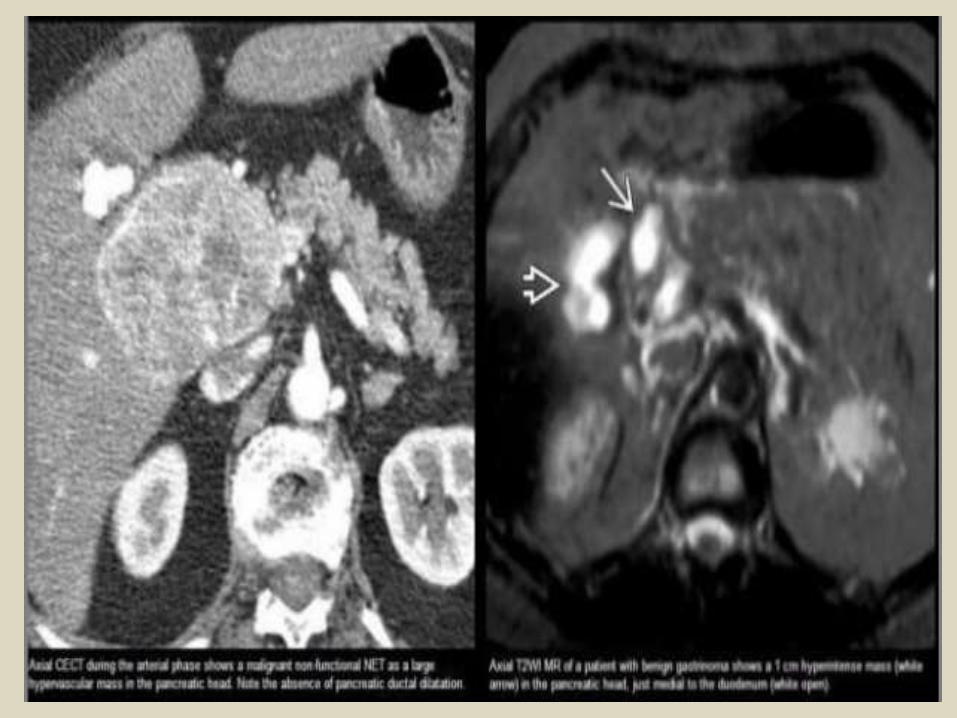
Uncommon cystic neoplasms:SPEN (solid pseudopapillary epithelial neoplasm) Tumors with cystic degeneration: adenocarcinoma - neuroendocrine tumor
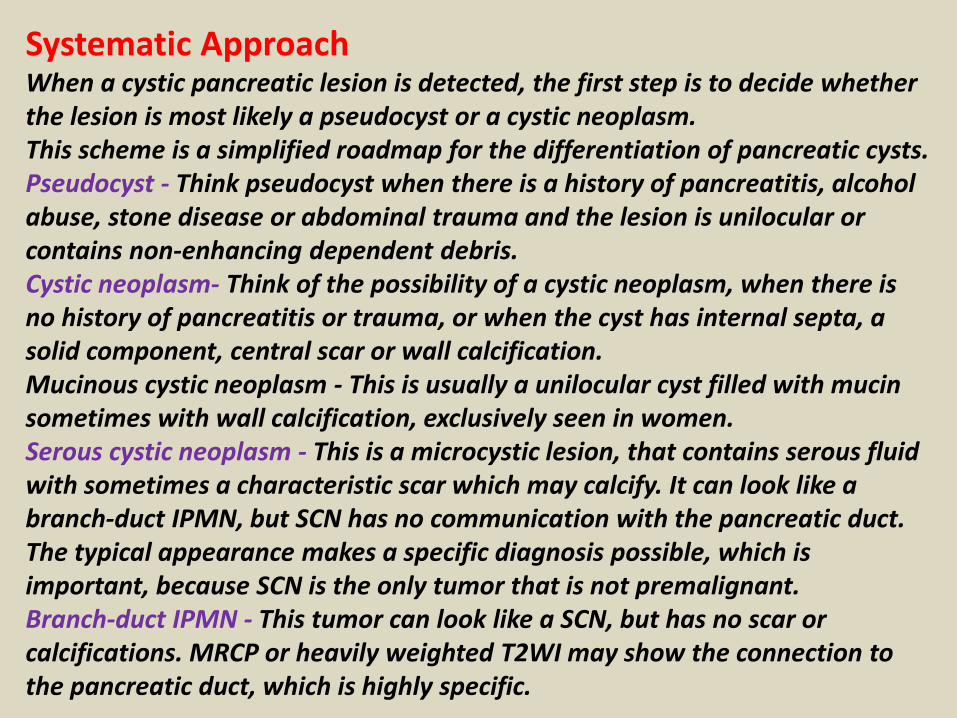
Systematic ApproachWhen a cystic pancreatic lesion is detected, the first step is to decide whether the lesion is most likely a pseudocyst or a cystic neoplasm.This scheme is a simplified roadmap for the differentiation of pancreatic cysts.Pseudocyst - Think pseudocyst when there is a history of pancreatitis, alcohol abuse, stone disease or abdominal trauma and the lesion is unilocular or contains non-enhancing dependent debris. Cystic neoplasm- Think of the possibility of a cystic neoplasm, when there is no history of pancreatitis or trauma, or when the cyst has internal septa, a solid component, central scar or wall calcification. Mucinous cystic neoplasm - This is usually a unilocular cyst filled with mucin sometimes with wall calcification, exclusively seen in women.Serous cystic neoplasm - This is a microcystic lesion, that contains serous fluid with sometimes a characteristic scar which may calcify. It can look like a branch-duct IPMN, but SCN has no communication with the pancreatic duct. The typical appearance makes a specific diagnosis possible, which is important, because SCN is the only tumor that is not premalignant. Branch-duct IPMN - This tumor can look like a SCN, but has no scar or calcifications. MRCP or heavily weighted T2WI may show the connection to the pancreatic duct, which is highly specific.
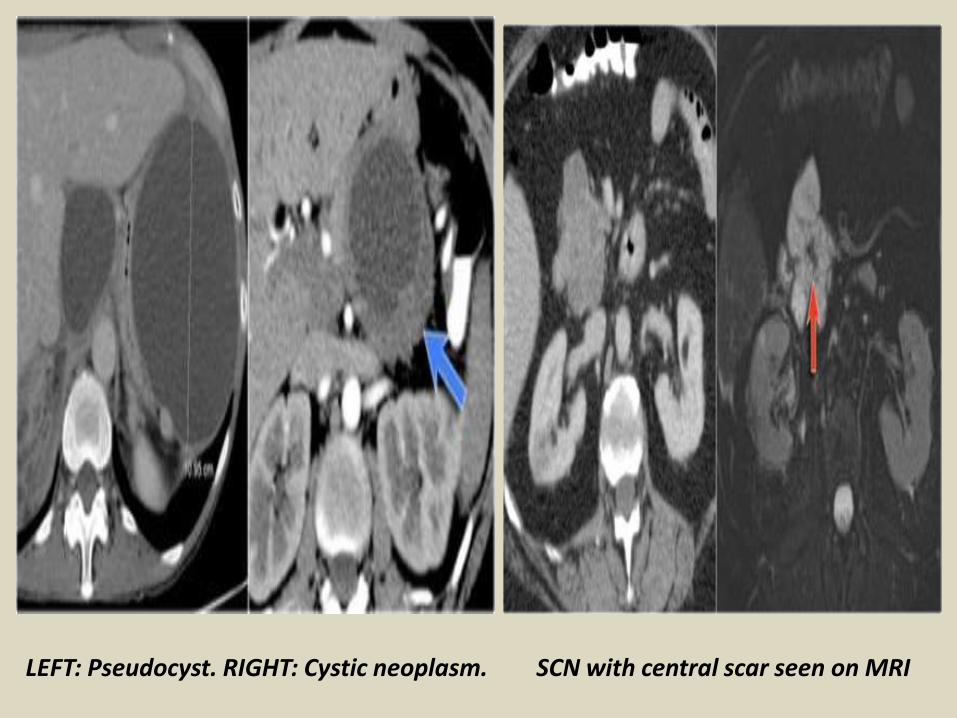
LEFT: Pseudocyst. RIGHT: Cystic neoplasm. SCN with central scar seen on MRI
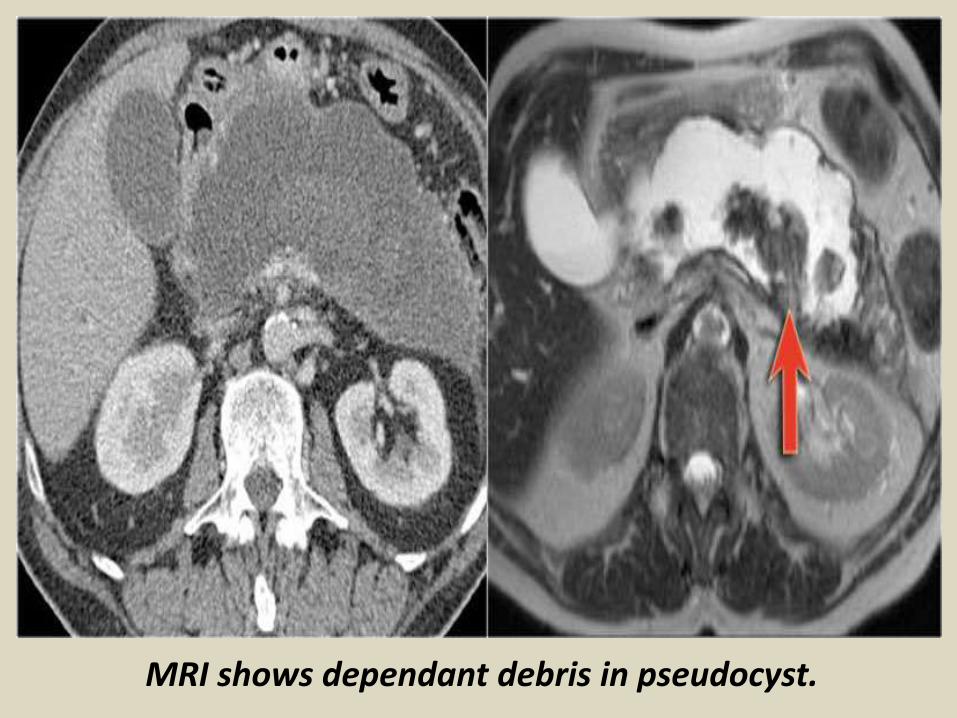
MRI shows dependant debris in pseudocyst.
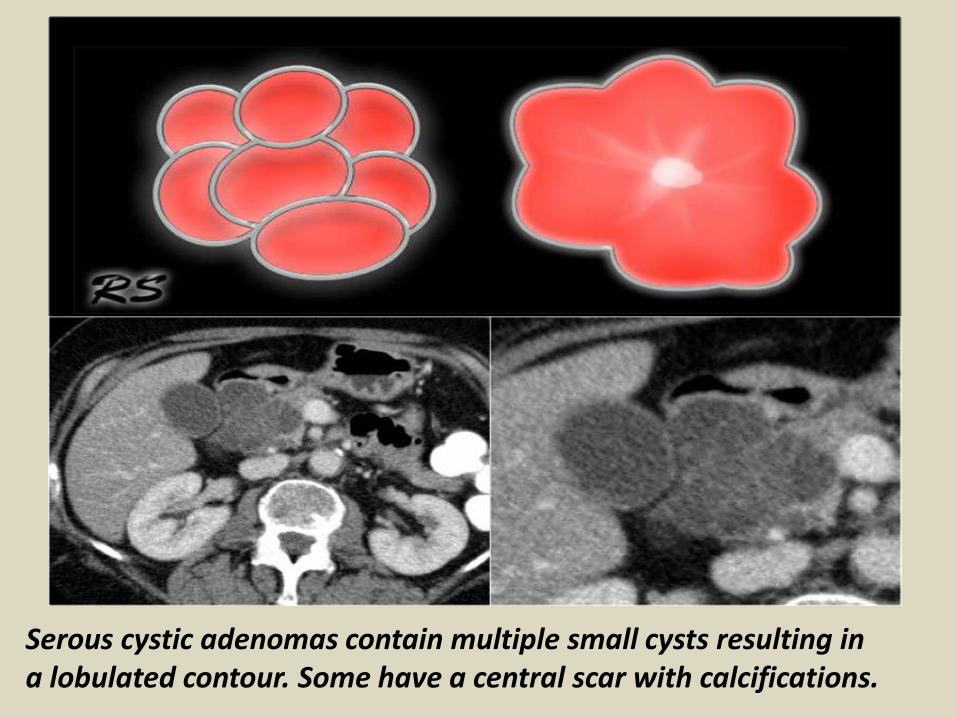
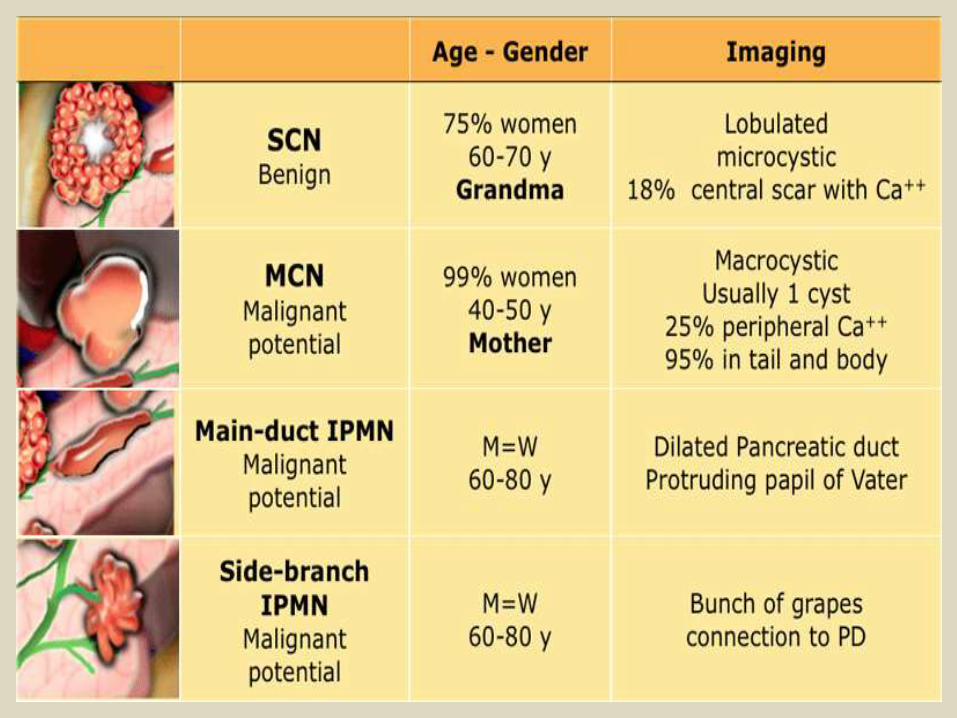
Serous cystic adenomas contain multiple small cysts resulting in a lobulated contour. Some have a central scar with calcifications.
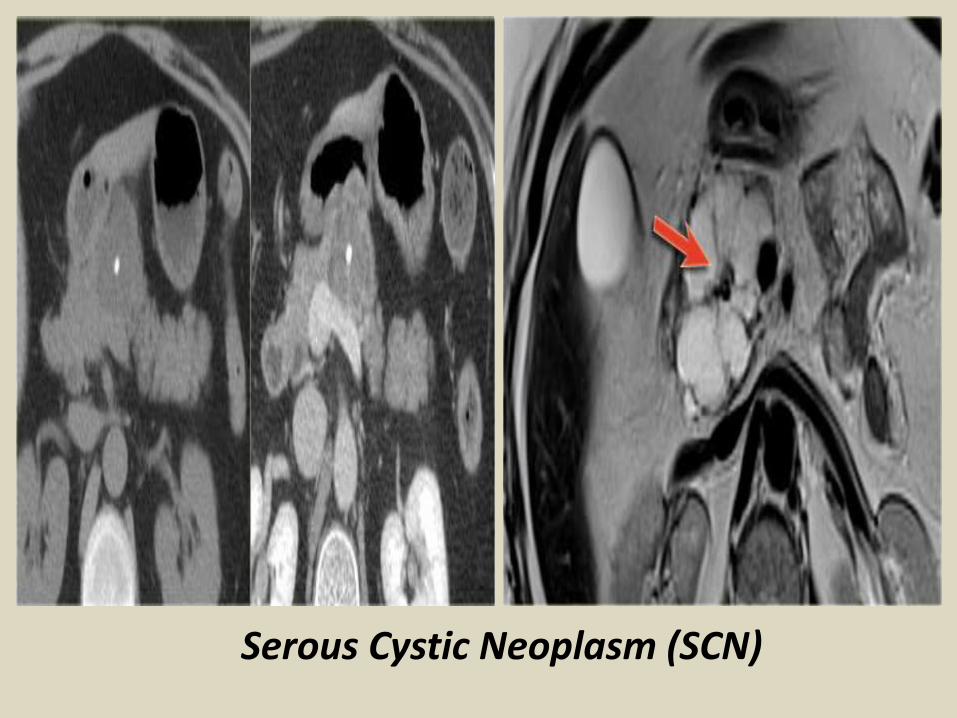
Serous Cystic Neoplasm (SCN)
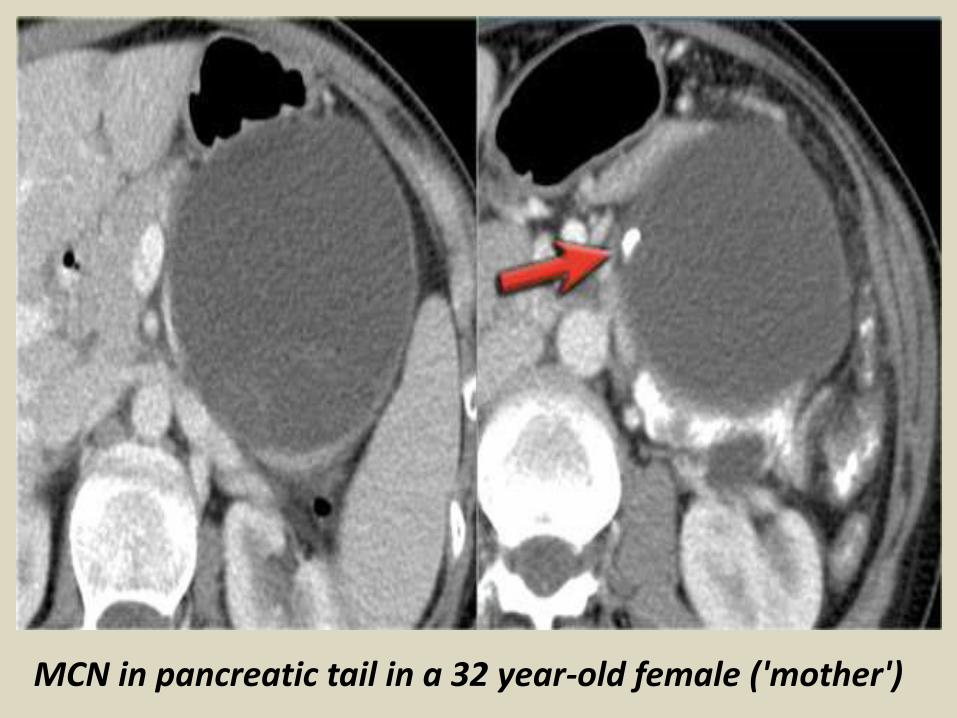
MCN in pancreatic tail in a 32 year-old female ('mother')
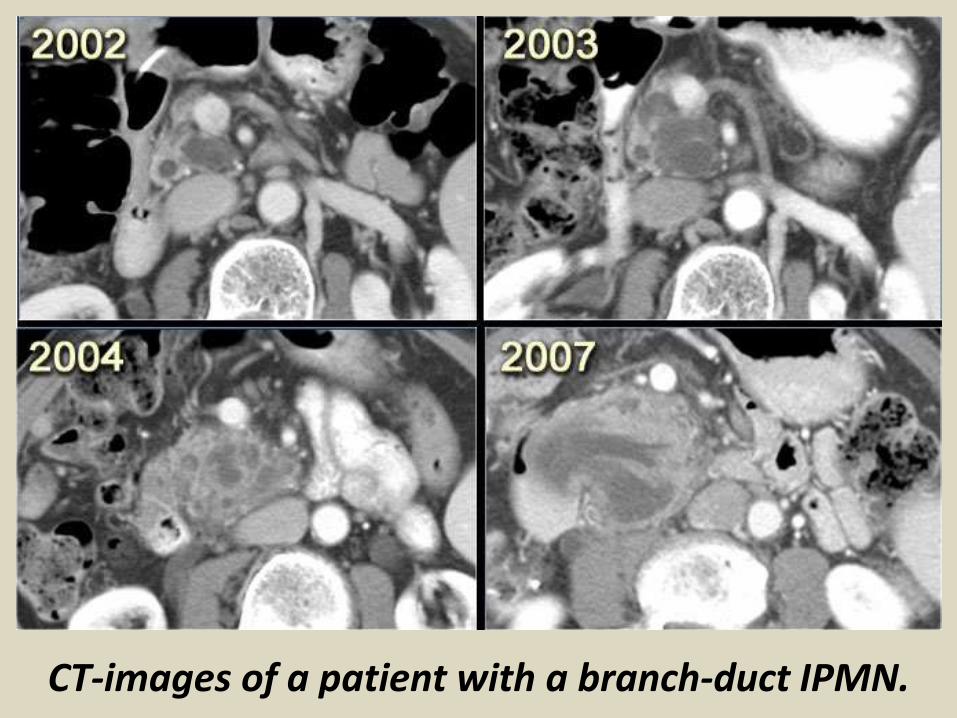
CT-images of a patient with a branch-duct IPMN.
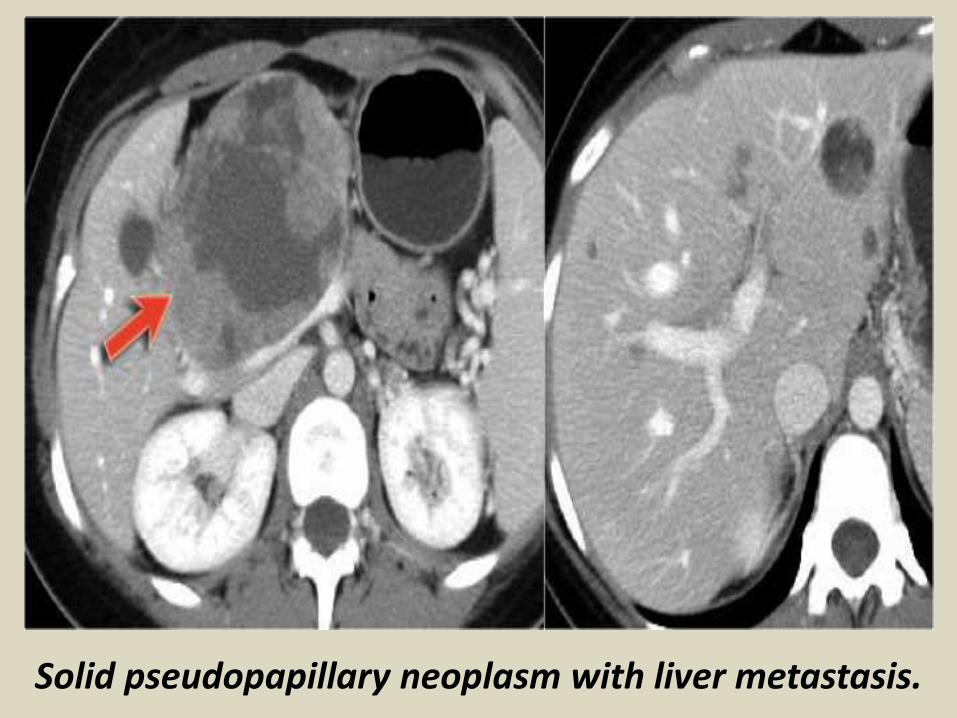
Solid pseudopapillary neoplasm with liver metastasis.
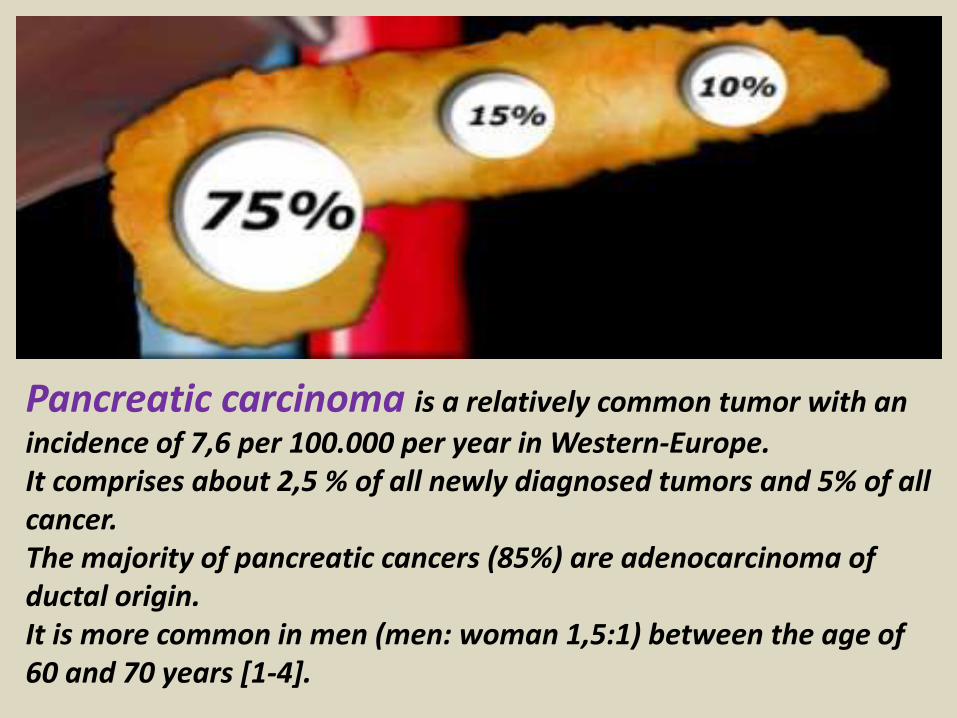
Pancreatic carcinoma is a relatively common tumor with an
incidence of 7,6 per 100.000 per year in Western-Europe. It comprises about 2,5 % of all newly diagnosed tumors and 5% of all cancer. The majority of pancreatic cancers (85%) are adenocarcinoma of ductal origin.It is more common in men (men: woman 1,5:1) between the age of 60 and 70 years [1-4].
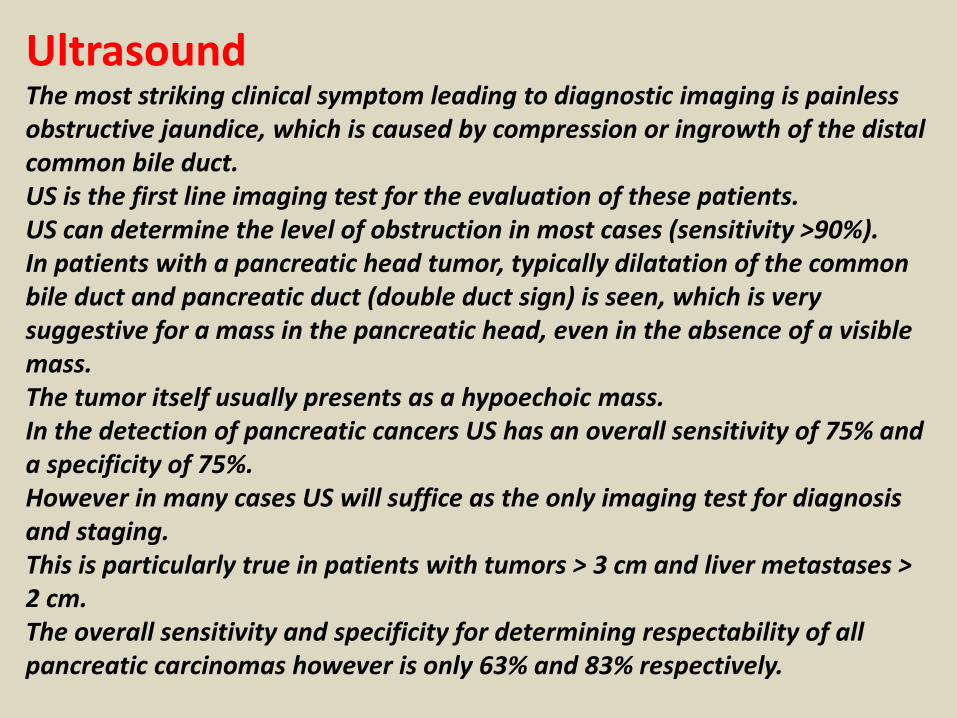
UltrasoundThe most striking clinical symptom leading to diagnostic imaging is painless obstructive jaundice, which is caused by compression or ingrowth of the distal common bile duct. US is the first line imaging test for the evaluation of these patients.US can determine the level of obstruction in most cases (sensitivity >90%). In patients with a pancreatic head tumor, typically dilatation of the common bile duct and pancreatic duct (double duct sign) is seen, which is very suggestive for a mass in the pancreatic head, even in the absence of a visible mass. The tumor itself usually presents as a hypoechoic mass.In the detection of pancreatic cancers US has an overall sensitivity of 75% and a specificity of 75%.However in many cases US will suffice as the only imaging test for diagnosis and staging.This is particularly true in patients with tumors > 3 cm and liver metastases > 2 cm.The overall sensitivity and specificity for determining respectability of all pancreatic carcinomas however is only 63% and 83% respectively.
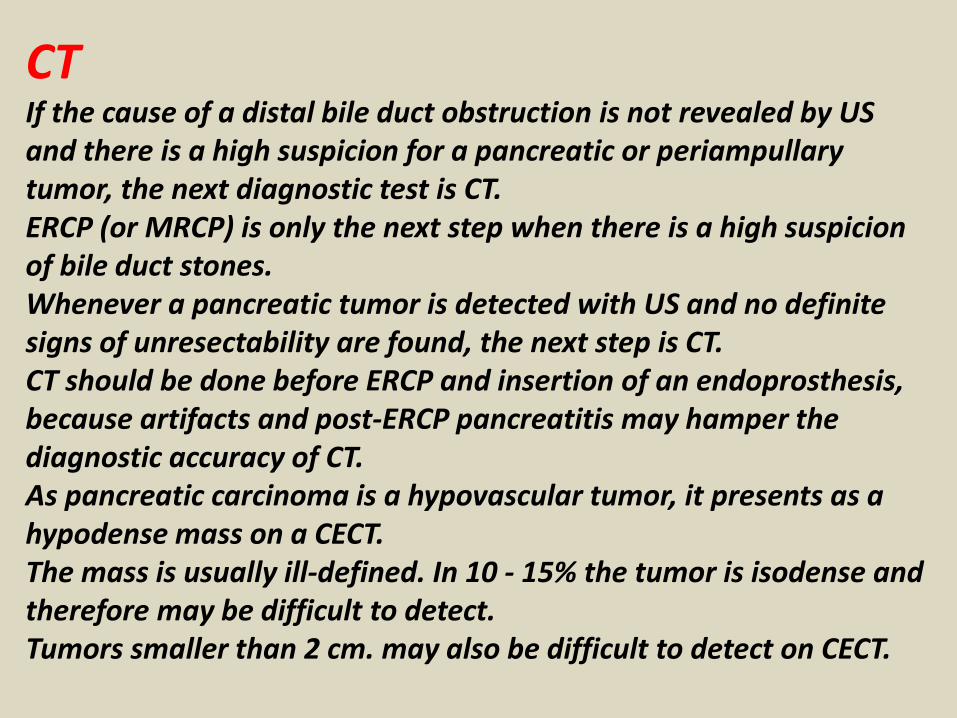
CTIf the cause of a distal bile duct obstruction is not revealed by US and there is a high suspicion for a pancreatic or periampullary tumor, the next diagnostic test is CT.ERCP (or MRCP) is only the next step when there is a high suspicion of bile duct stones. Whenever a pancreatic tumor is detected with US and no definite signs of unresectability are found, the next step is CT.CT should be done before ERCP and insertion of an endoprosthesis, because artifacts and post-ERCP pancreatitis may hamper the diagnostic accuracy of CT.As pancreatic carcinoma is a hypovascular tumor, it presents as a hypodense mass on a CECT.The mass is usually ill-defined. In 10 - 15% the tumor is isodense and therefore may be difficult to detect.Tumors smaller than 2 cm. may also be difficult to detect on CECT.
MRICT and MRI both have a higher sensitivity than ultrasound for the detection of small ( MRI-sequences should involve at least T2W-images en dynamic T1W-images after intravenous administration of gadolinium.MRCP is also very sensitive for detecting a periampullary mass, but offers no significant additional staging information.
ERCPMany patients in whom a pancreatic head tumor is detected by ultrasound still undergo ERCP. Although ERCP has a high sensitivity for detecting pancreatic head tumors, it is nowadays no longer indicated because the diagnosis can usually be made with non-invasive tests. ERCP offers no useful tumor staging information. It is doubtful whether pre-operative bile duct drainage by ERCP is beneficial for the patient. Pre-operative biliary drainage may potentially even increase the risk for post-operative infectious complications.
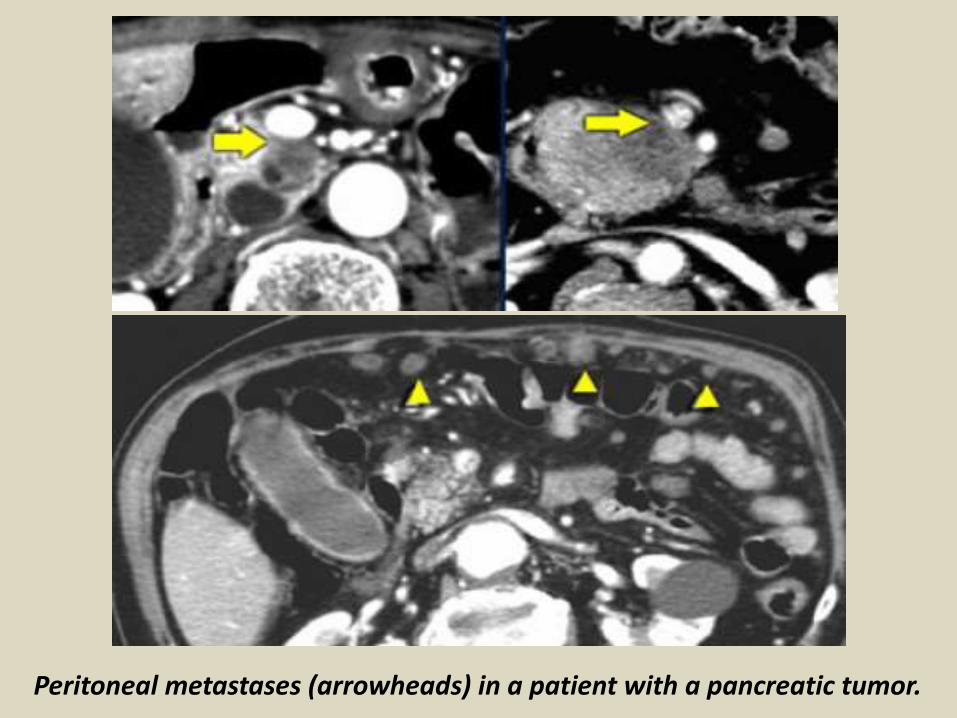
Peritoneal metastases (arrowheads) in a patient with a pancreatic tumor.
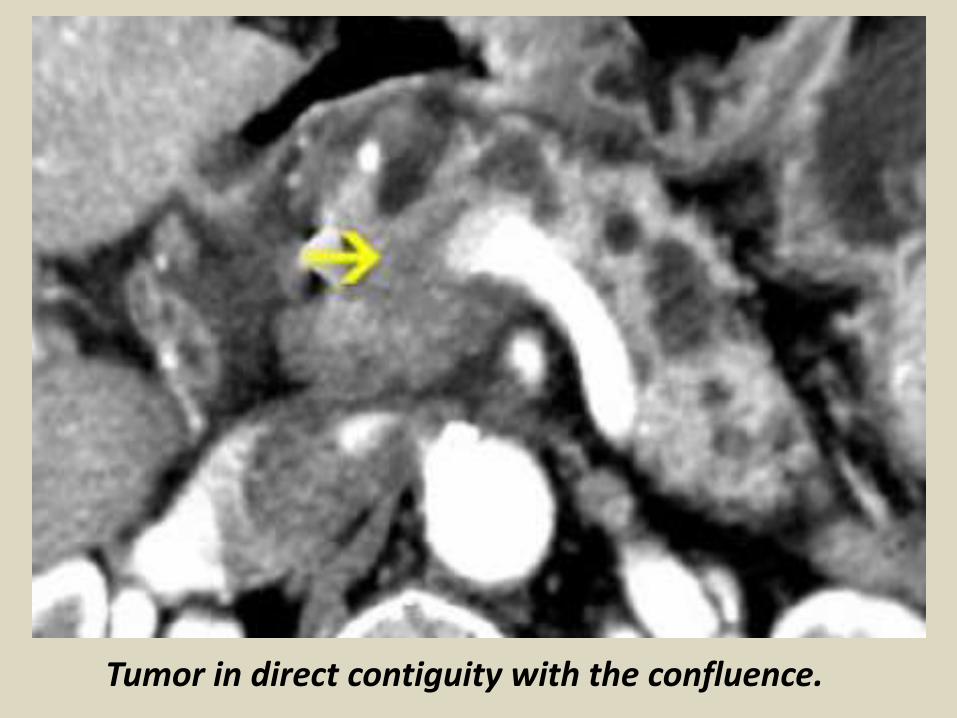
Tumor in direct contiguity with the confluence.
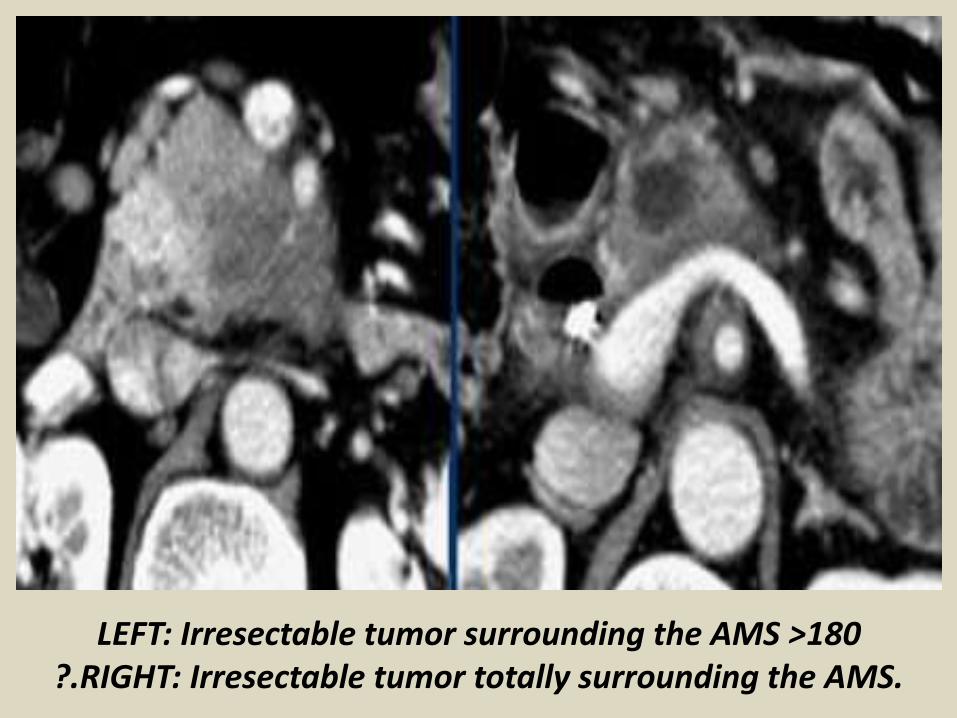
LEFT: Irresectable tumor surrounding the AMS >180?.RIGHT: Irresectable tumor totally surrounding the AMS.
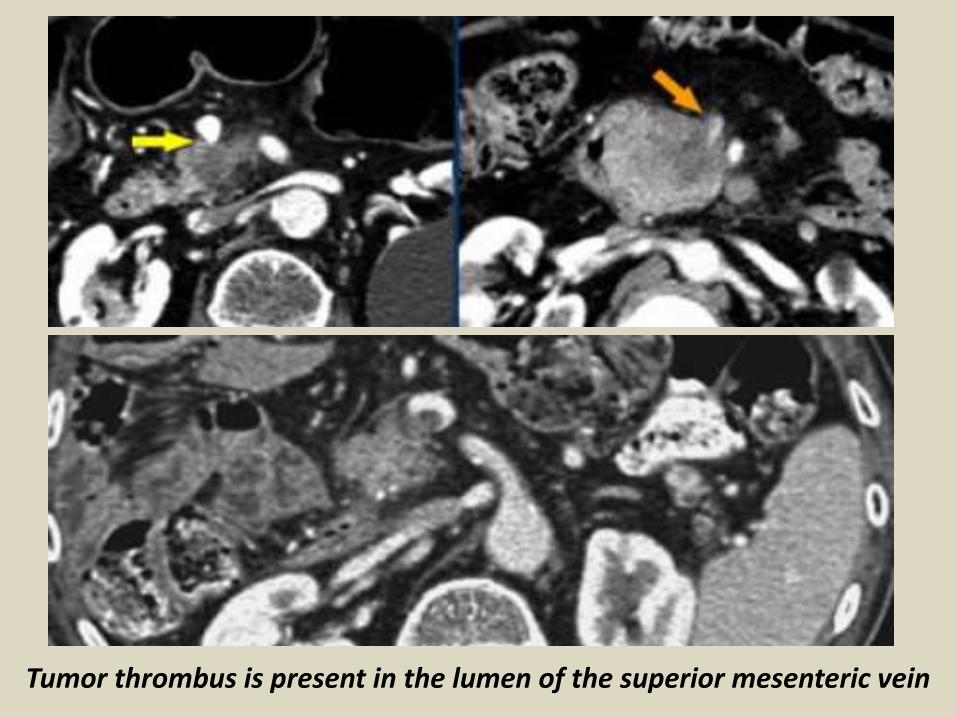
Tumor thrombus is present in the lumen of the superior mesenteric vein
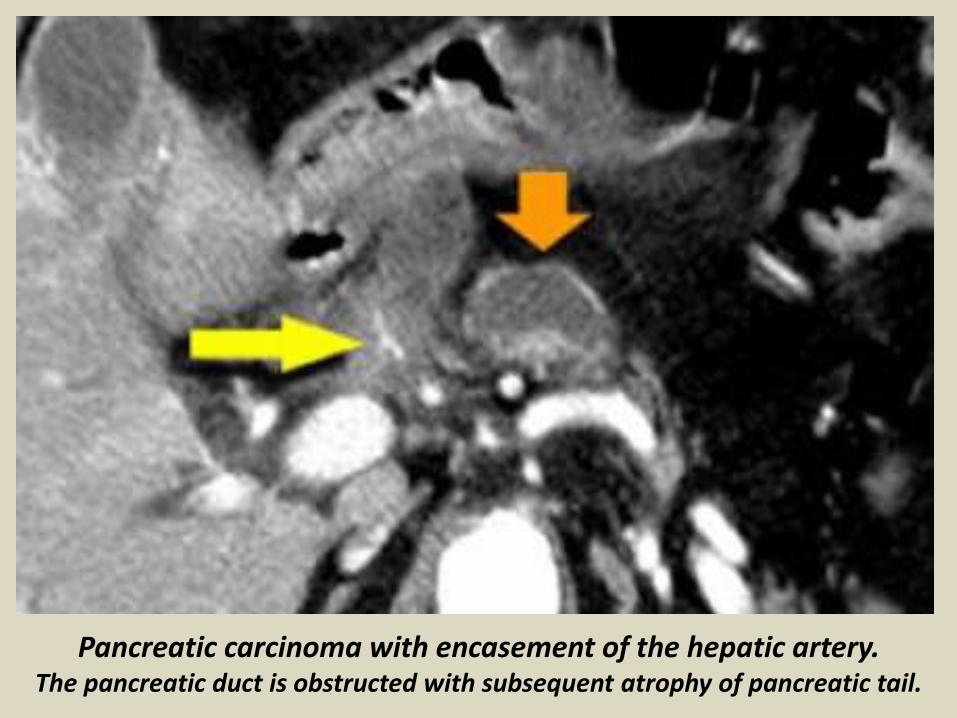
Pancreatic carcinoma with encasement of the hepatic artery.The pancreatic duct is obstructed with subsequent atrophy of pancreatic tail.
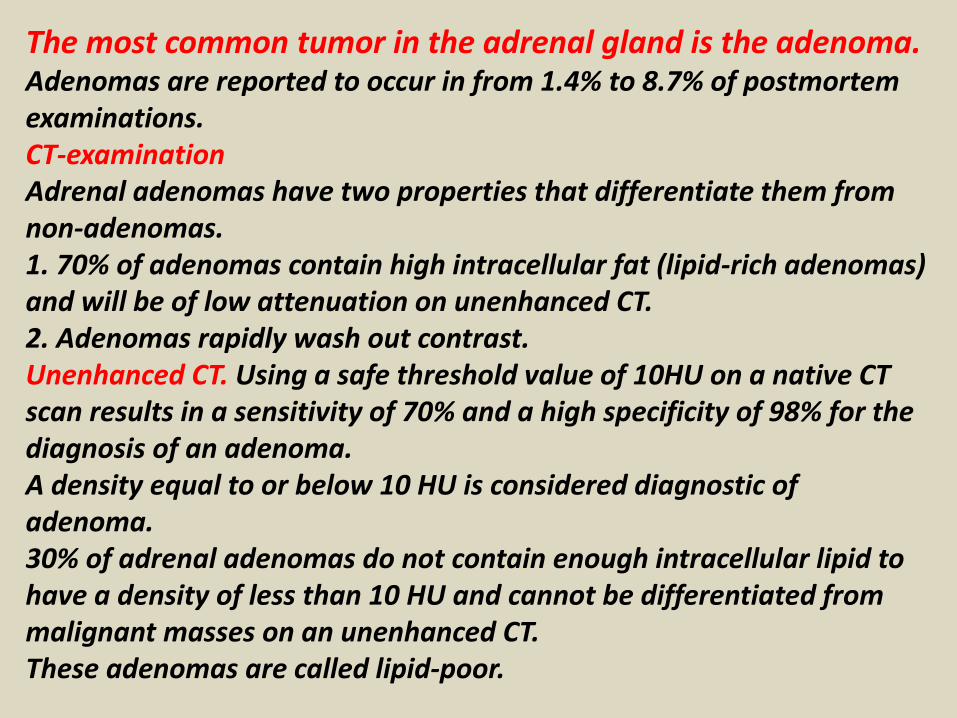
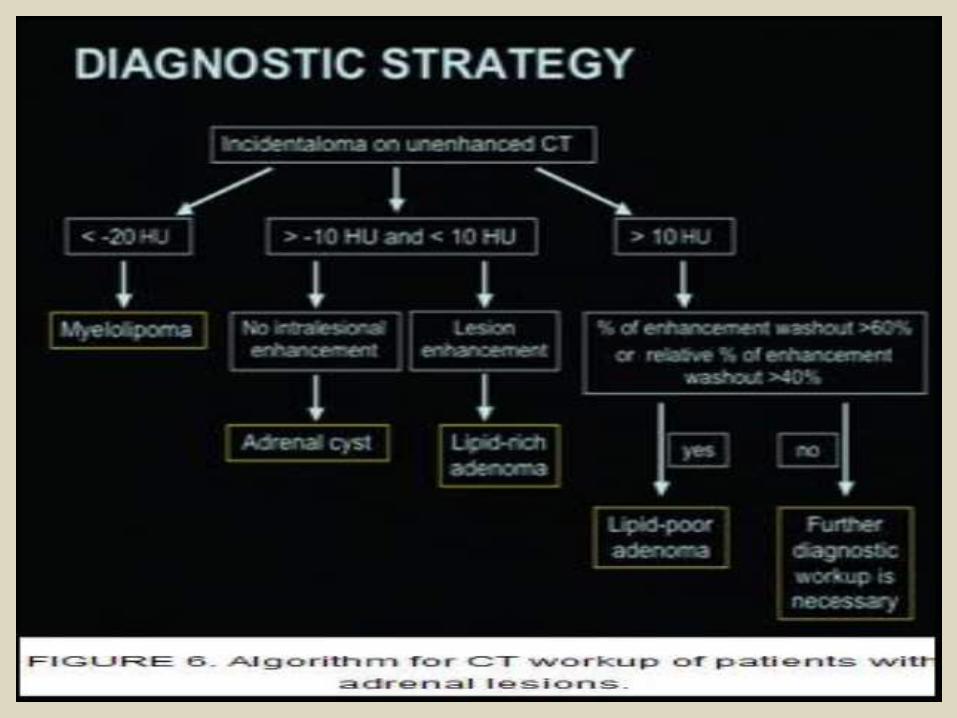
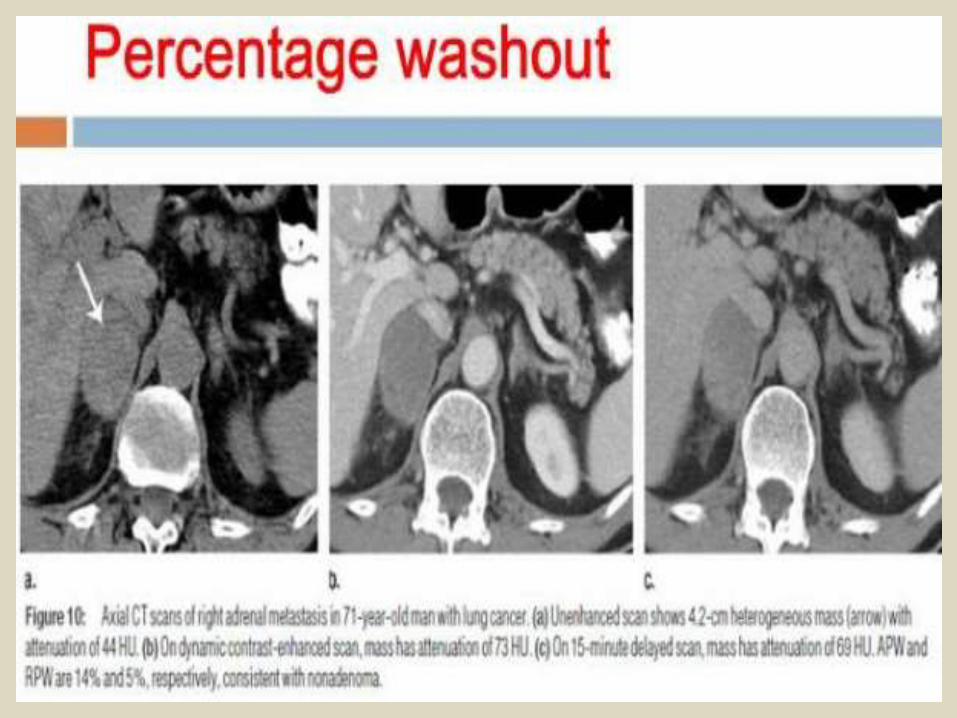
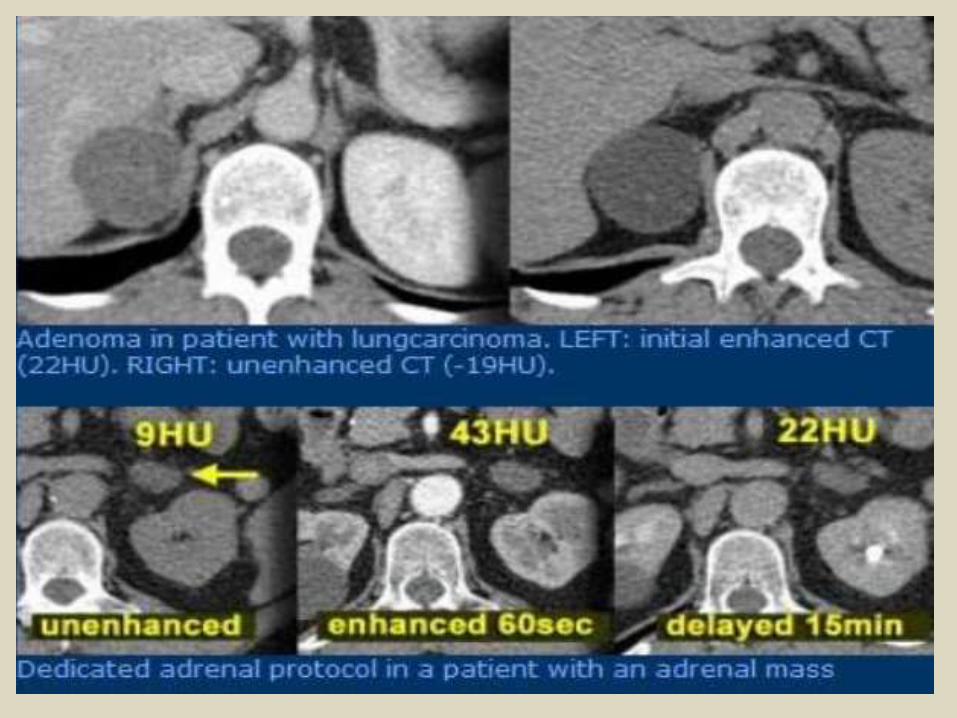
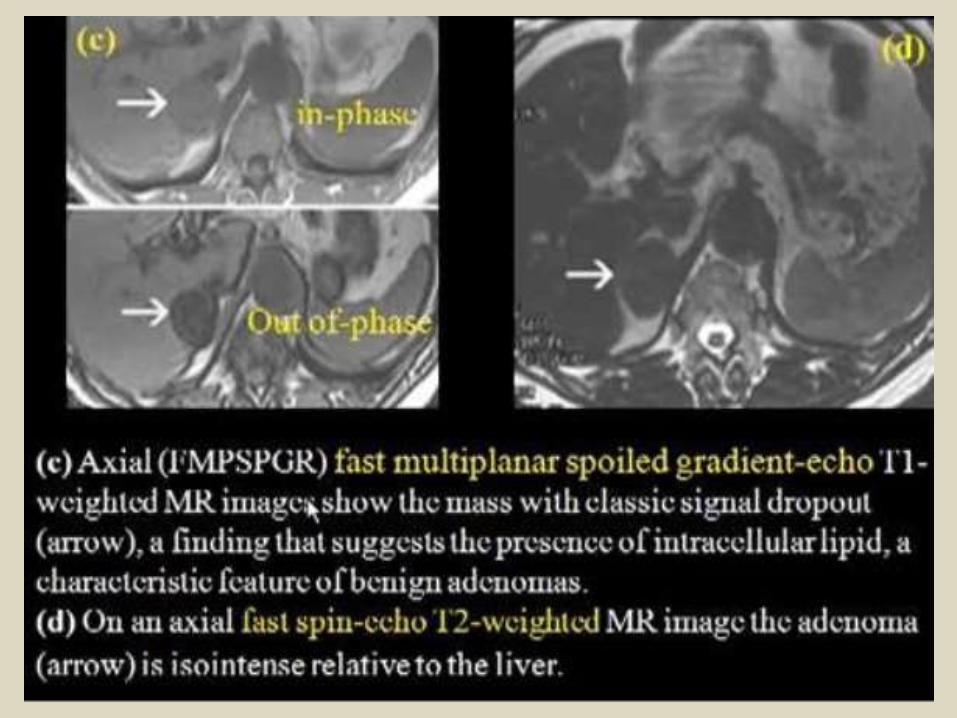
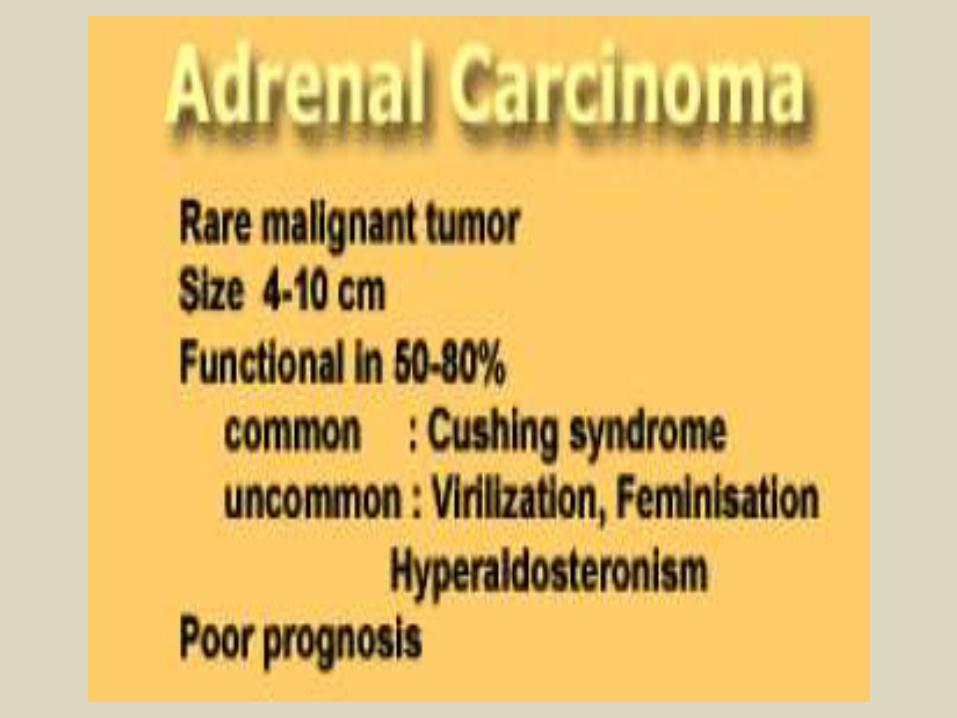
The most common tumor in the adrenal gland is the adenoma.Adenomas are reported to occur in from 1.4% to 8.7% of postmortem examinations. CT-examinationAdrenal adenomas have two properties that differentiate them from non-adenomas. 1. 70% of adenomas contain high intracellular fat (lipid-rich adenomas) and will be of low attenuation on unenhanced CT.2. Adenomas rapidly wash out contrast.Unenhanced CT. Using a safe threshold value of 10HU on a native CT scan results in a sensitivity of 70% and a high specificity of 98% for the diagnosis of an adenoma. A density equal to or below 10 HU is considered diagnostic of adenoma.30% of adrenal adenomas do not contain enough intracellular lipid to have a density of less than 10 HU and cannot be differentiated from malignant masses on an unenhanced CT.These adenomas are called lipid-poor.
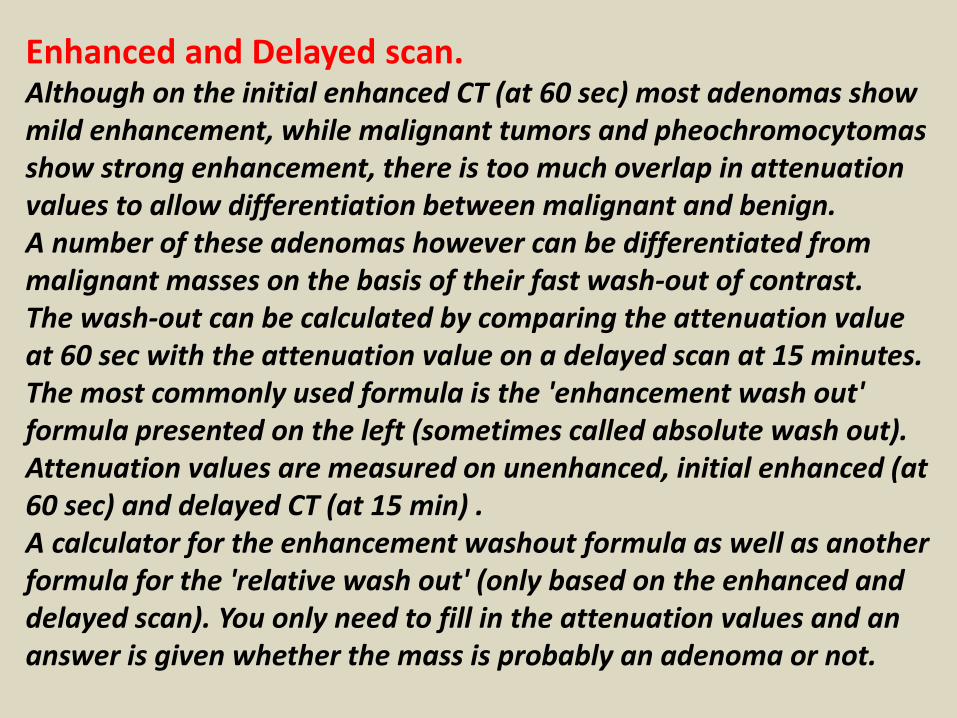
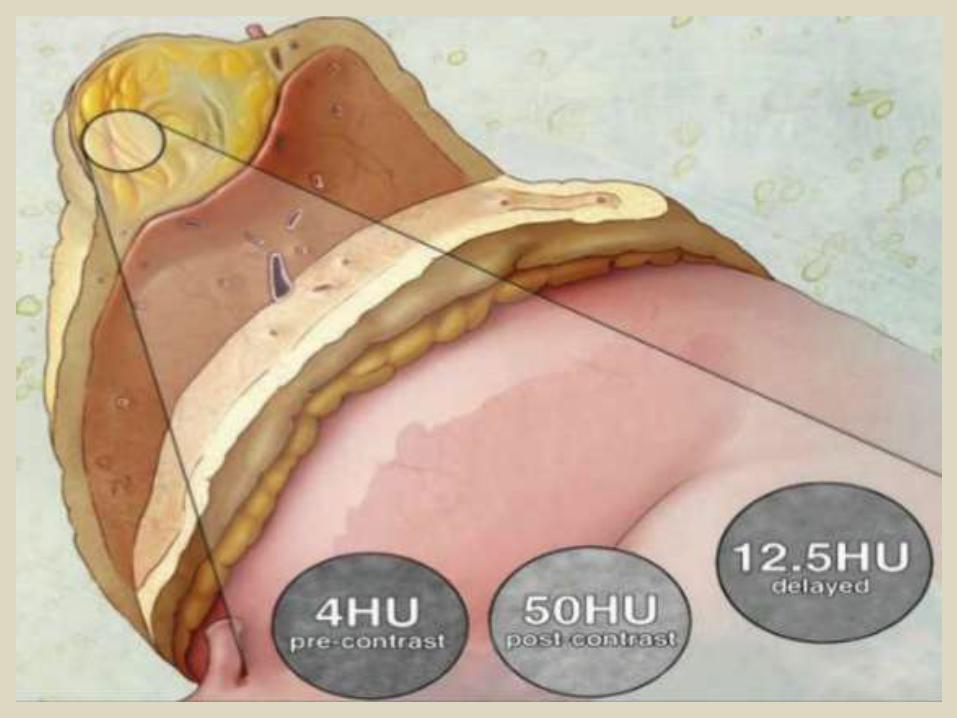
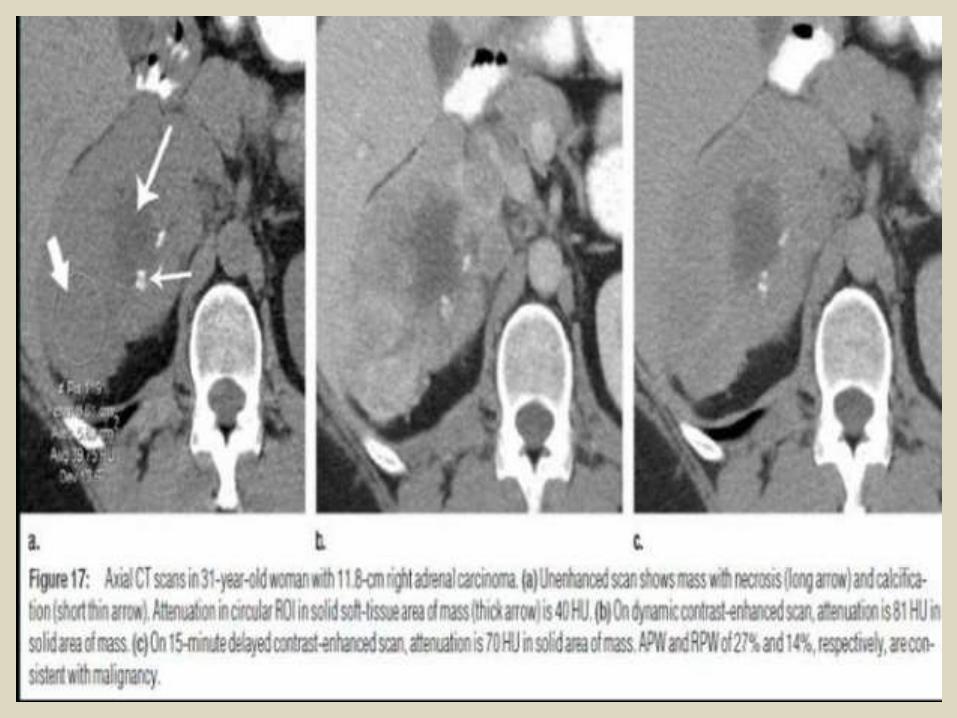
Enhanced and Delayed scan.Although on the initial enhanced CT (at 60 sec) most adenomas show mild enhancement, while malignant tumors and pheochromocytomas show strong enhancement, there is too much overlap in attenuation values to allow differentiation between malignant and benign.A number of these adenomas however can be differentiated from malignant masses on the basis of their fast wash-out of contrast.The wash-out can be calculated by comparing the attenuation value at 60 sec with the attenuation value on a delayed scan at 15 minutes. The most commonly used formula is the 'enhancement wash out' formula presented on the left (sometimes called absolute wash out). Attenuation values are measured on unenhanced, initial enhanced (at 60 sec) and delayed CT (at 15 min) .A calculator for the enhancement washout formula as well as another formula for the 'relative wash out' (only based on the enhanced and delayed scan). You only need to fill in the attenuation values and an answer is given whether the mass is probably an adenoma or not.
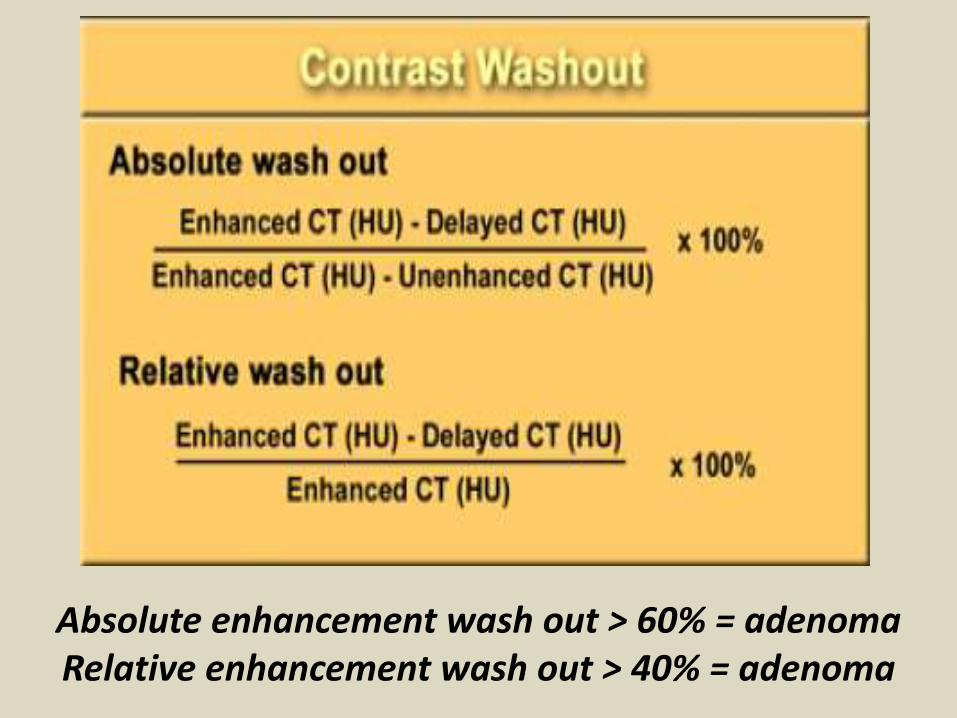
Absolute enhancement wash out > 60% = adenoma Relative enhancement wash out > 40% = adenoma
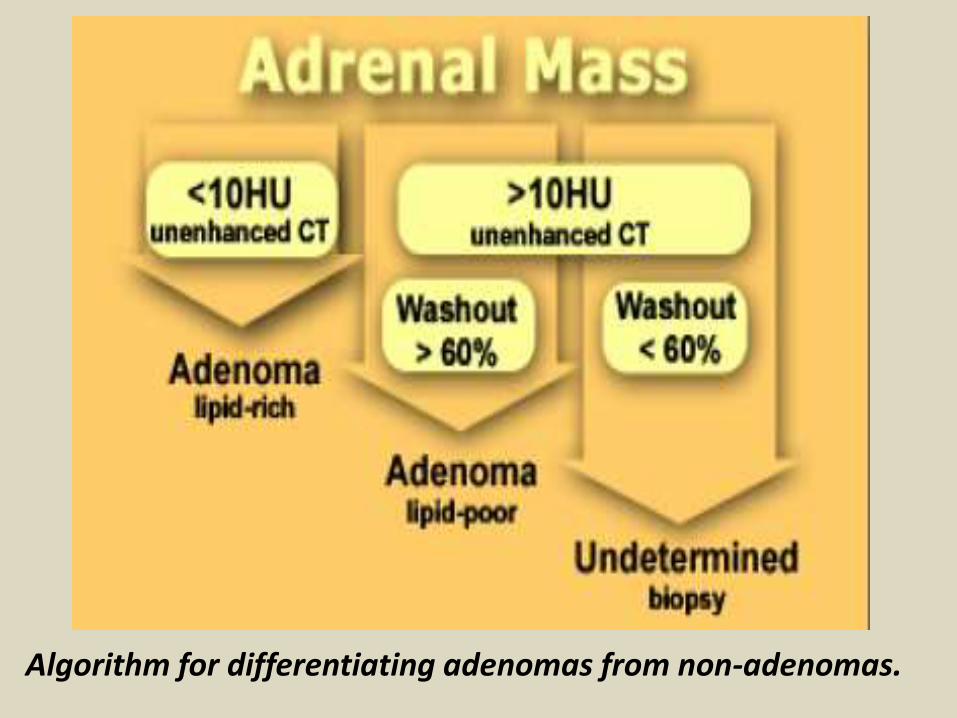
Algorithm for differentiating adenomas from non-adenomas.
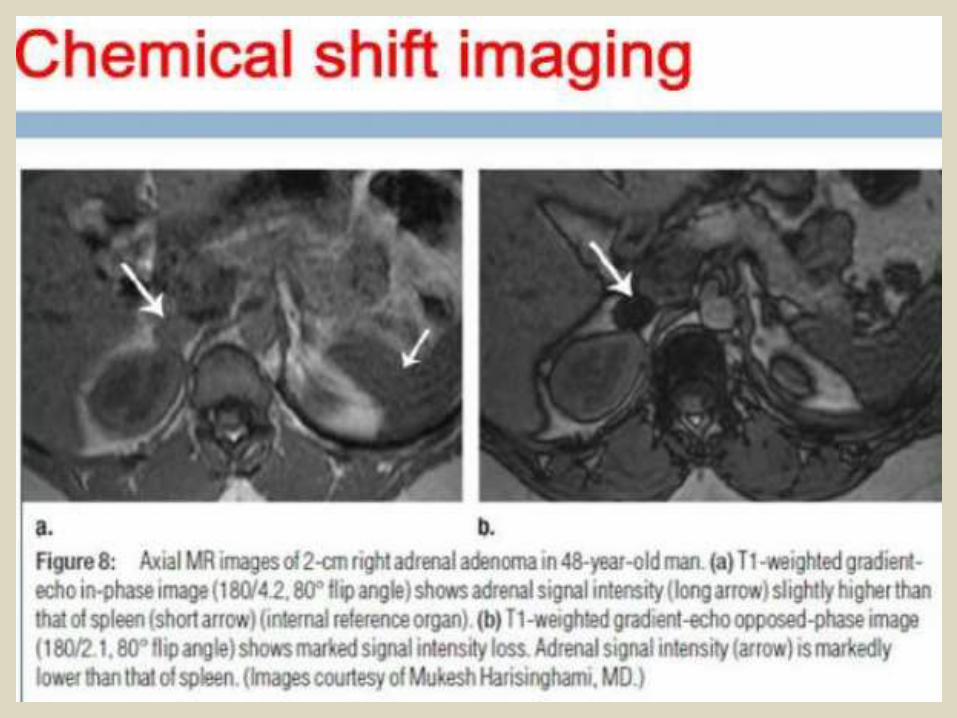
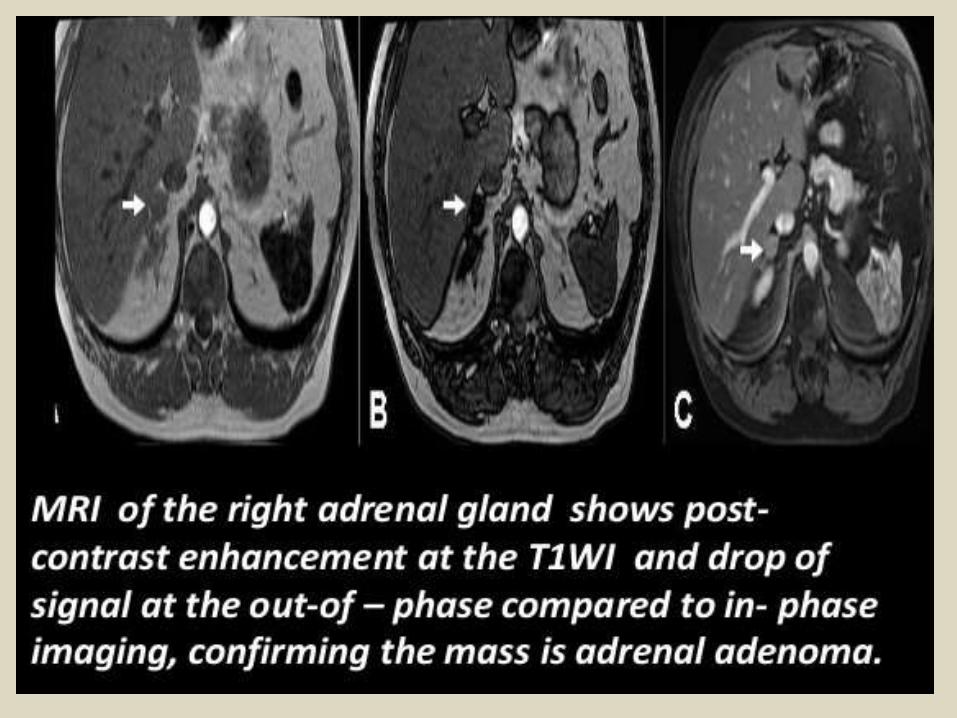
MRIAlthough chemical shift MRI is commonly performed, it is believed by some not to provide additional information beyond that which is already available on unenhanced CT. The characterization of a lesion as an adenoma relies on the ratio of a decreased relative signal intensity from in phase to opposed phase images and the ratio of adrenal mass and various organs on T2-weighted and chemical shift images.There are no reported studies yet that compare unenhanced CT, delayed enhanced CT, and chemical shift for the discrimination between adenomas and no adenomas.
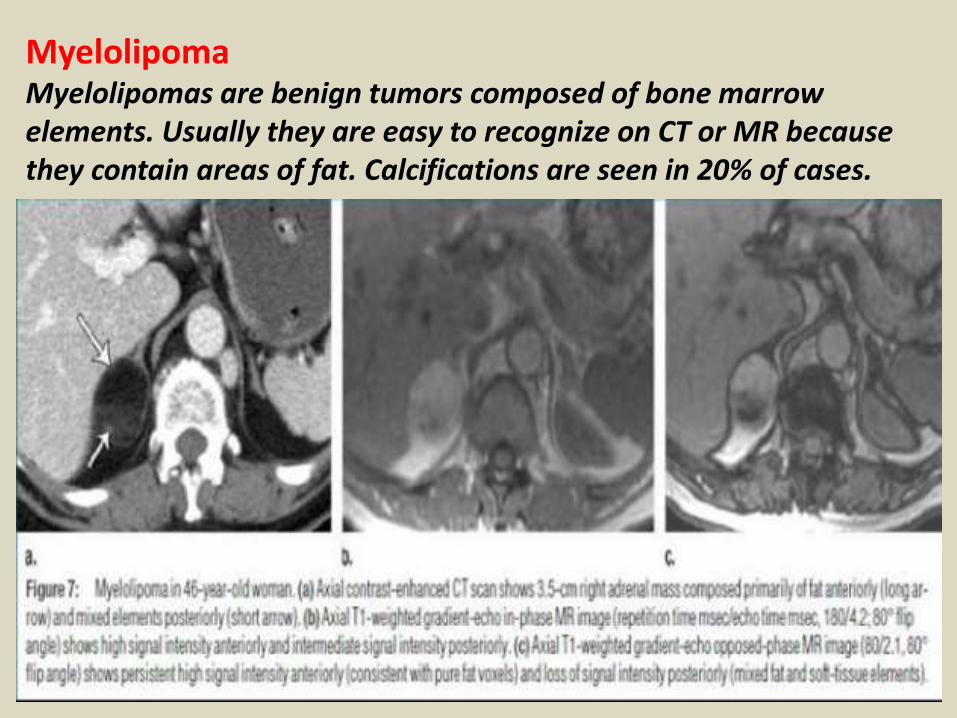
MyelolipomaMyelolipomas are benign tumors composed of bone marrow elements. Usually they are easy to recognize on CT or MR because they contain areas of fat. Calcifications are seen in 20% of cases.
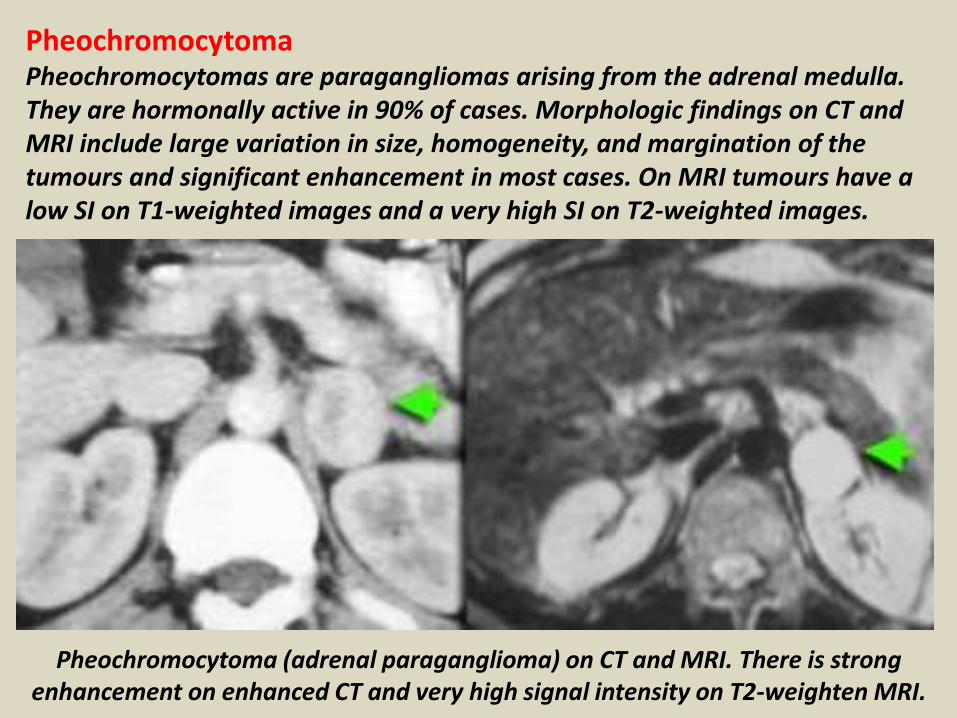
PheochromocytomaPheochromocytomas are paragangliomas arising from the adrenal medulla. They are hormonally active in 90% of cases. Morphologic findings on CT and MRI include large variation in size, homogeneity, and margination of the tumours and significant enhancement in most cases. On MRI tumours have a low SI on T1-weighted images and a very high SI on T2-weighted images.
Pheochromocytoma (adrenal paraganglioma) on CT and MRI. There is strong enhancement on enhanced CT and very high signal intensity on T2-weighten MRI.
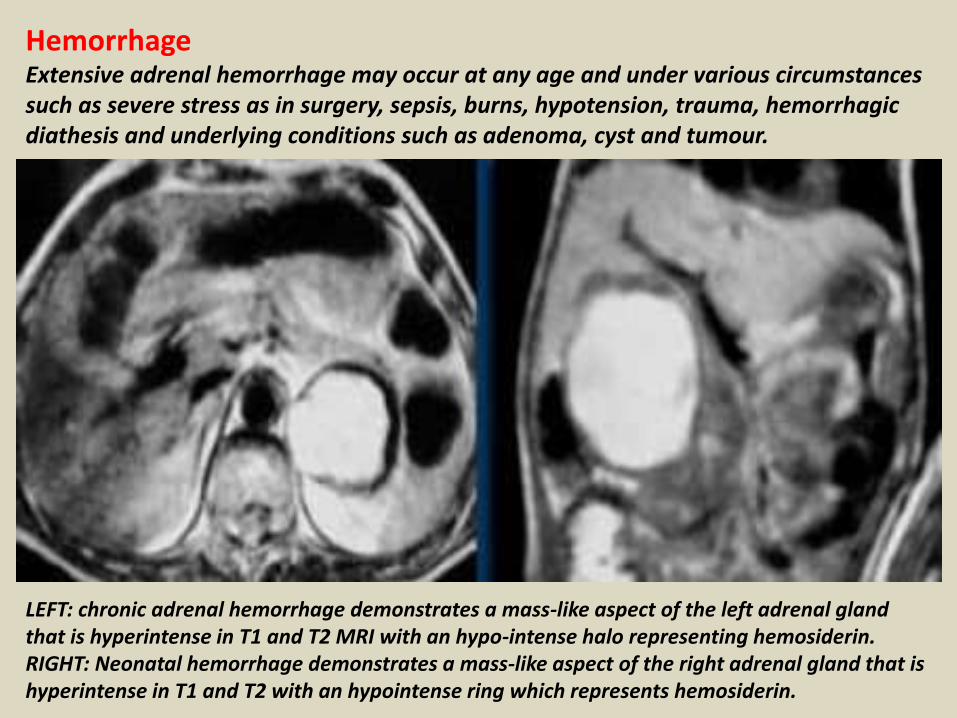
HemorrhageExtensive adrenal hemorrhage may occur at any age and under various circumstances such as severe stress as in surgery, sepsis, burns, hypotension, trauma, hemorrhagic diathesis and underlying conditions such as adenoma, cyst and tumour.
LEFT: chronic adrenal hemorrhage demonstrates a mass-like aspect of the left adrenal gland that is hyperintense in T1 and T2 MRI with an hypo-intense halo representing hemosiderin. RIGHT: Neonatal hemorrhage demonstrates a mass-like aspect of the right adrenal gland that is hyperintense in T1 and T2 with an hypointense ring which represents hemosiderin.

CystCysts may be of any size and in most instances are unilateral. Large cysts may be complicated by hemorrhage and consequent onset of acute symptoms. Pathological substrates include epithelial , endothelial, parasitic, and pseudocysts. Most importantly lesions show a thin wall and no enhancement after intravenous contrast material.
Patient with a left adrenal cyst on T2-weighted TSE (left) and fat-suppressed T1W-image after i. v. injection of Gadolinium (right).
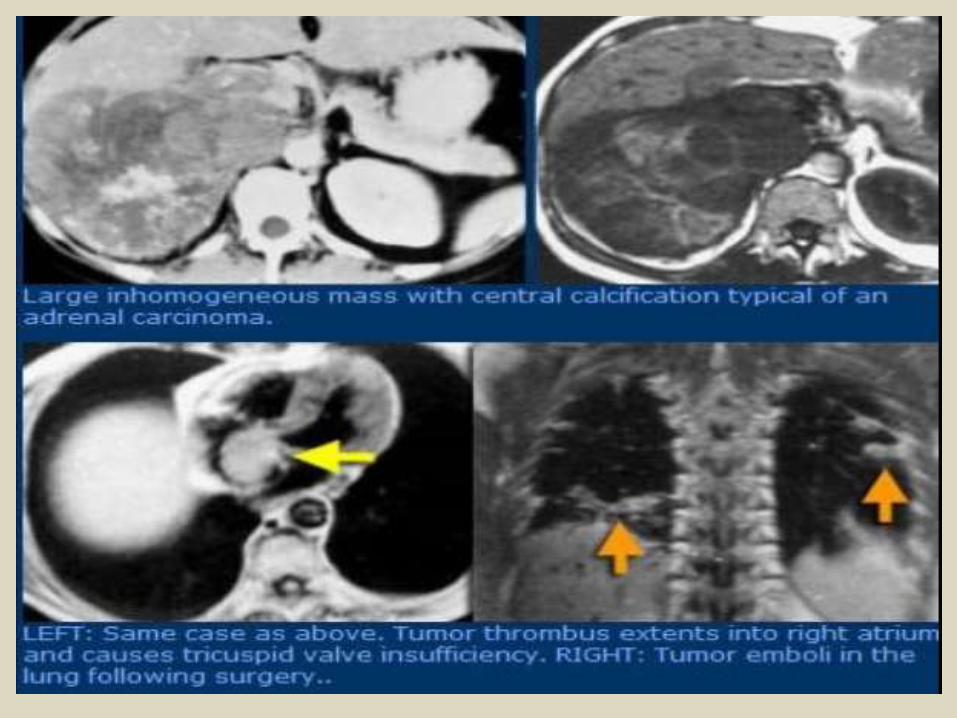
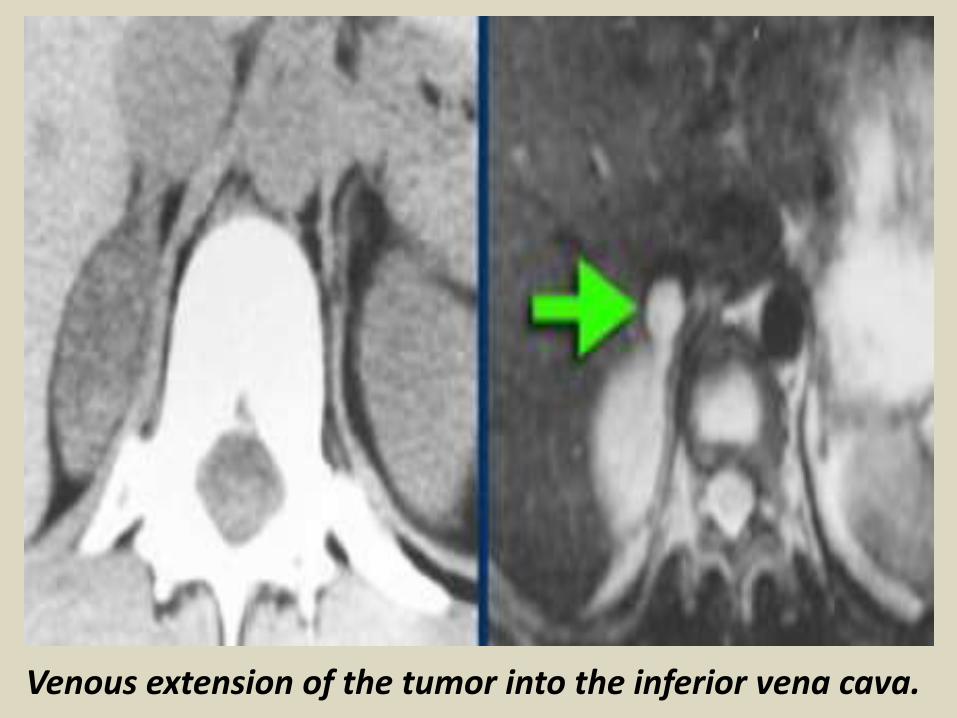
Venous extension of the tumor into the inferior vena cava.
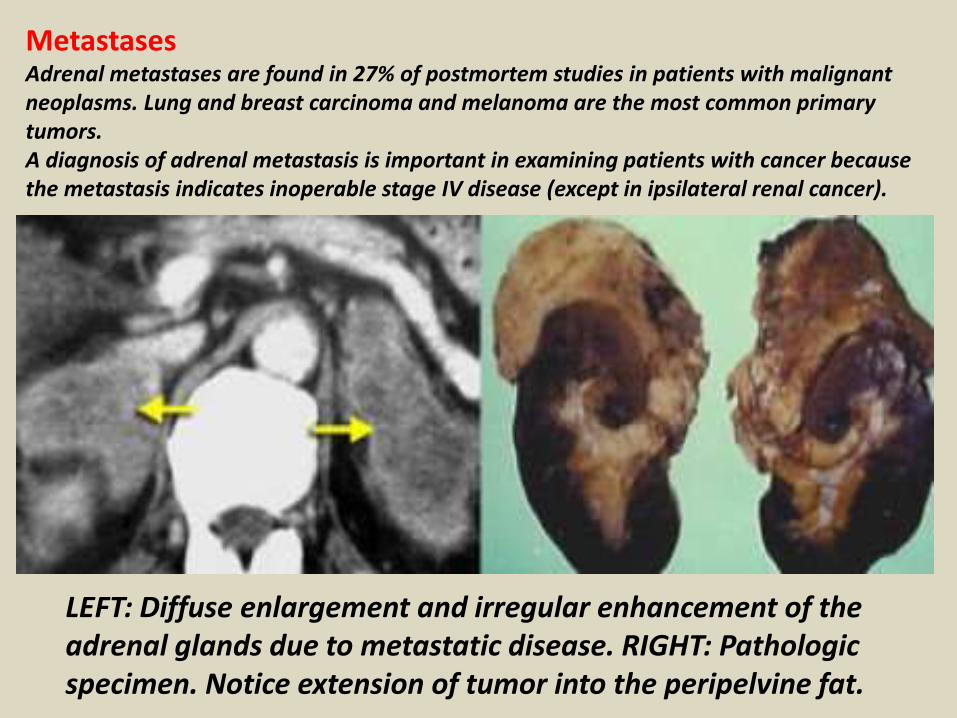
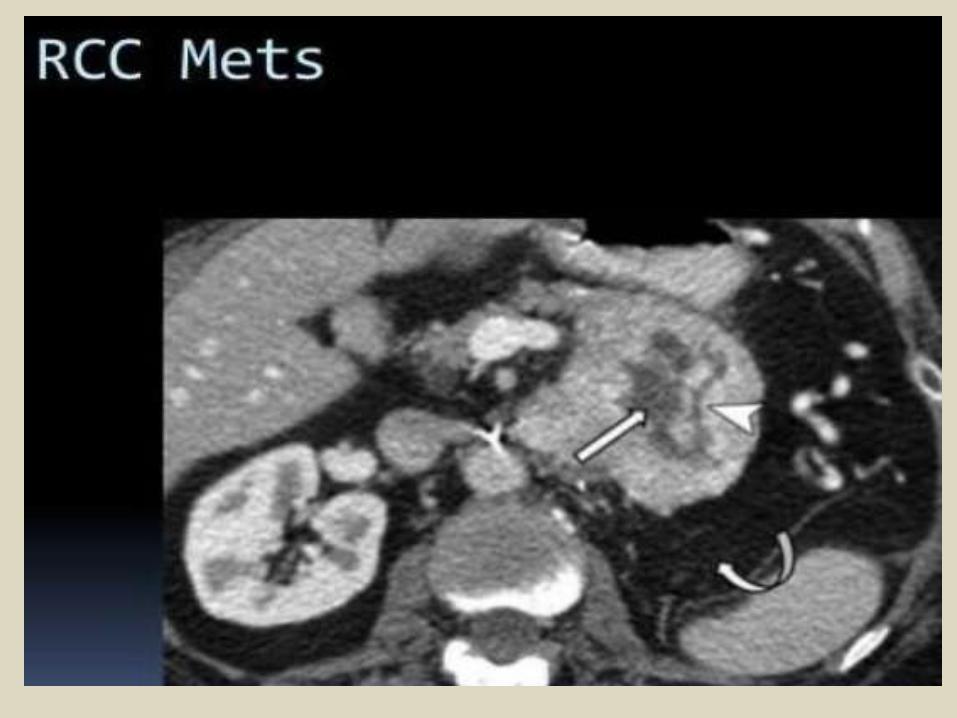
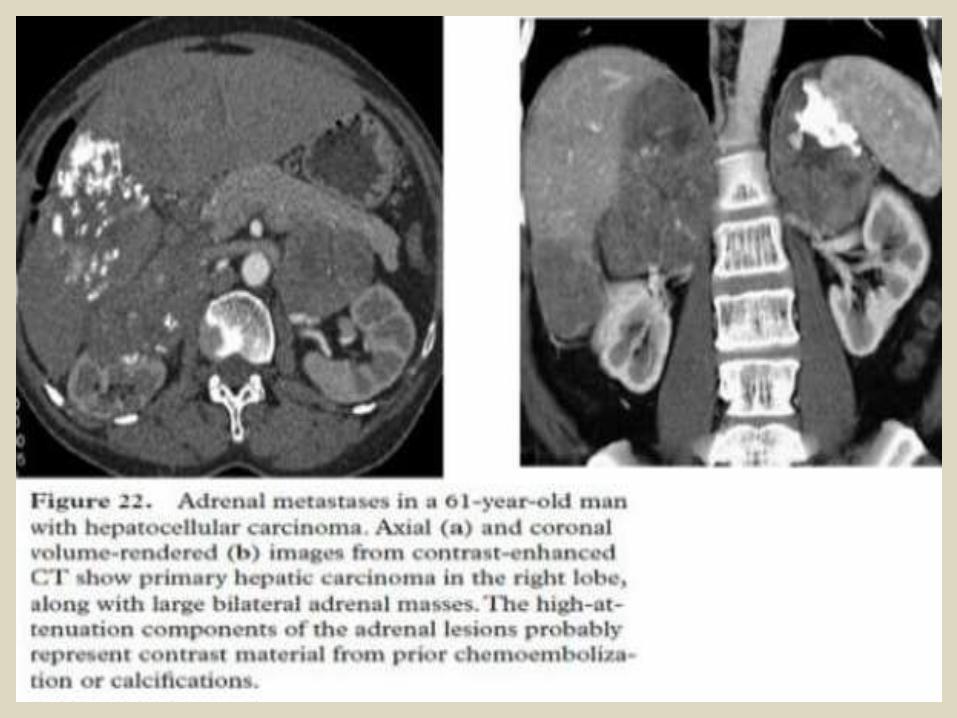
MetastasesAdrenal metastases are found in 27% of postmortem studies in patients with malignant neoplasms. Lung and breast carcinoma and melanoma are the most common primary tumors.A diagnosis of adrenal metastasis is important in examining patients with cancer because the metastasis indicates inoperable stage IV disease (except in ipsilateral renal cancer).
LEFT: Diffuse enlargement and irregular enhancement of the adrenal glands due to metastatic disease. RIGHT: Pathologic specimen. Notice extension of tumor into the peripelvine fat.
Para-aortic lymph nodes.The para-aortic lymph nodes (also known as para-aortic, peri-aortic, peri-aortic, and lumbar) are a group of lymph nodes that lie in front of the lumbar vertebral bodies near the aorta. These lymph nodes receive drainage from the upper gastrointestinal tract and the abdominal organs.
The para-aortic lymph node group is divided into three subgroups: pre-aortic, retro-aortic, and right and left lateral aortic.The pre-aortic group drains the abdominal part of the gastrointestinal tract above the mid-rectum.The retro-aortic group drains from the lateral and pre-aortic glands.The lateral group drains the iliac lymph nodes, the ovaries, and other pelvic organs. The lateral group nodes are located adjacent to the aorta, anterior to the spine, extending laterally to the edge of the psoas major muscles, and superiorly to the crura of the diaphragm.
Para-aortic lymph node (PAN) metastasis is considered an important prognostic factor in several abdominal and pelvic malignancies, such as stomach cancer, colorectal cancer, Cholangiocarcinoma, and cervical cancer. While it is very important to evaluate PAN metastasis in preoperative evaluations, the correct diagnosis is not always definitively determined. Because of this, sampling and pathologic confirmation of the para-aortic nodes should be carried out before starting a radical operation, which is why many surgeons, including those in our hospital, perform para-aortic node dissection before radical surgery. Although lymphadenectomy followed by histologic examination of the lymph nodes is still the gold standard for determining metastasis, doctors must be careful in using this technique because of the perioperative risks and postoperative complications of PAN dissection. All of this makes preoperative, noninvasive imaging diagnosis of PAN metastasis very important.
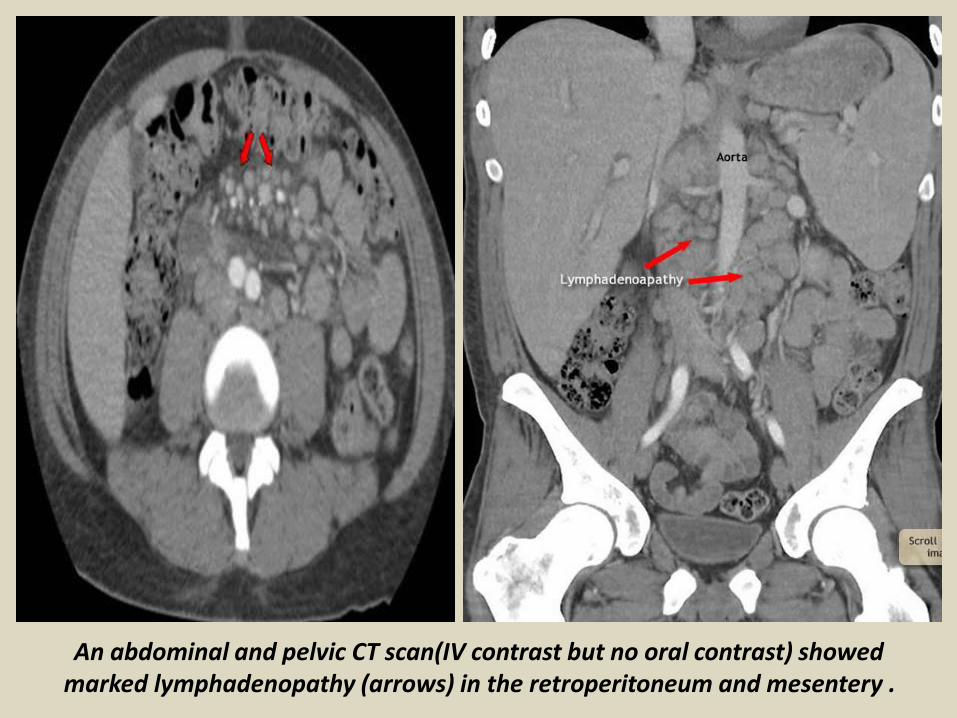
An abdominal and pelvic CT scan(IV contrast but no oral contrast) showed marked lymphadenopathy (arrows) in the retroperitoneum and mesentery .
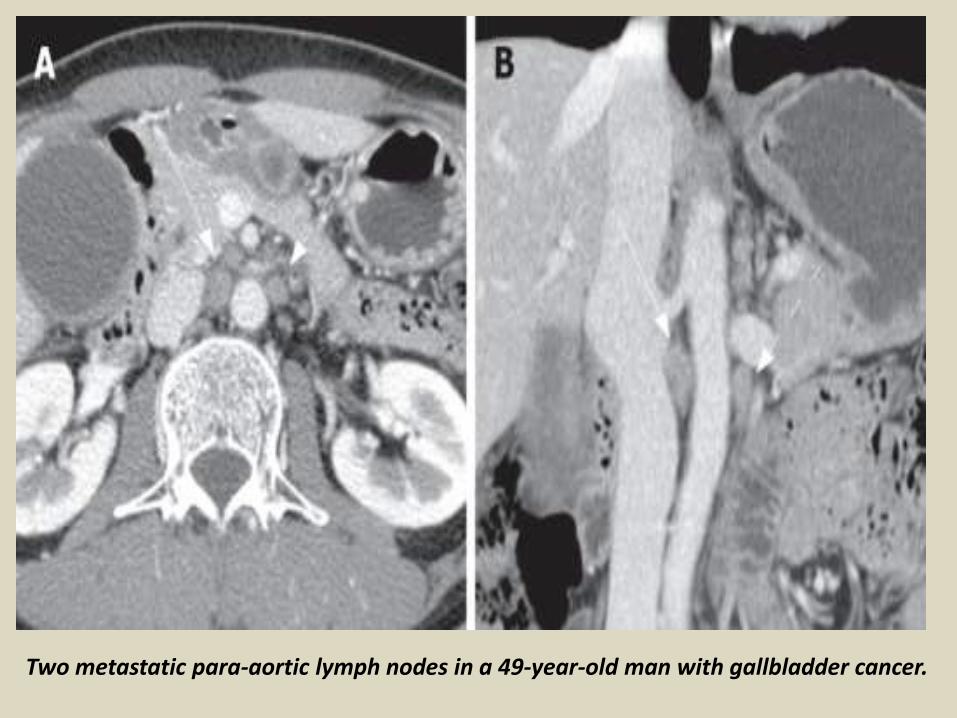
Two metastatic para-aortic lymph nodes in a 49-year-old man with gallbladder cancer.
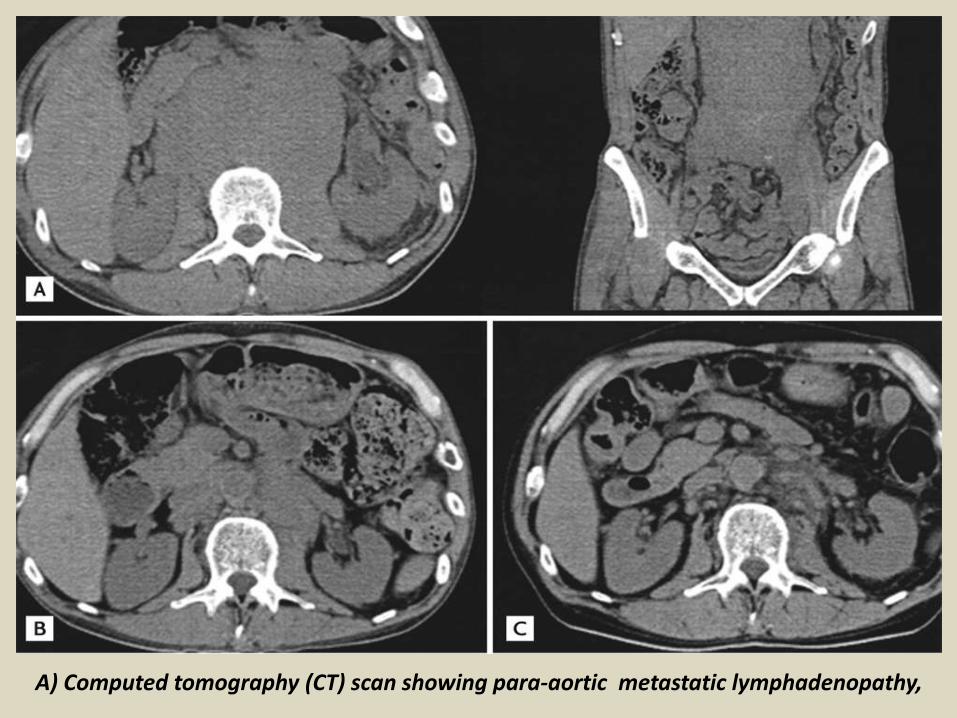
A) Computed tomography (CT) scan showing para-aortic metastatic lymphadenopathy,
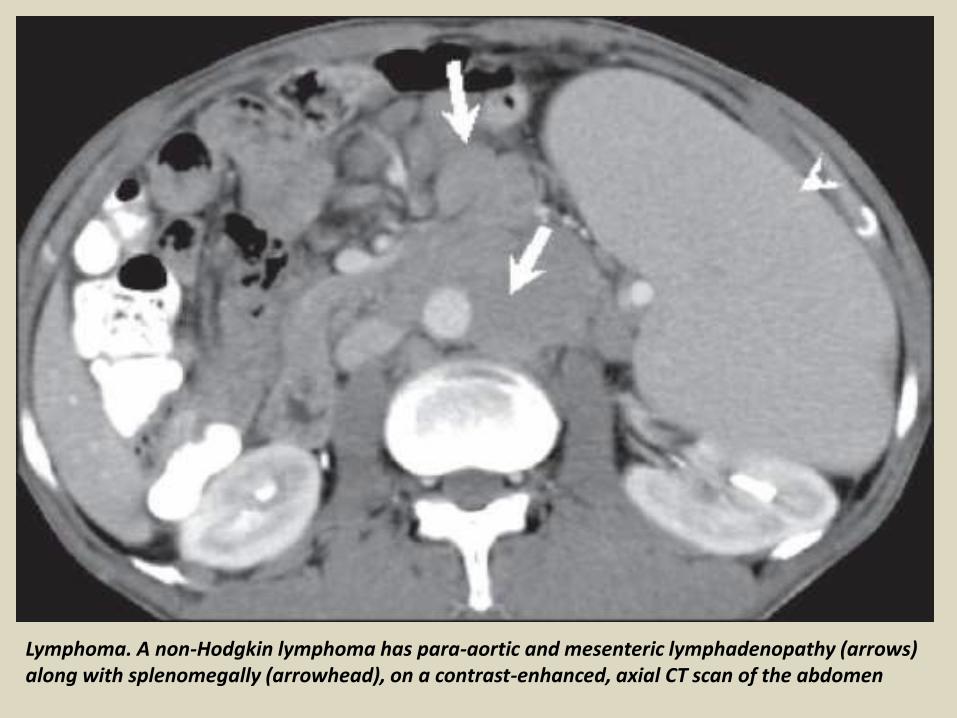
Lymphoma. A non-Hodgkin lymphoma has para-aortic and mesenteric lymphadenopathy (arrows) along with splenomegally (arrowhead), on a contrast-enhanced, axial CT scan of the abdomen

Thank You.