presentation-embassy suites uno hotel
TRANSCRIPT
EMBASSY SUITE UNO HOTEL FINANCIAL PROPOSAL
April 2014
Howard Hao Li
Abudullah Algwaiz, Xinyan Wu
Wenqian Xu, Xiangdong Cao

AGENDA
Introduction
Site Analysis
Hotel Design, Brand, and Management
Financial Analysis

INTRODUCTION
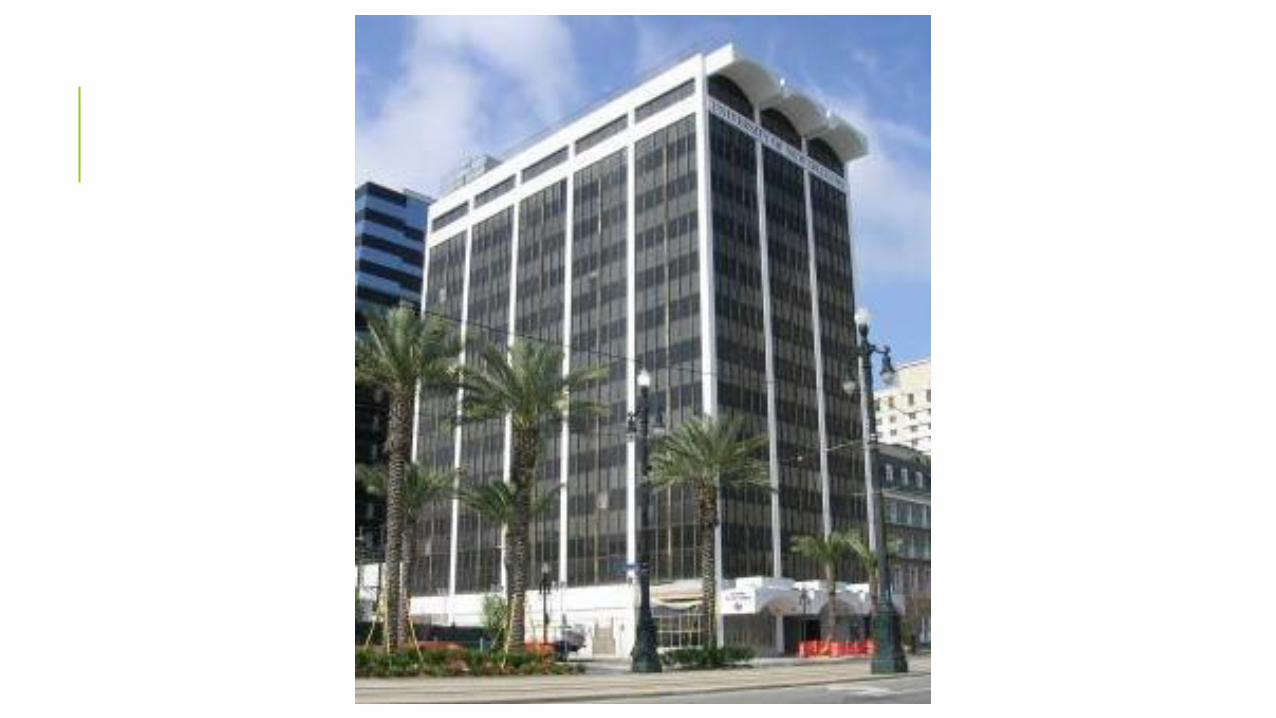
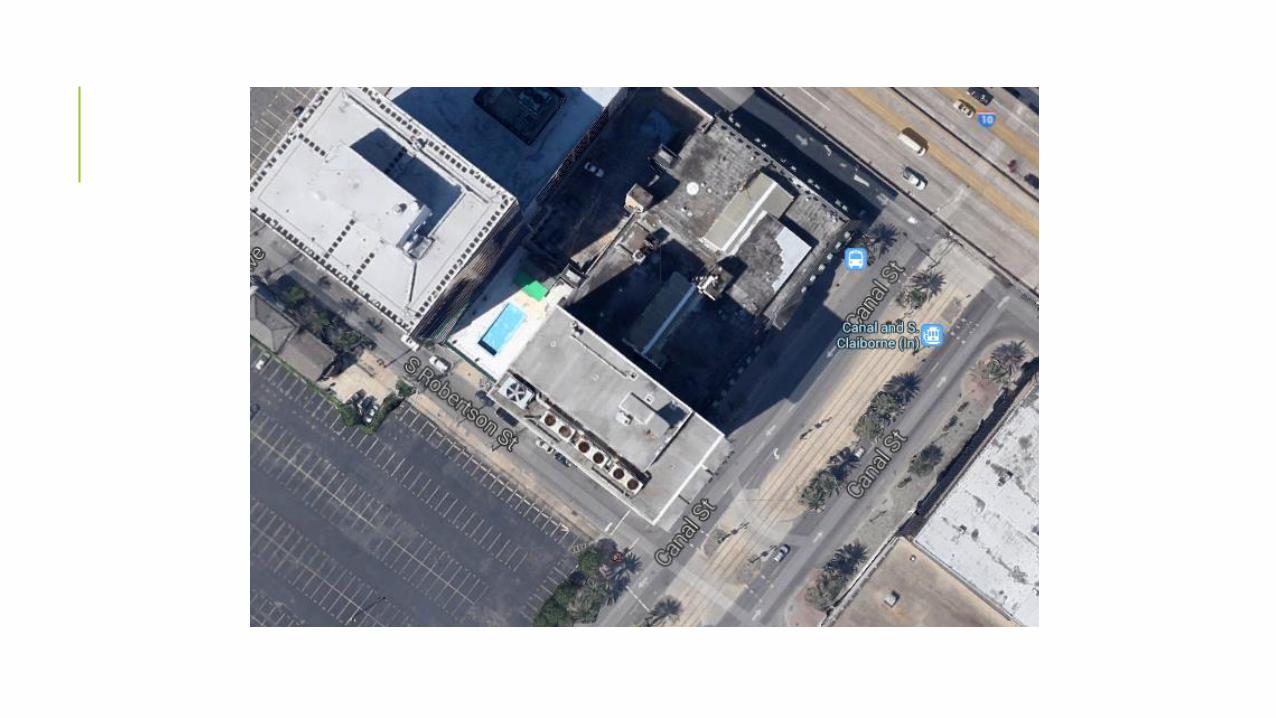
BUILDING INFORMATION
Built in 1960
Modern Architectural Style
Building Size: 111,141 Sq Ft.
Thirteen-Story
Net Rentable Area: 97,661 sq. ft.
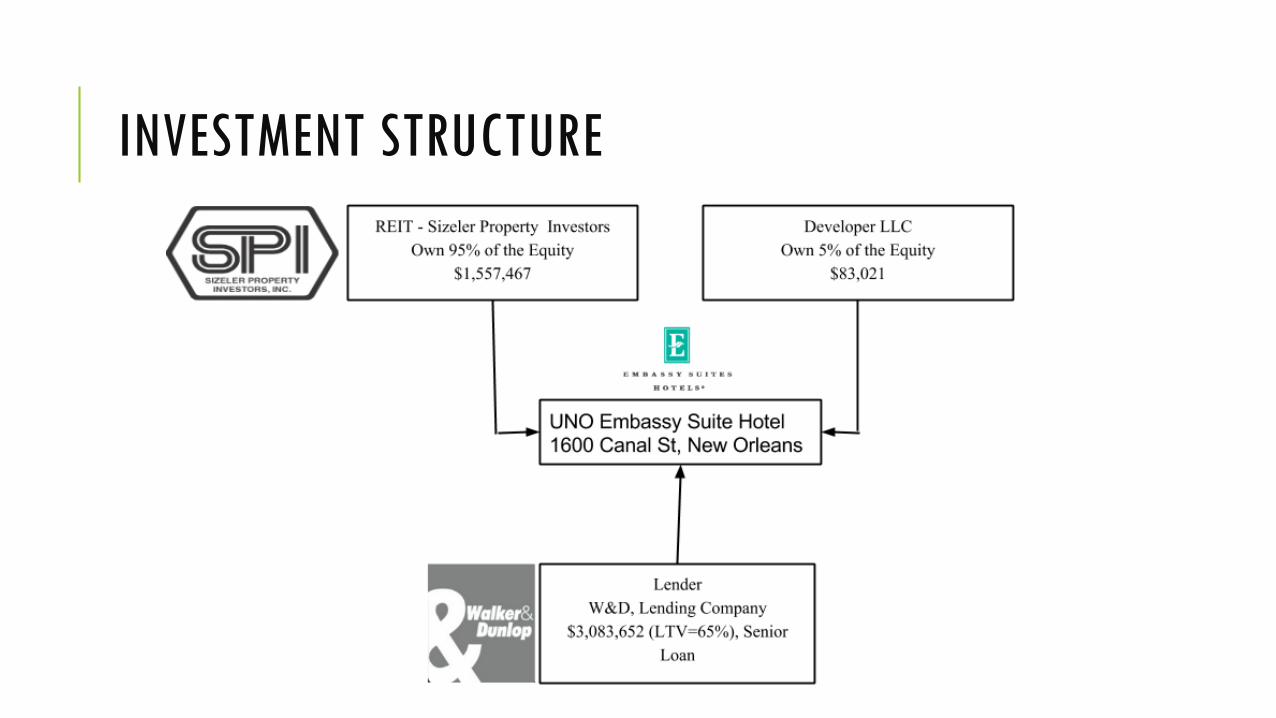
INVESTMENT STRUCTURE

SITE ANALYSIS
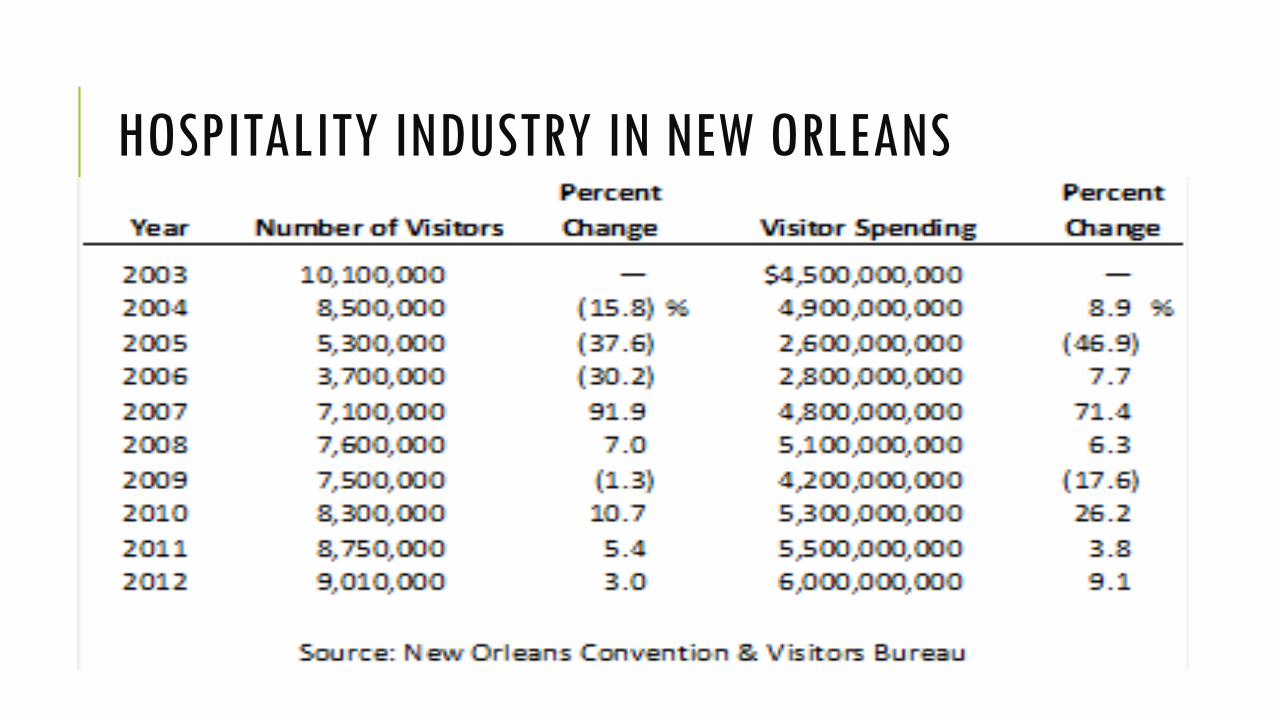
HOSPITALITY INDUSTRY IN NEW ORLEANS
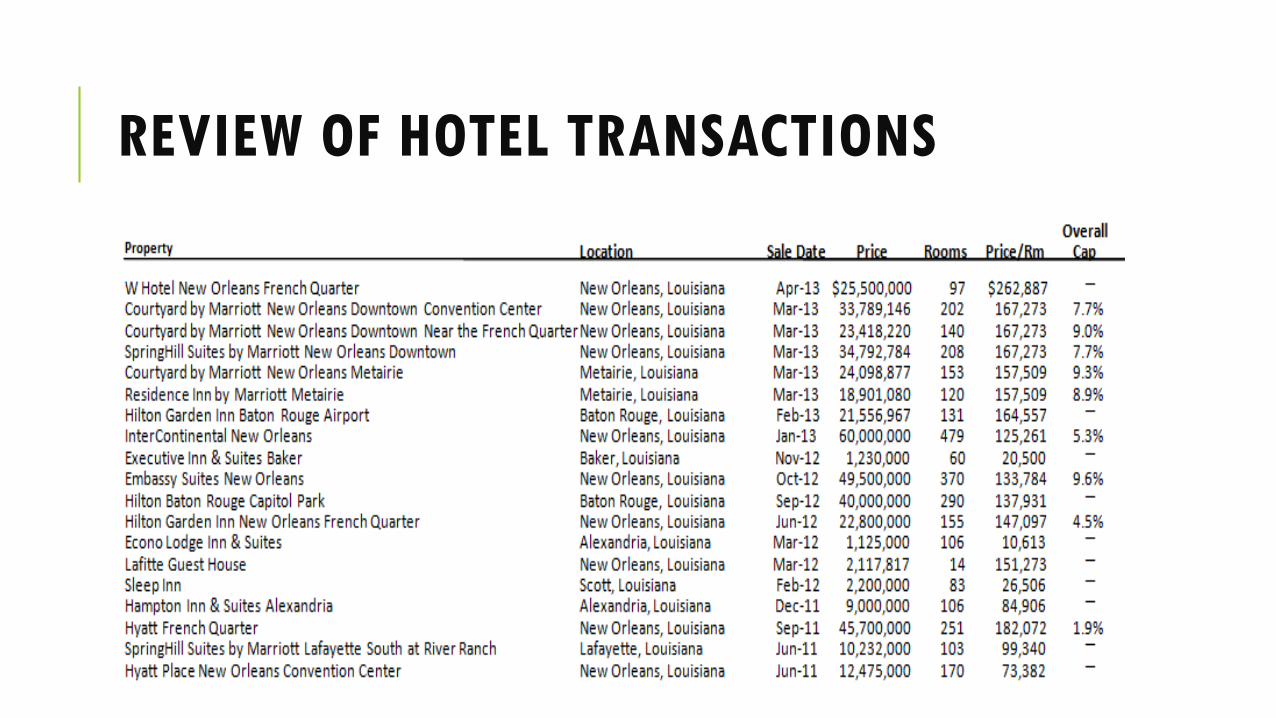
REVIEW OF HOTEL TRANSACTIONS
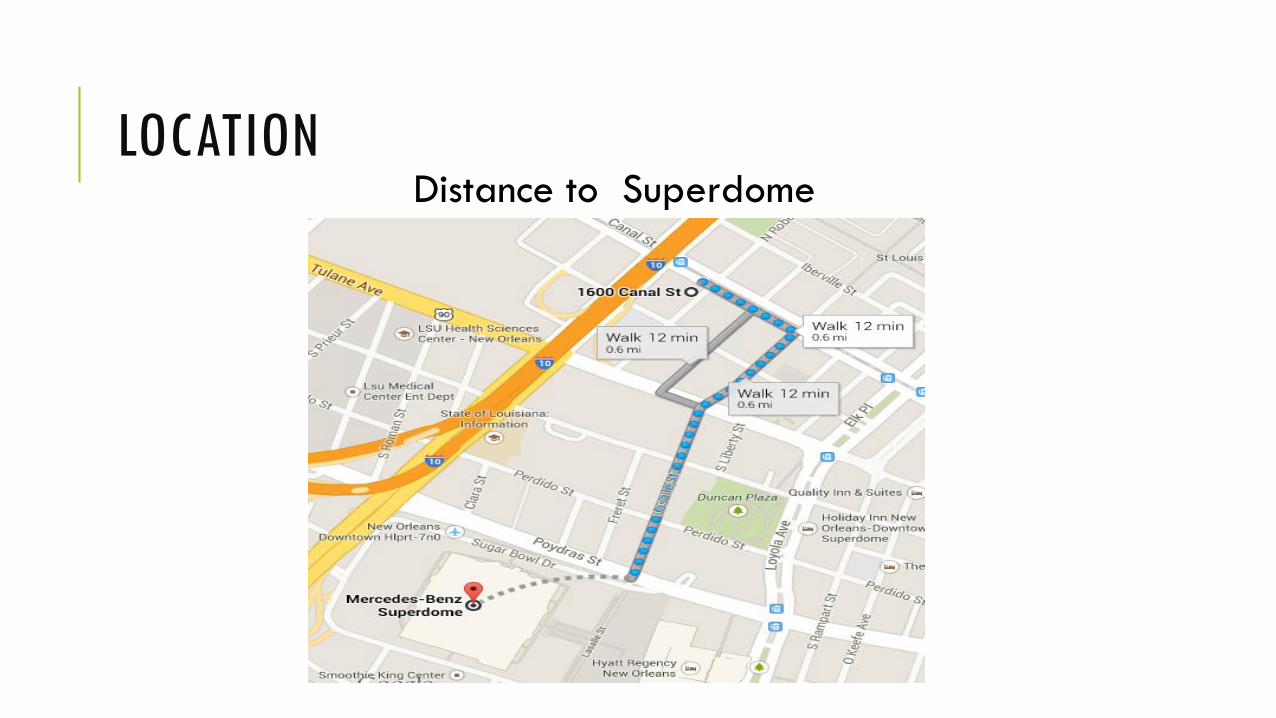
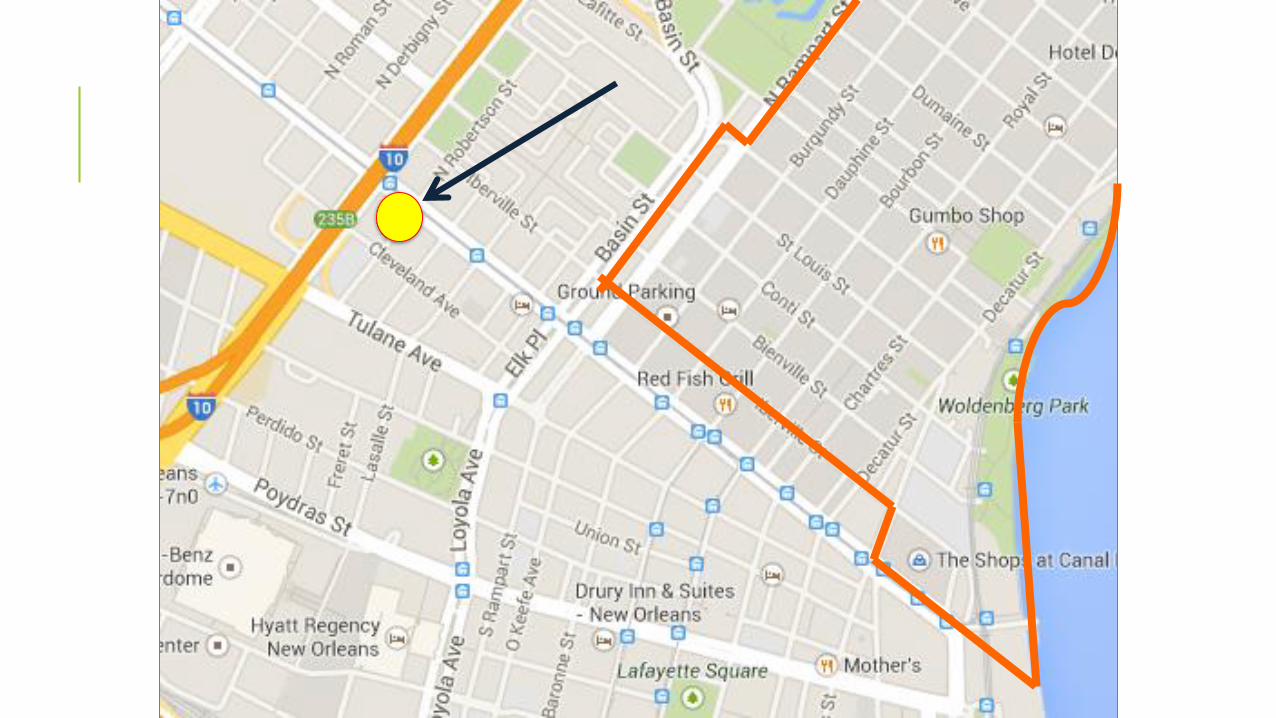
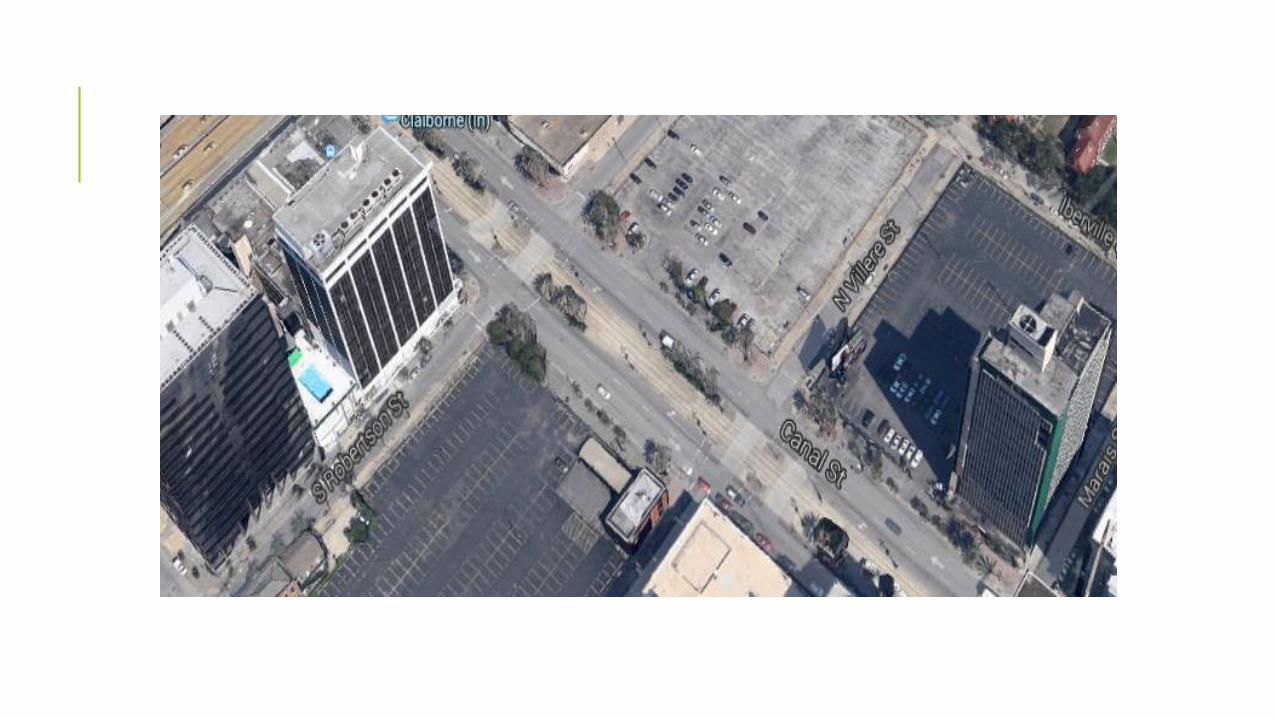
LOCATIONDistance to Superdome
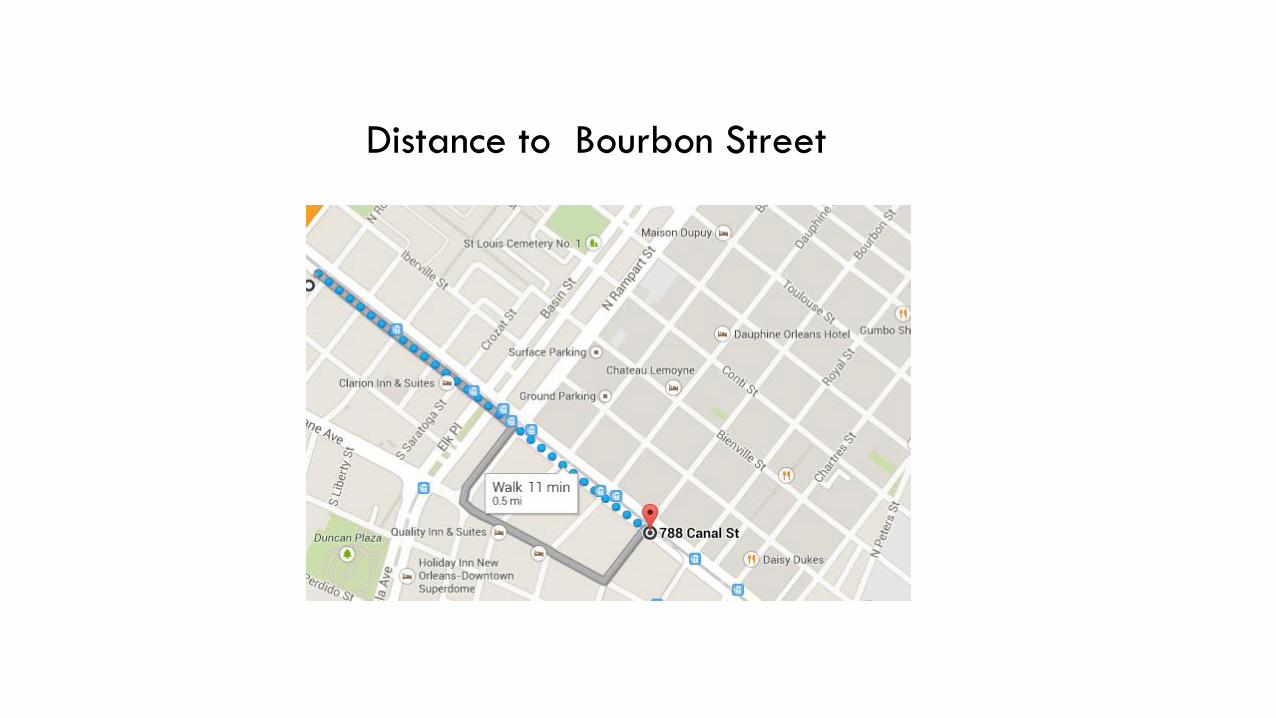
Distance to Bourbon Street

COMPARABLE PROJECTSHotel Name Stars Address Distance away
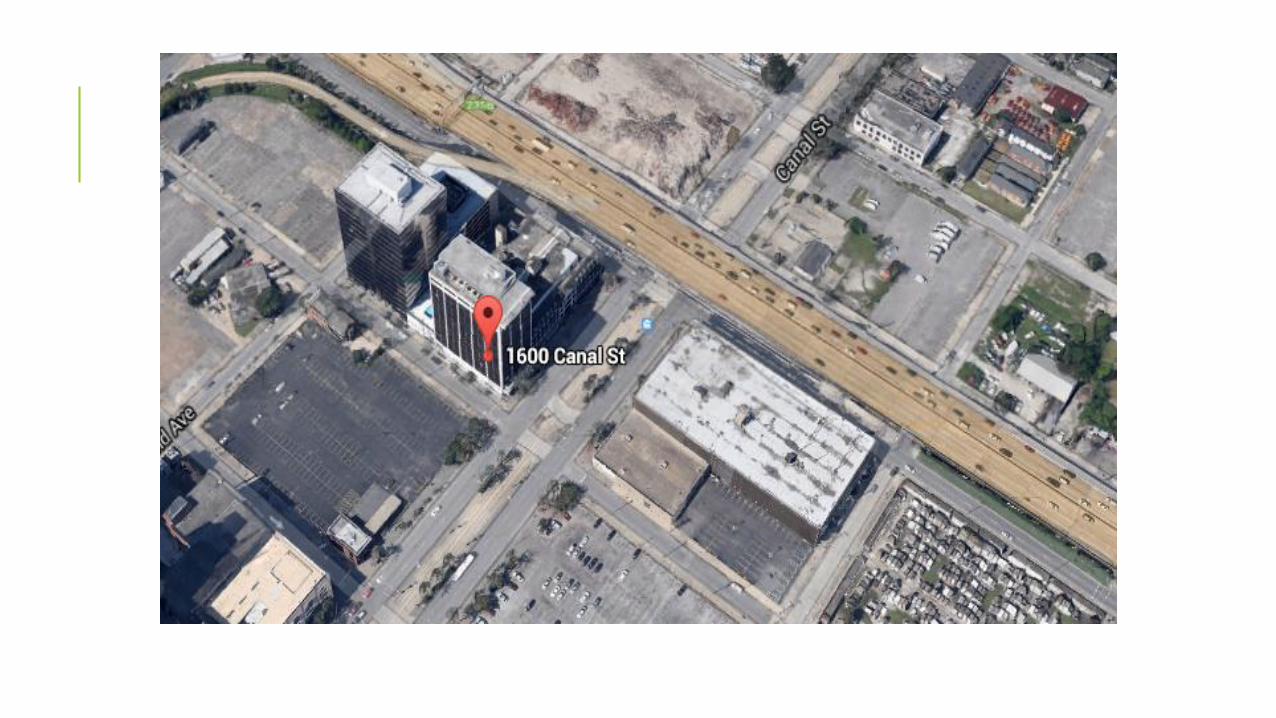
1600 Canal
Average
Daily Rate
Embassy Suites
New Orleans
3 Stars 315 Julia Street 1.5 miles 2-BD $180
1-BD $150
The
Saint Hotel Autograph
Collection
4 Stars 931 Canal Street 0.8 miles 2-BD $280
1-BD $220
The Roosevelt New
Orleans
4 Stars 130 Roosevelt way 0.5 miles 2-BD $330
1-BD $280
Wyndham Garden Hotel 3 Stars 201 Baronne Street 0.6 miles 2-BD $180
1-BD $130
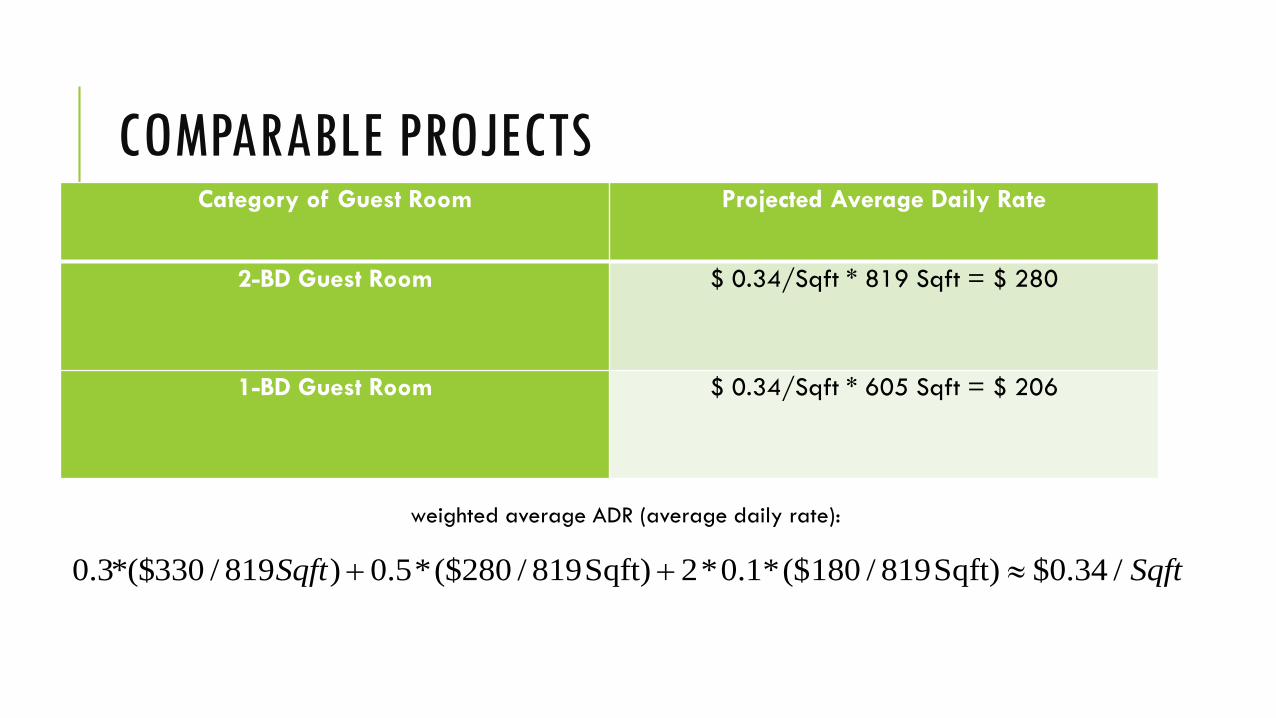
Category of Guest Room Projected Average Daily Rate
2-BD Guest Room $ 0.34/Sqft * 819 Sqft = $ 280
1-BD Guest Room $ 0.34/Sqft * 605 Sqft = $ 206
weighted average ADR (average daily rate):
0.3*($330 / 819 ) 0.5*($280 / 819Sqft) 2*0.1*($180 / 819Sqft) $0.34 /Sqft Sqft
COMPARABLE PROJECTS

HOTEL DESIGN, BRAND, AND MANAGEMENT
HOTEL DESIGN
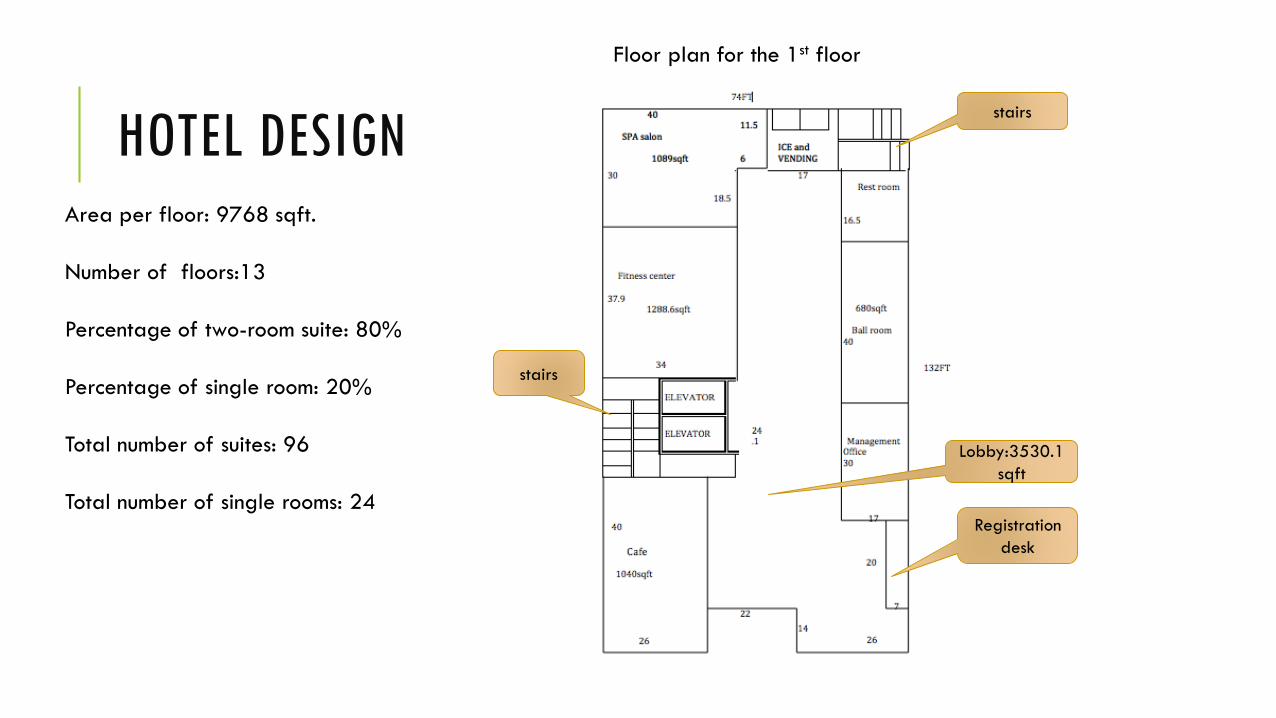
Floor plan for the 1st floor
Area per floor: 9768 sqft.
Number of floors:13
Percentage of two-room suite: 80%
Percentage of single room: 20%
Total number of suites: 96
Total number of single rooms: 24Registration
desk
stairs
stairs
Lobby:3530.1
sqft
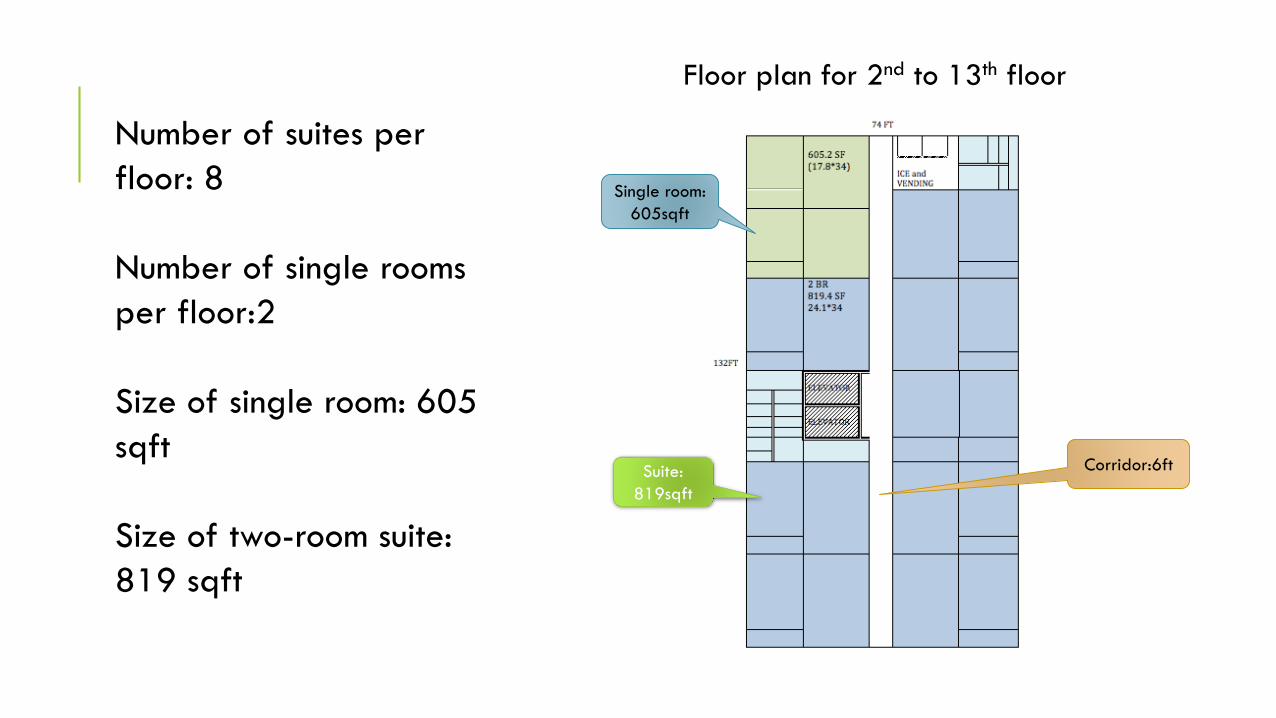
Number of suites per
floor: 8
Number of single rooms
per floor:2
Size of single room: 605
sqft
Size of two-room suite:
819 sqft
Floor plan for 2nd to 13th floor
Single room:
605sqft
Suite:
819sqft
Corridor:6ft

HOTEL BRANDING AND MANAGEMENT
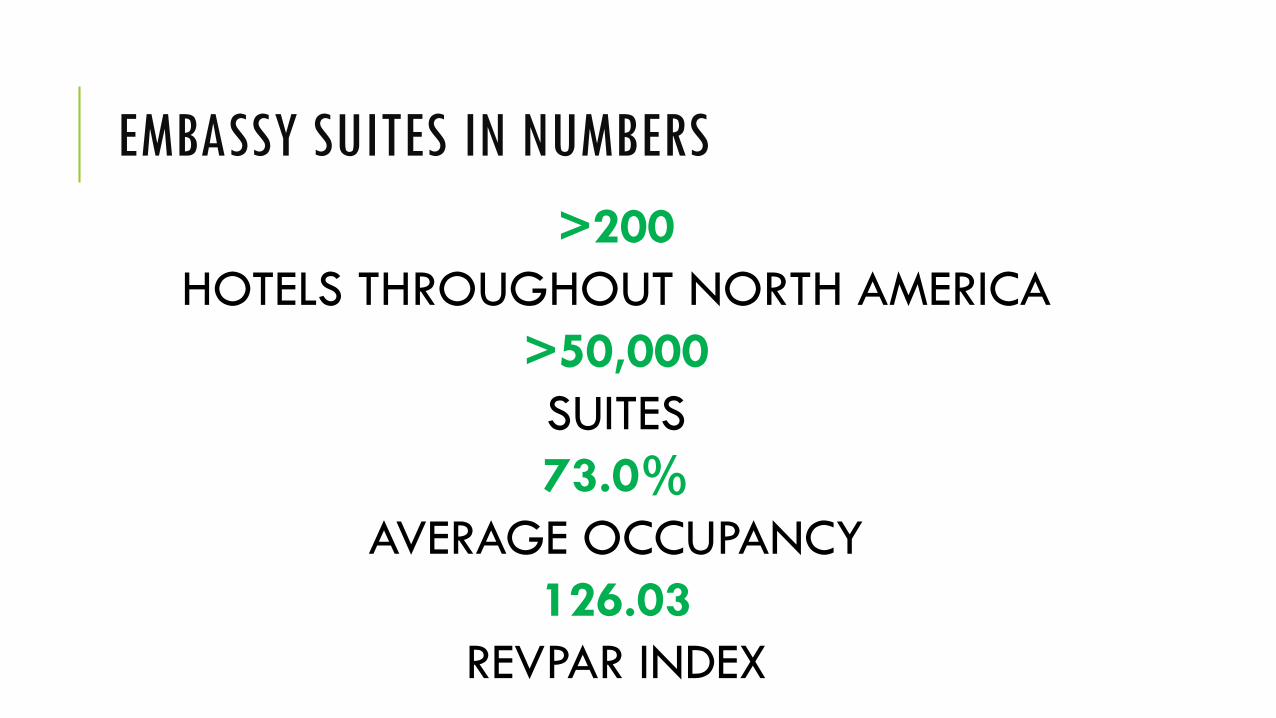
EMBASSY SUITES IN NUMBERS
>200
HOTELS THROUGHOUT NORTH AMERICA
>50,000
SUITES
73.0%
AVERAGE OCCUPANCY
126.03
REVPAR INDEX
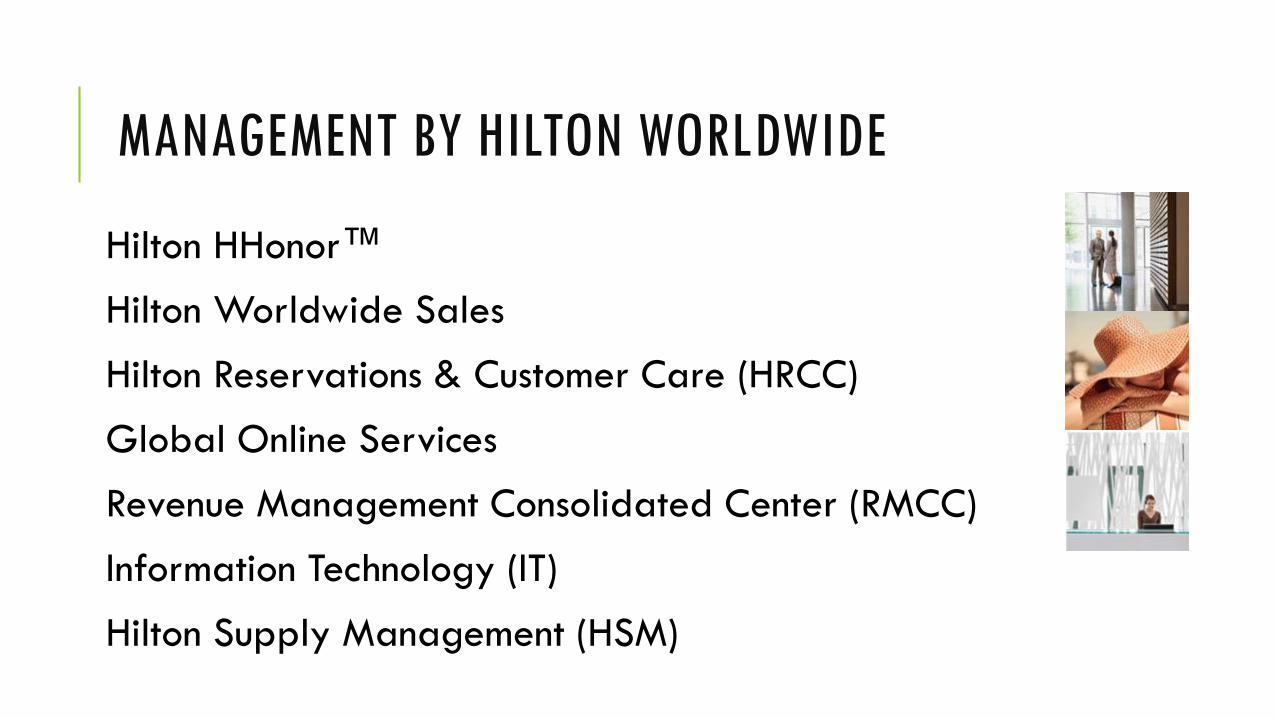
MANAGEMENT BY HILTON WORLDWIDE
Hilton HHonor™
Hilton Worldwide Sales
Hilton Reservations & Customer Care (HRCC)
Global Online Services
Revenue Management Consolidated Center (RMCC)
Information Technology (IT)
Hilton Supply Management (HSM)

MANAGEMENT FEE
Initial Fee 75000 plus $400 for each additional guest
suite over 250
OnQ
hardware
10000
OnQ
Software
100000
Monthly
Royalty Fee
3.5% for Year 1, 4.5% for year 2 and 5.5% for
the reminder of Gross Rooms Revenue
Monthly
Program Fee
4% of Gross Rooms Revenue
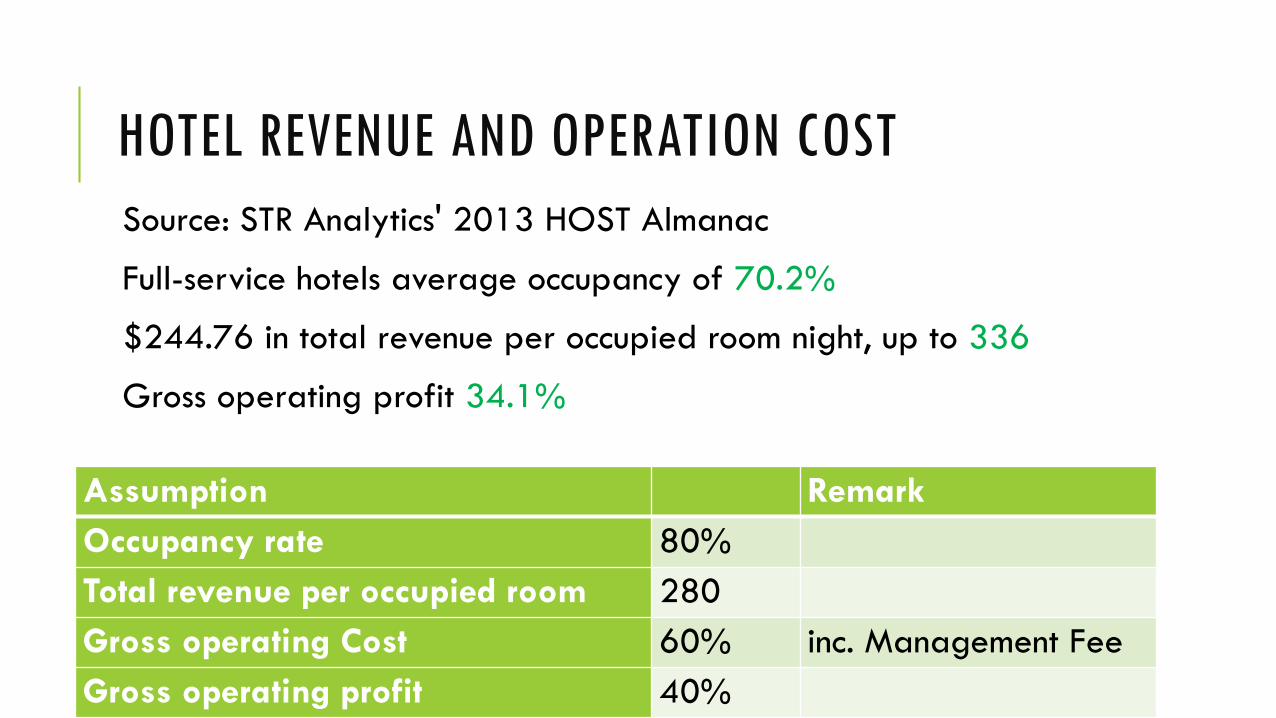
HOTEL REVENUE AND OPERATION COST
Source: STR Analytics' 2013 HOST Almanac
Full-service hotels average occupancy of 70.2%
$244.76 in total revenue per occupied room night, up to 336
Gross operating profit 34.1%
Assumption Remark
Occupancy rate 80%
Total revenue per occupied room 280
Gross operating Cost 60% inc. Management Fee
Gross operating profit 40%

FINANCIAL ANALYSIS
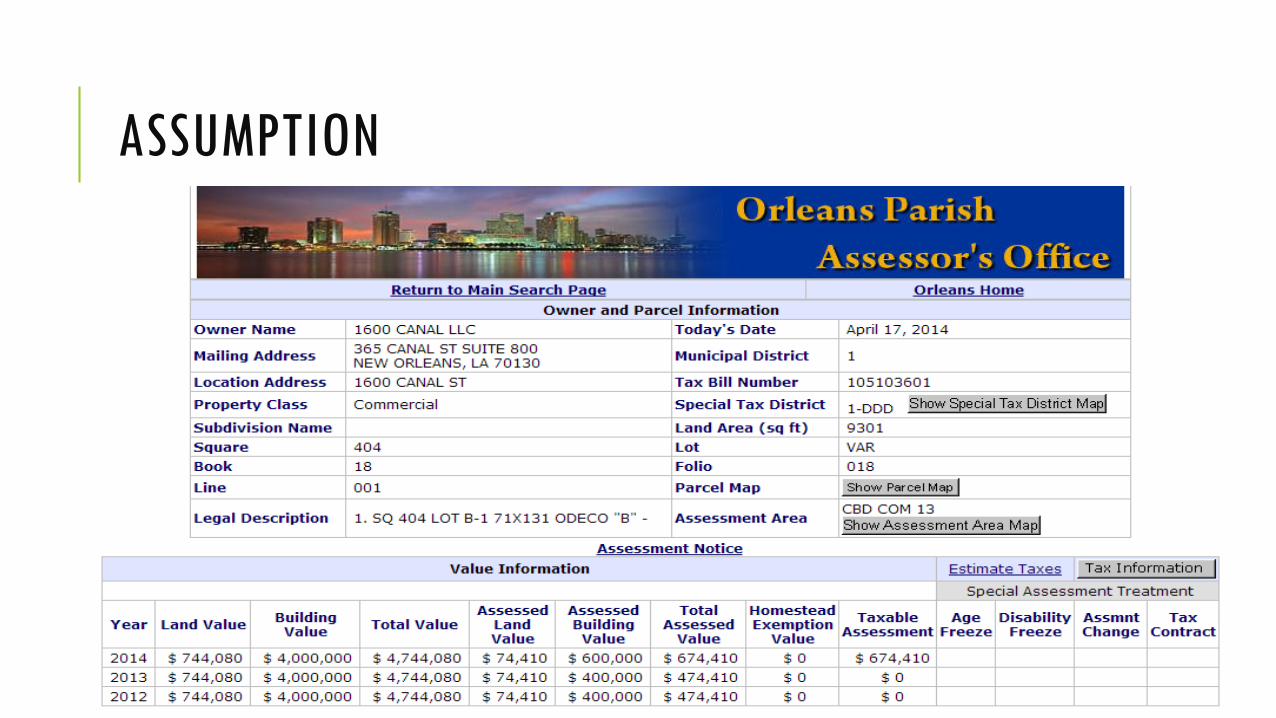
ASSUMPTION
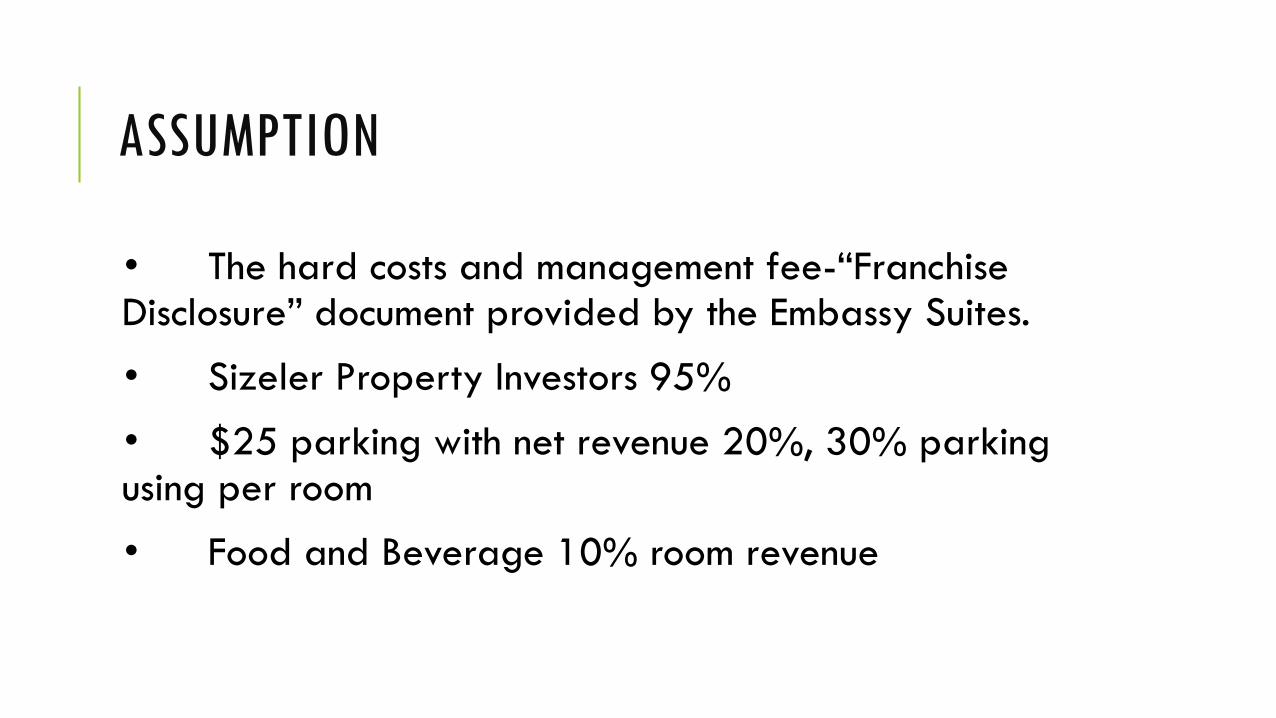
ASSUMPTION
• The hard costs and management fee-“Franchise Disclosure” document provided by the Embassy Suites.
• Sizeler Property Investors 95%
• $25 parking with net revenue 20%, 30% parking using per room
• Food and Beverage 10% room revenue
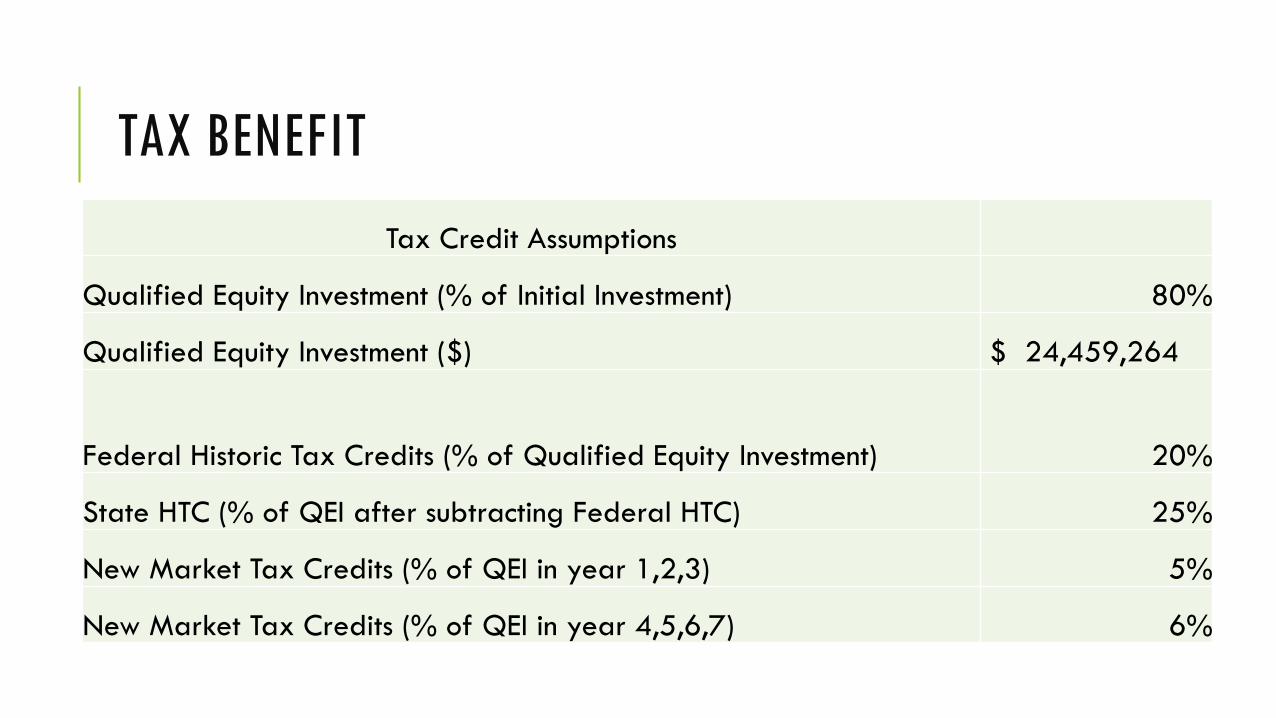
TAX BENEFIT
Tax Credit Assumptions
Qualified Equity Investment (% of Initial Investment) 80%
Qualified Equity Investment ($) $ 24,459,264
Federal Historic Tax Credits (% of Qualified Equity Investment) 20%
State HTC (% of QEI after subtracting Federal HTC) 25%
New Market Tax Credits (% of QEI in year 1,2,3) 5%
New Market Tax Credits (% of QEI in year 4,5,6,7) 6%

TAX BENEFIT
Tax Credits
Federal Historic Tax Credits $ 4,891,853
State Historic Tax Credits $ 4,891,853
New Market Tax Credits $ 1,222,963
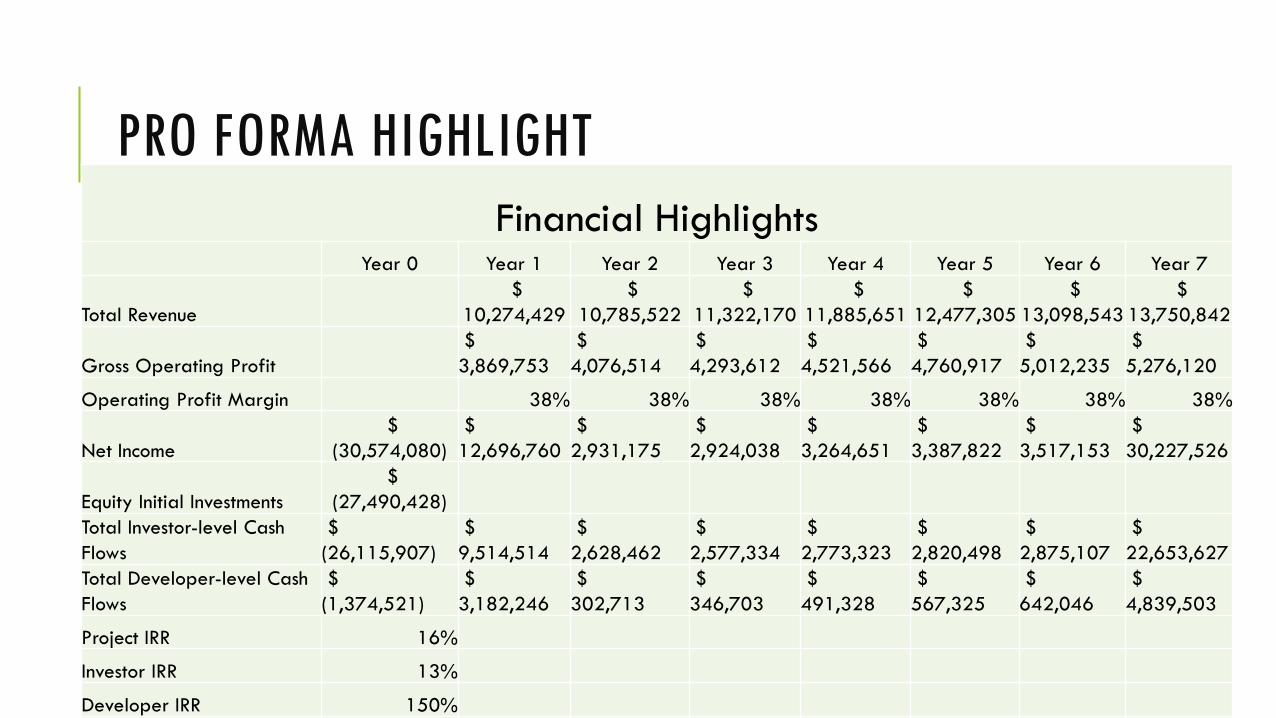
PRO FORMA HIGHLIGHT
Financial HighlightsYear 0 Year 1 Year 2 Year 3 Year 4 Year 5 Year 6 Year 7
Total Revenue
$
10,274,429
$
10,785,522
$
11,322,170
$
11,885,651
$
12,477,305
$
13,098,543
$
13,750,842
Gross Operating Profit
$
3,869,753
$
4,076,514
$
4,293,612
$
4,521,566
$
4,760,917
$
5,012,235
$
5,276,120
Operating Profit Margin 38% 38% 38% 38% 38% 38% 38%
Net Income
$
(30,574,080)
$
12,696,760
$
2,931,175
$
2,924,038
$
3,264,651
$
3,387,822
$
3,517,153
$
30,227,526
Equity Initial Investments
$
(27,490,428)
Total Investor-level Cash
Flows
$
(26,115,907)
$
9,514,514
$
2,628,462
$
2,577,334
$
2,773,323
$
2,820,498
$
2,875,107
$
22,653,627
Total Developer-level Cash
Flows
$
(1,374,521)
$
3,182,246
$
302,713
$
346,703
$
491,328
$
567,325
$
642,046
$
4,839,503
Project IRR 16%
Investor IRR 13%
Developer IRR 150%

THE END THANK YOU