presence of terrestrial atmospheric gas absorption bands in standard extraterrestrial solar...
TRANSCRIPT
Presence of terrestrial atmospheric gas absorptionbands in standardextraterrestrial solar irradiance curvesin the near-infrared spectral region
Bo-Cai Gao and Robert O. Green
The solar irradiance curves compiled by Wehrli 3Physikalisch-Meteorologisches Observatorium Publ. 6151World Radiation Center, Davosdorf, Switzerland, 198524 and by Neckel and Labs 3Sol. Phys. 90, 205 1198424are widely used. These curves were obtained based on measurements of solar radiation from the groundand from aircraft platforms. Contaminations in these curves by atmospheric gaseous absorptions wereinevitable. A technique for deriving the transmittance spectrum of the Sun’s atmosphere fromhigh-resolution 10.01 cm212 solar occultation spectra measured above the Earth’s atmosphere by the use ofatmospheric trace molecule spectroscopy 1ATMOS2 aboard the space shuttle is described. The compari-sons of the derived ATMOS solar transmittance spectrum with the two solar irradiance curves show thatthe curve derived by Wehrli contains many absorption features in the 2.0–2.5-µm region that are not ofsolar origin, whereas the curve obtained by Neckel and Labs is completely devoid of weak solar absorptionfeatures that should be there. An Earth atmospheric oxygen band at 1.268 µm and a water-vapor bandnear 0.94 µm are likely present in the curve obtained by Wehrli. It is shown that the solar irradiancemeasurement errors in some narrow spectral intervals can be as large as 20%. An improved solarirradiance spectrum is formed by the incorporation of the solar transmittance spectrum derived from theATMOS data into the solar irradiance spectrum from Neckel and Labs. The availability of a new solarspectrum from 50 to 50 000 cm21 from the U.S. Air Force Phillips Laboratory is also discussed. r 1995Optical Society of America.
1. Introduction
Over the past decade, imaging spectrometry has beenundergoing rapid development. Imaging spectrom-etry is defined as the acquisition of images over ascene in hundreds of contiguous spectral bands sothat it is possible to produce laboratorylike reflec-tance spectra for each picture element 1pixel2 in theimage.1 TheAirborne Visible Infrared Imaging Spec-trometer 1AVIRIS2,2 built at the NASA Jet Propul-sion Laboratory, has 224 10-nm channels covering the
When this research was performed, B.-C. Gao was with theUniversity Space Research Association, Code 913, NASA GoddardSpace Flight Center, Greenbelt, Maryland 20771. He is now withthe Joint Center for Earth System Science, Code 913, NASAGoddard Space Flight Center. R. O. Green is with the Jet Propul-sion Laboratory, 4800 Oak Grove Drive, Pasadena, California91109.Received 2March 1995; revisedmanuscript received 5April 1995.0003-6935@95@276263-06$06.00@0.
r 1995 Optical Society of America.
complete solar spectral region between 0.4 and 2.5µm. AVIRIS flies on an ER-2 aircraft at an altitudeof 20 km. It measures the upwelling spectral radi-ances that result from solar radiation being transmit-ted, scattered, and reflected from the atmosphere andthe Earth’s surface. These upward radiances con-tain characteristic absorption features of surface ma-terials. To make better studies of Earth’s surfaceproperties, the atmospheric absorption and scatteringeffects must be corrected and removed from theAVIRIS data so that surface-reflectance spectra arederived.3Initially, we used the well-known LOWTRAN74 and
MODTRAN5 programs for modeling atmospheric effectsand for deriving surface-reflectance spectra fromAVIRIS data. However, systematic differences werefound between retrieved reflectance spectra fromAVIRIS data and field-measured reflectance spectra.The retrieved spectra contained absorption featuresthat were absent in the field-measured spectra.After intensive investigations, it was concluded thatthe discrepancies did not result from errors in radio-
20 September 1995 @ Vol. 34, No. 27 @ APPLIED OPTICS 6263
metric and spectral calibrations of the AVIRIS instru-ment or from errors in the calculation of transmit-tances of atmospheric gases. Eventually, we beganto question the validity of the extraterrestrial solarirradiance spectrum used in both LOWTRAN7 andMODTRAN and started investigations of existing stan-dard solar irradiance curves.In this paper, we report that terrestrial atmo-
spheric gas absorption features are present in stan-dard extraterrestrial solar irradiance curves in thenear-IR spectral region. Section 2 describes brieflythe previousmeasurements of solar irradiance spectra.Section 3 presents our analysis of high-spectral-resolution data that was acquired above the Earth’satmosphere with the Fourier-transform spectrometerof the Atmospheric Trace Molecule Spectroscopy 1AT-MOS26 experiment during the Spacelab 3 Shuttlemission in the spring of 1985. This analysis yields atrue transmittance spectrum of the solar atmospherein the 2.08–2.5-µm region. Combining the solarirradiance spectrum of Neckel and Labs7 and thesolar transmittance spectrum fromATMOSdata formsan improved solar irradiance spectrum. Section 4describes our retrieval of surface-reflectance spectrathrough the use of the LOWTRAN7 and MODTRAN pro-grams with and without the inclusion of the improvedsolar spectrum in the two programs. Section 5 de-scribes the possible contamination by water vaporand oxygen bands of the LOWTRAN7 solar irradiancecurve between 0.8 and 1.4 µm. Discussions, includ-ing the availability of a new extraterrestrial solarirradiance spectrum that was developed at the U.S.Air Force Phillips Laboratory 1APL2, are given inSection 6. A brief summary is presented in Section7.
2. Previous Measurements of ExtraterrestrialSolar Spectra
The measurements of solar spectral irradiances havea long history.8 Before the mid 1960’s, extraterres-trial solar spectral irradiances were obtained mainlythrough ground-based measurements at different so-lar zenith angles in various locations around theworld. To get extraterrestrial solar irradiances, theclassic Langley method was used to extrapolate to thezero-air-mass condition. Because the ground-basedmeasurements were affected by water vapor andaerosols in the lower atmosphere, the accuracy of theextraterrestrial solar spectral irradiances was consid-ered to be poor.8In the late 1960’s, researchers from the NASA
Ames Research Center, the Jet Propulsion Laboratory1JPL2, and the Goddard Space Flight Center madeextensive measurements of solar spectral irradiancesthrough the use of several types of instruments froman aircraft platform at approximately 11 km. TheLangley method was also used to extrapolate themeasurements to extraterrestrial conditions. In ad-dition, Thekaekara9 described a standard extraterres-trial solar spectrum between 0.3 and 0.61 µm basedon the measurements obtained with the Goddard and
6264 APPLIED OPTICS @ Vol. 34, No. 27 @ 20 September 199
JPL instruments. Arvesen et al.8 reported anotherstandard extraterrestrial solar spectrum at a higherspectral resolution in the 0.3–2.5-µm region. At thattime, the authors realized that atmospheric carbondioxide above and within the aircraft contaminatedtheir data at 1.96, 2.01, and 2.06 µm. However,possibly because of the lack of line parameters ofatmospheric gases at the time, they did not realizethat atmospheric water vapor above and within theaircraft and oxygen, ozone, and methane above theaircraft could also contaminate their data at wave-lengths where these gases have absorption bands.Since the early 1980’s, two standard extraterres-
trial solar irradiance curves, one compiled byWehrli10and the other compiled by Neckel and Labs,7 havebeen widely used in the scientific community. Forexample, Kneizys et al.4 used part of the curve byWehrli in the LOWTRAN7 atmospheric transmittance–radiance program. Fouquart and Bonnel11 used thecurve from Neckel and Labs as the standard extrater-restrial solar irradiance curve during the interna-tional program of Intercomparison of Radiation CodesUsed in Climate Models. The Wehrli curve wasadopted by the World Meteorological Organization asa standard solar irradiance curve and was also recom-mended in a textbook on solar radiation by Iqbal.12This curve was compiled from a variety of sources.The curve between 1.2 and 2.5 µm can be traced to thesolar irradiance measurements by Arvesen et al.8The curve compiled by Neckel and Labs7 was based onground-level measurements at the Kitt PeakNationalObservatory in Tuscon, Arizona.Although the solar irradiance curves developed by
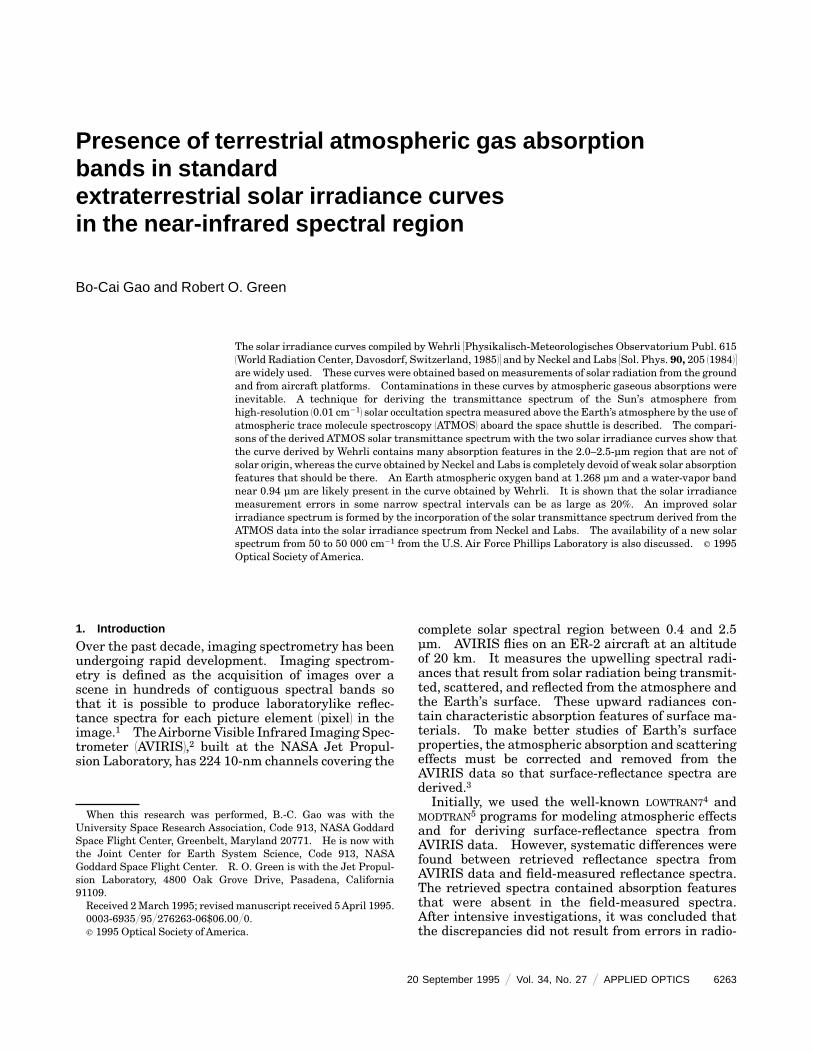
Wehrli and by Neckel and Labs have been accepted asstandard solar curves, large discrepancies still existbetween the two over-narrow spectral intervals.Figure 1 shows the two solar curves in the 2.0–2.5-µmregion. They differ by 10–20% at certain wave-lengths. The curve from Wehrli contains many ab-sorption features, whereas the curve from Neckel andLabs is completely devoid of them. To find outwhether the absorption features in the curve fromWehrli are of solar origin, we have studied the true
Fig. 1. Extraterrestrial solar irradiance curves between 2 and 2.5µm fromWehrli10 and from Neckel and Labs.7
5
solar absorption features from high-resolution 10.01cm212 solar occultation spectra acquired above theEarth’s atmosphere with the ATMOS instrument.
3. Atmospheric Trace Molecular Spectroscopy Data,Analysis, and Results
The ATMOS instrument is an advanced Fourier-transform spectrometer capable of obtaining spectralmeasurements over a wide wavelength range 12–16µm2 at high spectral resolution 10.01 cm212 with theSun as the radiation source.6 The instrument has nodevice for performing radiometric calibrations. TheATMOS instrument first flew on the Spacelab 3Shuttle mission in the spring of 1985. Both the puresolar spectra and the spectra of the Earth’s atmo-sphere were recorded at times close to the entry intoand exit from occultation by the Earth’s limb, as seenfrom a shuttle orbit of 360 km.13 These spectra havebeen published in a two-volume atlas14 for quick-lookreference purposes; the data are also available indigital format.Because individual solar lines are completely re-
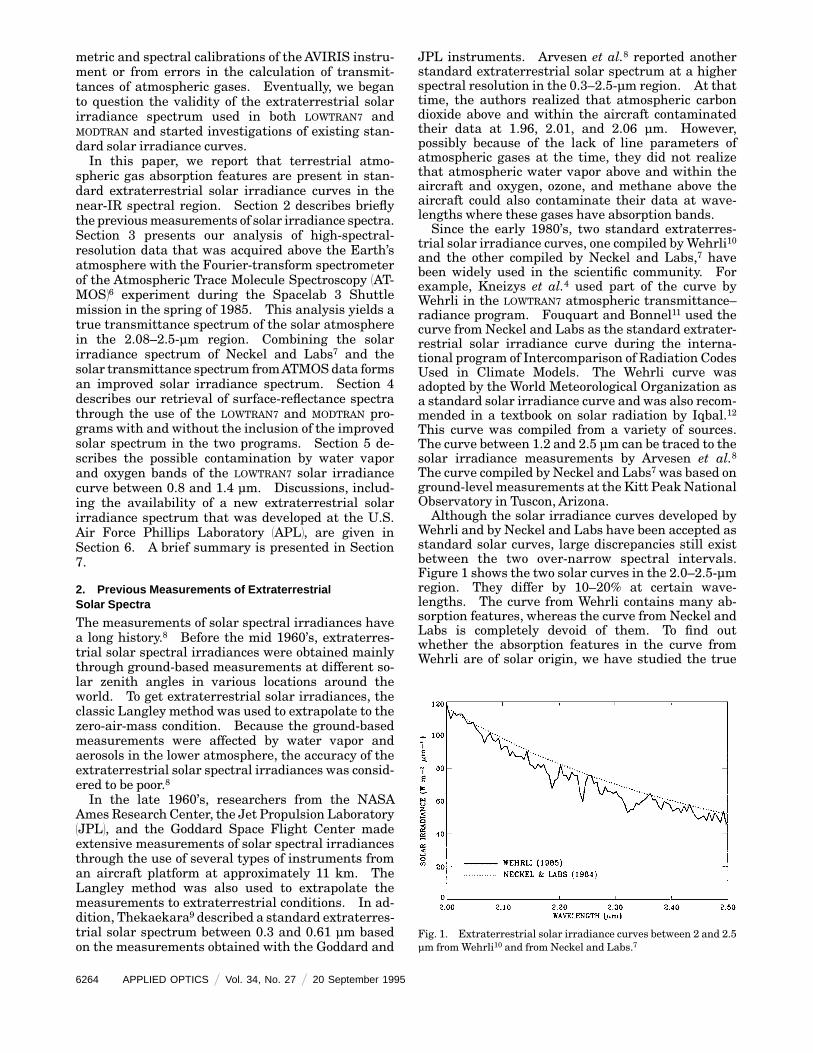
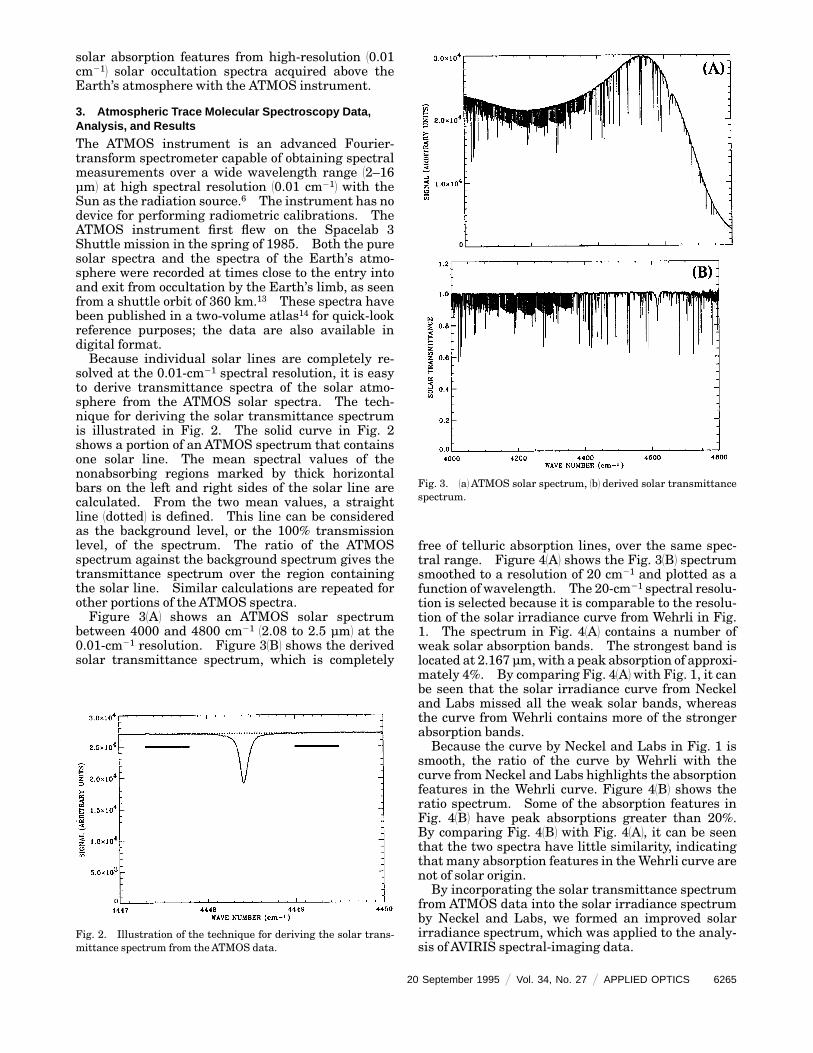
solved at the 0.01-cm21 spectral resolution, it is easyto derive transmittance spectra of the solar atmo-sphere from the ATMOS solar spectra. The tech-nique for deriving the solar transmittance spectrumis illustrated in Fig. 2. The solid curve in Fig. 2shows a portion of an ATMOS spectrum that containsone solar line. The mean spectral values of thenonabsorbing regions marked by thick horizontalbars on the left and right sides of the solar line arecalculated. From the two mean values, a straightline 1dotted2 is defined. This line can be consideredas the background level, or the 100% transmissionlevel, of the spectrum. The ratio of the ATMOSspectrum against the background spectrum gives thetransmittance spectrum over the region containingthe solar line. Similar calculations are repeated forother portions of theATMOS spectra.Figure 31A2 shows an ATMOS solar spectrum
between 4000 and 4800 cm21 12.08 to 2.5 µm2 at the0.01-cm21 resolution. Figure 31B2 shows the derivedsolar transmittance spectrum, which is completely
Fig. 2. Illustration of the technique for deriving the solar trans-mittance spectrum from theATMOS data.
2
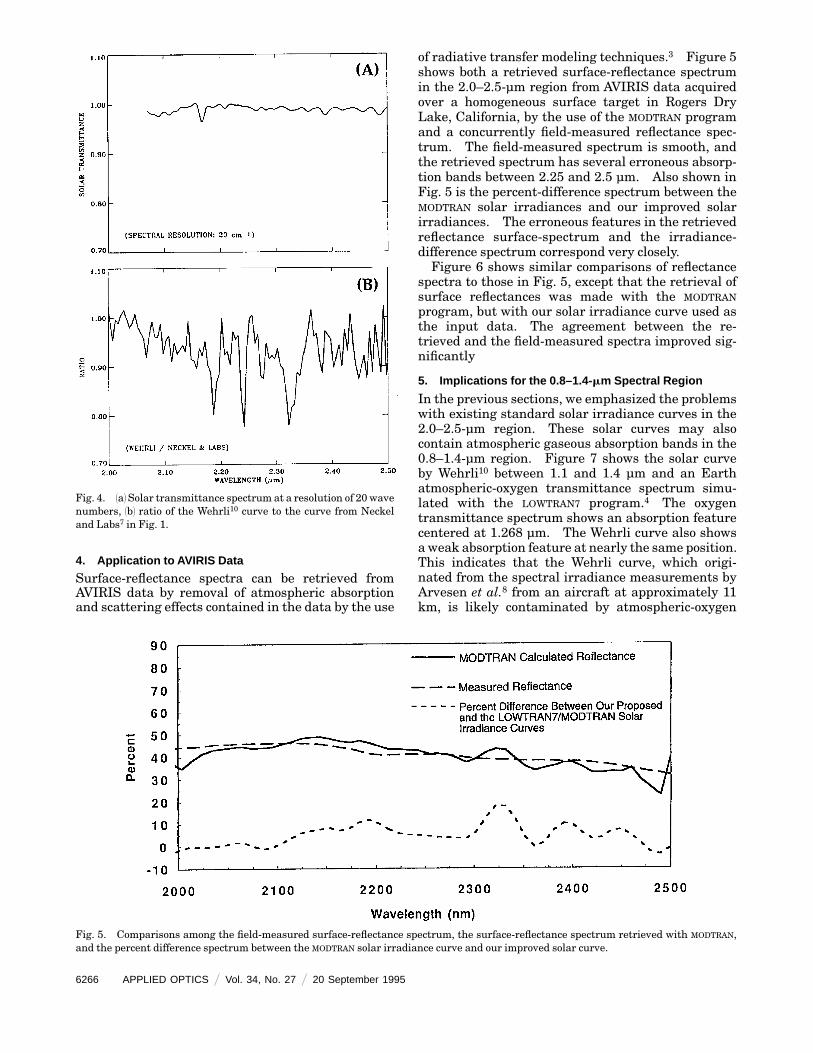
free of telluric absorption lines, over the same spec-tral range. Figure 41A2 shows the Fig. 31B2 spectrumsmoothed to a resolution of 20 cm21 and plotted as afunction of wavelength. The 20-cm21 spectral resolu-tion is selected because it is comparable to the resolu-tion of the solar irradiance curve from Wehrli in Fig.1. The spectrum in Fig. 41A2 contains a number ofweak solar absorption bands. The strongest band islocated at 2.167 µm,with a peak absorption of approxi-mately 4%. By comparing Fig. 41A2with Fig. 1, it canbe seen that the solar irradiance curve from Neckeland Labs missed all the weak solar bands, whereasthe curve from Wehrli contains more of the strongerabsorption bands.Because the curve by Neckel and Labs in Fig. 1 is
smooth, the ratio of the curve by Wehrli with thecurve fromNeckel and Labs highlights the absorptionfeatures in the Wehrli curve. Figure 41B2 shows theratio spectrum. Some of the absorption features inFig. 41B2 have peak absorptions greater than 20%.By comparing Fig. 41B2 with Fig. 41A2, it can be seenthat the two spectra have little similarity, indicatingthat many absorption features in theWehrli curve arenot of solar origin.By incorporating the solar transmittance spectrum
from ATMOS data into the solar irradiance spectrumby Neckel and Labs, we formed an improved solarirradiance spectrum, which was applied to the analy-sis of AVIRIS spectral-imaging data.
Fig. 3. 1a2ATMOS solar spectrum, 1b2 derived solar transmittancespectrum.
0 September 1995 @ Vol. 34, No. 27 @ APPLIED OPTICS 6265
4. Application to AVIRIS Data
Surface-reflectance spectra can be retrieved fromAVIRIS data by removal of atmospheric absorptionand scattering effects contained in the data by the use
Fig. 4. 1a2 Solar transmittance spectrum at a resolution of 20 wavenumbers, 1b2 ratio of the Wehrli10 curve to the curve from Neckeland Labs7 in Fig. 1.
6266 APPLIED OPTICS @ Vol. 34, No. 27 @ 20 September 1995
of radiative transfer modeling techniques.3 Figure 5shows both a retrieved surface-reflectance spectrumin the 2.0–2.5-µm region from AVIRIS data acquiredover a homogeneous surface target in Rogers DryLake, California, by the use of the MODTRAN programand a concurrently field-measured reflectance spec-trum. The field-measured spectrum is smooth, andthe retrieved spectrum has several erroneous absorp-tion bands between 2.25 and 2.5 µm. Also shown inFig. 5 is the percent-difference spectrum between theMODTRAN solar irradiances and our improved solarirradiances. The erroneous features in the retrievedreflectance surface-spectrum and the irradiance-difference spectrum correspond very closely.Figure 6 shows similar comparisons of reflectance
spectra to those in Fig. 5, except that the retrieval ofsurface reflectances was made with the MODTRAN
program, but with our solar irradiance curve used asthe input data. The agreement between the re-trieved and the field-measured spectra improved sig-nificantly
5. Implications for the 0.8–1.4- mm Spectral Region
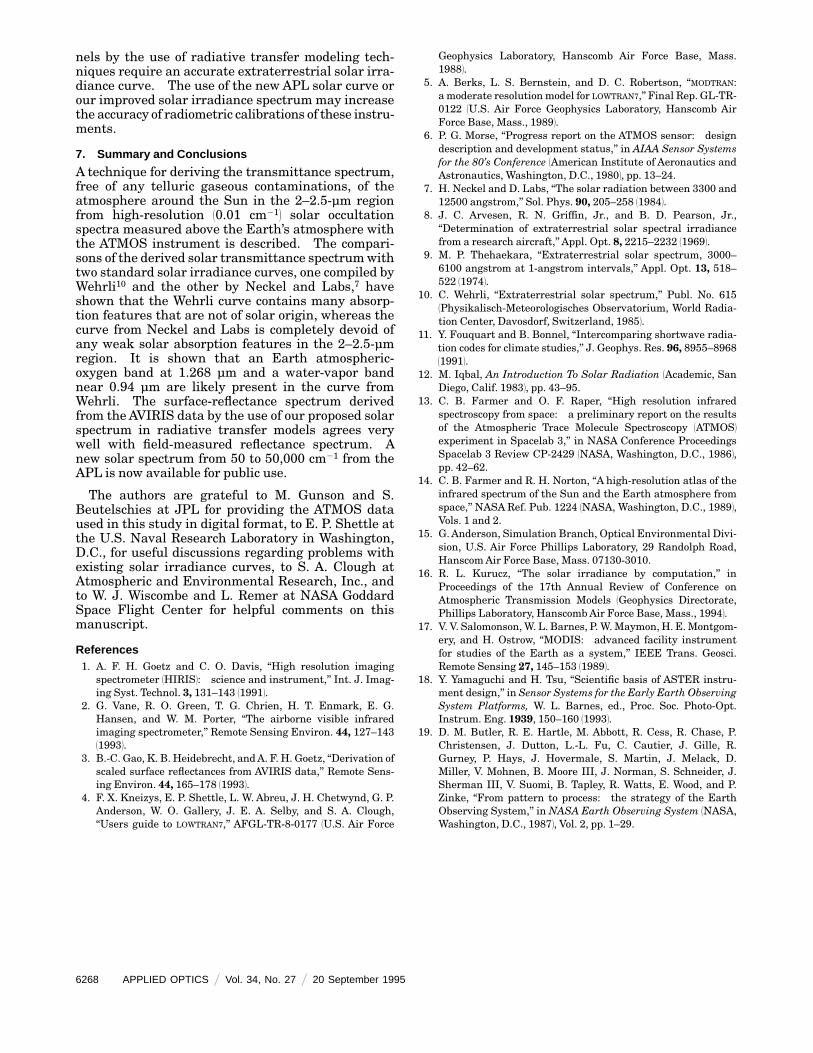
In the previous sections, we emphasized the problemswith existing standard solar irradiance curves in the2.0–2.5-µm region. These solar curves may alsocontain atmospheric gaseous absorption bands in the0.8–1.4-µm region. Figure 7 shows the solar curveby Wehrli10 between 1.1 and 1.4 µm and an Earthatmospheric-oxygen transmittance spectrum simu-lated with the LOWTRAN7 program.4 The oxygentransmittance spectrum shows an absorption featurecentered at 1.268 µm. The Wehrli curve also showsaweak absorption feature at nearly the same position.This indicates that the Wehrli curve, which origi-nated from the spectral irradiance measurements byArvesen et al.8 from an aircraft at approximately 11km, is likely contaminated by atmospheric-oxygen
Fig. 5. Comparisons among the field-measured surface-reflectance spectrum, the surface-reflectance spectrum retrieved with MODTRAN,and the percent difference spectrum between the MODTRAN solar irradiance curve and our improved solar curve.
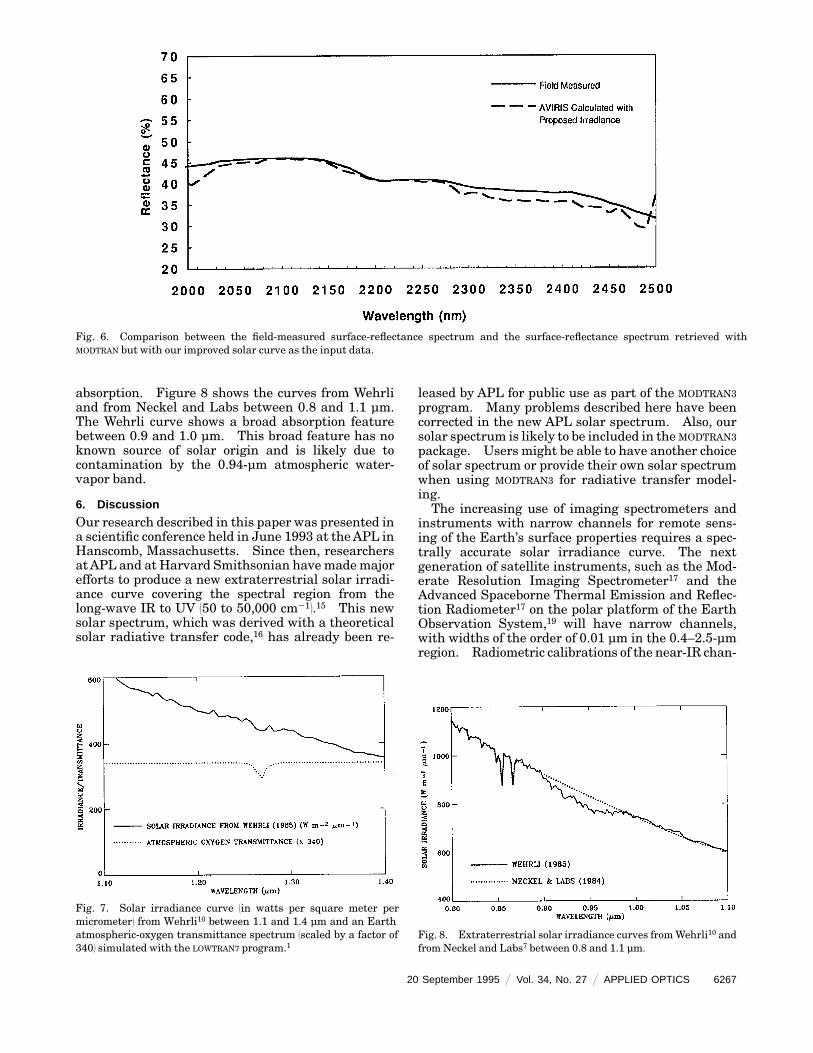
Fig. 6. Comparison between the field-measured surface-reflectance spectrum and the surface-reflectance spectrum retrieved withMODTRAN but with our improved solar curve as the input data.
absorption. Figure 8 shows the curves from Wehrliand from Neckel and Labs between 0.8 and 1.1 µm.The Wehrli curve shows a broad absorption featurebetween 0.9 and 1.0 µm. This broad feature has noknown source of solar origin and is likely due tocontamination by the 0.94-µm atmospheric water-vapor band.
6. Discussion
Our research described in this paper was presented ina scientific conference held in June 1993 at theAPL inHanscomb, Massachusetts. Since then, researchersatAPL and at Harvard Smithsonian havemademajorefforts to produce a new extraterrestrial solar irradi-ance curve covering the spectral region from thelong-wave IR to UV 150 to 50,000 cm212.15 This newsolar spectrum, which was derived with a theoreticalsolar radiative transfer code,16 has already been re-
Fig. 7. Solar irradiance curve 1in watts per square meter permicrometer2 from Wehrli10 between 1.1 and 1.4 µm and an Earthatmospheric-oxygen transmittance spectrum 1scaled by a factor of3402 simulated with the LOWTRAN7 program.1
leased by APL for public use as part of the MODTRAN3program. Many problems described here have beencorrected in the new APL solar spectrum. Also, oursolar spectrum is likely to be included in the MODTRAN3package. Users might be able to have another choiceof solar spectrum or provide their own solar spectrumwhen using MODTRAN3 for radiative transfer model-ing.The increasing use of imaging spectrometers and
instruments with narrow channels for remote sens-ing of the Earth’s surface properties requires a spec-trally accurate solar irradiance curve. The nextgeneration of satellite instruments, such as the Mod-erate Resolution Imaging Spectrometer17 and theAdvanced Spaceborne Thermal Emission and Reflec-tion Radiometer17 on the polar platform of the EarthObservation System,19 will have narrow channels,with widths of the order of 0.01 µm in the 0.4–2.5-µmregion. Radiometric calibrations of the near-IR chan-
Fig. 8. Extraterrestrial solar irradiance curves fromWehrli10 andfrom Neckel and Labs7 between 0.8 and 1.1 µm.
20 September 1995 @ Vol. 34, No. 27 @ APPLIED OPTICS 6267
nels by the use of radiative transfer modeling tech-niques require an accurate extraterrestrial solar irra-diance curve. The use of the new APL solar curve orour improved solar irradiance spectrummay increasethe accuracy of radiometric calibrations of these instru-ments.
7. Summary and Conclusions
A technique for deriving the transmittance spectrum,free of any telluric gaseous contaminations, of theatmosphere around the Sun in the 2–2.5-µm regionfrom high-resolution 10.01 cm212 solar occultationspectra measured above the Earth’s atmosphere withthe ATMOS instrument is described. The compari-sons of the derived solar transmittance spectrumwithtwo standard solar irradiance curves, one compiled byWehrli10 and the other by Neckel and Labs,7 haveshown that the Wehrli curve contains many absorp-tion features that are not of solar origin, whereas thecurve from Neckel and Labs is completely devoid ofany weak solar absorption features in the 2–2.5-µmregion. It is shown that an Earth atmospheric-oxygen band at 1.268 µm and a water-vapor bandnear 0.94 µm are likely present in the curve fromWehrli. The surface-reflectance spectrum derivedfrom theAVIRIS data by the use of our proposed solarspectrum in radiative transfer models agrees verywell with field-measured reflectance spectrum. Anew solar spectrum from 50 to 50,000 cm21 from theAPL is now available for public use.
The authors are grateful to M. Gunson and S.Beutelschies at JPL for providing the ATMOS dataused in this study in digital format, to E. P. Shettle atthe U.S. Naval Research Laboratory in Washington,D.C., for useful discussions regarding problems withexisting solar irradiance curves, to S. A. Clough atAtmospheric and Environmental Research, Inc., andto W. J. Wiscombe and L. Remer at NASA GoddardSpace Flight Center for helpful comments on thismanuscript.
References1. A. F. H. Goetz and C. O. Davis, ‘‘High resolution imaging
spectrometer 1HIRIS2: science and instrument,’’ Int. J. Imag-ing Syst. Technol. 3, 131–143 119912.
2. G. Vane, R. O. Green, T. G. Chrien, H. T. Enmark, E. G.Hansen, and W. M. Porter, ‘‘The airborne visible infraredimaging spectrometer,’’ Remote Sensing Environ. 44, 127–143119932.
3. B.-C. Gao, K. B. Heidebrecht, andA. F. H. Goetz, ‘‘Derivation ofscaled surface reflectances from AVIRIS data,’’ Remote Sens-ing Environ. 44, 165–178 119932.
4. F. X. Kneizys, E. P. Shettle, L. W. Abreu, J. H. Chetwynd, G. P.Anderson, W. O. Gallery, J. E. A. Selby, and S. A. Clough,‘‘Users guide to LOWTRAN7,’’ AFGL-TR-8-0177 1U.S. Air Force
6268 APPLIED OPTICS @ Vol. 34, No. 27 @ 20 September 1995
Geophysics Laboratory, Hanscomb Air Force Base, Mass.19882.
5. A. Berks, L. S. Bernstein, and D. C. Robertson, ‘‘MODTRAN:amoderate resolutionmodel for LOWTRAN7,’’ Final Rep. GL-TR-0122 1U.S. Air Force Geophysics Laboratory, Hanscomb AirForce Base, Mass., 19892.
6. P. G. Morse, ‘‘Progress report on the ATMOS sensor: designdescription and development status,’’ in AIAA Sensor Systemsfor the 80’s Conference 1American Institute of Aeronautics andAstronautics, Washington, D.C., 19802, pp. 13–24.
7. H. Neckel and D. Labs, ‘‘The solar radiation between 3300 and12500 angstrom,’’ Sol. Phys. 90, 205–258 119842.
8. J. C. Arvesen, R. N. Griffin, Jr., and B. D. Pearson, Jr.,‘‘Determination of extraterrestrial solar spectral irradiancefrom a research aircraft,’’ Appl. Opt. 8, 2215–2232 119692.
9. M. P. Thehaekara, ‘‘Extraterrestrial solar spectrum, 3000–6100 angstrom at 1-angstrom intervals,’’ Appl. Opt. 13, 518–522 119742.
10. C. Wehrli, ‘‘Extraterrestrial solar spectrum,’’ Publ. No. 6151Physikalisch-Meteorologisches Observatorium, World Radia-tion Center, Davosdorf, Switzerland, 19852.
11. Y. Fouquart and B. Bonnel, ‘‘Intercomparing shortwave radia-tion codes for climate studies,’’ J. Geophys. Res. 96, 8955–8968119912.
12. M. Iqbal, An Introduction To Solar Radiation 1Academic, SanDiego, Calif. 19832, pp. 43–95.
13. C. B. Farmer and O. F. Raper, ‘‘High resolution infraredspectroscopy from space: a preliminary report on the resultsof the Atmospheric Trace Molecule Spectroscopy 1ATMOS2experiment in Spacelab 3,’’ in NASA Conference ProceedingsSpacelab 3 Review CP-2429 1NASA, Washington, D.C., 19862,pp. 42–62.
14. C. B. Farmer and R. H. Norton, ‘‘A high-resolution atlas of theinfrared spectrum of the Sun and the Earth atmosphere fromspace,’’ NASARef. Pub. 1224 1NASA, Washington, D.C., 19892,Vols. 1 and 2.
15. G.Anderson, Simulation Branch, Optical Environmental Divi-sion, U.S. Air Force Phillips Laboratory, 29 Randolph Road,HanscomAir Force Base, Mass. 07130-3010.
16. R. L. Kurucz, ‘‘The solar irradiance by computation,’’ inProceedings of the 17th Annual Review of Conference onAtmospheric Transmission Models 1Geophysics Directorate,Phillips Laboratory, HanscombAir Force Base, Mass., 19942.
17. V. V. Salomonson,W. L. Barnes, P.W.Maymon, H. E.Montgom-ery, and H. Ostrow, ‘‘MODIS: advanced facility instrumentfor studies of the Earth as a system,’’ IEEE Trans. Geosci.Remote Sensing 27, 145–153 119892.
18. Y. Yamaguchi and H. Tsu, ‘‘Scientific basis of ASTER instru-ment design,’’ in Sensor Systems for the Early Earth ObservingSystem Platforms, W. L. Barnes, ed., Proc. Soc. Photo-Opt.Instrum. Eng. 1939, 150–160 119932.
19. D. M. Butler, R. E. Hartle, M. Abbott, R. Cess, R. Chase, P.Christensen, J. Dutton, L.-L. Fu, C. Cautier, J. Gille, R.Gurney, P. Hays, J. Hovermale, S. Martin, J. Melack, D.Miller, V. Mohnen, B. Moore III, J. Norman, S. Schneider, J.Sherman III, V. Suomi, B. Tapley, R. Watts, E. Wood, and P.Zinke, ‘‘From pattern to process: the strategy of the EarthObserving System,’’ in NASA Earth Observing System 1NASA,Washington, D.C., 19872, Vol. 2, pp. 1–29.