preqin quarterly update: private equity &...
TRANSCRIPT
PREQIN QUARTERLY UPDATE:PRIVATE EQUITY & VENTURE CAPITALQ2 2017Insight on the quarter from the leading provider of alternative assets data
alternative assets. intelligent data.
Content includes:FundraisingFunds in MarketInstitutional InvestorsBuyout Deals and ExitsVenture Capital DealsFund Performance and Dry Powder
© Preqin Ltd. 2017 / www.preqin.com2
PREQIN QUARTERLY UPDATE: PRIVATE EQUITY & VENTURE CAPITAL, Q2 2017
FOREWORD - Christopher Elvin, Preqin
Q2 2017 witnessed continued momentum in private equity fundraising: 206 funds reached a final close, raising an aggregate $121bn. Capital commitments have now exceeded $100bn in five of the past seven quarters, an almost unprecedented sustained period of strong fundraising. The amount of capital raised continues to be spread across fewer funds – nearly two-thirds (63%) of the capital raised in Q2 was secured by the top 10 funds closed in the quarter, and average fund size has increased from $543mn in Q1 2017 to $637mn in Q2.
The private equity fundraising landscape remains highly competitive: a record 1,998 funds are currently in market – 90 more funds than at the start of Q2 2017 – targeting $676bn in investor capital. The aggregate capital being sought is bolstered by the $100bn target size of the largest ever private equity fund in market, SoftBank Vision Fund, which secured $93bn in its first close.
Concerns persist over record dry powder levels ($906bn) and high entry prices for assets, but encouragingly, there has been an increase in both the aggregate value of buyout and venture capital deals in Q2 compared to Q1, reaching $83bn and $47bn respectively. North American buyout deal value in particular surged, with the announcement of deals worth an aggregate $55bn, more than double the value of Q1. However, quarterly buyout exit activity has declined 9% from Q1, with 381 exits completed for an aggregate $59bn, representing the lowest quarterly number of exits since 2010.
Looking ahead, it is likely this tale of two markets will prevail. The strong pricing that has facilitated high exit activity in recent years, resulting in record net distributions and driving fundraising, will at the same time continue to make it challenging for managers looking to put capital to work.
We hope you find this report useful and welcome any feedback you may have. For more information, please visit www.preqin.com or contact [email protected].
All rights reserved. The entire contents of Preqin Quarterly Update: Private Equity & Venture Capital, Q2 2017 are the Copyright of Preqin Ltd. No part of this publication or any information contained in it may be copied, transmitted by any electronic means, or stored in any electronic or other data storage medium, or printed or published in any document, report or publication, without the express prior written approval of Preqin Ltd. The information presented in Preqin Quarterly Update: Private Equity & Venture Capital, Q2 2017 is for information purposes only and does not constitute and should not be construed as a solicitation or other offer, or recommendation to acquire or dispose of any investment or to engage in any other transaction, or as advice of any nature whatsoever. If the reader seeks advice rather than information then he should seek an independent financial advisor and hereby agrees that he will not hold Preqin Ltd. responsible in law or equity for any decisions of whatever nature the reader makes or refrains from making following its use of Preqin Quarterly Update: Private Equity & Venture Capital, Q2 2017. While reasonable efforts have been made to obtain information from sources that are believed to be accurate, and to confirm the accuracy of such information wherever possible, Preqin Ltd. does not make any representation or warranty that the information or opinions contained in Preqin Quarterly Update: Private Equity & Venture Capital, Q2 2017 are accurate, reliable, up-to-date or complete. Although every reasonable effort has been made to ensure the accuracy of this publication Preqin Ltd. does not accept any responsibility for any errors or omissions within Preqin Quarterly Update: Private Equity & Venture Capital, Q2 2017 or for any expense or other loss alleged to have arisen in any way with a reader’s use of this publication.
PRIVATE EQUITY ONLINE
With unrivalled data and intelligence, Private Equity Online provides a 360º transparent view of all aspects of the asset class, including fund terms and conditions, fundraising, fund managers, institutional investors, fund performance, deals and exits, service providers and more.
Get in touch today to arrange a demo of Private Equity Online: : [email protected] | : www.preqin.com/peo
p3 Fundraising
p5 Funds in Market
p6 Institutional Investors
p8 Buyout Deals and Exits
p9 Venture Capital Deals
p10 Fund Performance and Dry Powder
alternative assets. intelligent data.
3
DOWNLOAD DATA PACK: www.preqin.com/quarterlyupdate
FUNDRAISING
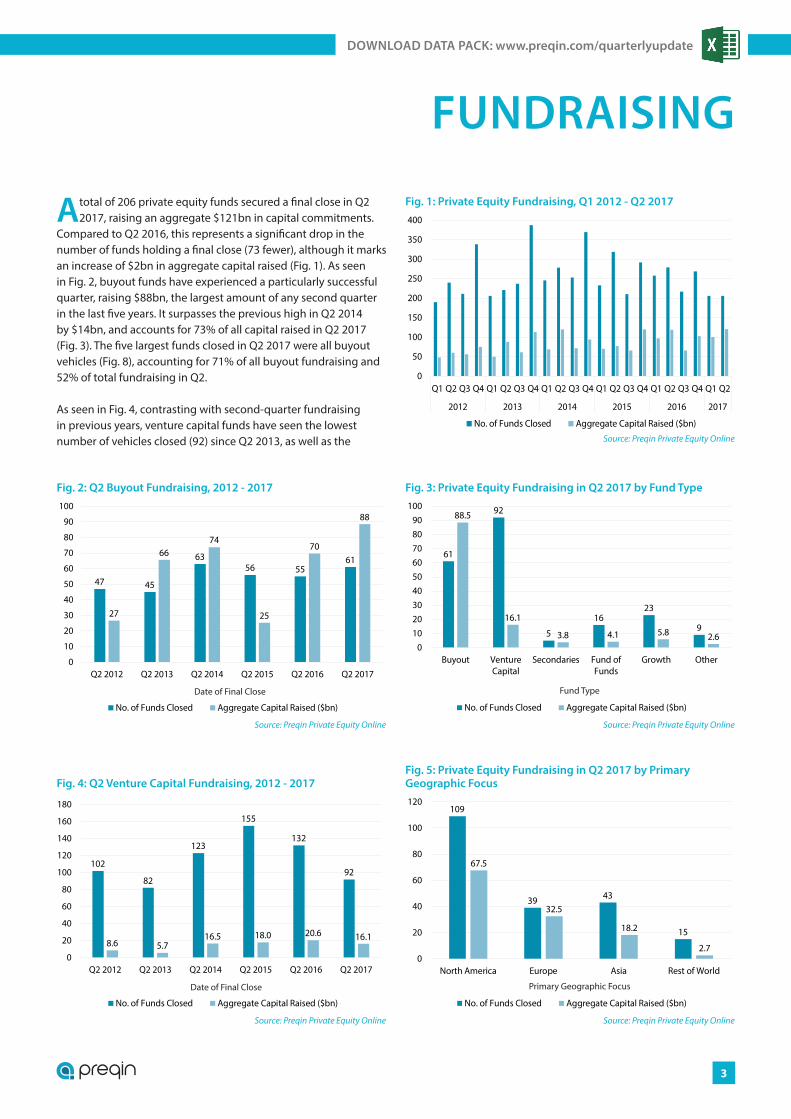
A total of 206 private equity funds secured a final close in Q2 2017, raising an aggregate $121bn in capital commitments.
Compared to Q2 2016, this represents a significant drop in the number of funds holding a final close (73 fewer), although it marks an increase of $2bn in aggregate capital raised (Fig. 1). As seen in Fig. 2, buyout funds have experienced a particularly successful quarter, raising $88bn, the largest amount of any second quarter in the last five years. It surpasses the previous high in Q2 2014 by $14bn, and accounts for 73% of all capital raised in Q2 2017 (Fig. 3). The five largest funds closed in Q2 2017 were all buyout vehicles (Fig. 8), accounting for 71% of all buyout fundraising and 52% of total fundraising in Q2.
As seen in Fig. 4, contrasting with second-quarter fundraising in previous years, venture capital funds have seen the lowest number of vehicles closed (92) since Q2 2013, as well as the
0
50
100
150
200
250
300
350
400
Q1 Q2 Q3 Q4 Q1 Q2 Q3 Q4 Q1 Q2 Q3 Q4 Q1 Q2 Q3 Q4 Q1 Q2 Q3 Q4 Q1 Q2
2012 2013 2014 2015 2016 2017
No. of Funds Closed Aggregate Capital Raised ($bn)
Source: Preqin Private Equity Online
Fig. 1: Private Equity Fundraising, Q1 2012 - Q2 2017
47 45
6356 55
61
27
6674
25
70
88
0
10
20
30
40
50
60
70
80
90
100
Q2 2012 Q2 2013 Q2 2014 Q2 2015 Q2 2016 Q2 2017
No. of Funds Closed Aggregate Capital Raised ($bn)
Source: Preqin Private Equity Online
Fig. 2: Q2 Buyout Fundraising, 2012 - 2017
Date of Final Close
61
92
5
1623
9
88.5
16.1
3.8 4.1 5.8 2.60
102030405060708090
100
Buyout VentureCapital
Secondaries Fund ofFunds
Growth Other
No. of Funds Closed Aggregate Capital Raised ($bn)
Source: Preqin Private Equity Online
Fig. 3: Private Equity Fundraising in Q2 2017 by Fund Type
Fund Type
102
82
123
155
132
92
8.6 5.716.5 18.0 20.6 16.1
0
20
40
60
80
100
120
140
160
180
Q2 2012 Q2 2013 Q2 2014 Q2 2015 Q2 2016 Q2 2017
No. of Funds Closed Aggregate Capital Raised ($bn)
Source: Preqin Private Equity Online
Fig. 4: Q2 Venture Capital Fundraising, 2012 - 2017
Date of Final Close
109
39 43
15
67.5
32.5
18.2
2.70
20
40
60
80
100
120
North America Europe Asia Rest of World
No. of Funds Closed Aggregate Capital Raised ($bn)
Source: Preqin Private Equity Online
Fig. 5: Private Equity Fundraising in Q2 2017 by Primary Geographic Focus
Primary Geographic Focus
© Preqin Ltd. 2017 / www.preqin.com4
PREQIN QUARTERLY UPDATE: PRIVATE EQUITY & VENTURE CAPITAL, Q2 2017
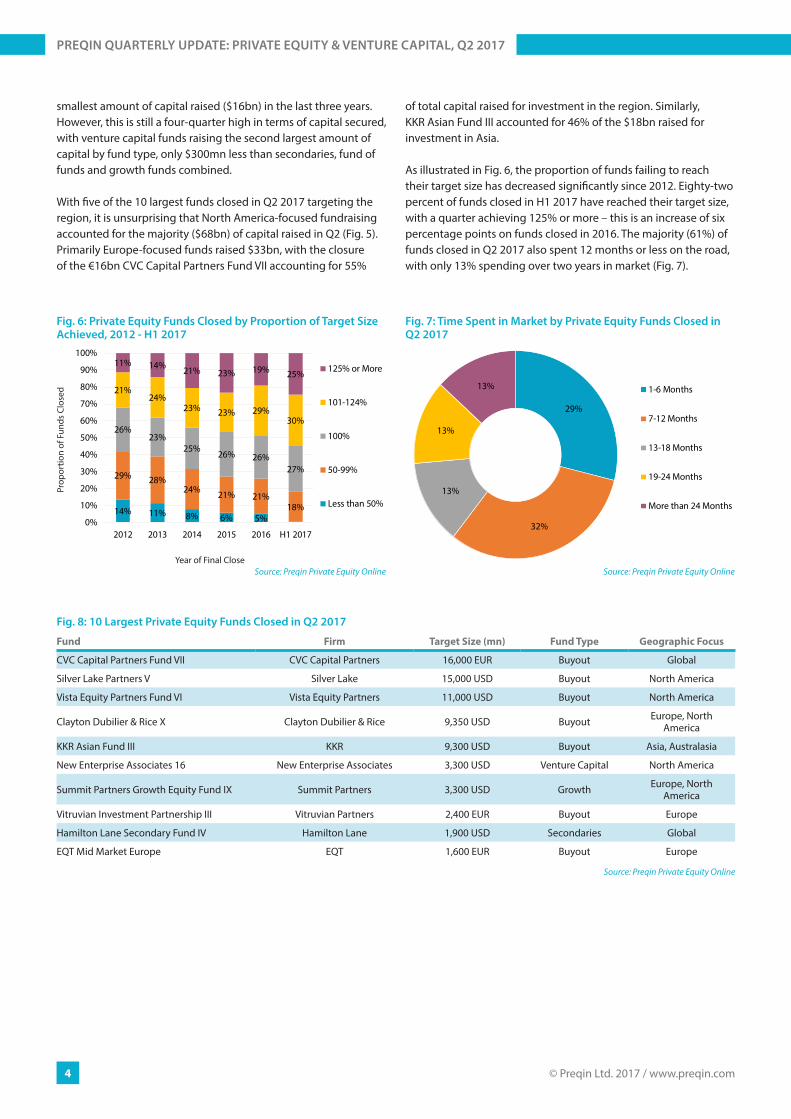
smallest amount of capital raised ($16bn) in the last three years. However, this is still a four-quarter high in terms of capital secured, with venture capital funds raising the second largest amount of capital by fund type, only $300mn less than secondaries, fund of funds and growth funds combined.
With five of the 10 largest funds closed in Q2 2017 targeting the region, it is unsurprising that North America-focused fundraising accounted for the majority ($68bn) of capital raised in Q2 (Fig. 5). Primarily Europe-focused funds raised $33bn, with the closure of the €16bn CVC Capital Partners Fund VII accounting for 55%
of total capital raised for investment in the region. Similarly, KKR Asian Fund III accounted for 46% of the $18bn raised for investment in Asia.
As illustrated in Fig. 6, the proportion of funds failing to reach their target size has decreased significantly since 2012. Eighty-two percent of funds closed in H1 2017 have reached their target size, with a quarter achieving 125% or more – this is an increase of six percentage points on funds closed in 2016. The majority (61%) of funds closed in Q2 2017 also spent 12 months or less on the road, with only 13% spending over two years in market (Fig. 7).
29%
32%
13%
13%
13% 1-6 Months
7-12 Months
13-18 Months
19-24 Months
More than 24 Months
Source: Preqin Private Equity Online
Fig. 7: Time Spent in Market by Private Equity Funds Closed in Q2 2017
Fig. 8: 10 Largest Private Equity Funds Closed in Q2 2017
Fund Firm Target Size (mn) Fund Type Geographic Focus
CVC Capital Partners Fund VII CVC Capital Partners 16,000 EUR Buyout Global
Silver Lake Partners V Silver Lake 15,000 USD Buyout North America
Vista Equity Partners Fund VI Vista Equity Partners 11,000 USD Buyout North America
Clayton Dubilier & Rice X Clayton Dubilier & Rice 9,350 USD Buyout Europe, North America
KKR Asian Fund III KKR 9,300 USD Buyout Asia, Australasia
New Enterprise Associates 16 New Enterprise Associates 3,300 USD Venture Capital North America
Summit Partners Growth Equity Fund IX Summit Partners 3,300 USD Growth Europe, North America
Vitruvian Investment Partnership III Vitruvian Partners 2,400 EUR Buyout Europe
Hamilton Lane Secondary Fund IV Hamilton Lane 1,900 USD Secondaries Global
EQT Mid Market Europe EQT 1,600 EUR Buyout Europe
Source: Preqin Private Equity Online
14% 11% 8% 6% 5%
29% 28%24% 21% 21%
18%
26%23%
25%26% 26%
27%
21%24%
23% 23% 29%30%
11% 14% 21% 23% 19% 25%
0%
10%
20%
30%
40%
50%
60%
70%
80%
90%
100%
2012 2013 2014 2015 2016 H1 2017
125% or More
101-124%
100%
50-99%
Less than 50%
Source: Preqin Private Equity Online
Fig. 6: Private Equity Funds Closed by Proportion of Target Size Achieved, 2012 - H1 2017
Prop
ortio
n of
Fun
ds C
lose
d
Year of Final Close
alternative assets. intelligent data.
5
DOWNLOAD DATA PACK: www.preqin.com/quarterlyupdate
FUNDS IN MARKET
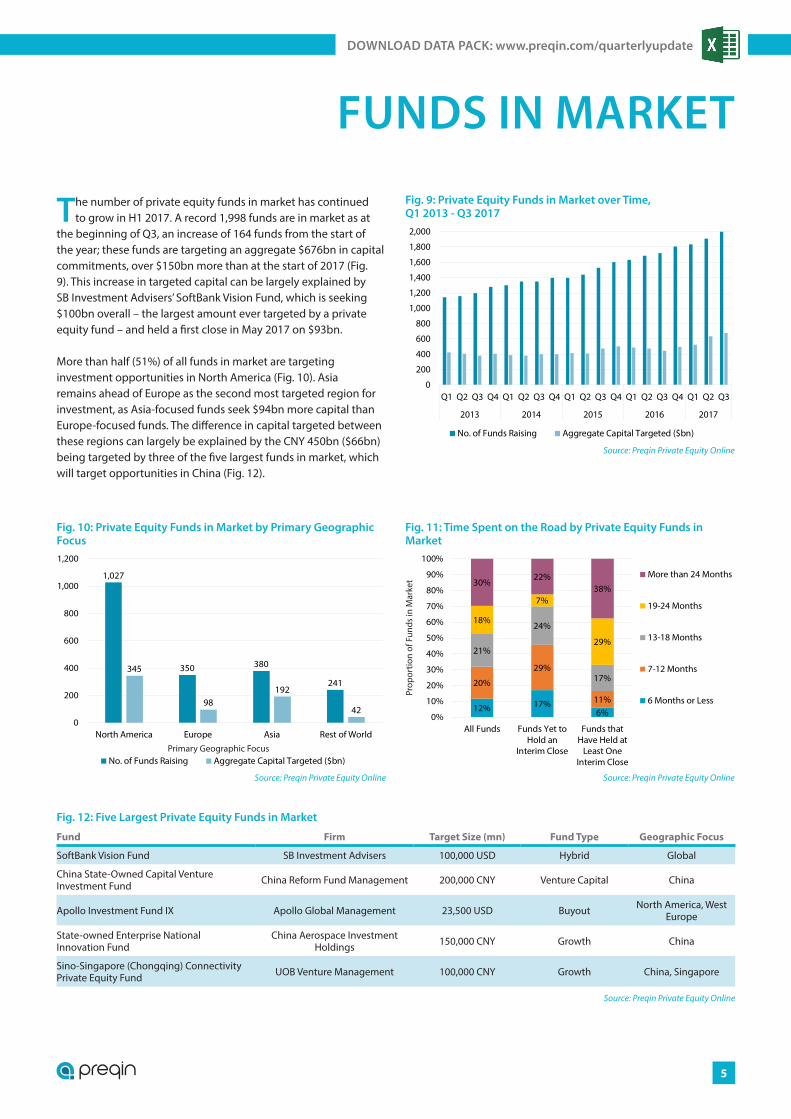
The number of private equity funds in market has continued to grow in H1 2017. A record 1,998 funds are in market as at
the beginning of Q3, an increase of 164 funds from the start of the year; these funds are targeting an aggregate $676bn in capital commitments, over $150bn more than at the start of 2017 (Fig. 9). This increase in targeted capital can be largely explained by SB Investment Advisers’ SoftBank Vision Fund, which is seeking $100bn overall – the largest amount ever targeted by a private equity fund – and held a first close in May 2017 on $93bn.
More than half (51%) of all funds in market are targeting investment opportunities in North America (Fig. 10). Asia remains ahead of Europe as the second most targeted region for investment, as Asia-focused funds seek $94bn more capital than Europe-focused funds. The difference in capital targeted between these regions can largely be explained by the CNY 450bn ($66bn) being targeted by three of the five largest funds in market, which will target opportunities in China (Fig. 12).
0
200
400
600
800
1,000
1,200
1,400
1,600
1,800
2,000
Q1 Q2 Q3 Q4 Q1 Q2 Q3 Q4 Q1 Q2 Q3 Q4 Q1 Q2 Q3 Q4 Q1 Q2 Q3
2013 2014 2015 2016 2017
No. of Funds Raising Aggregate Capital Targeted ($bn)
Source: Preqin Private Equity Online
Fig. 9: Private Equity Funds in Market over Time, Q1 2013 - Q3 2017
1,027
350 380
241
345
98192
420
200
400
600
800
1,000
1,200
North America Europe Asia Rest of World
No. of Funds Raising Aggregate Capital Targeted ($bn)
Source: Preqin Private Equity Online
Primary Geographic Focus
Fig. 10: Private Equity Funds in Market by Primary Geographic Focus
12% 17%6%
20%
29%
11%
21%
24%
17%
18%
7%
29%
30%22%
38%
0%
10%
20%
30%
40%
50%
60%
70%
80%
90%
100%
All Funds Funds Yet toHold an
Interim Close
Funds thatHave Held at
Least OneInterim Close
More than 24 Months
19-24 Months
13-18 Months
7-12 Months
6 Months or Less
Source: Preqin Private Equity Online
Prop
ortio
n of
Fun
ds in
Mar
ket
Fig. 11: Time Spent on the Road by Private Equity Funds in Market
Fig. 12: Five Largest Private Equity Funds in Market
Fund Firm Target Size (mn) Fund Type Geographic Focus
SoftBank Vision Fund SB Investment Advisers 100,000 USD Hybrid Global
China State-Owned Capital Venture Investment Fund China Reform Fund Management 200,000 CNY Venture Capital China
Apollo Investment Fund IX Apollo Global Management 23,500 USD Buyout North America, West Europe
State-owned Enterprise National Innovation Fund
China Aerospace Investment Holdings 150,000 CNY Growth China
Sino-Singapore (Chongqing) Connectivity Private Equity Fund UOB Venture Management 100,000 CNY Growth China, Singapore
Source: Preqin Private Equity Online
© Preqin Ltd. 2017 / www.preqin.com6
PREQIN QUARTERLY UPDATE: PRIVATE EQUITY & VENTURE CAPITAL, Q2 2017
INSTITUTIONAL INVESTORS
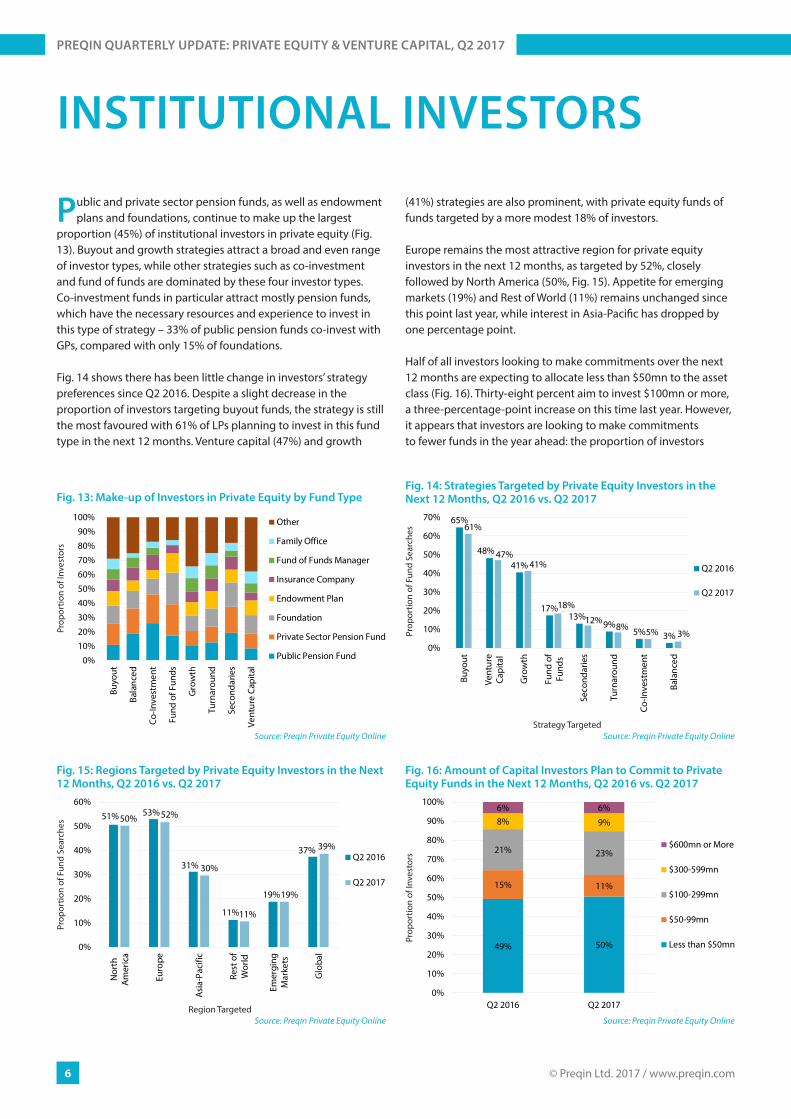
Public and private sector pension funds, as well as endowment plans and foundations, continue to make up the largest
proportion (45%) of institutional investors in private equity (Fig. 13). Buyout and growth strategies attract a broad and even range of investor types, while other strategies such as co-investment and fund of funds are dominated by these four investor types. Co-investment funds in particular attract mostly pension funds, which have the necessary resources and experience to invest in this type of strategy – 33% of public pension funds co-invest with GPs, compared with only 15% of foundations.
Fig. 14 shows there has been little change in investors’ strategy preferences since Q2 2016. Despite a slight decrease in the proportion of investors targeting buyout funds, the strategy is still the most favoured with 61% of LPs planning to invest in this fund type in the next 12 months. Venture capital (47%) and growth
(41%) strategies are also prominent, with private equity funds of funds targeted by a more modest 18% of investors.
Europe remains the most attractive region for private equity investors in the next 12 months, as targeted by 52%, closely followed by North America (50%, Fig. 15). Appetite for emerging markets (19%) and Rest of World (11%) remains unchanged since this point last year, while interest in Asia-Pacific has dropped by one percentage point.
Half of all investors looking to make commitments over the next 12 months are expecting to allocate less than $50mn to the asset class (Fig. 16). Thirty-eight percent aim to invest $100mn or more, a three-percentage-point increase on this time last year. However, it appears that investors are looking to make commitments to fewer funds in the year ahead: the proportion of investors
51% 53%
31%
11%
19%
37%
50% 52%
30%
11%
19%
39%
0%
10%
20%
30%
40%
50%
60%
Nor
thA
mer
ica
Euro
pe
Asi
a-Pa
cific
Rest
of
Wor
ld
Emer
ging
Mar
kets
Glo
bal
Q2 2016
Q2 2017
Source: Preqin Private Equity Online
Prop
ortio
n of
Fun
d Se
arch
es
Region Targeted
Fig. 15: Regions Targeted by Private Equity Investors in the Next 12 Months, Q2 2016 vs. Q2 2017
0%10%20%30%40%50%60%70%80%90%
100%
Buyo
ut
Bala
nced
Co-In
vest
men
t
Fund
of F
unds
Gro
wth
Turn
arou
nd
Seco
ndar
ies
Vent
ure
Capi
tal
Other
Family Office
Fund of Funds Manager
Insurance Company
Endowment Plan
Foundation
Private Sector Pension Fund
Public Pension Fund
Source: Preqin Private Equity Online
Prop
ortio
n of
Inve
stor
s
Fig. 13: Make-up of Investors in Private Equity by Fund Type
65%
48%
41%
17%13%
9%5% 3%
61%
47%41%
18%
12%8% 5% 3%
0%
10%
20%
30%
40%
50%
60%
70%
Buyo
ut
Vent
ure
Capi
tal
Gro
wth
Fund
of
Fund
s
Seco
ndar
ies
Turn
arou
nd
Co-In
vest
men
t
Bala
nced
Q2 2016
Q2 2017
Source: Preqin Private Equity Online
Prop
ortio
n of
Fun
d Se
arch
es
Strategy Targeted
Fig. 14: Strategies Targeted by Private Equity Investors in the Next 12 Months, Q2 2016 vs. Q2 2017
49% 50%
15% 11%
21% 23%
8% 9%
6% 6%
0%
10%
20%
30%
40%
50%
60%
70%
80%
90%
100%
Q2 2016 Q2 2017
$600mn or More
$300-599mn
$100-299mn
$50-99mn
Less than $50mn
Source: Preqin Private Equity Online
Prop
ortio
n of
Inve
stor
s
Fig. 16: Amount of Capital Investors Plan to Commit to Private Equity Funds in the Next 12 Months, Q2 2016 vs. Q2 2017
alternative assets. intelligent data.
7
DOWNLOAD DATA PACK: www.preqin.com/quarterlyupdate
Fig. 19: Sample Private Equity Investors to Watch
Investor Location Allocation to Private Equity ($mn) Investment Plans
Korea Post Savings South Korea 57
Korea Post Savings will be making new commitments to private equity funds over the next 12 months, targeting mezzanine and distressed debt vehicles, with a focus on European and North American markets across a wide range of industries.
Ohio State Highway Patrol Retirement System US 63
Ohio State Highway Patrol Retirement System plans to make new commitments to private equity funds over the next three years to meet its target allocation of 10%. The public pension fund is looking to commit $20mn to one fund and will consider both new and existing managers.
Achmea Investment Management Netherlands 2,234
Achmea Investment Management will be investing in eight private equity funds in the next 12 months, committing €350mn in total. The insurance company will target buyout and growth vehicles across Europe and North America and will look to work with a combination of new and existing managers.
prevoyance.ne Switzerland 74 The public pension fund expects to commit CHF 20mn across two private equity funds in the next 12 months. It will target growth funds on a global basis and will focus on a diversified range of industries.
Source: Preqin Private Equity Online
9% 8%
22%34%
52%
48%
16% 11%
0%
10%
20%
30%
40%
50%
60%
70%
80%
90%
100%
Q2 2016 Q2 2017
10 Fundsor More
4-9 Funds
2-3 Funds
1 Fund
Source: Preqin Private Equity Online
Prop
ortio
n of
Inve
stor
s
Fig. 17: Number of Private Equity Funds Investors Plan to Commit to in the Next 12 Months, Q2 2016 vs. Q2 2017
0%
10%
20%
30%
40%
50%
60%
Ass
et M
anag
er
Bank
/Inve
stm
ent B
ank
Corp
orat
e In
vest
or
Endo
wm
ent P
lan
Fam
ily O
ffice
Foun
datio
n
Gov
ernm
ent A
genc
y
Insu
ranc
e Co
mpa
ny
Inve
stm
ent C
ompa
ny
Priv
ate
Sect
or P
ensi
on F
und
Publ
ic P
ensi
on F
und
Sove
reig
n W
ealth
Fun
d
Wea
lth M
anag
er
Q2 2016
Q2 2017
Source: Preqin Private Equity Online
Aver
age
Targ
et A
lloca
tion
to P
E (A
s a
% o
f AU
M)
Fig. 18: Average Target Allocation to Private Equity by Investor Type (As a Proportion of AUM), Q2 2016 vs. Q2 2017
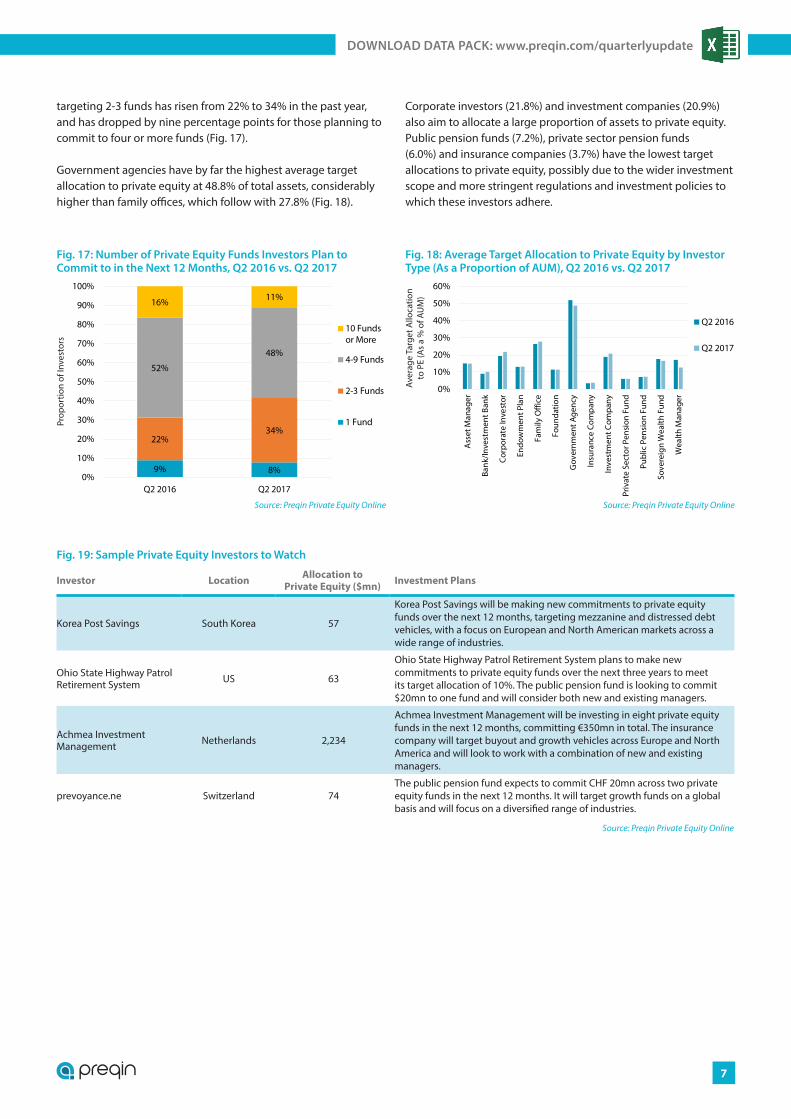
targeting 2-3 funds has risen from 22% to 34% in the past year, and has dropped by nine percentage points for those planning to commit to four or more funds (Fig. 17).
Government agencies have by far the highest average target allocation to private equity at 48.8% of total assets, considerably higher than family offices, which follow with 27.8% (Fig. 18).
Corporate investors (21.8%) and investment companies (20.9%) also aim to allocate a large proportion of assets to private equity. Public pension funds (7.2%), private sector pension funds (6.0%) and insurance companies (3.7%) have the lowest target allocations to private equity, possibly due to the wider investment scope and more stringent regulations and investment policies to which these investors adhere.
© Preqin Ltd. 2017 / www.preqin.com8
PREQIN QUARTERLY UPDATE: PRIVATE EQUITY & VENTURE CAPITAL, Q2 2017
BUYOUT DEALS AND EXITS
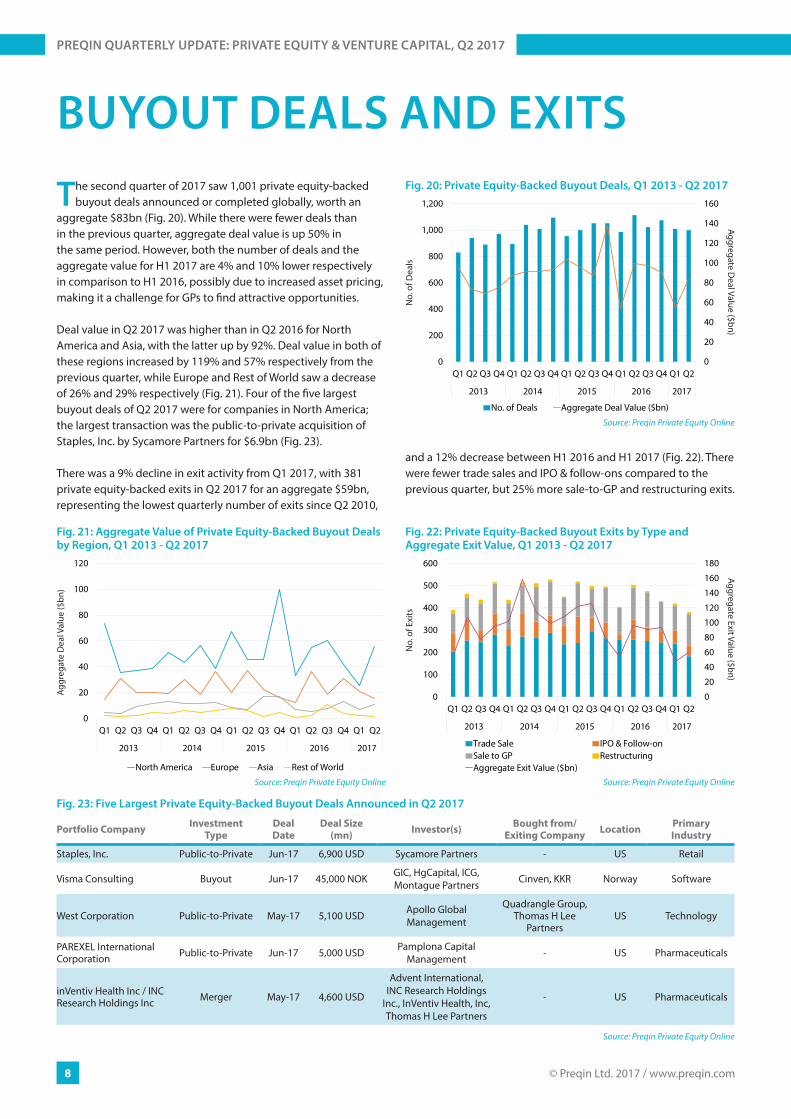
The second quarter of 2017 saw 1,001 private equity-backed buyout deals announced or completed globally, worth an
aggregate $83bn (Fig. 20). While there were fewer deals than in the previous quarter, aggregate deal value is up 50% in the same period. However, both the number of deals and the aggregate value for H1 2017 are 4% and 10% lower respectively in comparison to H1 2016, possibly due to increased asset pricing, making it a challenge for GPs to find attractive opportunities.
Deal value in Q2 2017 was higher than in Q2 2016 for North America and Asia, with the latter up by 92%. Deal value in both of these regions increased by 119% and 57% respectively from the previous quarter, while Europe and Rest of World saw a decrease of 26% and 29% respectively (Fig. 21). Four of the five largest buyout deals of Q2 2017 were for companies in North America; the largest transaction was the public-to-private acquisition of Staples, Inc. by Sycamore Partners for $6.9bn (Fig. 23).
There was a 9% decline in exit activity from Q1 2017, with 381 private equity-backed exits in Q2 2017 for an aggregate $59bn, representing the lowest quarterly number of exits since Q2 2010,
and a 12% decrease between H1 2016 and H1 2017 (Fig. 22). There were fewer trade sales and IPO & follow-ons compared to the previous quarter, but 25% more sale-to-GP and restructuring exits.
0
20
40
60
80
100
120
140
160
0
200
400
600
800
1,000
1,200
Q1 Q2 Q3 Q4 Q1 Q2 Q3 Q4 Q1 Q2 Q3 Q4 Q1 Q2 Q3 Q4 Q1 Q2
2013 2014 2015 2016 2017
No. of Deals Aggregate Deal Value ($bn)
Source: Preqin Private Equity Online
No.
of D
eals
Aggregate Deal Value ($bn)
Fig. 20: Private Equity-Backed Buyout Deals, Q1 2013 - Q2 2017
0
20
40
60
80
100
120
Q1 Q2 Q3 Q4 Q1 Q2 Q3 Q4 Q1 Q2 Q3 Q4 Q1 Q2 Q3 Q4 Q1 Q2
2013 2014 2015 2016 2017
North America Europe Asia Rest of World
Source: Preqin Private Equity Online
Aggr
egat
e D
eal V
alue
($bn
)
Fig. 21: Aggregate Value of Private Equity-Backed Buyout Deals by Region, Q1 2013 - Q2 2017
0
20
40
60
80
100
120
140
160
180
0
100
200
300
400
500
600
Q1 Q2 Q3 Q4 Q1 Q2 Q3 Q4 Q1 Q2 Q3 Q4 Q1 Q2 Q3 Q4 Q1 Q2
2013 2014 2015 2016 2017
Trade Sale IPO & Follow-onSale to GP RestructuringAggregate Exit Value ($bn)
Source: Preqin Private Equity Online
No.
of E
xits
Aggregate Exit Value ($bn)
Fig. 22: Private Equity-Backed Buyout Exits by Type and Aggregate Exit Value, Q1 2013 - Q2 2017
Fig. 23: Five Largest Private Equity-Backed Buyout Deals Announced in Q2 2017
Portfolio Company Investment Type
Deal Date
Deal Size (mn) Investor(s) Bought from/
Exiting Company Location Primary Industry
Staples, Inc. Public-to-Private Jun-17 6,900 USD Sycamore Partners - US Retail
Visma Consulting Buyout Jun-17 45,000 NOK GIC, HgCapital, ICG, Montague Partners Cinven, KKR Norway Software
West Corporation Public-to-Private May-17 5,100 USD Apollo Global Management
Quadrangle Group, Thomas H Lee
PartnersUS Technology
PAREXEL International Corporation Public-to-Private Jun-17 5,000 USD Pamplona Capital
Management - US Pharmaceuticals
inVentiv Health Inc / INC Research Holdings Inc Merger May-17 4,600 USD
Advent International, INC Research Holdings
Inc., InVentiv Health, Inc, Thomas H Lee Partners
- US Pharmaceuticals
Source: Preqin Private Equity Online
alternative assets. intelligent data.
9
DOWNLOAD DATA PACK: www.preqin.com/quarterlyupdate
VENTURE CAPITAL DEALS
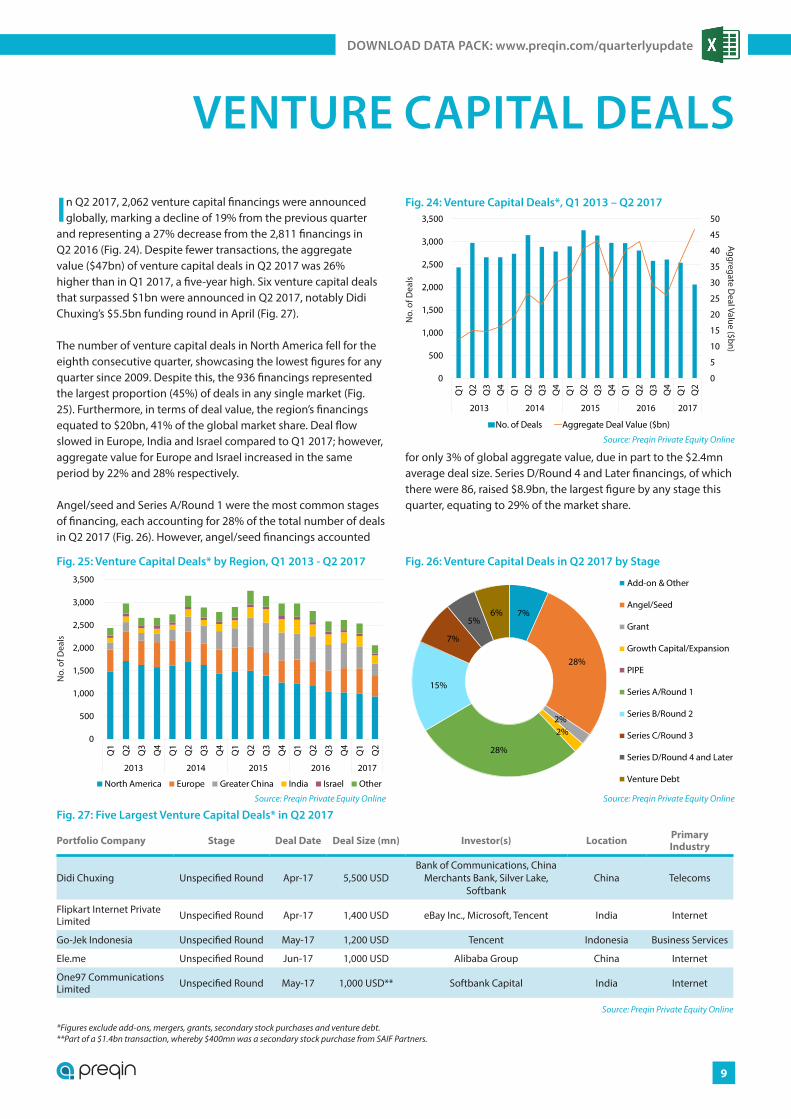
In Q2 2017, 2,062 venture capital financings were announced globally, marking a decline of 19% from the previous quarter
and representing a 27% decrease from the 2,811 financings in Q2 2016 (Fig. 24). Despite fewer transactions, the aggregate value ($47bn) of venture capital deals in Q2 2017 was 26% higher than in Q1 2017, a five-year high. Six venture capital deals that surpassed $1bn were announced in Q2 2017, notably Didi Chuxing’s $5.5bn funding round in April (Fig. 27).
The number of venture capital deals in North America fell for the eighth consecutive quarter, showcasing the lowest figures for any quarter since 2009. Despite this, the 936 financings represented the largest proportion (45%) of deals in any single market (Fig. 25). Furthermore, in terms of deal value, the region’s financings equated to $20bn, 41% of the global market share. Deal flow slowed in Europe, India and Israel compared to Q1 2017; however, aggregate value for Europe and Israel increased in the same period by 22% and 28% respectively.
Angel/seed and Series A/Round 1 were the most common stages of financing, each accounting for 28% of the total number of deals in Q2 2017 (Fig. 26). However, angel/seed financings accounted
for only 3% of global aggregate value, due in part to the $2.4mn average deal size. Series D/Round 4 and Later financings, of which there were 86, raised $8.9bn, the largest figure by any stage this quarter, equating to 29% of the market share.
0
5
10
15
20
25
30
35
40
45
50
0
500
1,000
1,500
2,000
2,500
3,000
3,500
Q1
Q2
Q3
Q4
Q1
Q2
Q3
Q4
Q1
Q2
Q3
Q4
Q1
Q2
Q3
Q4
Q1
Q2
2013 2014 2015 2016 2017
No. of Deals Aggregate Deal Value ($bn)
Source: Preqin Private Equity Online
No.
of D
eals
Aggregate Deal Value ($bn)
Fig. 24: Venture Capital Deals*, Q1 2013 – Q2 2017
0
500
1,000
1,500
2,000
2,500
3,000
3,500
Q1
Q2
Q3
Q4
Q1
Q2
Q3
Q4
Q1
Q2
Q3
Q4
Q1
Q2
Q3
Q4
Q1
Q2
2013 2014 2015 2016 2017
North America Europe Greater China India Israel Other
Source: Preqin Private Equity Online
No.
of D
eals
Fig. 25: Venture Capital Deals* by Region, Q1 2013 - Q2 2017
7%
28%
2%2%
28%
15%
7%
5%6%
Add-on & Other
Angel/Seed
Grant
Growth Capital/Expansion
PIPE
Series A/Round 1
Series B/Round 2
Series C/Round 3
Series D/Round 4 and Later
Venture Debt
Source: Preqin Private Equity Online
Fig. 26: Venture Capital Deals in Q2 2017 by Stage
Fig. 27: Five Largest Venture Capital Deals* in Q2 2017
Portfolio Company Stage Deal Date Deal Size (mn) Investor(s) Location Primary Industry
Didi Chuxing Unspecified Round Apr-17 5,500 USDBank of Communications, China
Merchants Bank, Silver Lake, Softbank
China Telecoms
Flipkart Internet Private Limited Unspecified Round Apr-17 1,400 USD eBay Inc., Microsoft, Tencent India Internet
Go-Jek Indonesia Unspecified Round May-17 1,200 USD Tencent Indonesia Business Services
Ele.me Unspecified Round Jun-17 1,000 USD Alibaba Group China Internet
One97 Communications Limited Unspecified Round May-17 1,000 USD** Softbank Capital India Internet
Source: Preqin Private Equity Online
*Figures exclude add-ons, mergers, grants, secondary stock purchases and venture debt.**Part of a $1.4bn transaction, whereby $400mn was a secondary stock purchase from SAIF Partners.
© Preqin Ltd. 2017 / www.preqin.com10
PREQIN QUARTERLY UPDATE: PRIVATE EQUITY & VENTURE CAPITAL, Q2 2017
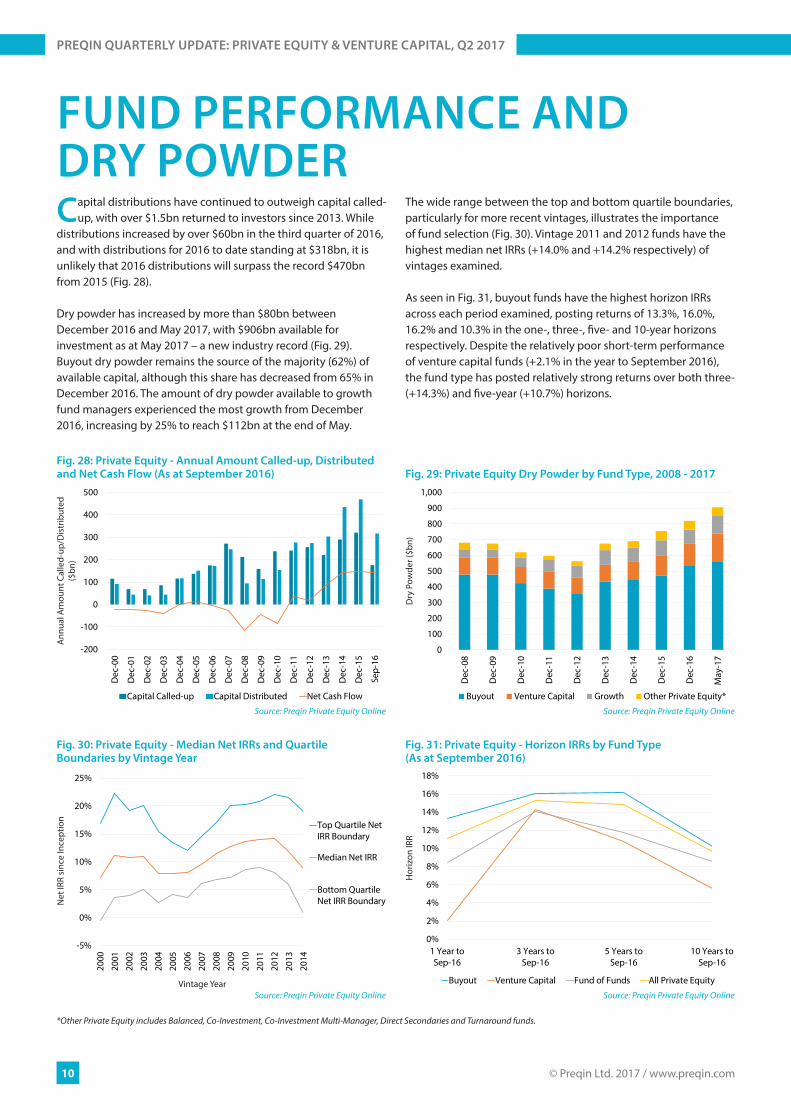
FUND PERFORMANCE ANDDRY POWDERCapital distributions have continued to outweigh capital called-
up, with over $1.5bn returned to investors since 2013. While distributions increased by over $60bn in the third quarter of 2016, and with distributions for 2016 to date standing at $318bn, it is unlikely that 2016 distributions will surpass the record $470bn from 2015 (Fig. 28).
Dry powder has increased by more than $80bn between December 2016 and May 2017, with $906bn available for investment as at May 2017 – a new industry record (Fig. 29). Buyout dry powder remains the source of the majority (62%) of available capital, although this share has decreased from 65% in December 2016. The amount of dry powder available to growth fund managers experienced the most growth from December 2016, increasing by 25% to reach $112bn at the end of May.
The wide range between the top and bottom quartile boundaries, particularly for more recent vintages, illustrates the importance of fund selection (Fig. 30). Vintage 2011 and 2012 funds have the highest median net IRRs (+14.0% and +14.2% respectively) of vintages examined.
As seen in Fig. 31, buyout funds have the highest horizon IRRs across each period examined, posting returns of 13.3%, 16.0%, 16.2% and 10.3% in the one-, three-, five- and 10-year horizons respectively. Despite the relatively poor short-term performance of venture capital funds (+2.1% in the year to September 2016), the fund type has posted relatively strong returns over both three- (+14.3%) and five-year (+10.7%) horizons.
-5%
0%
5%
10%
15%
20%
25%
2000
2001
2002
2003
2004
2005
2006
2007
2008
2009
2010
2011
2012
2013
2014
Top Quartile NetIRR Boundary
Median Net IRR
Bottom QuartileNet IRR Boundary
Source: Preqin Private Equity Online
Net
IRR
sinc
e In
cept
ion
Vintage Year
Fig. 30: Private Equity - Median Net IRRs and Quartile Boundaries by Vintage Year
0%
2%
4%
6%
8%
10%
12%
14%
16%
18%
1 Year toSep-16
3 Years toSep-16
5 Years toSep-16
10 Years toSep-16
Buyout Venture Capital Fund of Funds All Private Equity
Source: Preqin Private Equity Online
Hor
izon
IRR
Fig. 31: Private Equity - Horizon IRRs by Fund Type (As at September 2016)
-200
-100
0
100
200
300
400
500
Dec
-00
Dec
-01
Dec
-02
Dec
-03
Dec
-04
Dec
-05
Dec
-06
Dec
-07
Dec
-08
Dec
-09
Dec
-10
Dec
-11
Dec
-12
Dec
-13
Dec
-14
Dec
-15
Sep-
16
Capital Called-up Capital Distributed Net Cash Flow
Source: Preqin Private Equity Online
Ann
ual A
mou
nt C
alle
d-up
/Dis
trib
uted
($
bn)
Fig. 28: Private Equity - Annual Amount Called-up, Distributed and Net Cash Flow (As at September 2016)
0
100
200
300
400
500
600
700
800
900
1,000
Dec
-08
Dec
-09
Dec
-10
Dec
-11
Dec
-12
Dec
-13
Dec
-14
Dec
-15
Dec
-16
May
-17
Buyout Venture Capital Growth Other Private Equity*
Source: Preqin Private Equity Online
Dry
Pow
der (
$bn)
Fig. 29: Private Equity Dry Powder by Fund Type, 2008 - 2017
*Other Private Equity includes Balanced, Co-Investment, Co-Investment Multi-Manager, Direct Secondaries and Turnaround funds.
Streamline and automate your entire portfolio management process with Preqin Solutions, our powerful web-based analytics platform designed exclusively for private capital investment professionals.
DATA INTEGRATION
LIMITED PARTNER REPORTING
Automate your data collection work�ows and portfolio
performance analysis.
Shorten your valuation cycle, ensuring consistency and
transparency.
Analyze fund investment performance and utilize exit planning and benchmarking
features.
Replicate and automate your existing LP reports, both in the cloud and in Excel, allowing your IR team to streamline your quarterly reporting process.
Contact us to arrange an online demonstration and �nd out how we can help you:
[email protected] · www.preqinsolutions.com
About Preqin Solutions
Preqin Solutions, formerly Baxon Solutions, delivers market-leading cloud collaboration software for monitoring, valuation, benchmarking and reporting on private capital portfolio investments. The software automates the compilation, analysis and exchange of all portfolio information including operating metrics (�nancial, KPIs, ESG), investment valuations, and ultimately investment and aggregate fund performance. Through the integration of Preqin data, this performance can be contextualized with reference to the broader market for internal and investor reporting purposes.
Now integrated with Preqin performance data on 8,602 private capital funds, in addition to LN, KS, PME+ and Direct Alpha PME methodologies, giving you the
ability to benchmark your performance against private or public markets on the �y.
PORTFOLIO MANAGEMENT MADE EASY
PORTFOLIO COMPANIES PREQIN SOLUTIONS USERS
GPs · LPsReports + Dashboards
OUTPUTS
Preqin Solutions One Page Ad v7.pdf 1 16-Jan-17 2:25:12 PM

alternative assets. intelligent data.
With global coverage and detailed information on all aspects of the private equity asset class, Preqin’s industry-leading Private Equity Online service keeps you up-to-date on all the latest developments in
the private equity universe.
Find out how Preqin’s range of private equity products and services can help you:
www.preqin.com/privateequity
PRIVATE EQUITY ONLINE
New York ■ London ■ Singapore ■ San Francisco ■ Hong Kong ■ Manila