preprint typeset in jhep style - hyper...
TRANSCRIPT
arX
iv:1
002.
3921
v2 [
hep-
ex]
23
Aug
201
0
Preprint typeset in JHEP style - HYPER VERSION August 24, 2010
Leading-Order Determination of the Gluon
Polarization from high-pT Hadron Electroproduction
The Hermes Collaboration
Abstract: Longitudinal double-spin asymmetries of charged hadrons with high transverse
momentum pT have been measured in electroproduction using the Hermes detector at
Hera. Processes involving gluons in the nucleon have been enhanced relative to others
by selecting hadrons with pT typically above 1 GeV. In this kinematic domain the gluon
polarization has been extracted in leading order making use of the model embedded in the
Monte Carlo Generator Pythia 6.2. The gluon polarization obtained from single inclusive
hadrons in the pT range 1 GeV < pT < 2.5 GeV using a deuterium target is ∆gg(〈x〉, 〈µ2〉) =
0.049 ± 0.034(stat) ± 0.010(sys-exp)+0.126−0.099(sys-models) at a scale 〈µ2〉 = 1.35 GeV2 and
〈x〉 = 0.22. For different final states and kinematic domains, consistent values of ∆gg
have
been found within statistical uncertainties using hydrogen and deuterium targets.
Keywords: Lepton-Nucleon Scattering, Deep Inelastic Scattering, QCD, gluon
polarization.

The HERMES Collaboration
A. Airapetian 12,15, N. Akopov 25, Z. Akopov 5, E.C. Aschenauer 6,a,
W. Augustyniak 24, R. Avakian 25, A. Avetissian 25, E. Avetisyan 5,
S. Belostotski 17, N. Bianchi 10, H.P. Blok 16,23, H. Bottcher 6, C. Bonomo 9,
A. Borissov 5, V. Bryzgalov 18, M. Capiluppi 9, G.P. Capitani 10, E. Cisbani 20,
M. Contalbrigo 9, P.F. Dalpiaz 9, W. Deconinck 5,15,b, R. De Leo 2, M. Demey 16
L. De Nardo 15,5, E. De Sanctis 10, M. Diefenthaler 14,8, P. Di Nezza 10,
J. Dreschler 16 M. Duren 12, M. Ehrenfried 12 G. Elbakian 25, F. Ellinghaus 4,c,
U. Elschenbroich 11 R. Fabbri 6, A. Fantoni 10, L. Felawka 21, S. Frullani 20,
D. Gabbert 11,6, G. Gapienko 18, V. Gapienko 18, F. Garibaldi 20,
G. Gavrilov 5,17,21, V. Gharibyan 25, F. Giordano 5,9, S. Gliske 15, H. Guler 6
C. Hadjidakis 10,d, M. Hartig 5,e, D. Hasch 10, T. Hasegawa 22, G. Hill 13,
A. Hillenbrand 6, M. Hoek 13, Y. Holler 5, B. Hommez 11, I. Hristova 6,
A. Ivanilov 18, H.E. Jackson 1, R. Kaiser 13, T. Keri 13,12, E. Kinney 4,
A. Kisselev 17, M. Kopytin 6, V. Korotkov 18, P. Kravchenko 17, L. Lagamba 2,
R. Lamb 14, L. Lapikas 16, I. Lehmann 13, P. Lenisa 9, P. Liebing 6,f,
L.A. Linden-Levy 14, W. Lorenzon 15, X.-R. Lu 22 B. Maiheu 11,
N.C.R. Makins 14, B. Marianski 24, H. Marukyan 25, V. Mexner 16,
C.A. Miller 21, Y. Miyachi 22, V. Muccifora 10, M. Murray 13, A. Mussgiller 5,8,
E. Nappi 2, Y. Naryshkin 17, A. Nass 8, M. Negodaev 6, W.-D. Nowak 6,
L.L. Pappalardo 9, R. Perez-Benito 12, N. Pickert 8 M. Raithel 8, D. Reggiani 8
P.E. Reimer 1, A. Reischl 16 A.R. Reolon 10, C. Riedl 6, K. Rith 8, S.E. Rock 5,g,
G. Rosner 13, A. Rostomyan 5, J. Rubin 1,14, Y. Salomatin 18, A. Schafer 19,
G. Schnell 6,22, K.P. Schuler 5, B. Seitz 13, C. Shearer 13 T.-A. Shibata 22,
V. Shutov 7, M. Stancari 9, M. Statera 9, J.J.M. Steijger 16, J. Stewart 6
F. Stinzing 8, S. Taroian 25, B. Tchuiko 18, A. Trzcinski 24, M. Tytgat 11,
A. Vandenbroucke 11 P.B. van der Nat 16 G. van der Steenhoven 16
Y. Van Haarlem 11,h, C. Van Hulse 11, M. Varanda 5 D. Veretennikov 17,
I. Vilardi 2 C. Vogel 8 S. Wang 3, S. Yaschenko 6,8, H. Ye 3, Z. Ye 5 W. Yu 12,
D. Zeiler 8, B. Zihlmann 11 P. Zupranski 24
1 Physics Division, Argonne National Laboratory, Argonne, Illinois 60439-4843, USA2 Istituto Nazionale di Fisica Nucleare, Sezione di Bari, 70124 Bari, Italy
aNow at: Brookhaven National Laboratory, Upton, New York 11772-5000, USAbNow at:Massachusetts Institute of Technology, Cambridge, Massachusetts 02139, USAcNow at:Institut fur Physik, Universitat Mainz, 55128 Mainz, GermanydNow at: IPN (UMR 8608) CNRS/IN2P3 - Universite Paris-Sud, 91406 Orsay, FranceeNow at: Institut fur Kernphysik, Universitat Frankfurt a.M., 60438 Frankfurt a.M., GermanyfNow at: Institute of Environmental Physics and Remote Sensing, University of Bremen, 28334 Bremen,
GermanygPresent affiliation: SLAC National Accelerator Laboratory, Menlo Park, California 94025, USAhNow at: Carnegie Mellon University, Pittsburgh, Pennsylvania 15213, USA
– 1 –

3 School of Physics, Peking University, Beijing 100871, China4 Nuclear Physics Laboratory, University of Colorado, Boulder, Colorado 80309-0390,
USA5 DESY, 22603 Hamburg, Germany6 DESY, 15738 Zeuthen, Germany7 Joint Institute for Nuclear Research, 141980 Dubna, Russia8 Physikalisches Institut, Universitat Erlangen-Nurnberg, 91058 Erlangen, Germany9 Istituto Nazionale di Fisica Nucleare, Sezione di Ferrara and Dipartimento di Fisica,
Universita di Ferrara, 44100 Ferrara, Italy10 Istituto Nazionale di Fisica Nucleare, Laboratori Nazionali di Frascati, 00044 Frascati,
Italy11 Department of Subatomic and Radiation Physics, University of Gent, 9000 Gent,
Belgium12 Physikalisches Institut, Universitat Gießen, 35392 Gießen, Germany13 Department of Physics and Astronomy, University of Glasgow, Glasgow G12 8QQ,
United Kingdom14 Department of Physics, University of Illinois, Urbana, Illinois 61801-3080, USA15 Randall Laboratory of Physics, University of Michigan, Ann Arbor, Michigan
48109-1040, USA16 National Institute for Subatomic Physics (Nikhef), 1009 DB Amsterdam, The
Netherlands17 Petersburg Nuclear Physics Institute, Gatchina, Leningrad region 188300, Russia18 Institute for High Energy Physics, Protvino, Moscow region 142281, Russia19 Institut fur Theoretische Physik, Universitat Regensburg, 93040 Regensburg, Germany20 Istituto Nazionale di Fisica Nucleare, Sezione Roma 1, Gruppo Sanita and Physics
Laboratory, Istituto Superiore di Sanita, 00161 Roma, Italy21 TRIUMF, Vancouver, British Columbia V6T 2A3, Canada22 Department of Physics, Tokyo Institute of Technology, Tokyo 152, Japan23 Department of Physics, VU University, 1081 HV Amsterdam, The Netherlands24 Andrzej Soltan Institute for Nuclear Studies, 00-689 Warsaw, Poland25 Yerevan Physics Institute, 375036 Yerevan, Armenia
– 2 –

1. Introduction
In recent years a major goal in the study of Quantum Chromo-Dynamics (QCD) has been
the detailed investigation of the spin structure of the nucleon and the determination of the
partonic composition of its spin projection [1]
1
2= Sz =
1
2·∆Σ+∆G+ Lq
z + LGz . (1.1)
Here ∆Σ is the contribution of the quark and anti-quark helicities, ∆G is the contribu-
tion of the gluon helicity, and Lqz and LG
z are the quark and gluon orbital angular mo-
menta, respectively, in a reference system where the nucleon has very large longitudinal
momentum. The individual terms in the sum depend on the scale µ2 and the renormal-
ization scheme. Recent results from experiments [2, 3] and fits in next-to-leading order
(NLO) QCD [4, 5, 6, 7] to helicity-dependent inclusive Deep-Inelastic Scattering (DIS)
data [2, 3, 8, 9, 10, 11, 12, 13, 14, 15, 16, 17, 18] yield a value of ∆Σ ∼ 0.2 − 0.4 at
µ2 = 4 GeV2 in the MS scheme [19]. In contrast to the quark helicity distributions, the
knowledge of the gluon helicity distribution function is still limited. There are no di-
rect experimental determinations of parton orbital angular momenta. Most of the existing
knowledge about ∆G(µ2) originates from next-to-leading order perturbative QCD (pQCD)
fits to the helicity-dependent structure function g1(xB , Q2) of the nucleon, where xB is the
Bjorken scaling variable, which is in leading-order (LO) identified with the longitudinal
parton momentum fraction x in the nucleon. In DIS the renormalization and factoriza-
tion scales µ2 are set equal to the photon virtuality Q2. Because the virtual photon does
not couple directly to gluons (see Fig. 1b), g1(xB, Q2) is only weakly sensitive to gluons
through the DGLAP evolution [20, 21, 22] of the helicity-dependent Parton Distribution
Functions (PDFs). At next-to-leading order pQCD, additional sensitivity to gluons arises
from the Photon-Gluon Fusion (PGF) subprocess (see Fig. 1b). However, the limitations
on the precision and kinematic range in xB and Q2 of the g1 measurements result in large
experimental and theoretical uncertainties on the determination of the gluon helicity dis-
tribution function ∆g(x, µ2). Results for ∆G(µ2) =∫ 10 ∆g(x, µ2)dx from recent pQCD fits
to inclusive DIS data [4, 5, 6, 7] are typically of order 0.5 with uncertainties up to ±1.
An alternative constraint on the extraction of ∆G(µ2) in NLO pQCD fits comes from
the measurements of double-spin asymmetries in production of inclusive π0 mesons or
jets with high transverse momentum in polarized proton-(anti-)proton scattering. First
measurements were performed by E704 [23] and more recent data were obtained by Phenix
[24] and Star [25] at Rhic. The inclusion of the RHIC-data in recent NLO pQCD fits [6]
improves the accuracy on ∆g significantly. One finds |∆g(x,Q2)| smaller than 0.1, with a
possible node in the distribution. This is driven mainly by the RHIC data, which constrain
the magnitude of ∆g(x) for 0.05 < x < 0.2, but cannot determine its sign as they mainly
probe the product of the gluon helicity distribution at two x values.
In order to increase the sensitivity to ∆g(x, µ2) in lepton-nucleon scattering, other
observables besides the inclusive helicity-dependent structure function have been studied.
These observables are expected to include a direct contribution from gluons. For example,
– 3 –
�q
γ∗
q �g
γ∗
q
q �q
γ∗
q
g
a b c
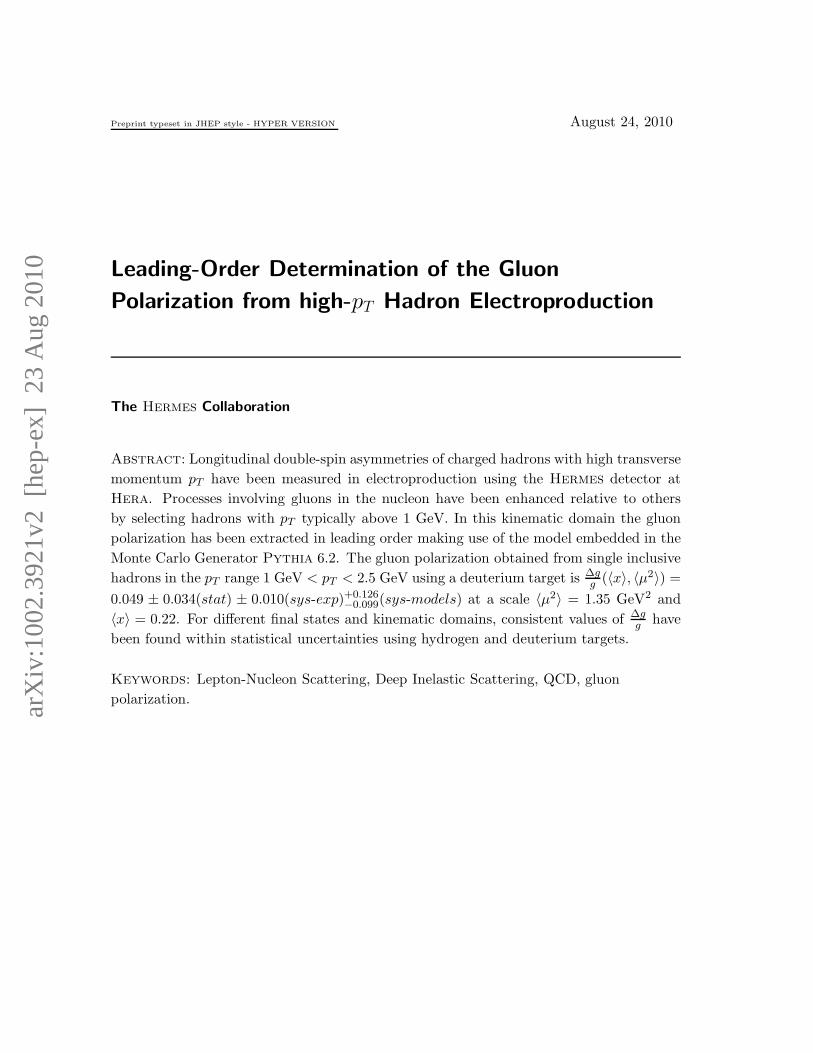
Figure 1: Feynman diagrams for hard subprocesses: a)O(α0s) DIS, b)O(α1
s) Photon-Gluon Fusion,
and c) O(α1s) QCD Compton scattering.
in hadron leptoproduction this gluonic contribution can be relatively enhanced by detecting
charmed hadrons, or inclusive hadrons or hadron pairs at high transverse momenta pT .
Charmed hadron electroproduction is a suitable channel because it is dominated by the
PGF subprocess [26] and a hard scale is introduced by the mass of the charm-quark pair,
which makes pQCD calculations of this process possible. For light final state quarks, the
selection of hadrons with high pT enhances the relative contribution of the gluon subpro-
cesses and the relevant transverse momenta provide the scale (see Sect. 5.3). In the high
pT domain other calculable hard pQCD subprocesses such as QCD Compton (QCDC)
scattering (see Fig. 1c) are relatively enhanced as well, whereas soft, non-perturbative pro-
cesses are suppressed. Charm electroproduction is being investigated by Compass [26, 27].
Inclusive single hadron leptoproduction was studied by E155 [28]. Hadron-pair leptopro-
duction at high pT was studied by Hermes [29], SMC [30] and Compass [31, 32]. For
these experiments high pT is in the range from one to a few GeV.
Throughout this paper, the term “LO” is applied to all leading order subprocesses con-
tributing to hadron production at nonzero pT . These are the tree level processes at O(α1s),
but also the quark scattering process γ∗q → q (DIS) at O(α0s). While the former processes
involve hard gluons, and can therefore involve substantial parton transverse momentum
pT in the hard scattering, in the latter process pT is equal to zero, but hadrons acquire pTfrom soft initial and final state radiation. This paper presents the LO extraction of the
gluon polarization ∆gg(x) from longitudinal double-spin asymmetries of charged inclusive
hadrons measured in electroproduction using a deuterium target byHermes at Hera. The
contributions of signal and background have been determined by a Pythia Monte Carlo
simulation, which includes LO pQCD as well as non-perturbative subprocesses. Consis-
tency checks have been performed for different kinematic regions, different final states and
using data from a hydrogen target. The data taken with the deuterium target correspond
to an integrated luminosity three times larger than that taken with the hydrogen target,
see table 1. Compared to the previous Hermes publication [29], which used measurements
of hadron pairs of opposite charge from a hydrogen target, this analysis includes a much
larger sample of single hadrons, and a significantly more comprehensive treatment of the
underlying physics processes [33, 34].
This paper is organized as follows: In Sect. 2 the experimental method is described,
– 4 –

in Sect. 3 the asymmetry results are given, in Sect. 4 the determination of ∆gg
with a
description of the physics model of the reactions is discussed, in Sect. 5 the Pythia Monte
Carlo simulation is described, in Sect. 6 the determination of ∆gg(x, µ2) is explained, and
in Sect. 7 the summary and conclusions are given.
2. The Hermes Experiment
Positrons of momentum 27.6 GeV were stored in the Hera lepton ring at Desy. The
initially unpolarized beam was transversely polarised by an asymmetry in the emission of
synchrotron radiation associated with a spin flip (Sokolov-Ternov mechanism [35]). The po-
larization was rotated to the longitudinal direction for passage through an gaseous internal
fixed target of longitudinally nuclear-polarized atoms. The scattered positron and hadrons
produced were detected in a forward magnetic spectrometer. The beam helicity was re-
versed periodically. The beam polarization was measured continuously by two independent
polarimeters using Compton backscattering of circularly polarized laser light [36, 37]. The
average beam polarization for the data used in this analysis is shown in Tab. 1. The tar-
get [38] consisted of longitudinally nuclear-polarized pure atomic hydrogen or deuterium gas
in an open-ended 40 cm long storage cell. The cell was fed by an atomic-beam source based
on Stern-Gerlach separation combined with radio-frequency transitions of atomic hyperfine
states [39]. The sign of the nuclear polarization of the atoms was chosen randomly every
60 s (90 s) for the hydrogen (deuterium) target. The polarization and the atomic fraction
inside the target cell were continuously measured [40, 41]. The average values of the target
polarization for both hydrogen and deuterium data are shown in Tab. 1. The luminosity
was measured by detecting e+e− pairs originating from Bhabha scattering of the beam
positrons off electrons in the target atoms, and also γγ pairs from e+e− annihilations [42].
Year Target Luminosity Average Beam Average Target
pb−1 Polarization Polarization
1996 H 12.6 0.528 ± 0.018 0.759 ± 0.032
1997 H 37.3 0.531 ± 0.018 0.851 ± 0.032
2000 D 138.7 0.533 ± 0.010 0.846 ± 0.030
Table 1: Integrated luminosities, average beam and target polarizations for the data used in this
analysis.
The Hermes spectrometer [43] consisted of two identical halves separated by a hor-
izontal flux diversion plate, which limited the minimum detected angle. The geometrical
acceptance was ±170 mrad in the horizontal (bending) plane and between ±(40−140) mrad
in the vertical plane resulting in a range of polar angles between 40 mrad and 220 mrad.
Each half was instrumented with 3 planes of hodoscopes, 36 planes of drift chambers,
and 9 planes of proportional chambers. The particle identification system consisted of
an electromagnetic calorimeter, a pre-shower hodoscope, a transition-radiation detector,
and a Cerenkov detector. Detailed descriptions of these components can be found in
– 5 –

Refs. [43, 44, 45, 46, 47, 48]. Positrons within the acceptance could be separated from
hadrons with an efficiency exceeding 98% and a hadron contamination of less than 1%.
The mainHermes physics trigger was formed by a coincidence of hits in the hodoscopes
in the front and back regions of the spectrometer with the requirement of an energy deposit
above 1.4 GeV in the calorimeter. This trigger was almost 100% efficient for positrons with
energies above threshold. Events with no positron in the acceptance were recorded using
a mixture of the main trigger and another trigger formed by a coincidence between the
hodoscopes and two tracking planes, requiring that there is at least one charged track. The
influence of trigger efficiencies on the analysis has been studied in [33].
3. Experimental Results
The ratio ∆gg(x, µ2) of helicity-dependent to helicity-averaged gluon distributions, i.e. the
gluon polarization, is determined by measuring the double-spin cross section asymmetry of
one or two high-pT inclusive hadrons produced in the scattering of longitudinally polarized
positrons incident on the longitudinally polarized target. The definitions of the kinematic
variables in electroproduction used in this paper are shown in Tab. 2. The longitudinal
double-spin cross section asymmetry is given by the ratio of helicity-dependent to helicity-
averaged cross sections A=∆σ/(2σ), where σ = (σ→
⇐+ σ→
⇒)/2, ∆σ =σ→
⇐− σ→
⇒, and the
single (double) arrows denote the relative alignment of longitudinal spins of the lepton
(nucleon) with respect to the lepton beam direction.
The data for this analysis were collected in 1996, 1997, and 2000 (see Tab. 1). The
analysis presented in this paper includes all (unidentified) charged hadrons. Separate
asymmetries are given for each charge, target, and event category.
3.1 Event categories
Simulations indicate that subprocesses involving hard gluons are relatively enhanced by
measuring hadrons with high pT with respect to the virtual photon direction (pT (γ∗)). Cor-
relations between hadrons in an event may also enhance the signal. Events are categorized
by the number of hadrons observed in an event and whether kinematic information on the
scattered positron is available or not. Each possible combination of two hadrons is counted
as a separate event in the pairs category. The categories are defined in detail as follows:
• ‘anti-tagged’ single inclusive hadrons: Events with leptons in the acceptance
were not included in this category. The hadron transverse momentum pT (beam) was
measured with respect to the beam direction as the direction of the virtual photon is
unknown. In most cases, the undetected positron had a small scattering angle (and
hence Q2 is small) and stayed inside the beam pipe. The difference between pT (beam)
and pT (γ∗) is then very small. However, the positron could also escape the detector
acceptance because of a large scattering angle, in which case Q2 was large. The large
angle of the virtual photon with respect to the beam axis results in a significantly
larger pT (beam) than pT (γ∗) of the hadron. Although these events with large Q2 are
rare, they can account for a significant fraction of the hadrons at high pT (beam). For
– 6 –

k = (E,~k), k′ = (E′, ~k′) 4–momenta of the initial and final state leptons
θ, φ Polar and azimuthal angle of the scattered positron
M Mass of the initial target nucleon
q = (E − E′, ~k − ~k′) 4–momentum of the virtual photon
Q2 = −q2lab≈ 4EE′ sin2 θ
2 Negative squared 4-momentum transfer
ν = P ·qM
lab= E − E′ Energy of the virtual photon
x = Q2
2P ·qlab= Q2
2MνBjorken scaling variable
y = P ·qP ·k
lab= ν
EFractional energy of the virtual photon
W 2 = (P + q)2
lab= M2 + 2Mν −Q2 Squared invariant mass of the virtual-photon nucleon system
p = (Eh, ~p) 4-momentum of a hadron in the final state
pT Transverse momentum of a hadron
pT (γ∗) pT with respect to the virtual photon
pT (beam) pT with respect to the incoming positron
pfragT Transverse hadron momentum from fragmentation∑
p2T (beam) For two hadrons: (ph1
T (beam))2 + (ph2
T (beam))2
z = P ·Ph
P ·qlab= Eh
νFractional energy of the final state hadron
x Parton momentum fraction
s = (pa + pb)2 Mandelstam variable for partonic process ab → cd
t = (pa − pc)2 Mandelstam variable for partonic process ab → cd
u = (pb − pc)2 Mandelstam variable for partonic process ab → cd
µ2 pQCD scale
pT (=√
uts
for m = 0) Transverse momentum of final state partonsin the CM-system of the hard subprocess
kT Intrinsic transverse momentum of partonsin the nucleon and photon
Table 2: Definition of kinematic variables.
pT > 1.0 GeV the deuteron (proton) data sample in this category contains 1272k
(419k) hadrons.
• ‘tagged’ single inclusive hadrons: The scattered positron has been detected with
Q2 > 0.1 GeV2, W 2 > 4 GeV2, and y < 0.95. The hadron transverse momentum
pT (γ∗) is measured with respect to the virtual photon direction. For pT > 1 GeV this
deuteron (proton) data sample contains 53k (19k) hadrons.
• inclusive pairs of hadrons: The hadron pair sample consists of all pairs of charged
hadrons with pT (beam) > 0.5 GeV. The transverse momentum pT (beam) is measured
with respect to the beam direction, because only in 10% of the events the positron
was detected. With the additional requirement∑
p2T (beam) > 2.0 GeV2 the deuteron
(proton) data sample contains 60k (20k) hadron pairs. With this requirement applied,
– 7 –

6% of the anti-tagged inclusive hadrons with pT (beam) > 1.0 GeV are contained within
the pairs sample.
For all three categories, Hermes data are available for various combinations of target
and/or hadron charge detected. As the samples differ in the hard subprocess and final
state kinematics and fractions of contributing subprocesses, the corresponding results for
the gluon polarization ∆gg(x, µ2) provide a measure of the consistency of the extraction. The
final result for ∆gg(x, µ2) is obtained from the anti-tagged inclusive hadrons originating from
a deuterium target. The other data samples have too small a statistical power to justify
carrying out the extensive analysis needed to obtain the systematic uncertainties.
3.2 Asymmetry results
The double-spin asymmetry measured is given by
Ameas ≡ A|| =N
→
⇐L→
⇒ −N→
⇒L→
⇐
N→
⇐L→
⇒P +N
→
⇒L→
⇐P
. (3.1)
Here N→
⇒ (N→
⇐) is the number of hadrons or hadron pairs for target spin orientation parallel
(anti-parallel) to the beam spin orientation, L→
⇒ (L→
⇐) is the corresponding integrated
luminosity, and L→
⇒P (L
→
⇐P ) is the integrated luminosity weighted by the live-time fraction
and the absolute values of beam and target polarizations. There is a small background
(< 0.1%) from positrons misidentified as hadrons (and vice versa). In the tagged category
a correction was applied for an approximately 5% contribution of positrons originating
from charge-symmetric processes.
The asymmetries for the anti-tagged and tagged categories are shown as a function of
transverse momentum in Figs. 2 and 3, respectively, and listed in tables 9 - 10. The asym-
metry of the pairs is presented as a function of the minimum requirement, (∑
p2T (beam))min,
in Fig. 4 and in table 11. The considerably different values of the asymmetries in the
different categories, charges and targets are due to the different underlying mixtures of
subprocesses and of quark content, as discussed in Sect. 5.3.
The curves in Figs. 2, 3, and 4 show the asymmetries calculated by the procedure
discussed in Sect. 4 using the values ∆gg(x, µ2) = −1, 0, +1 (from top to bottom). They
illustrate the sensitivity of the Hermes data to ∆gg(x, µ2). The data are close to the central
curve indicating small average values of ∆gg.
4. Physics Model
4.1 Subprocesses
Both the helicity-averaged and helicity-dependent cross sections include contributions from
hard subprocesses that can be calculated using pQCD and from soft subprocesses such as
those described by the Vector-Meson Dominance (VMD) model (see Fig. 1). A smooth
transition from soft subprocesses to hard subprocesses is regulated by a set of cutoff pa-
rameters (for details [33, 49, 50, 51]). The measured asymmetry is the weighted sum of the
– 8 –

-0.1
0
0.1
0.2
0.3
MC, ∆g/g= 0MC, ∆g/g= -1
MC, ∆g/g= +1
ep→h+XA
||
Hermes
ep→h-X
-0.1
0
0.1
0.2
0.3
0 1 2
ed→h+X
0 1 2
ed→h-X
pT(beam) [GeV]
Figure 2: Measured asymmetry for the anti-tagged category of events for positive (left) and
negative (right) inclusive hadrons from hydrogen (top) and deuterium (bottom) targets as a function
of pT (beam). The uncertainties are statistical only. There is an overall normalization uncertainty of
5.2% (3.9%) for hydrogen (deuterium). The curves show the Monte Carlo asymmetries for three
different fixed values assumed for the gluon polarization.
asymmetries of all subprocesses. When it is impossible to reliably separate the subprocesses
experimentally, as in fixed-target experiments, the fractions of events originating from the
different subprocesses must be modeled. In the analysis described in this paper, this is
done using the spin independent Monte Carlo (MC) program Pythia 6.2 [49, 50, 51].
The various subprocesses are classified in terms of the model used in Pythia. In
this model, the wave function of the incoming photon has three components, a “VMD”,
a “direct” and an “anomalous” one. The generic photon processes following from this
decomposition are depicted in Fig. 5. The direct photon interacts as a point-like particle
with the partons of the nucleon, while the VMD and anomalous components interact
through their hadronic structure.
Figure 5b shows an example of a direct process. The direct pQCD subprocesses studied
in this analysis are the O(α0s) DIS process (Fig. 1a), the O(α1
s) processes PGF (Fig. 1b),
and QCDC (Fig. 1c).
The VMD component is characterized by small-scale, non-perturbative fluctuations
of the photon into a qq pair existing long enough to evolve into a hadronic state before
the interaction with the nucleon. This process can be described in the framework of the
VMD model, where the hadronic state is treated as a vector meson (e.g., ρ0, ω, φ) with the
same quantum numbers as the photon. Higher-mass and non-resonant states are added in
the Generalized VMD (GVMD) model. The (G)VMD hadronic states can undergo all the
– 9 –
-0.3-0.2-0.1
00.10.20.30.4
MC, ∆g/g= 0MC, ∆g/g= -1
MC, ∆g/g= +1
ep→eh+XA
||
Hermes
ep→eh-X
-0.3-0.2-0.1
00.10.20.30.4
0 0.5 1 1.5 2
ed→eh+X
0 0.5 1 1.5 2
ed→eh-X
pT(γ*) [GeV]
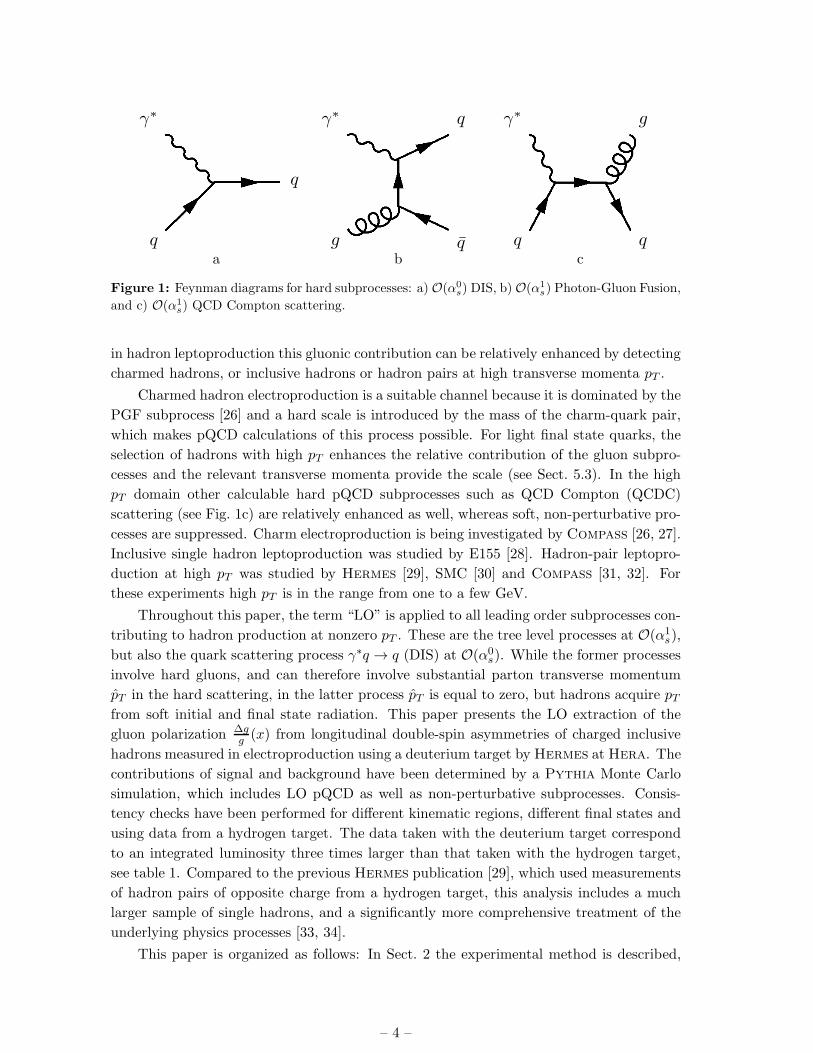
Figure 3: Measured asymmetry for the tagged category of events for positive (left) and negative
(right) inclusive hadrons from hydrogen (top) and deuterium (bottom) targets as a function of
pT (γ∗). The uncertainties are statistical only. There is an overall experimental normalization un-
certainty of 5.2% (3.9%) for hydrogen (deuterium). The curves show the Monte Carlo asymmetries
for three different fixed values assumed for the gluon polarization.
-0.3
-0.2
-0.1
0
0.1
0.2
0.3
0.4
1 2 3 4
MC, ∆g/g= 0MC, ∆g/g= -1
MC, ∆g/g= +1
ep→h±h±XA||
1 2 3 4
Hermes
ed→h±h±X
Σ(pT2
(beam))min [GeV2]
Figure 4: Measured asymmetry for hadron pairs produced from hydrogen (left) and deuterium
(right) targets as a function of the minimum value of∑
p2T (beam). The uncertainties are statistical
only. There is an overall experimental normalization uncertainty of 5.2% (3.9%) for hydrogen
(deuterium). The curves show the Monte Carlo asymmetries for three different values assumed for
the gluon polarization.
interactions with the nucleon allowed in hadronic physics, i.e., elastic and diffractive as well
as inelastic non-diffractive reactions. The latter can be either soft (“low-pT ”) processes or
hard QCD 2 → 2 processes. A generic example of a VMD process is shown in Fig. 5a.
– 10 –

Figure 5: Contributions to hard p interactions: (a) VMD, (b) direct, and (c) anomalous. Only
the basic graphs are illustrated; additional partonic activity is allowed in all three processes. The
presence of spectator jets has been indicated by dashed lines, while full lines show partons that
(may) give rise to high-pt jets. The gray ovals represent multiparton wave functions. Anomalous
states are built up from a perturbatively given qq fluctuation, while VMD fluctuations allow no
simple perturbative representation; hence the difference in the placing of the ovals [51].
The anomalous photon is characterized by sufficiently large-scale, perturbative fluc-
tuations of the photon into a qq pair. The allowed processes are the same pQCD 2 → 2
processes as in the hard VMD case, with the difference that for the anomalous component
the parton distributions of the photon are relevant, whereas for the description of the hard
VMD component those of the vector meson are used. Both hard VMD and anomalous
components are usually referred to as “resolved” photons. Depending on whether a quark
or a gluon in the nucleon is struck by a resolved photon the corresponding hard subpro-
cesses are labeled by a ‘q’ or ‘g’ in this paper. A generic example of an anomalous process is
shown in Fig. 5c. The resolved-photon processes are of O(α1s) with a hidden 1/αs(µ
2) term
in the evolution of the photon’s parton distributions canceling the additional vertex [52].
For hard subprocesses the nucleon is described by helicity-averaged (helicity-dependent)
PDFs, which are the average (difference) of the number densities of partons of type f whose
spins are aligned, f+, those whose spins are anti-aligned, f−, with respect to the nucleon
spin: f(x, µ2)=f+(x, µ2) + f−(x, µ2) (∆f(x, µ2)=f+(x, µ2) − f−(x, µ2)), where f= u, d,
s, or g. The integral over x, ∆f(µ2) =∫ 10 dx∆f(x, µ2), gives the total spin contribution
of the respective partons to the nucleon spin, as used in Eq. 1.1. The hard part of the
single-inclusive differential helicity-dependent cross section for the process γ∗p → hX can
be expressed as an integral over the parton distribution functions, the hard partonic cross
sections for the subprocesses ab → cX, and the fragmentation functions. It can be written
schematically as
d∆σγ∗p→hX =∑
a,b,c=q,q,g
∫
dxadxbdzc∆fγ∗
a (xa, µ2)∆fN
b (xb, µ2)
×d∆σab→cX(s, t, µ2, Q2)Dhc (zc, µ
2) , (4.1)
and correspondingly for the helicity-averaged cross section and distributions. Here xb is the
fraction of the nucleon momentum carried by parton b and fNb (xb, µ
2) (∆fNb (xb, µ
2)) is the
corresponding nucleon PDF. Similarly xa is the fraction of the photon momentum carried by
– 11 –
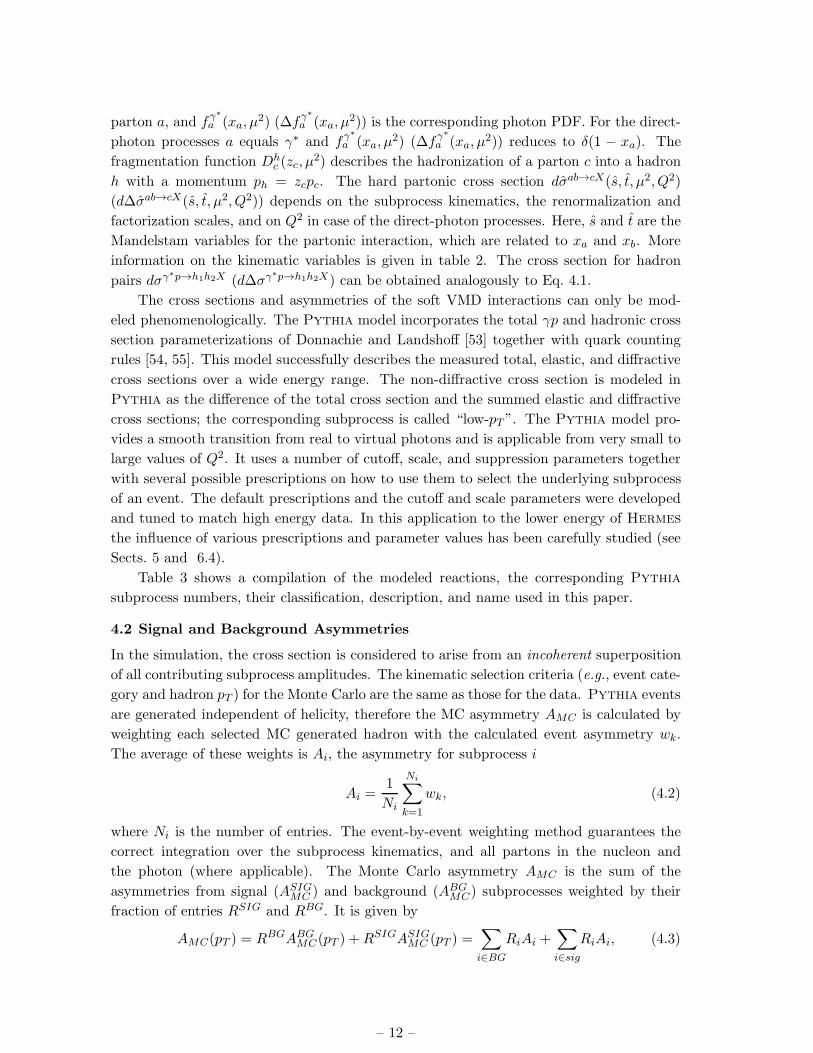
parton a, and fγ∗
a (xa, µ2) (∆fγ∗
a (xa, µ2)) is the corresponding photon PDF. For the direct-
photon processes a equals γ∗ and fγ∗
a (xa, µ2) (∆fγ∗
a (xa, µ2)) reduces to δ(1 − xa). The
fragmentation function Dhc (zc, µ
2) describes the hadronization of a parton c into a hadron
h with a momentum ph = zcpc. The hard partonic cross section dσab→cX(s, t, µ2, Q2)
(d∆σab→cX(s, t, µ2, Q2)) depends on the subprocess kinematics, the renormalization and
factorization scales, and on Q2 in case of the direct-photon processes. Here, s and t are the
Mandelstam variables for the partonic interaction, which are related to xa and xb. More
information on the kinematic variables is given in table 2. The cross section for hadron
pairs dσγ∗p→h1h2X (d∆σγ∗p→h1h2X) can be obtained analogously to Eq. 4.1.
The cross sections and asymmetries of the soft VMD interactions can only be mod-
eled phenomenologically. The Pythia model incorporates the total γp and hadronic cross
section parameterizations of Donnachie and Landshoff [53] together with quark counting
rules [54, 55]. This model successfully describes the measured total, elastic, and diffractive
cross sections over a wide energy range. The non-diffractive cross section is modeled in
Pythia as the difference of the total cross section and the summed elastic and diffractive
cross sections; the corresponding subprocess is called “low-pT ”. The Pythia model pro-
vides a smooth transition from real to virtual photons and is applicable from very small to
large values of Q2. It uses a number of cutoff, scale, and suppression parameters together
with several possible prescriptions on how to use them to select the underlying subprocess
of an event. The default prescriptions and the cutoff and scale parameters were developed
and tuned to match high energy data. In this application to the lower energy of Hermes
the influence of various prescriptions and parameter values has been carefully studied (see
Sects. 5 and 6.4).
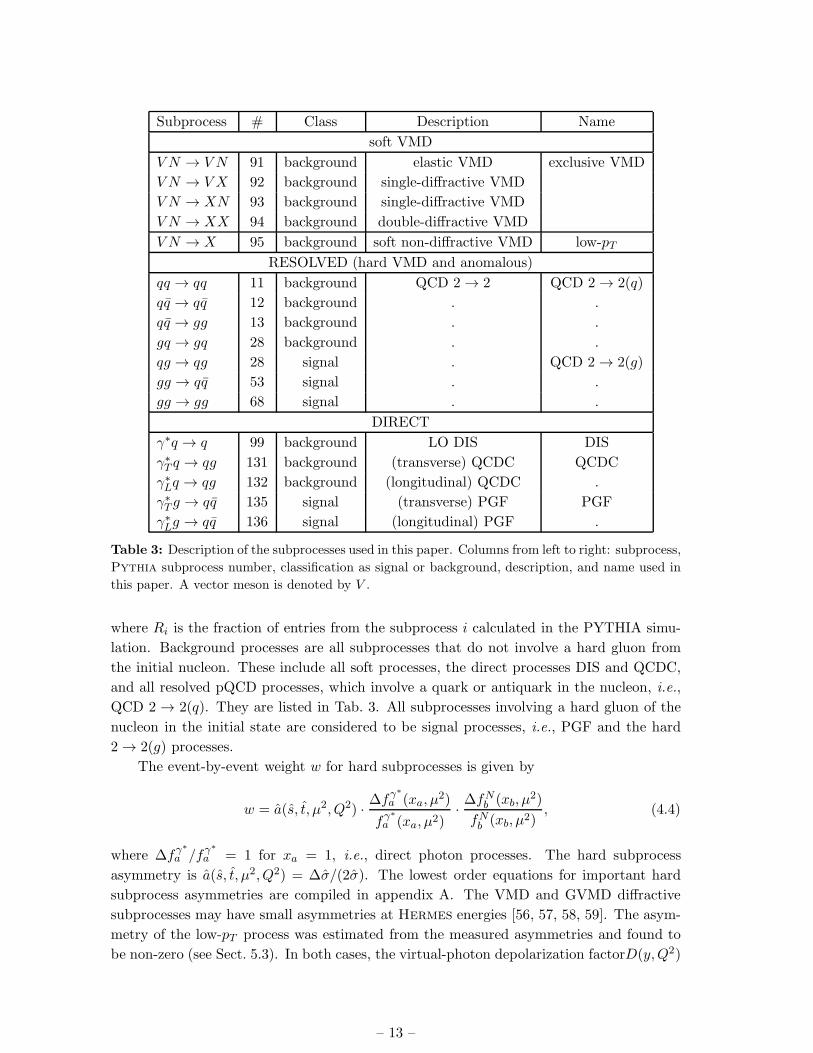
Table 3 shows a compilation of the modeled reactions, the corresponding Pythia
subprocess numbers, their classification, description, and name used in this paper.
4.2 Signal and Background Asymmetries
In the simulation, the cross section is considered to arise from an incoherent superposition
of all contributing subprocess amplitudes. The kinematic selection criteria (e.g., event cate-
gory and hadron pT ) for the Monte Carlo are the same as those for the data. Pythia events
are generated independent of helicity, therefore the MC asymmetry AMC is calculated by
weighting each selected MC generated hadron with the calculated event asymmetry wk.
The average of these weights is Ai, the asymmetry for subprocess i
Ai =1
Ni
Ni∑
k=1
wk, (4.2)
where Ni is the number of entries. The event-by-event weighting method guarantees the
correct integration over the subprocess kinematics, and all partons in the nucleon and
the photon (where applicable). The Monte Carlo asymmetry AMC is the sum of the
asymmetries from signal (ASIGMC ) and background (ABG
MC) subprocesses weighted by their
fraction of entries RSIG and RBG. It is given by
AMC(pT ) = RBGABGMC(pT ) +RSIGASIG
MC (pT ) =∑
i∈BG
RiAi +∑
i∈sig
RiAi, (4.3)
– 12 –
Subprocess # Class Description Name
soft VMD
V N → V N 91 background elastic VMD exclusive VMD
V N → V X 92 background single-diffractive VMD
V N → XN 93 background single-diffractive VMD
V N → XX 94 background double-diffractive VMD
V N → X 95 background soft non-diffractive VMD low-pT
RESOLVED (hard VMD and anomalous)
qq → qq 11 background QCD 2 → 2 QCD 2 → 2(q)
qq → qq 12 background . .
qq → gg 13 background . .
gq → gq 28 background . .
qg → qg 28 signal . QCD 2 → 2(g)
gg → qq 53 signal . .
gg → gg 68 signal . .
DIRECT
γ∗q → q 99 background LO DIS DIS
γ∗T q → qg 131 background (transverse) QCDC QCDC
γ∗Lq → qg 132 background (longitudinal) QCDC .
γ∗T g → qq 135 signal (transverse) PGF PGF
γ∗Lg → qq 136 signal (longitudinal) PGF .
Table 3: Description of the subprocesses used in this paper. Columns from left to right: subprocess,
Pythia subprocess number, classification as signal or background, description, and name used in
this paper. A vector meson is denoted by V .
where Ri is the fraction of entries from the subprocess i calculated in the PYTHIA simu-
lation. Background processes are all subprocesses that do not involve a hard gluon from
the initial nucleon. These include all soft processes, the direct processes DIS and QCDC,
and all resolved pQCD processes, which involve a quark or antiquark in the nucleon, i.e.,
QCD 2 → 2(q). They are listed in Tab. 3. All subprocesses involving a hard gluon of the
nucleon in the initial state are considered to be signal processes, i.e., PGF and the hard
2 → 2(g) processes.
The event-by-event weight w for hard subprocesses is given by
w = a(s, t, µ2, Q2) ·∆fγ∗
a (xa, µ2)
fγ∗
a (xa, µ2)·∆fN
b (xb, µ2)
fNb (xb, µ2)
, (4.4)
where ∆fγ∗
a /fγ∗
a = 1 for xa = 1, i.e., direct photon processes. The hard subprocess
asymmetry is a(s, t, µ2, Q2) = ∆σ/(2σ). The lowest order equations for important hard
subprocess asymmetries are compiled in appendix A. The VMD and GVMD diffractive
subprocesses may have small asymmetries at Hermes energies [56, 57, 58, 59]. The asym-
metry of the low-pT process was estimated from the measured asymmetries and found to
be non-zero (see Sect. 5.3). In both cases, the virtual-photon depolarization factorD(y,Q2)
– 13 –

(see Eq. A.15) has to be applied to the weight in order to account for the transformation of
the virtual-photon nucleon asymmetry into a lepton-nucleon asymmetry. The asymmetry
from signal subprocesses depends on the unknown ∆gg(x, µ2) averaged over the subprocess
kinematics in the specified pT range. It can be written as
ASIGMC (pT ) =
1
NSIG
NSIG∑
k=1
wk
=
⟨
a(s, t, µ2, Q2) ·∆fγ∗
a (xa, µ2)
fγ∗
a (xa, µ2)·∆g
g(xb, µ
2)
⟩SIG
(pT ), (4.5)
where NSIG is the number of entries from all signal processes. The extraction of the
quantity of interest, ∆gg(x, µ2), is based on Eq. 4.5 replacing the unknown asymmetry
ASIGMC (pT ) by
ASIG(pT ) =Ameas(pT )−RBGABG
MC(pT )
RSIG. (4.6)
In Sect. 6 methods will be described to extract ∆gg
from the right hand side of Eq. 4.5.
5. Monte Carlo simulation
The relevant subprocess cross sections have been modeled by the Pythia Monte Carlo
program, which uses Jetset [60] for describing the fragmentation process. The standard
helicity-averaged input PDFs used are CTEQ5L [61] for the nucleon and Schuler and
Sjostrand [62] for the photon. The scale µ2 of the 2 → 2 subprocesses is defined to be
µ2 = p2T +12Q
2 (also commonly referred to as Q2). Electromagnetic radiative effects [63, 64]
have been added to Pythia and they constitute a relatively small correction for hadron
production at Hermes kinematics [33]. Events generated by Pythia are passed through
a complete Geant 3 [65] simulation of the Hermes spectrometer.
5.1 Monte Carlo tuning
In order to account for the relatively low center-of-mass energy of the Hermes experiment
several parameters in the event generation were adjusted and the model describing exclusive
vector meson production was improved [33]. This was done in the kinematic region of the
tagged events because more kinematic variables are measured for this category than for
the anti-tagged category. The tuning of the fragmentation parameters [66] was performed
using a subsample with pT (γ∗) < 0.8 GeV and Q2 > 1 GeV2 where the DIS process (Fig. 1a)
is dominant and NLO corrections are small. The values of the adjusted parameters, shown
in Tab. 7 in appendix B, are used for all event categories.
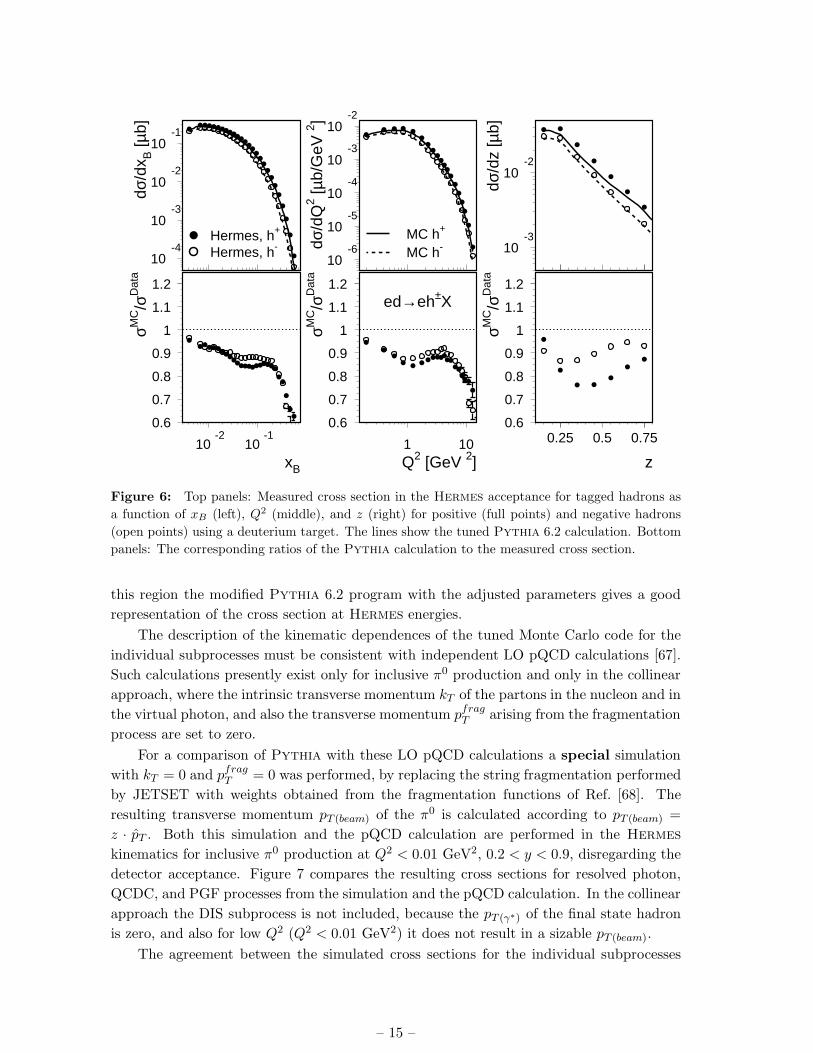
Figure 6 shows the measured and the simulated cross sections as a function of xB, Q2,
and z for the tagged category of events using a deuterium target. Both the simulated and
measured cross sections are not corrected for acceptance effects. These cross sections vary
over more than three orders of magnitude. The data and MC simulation agree to within
15% for xB < 0.2, where most of the data reside for the tagged event category. Thus in
– 14 –
10-4
10-3
10-2
10-1
Hermes, h+
Hermes, h-
dσ/d
x B [µ
b]
10-6
10-5
10-4
10-3
10-2
MC h+
MC h-dσ/d
Q2 [µ
b/G
eV 2 ]
10-3
10-2
dσ/d
z [µ
b]
0.6
0.7
0.8
0.9
1
1.1
1.2
10-2
10-1
xB
σMC/σ
Dat
a
0.6
0.7
0.8
0.9
1
1.1
1.2
1 10
ed→eh±X
Q2 [GeV 2]
σMC/σ
Dat
a
0.6
0.7
0.8
0.9
1
1.1
1.2
0.25 0.5 0.75
z
σMC/σ
Dat
aFigure 6: Top panels: Measured cross section in the Hermes acceptance for tagged hadrons as
a function of xB (left), Q2 (middle), and z (right) for positive (full points) and negative hadrons
(open points) using a deuterium target. The lines show the tuned Pythia 6.2 calculation. Bottom
panels: The corresponding ratios of the Pythia calculation to the measured cross section.
this region the modified Pythia 6.2 program with the adjusted parameters gives a good
representation of the cross section at Hermes energies.
The description of the kinematic dependences of the tuned Monte Carlo code for the
individual subprocesses must be consistent with independent LO pQCD calculations [67].
Such calculations presently exist only for inclusive π0 production and only in the collinear
approach, where the intrinsic transverse momentum kT of the partons in the nucleon and in
the virtual photon, and also the transverse momentum pfragT arising from the fragmentation
process are set to zero.
For a comparison of Pythia with these LO pQCD calculations a special simulation
with kT = 0 and pfragT = 0 was performed, by replacing the string fragmentation performed
by JETSET with weights obtained from the fragmentation functions of Ref. [68]. The
resulting transverse momentum pT (beam) of the π0 is calculated according to pT (beam) =
z · pT . Both this simulation and the pQCD calculation are performed in the Hermes
kinematics for inclusive π0 production at Q2 < 0.01 GeV2, 0.2 < y < 0.9, disregarding the
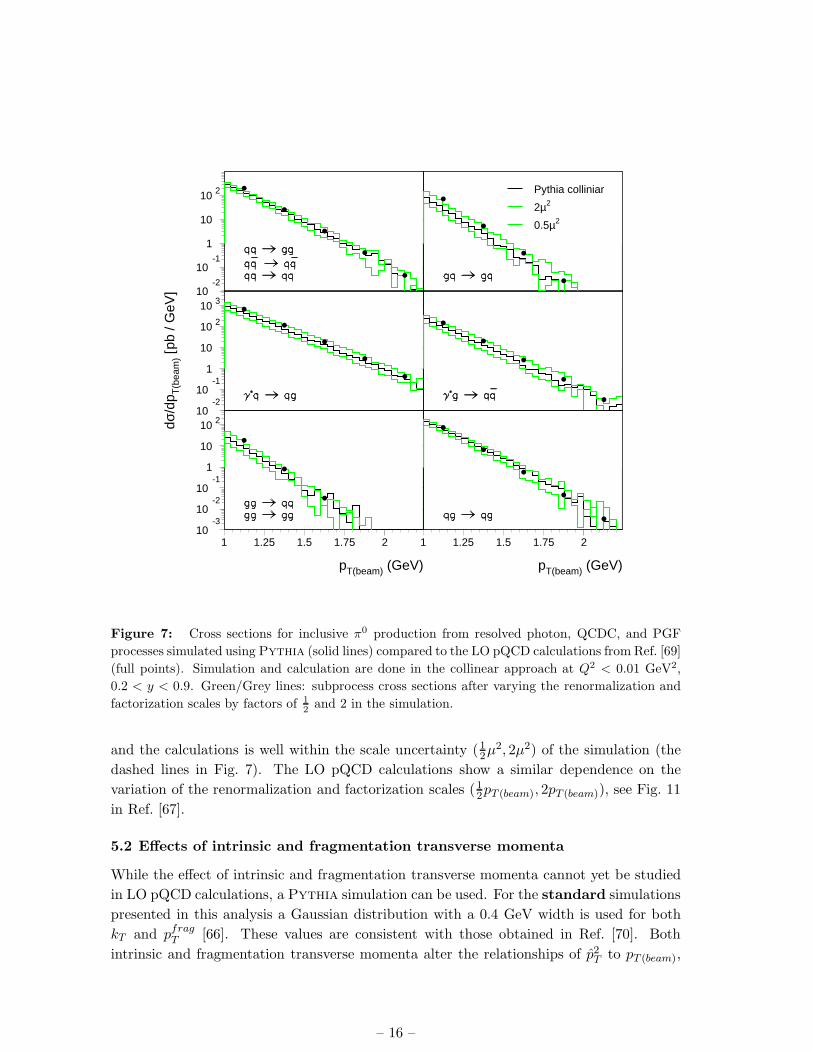
detector acceptance. Figure 7 compares the resulting cross sections for resolved photon,
QCDC, and PGF processes from the simulation and the pQCD calculation. In the collinear
approach the DIS subprocess is not included, because the pT (γ∗) of the final state hadron
is zero, and also for low Q2 (Q2 < 0.01 GeV2) it does not result in a sizable pT (beam).
The agreement between the simulated cross sections for the individual subprocesses
– 15 –
dσ/d
p T(b
eam
) [pb
/ G
eV]
pT(beam) (GeV) pT(beam) (GeV)
Pythia colliniar
2µ2
0.5µ2
10-2
10-1
1
10
10 2
10-2
10-1
1
10
10 2
10 3
10-3
10-2
10-1
1
10
10 2
1 1.25 1.5 1.75 2 1 1.25 1.5 1.75 2
Figure 7: Cross sections for inclusive π0 production from resolved photon, QCDC, and PGF
processes simulated using Pythia (solid lines) compared to the LO pQCD calculations from Ref. [69]
(full points). Simulation and calculation are done in the collinear approach at Q2 < 0.01 GeV2,
0.2 < y < 0.9. Green/Grey lines: subprocess cross sections after varying the renormalization and
factorization scales by factors of 12 and 2 in the simulation.
and the calculations is well within the scale uncertainty (12µ2, 2µ2) of the simulation (the
dashed lines in Fig. 7). The LO pQCD calculations show a similar dependence on the
variation of the renormalization and factorization scales (12pT (beam), 2pT (beam)), see Fig. 11
in Ref. [67].
5.2 Effects of intrinsic and fragmentation transverse momenta
While the effect of intrinsic and fragmentation transverse momenta cannot yet be studied
in LO pQCD calculations, a Pythia simulation can be used. For the standard simulations
presented in this analysis a Gaussian distribution with a 0.4 GeV width is used for both
kT and pfragT [66]. These values are consistent with those obtained in Ref. [70]. Both
intrinsic and fragmentation transverse momenta alter the relationships of p2T to pT (beam),
– 16 –
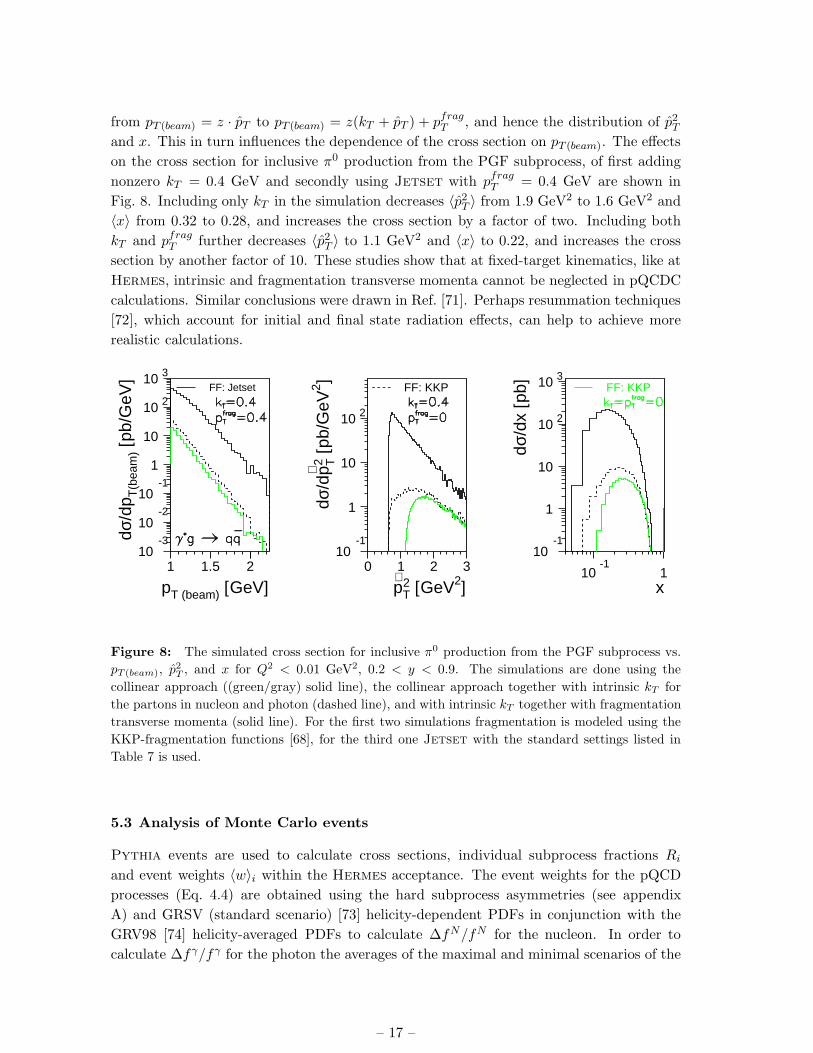
from pT (beam) = z · pT to pT (beam) = z(kT + pT ) + pfragT , and hence the distribution of p2Tand x. This in turn influences the dependence of the cross section on pT (beam). The effects
on the cross section for inclusive π0 production from the PGF subprocess, of first adding
nonzero kT = 0.4 GeV and secondly using Jetset with pfragT = 0.4 GeV are shown in
Fig. 8. Including only kT in the simulation decreases 〈p2T 〉 from 1.9 GeV2 to 1.6 GeV2 and
〈x〉 from 0.32 to 0.28, and increases the cross section by a factor of two. Including both
kT and pfragT further decreases 〈p2T 〉 to 1.1 GeV2 and 〈x〉 to 0.22, and increases the cross
section by another factor of 10. These studies show that at fixed-target kinematics, like at
Hermes, intrinsic and fragmentation transverse momenta cannot be neglected in pQCDC
calculations. Similar conclusions were drawn in Ref. [71]. Perhaps resummation techniques
[72], which account for initial and final state radiation effects, can help to achieve more
realistic calculations.
pT (beam) [GeV]
dσ/d
p T(b
eam
) [pb
/GeV
]
p∧
T2 [GeV2]
dσ/d
p∧T2 [p
b/G
eV2 ]
x
dσ/d
x [p
b]FF: Jetset FF: KKP FF: KKP
10-3
10-2
10-1
1
10
10 2
10 3
1 1.5 210
-1
1
10
10 2
0 1 2 310
-1
1
10
10 2
10 3
10-1
1
Figure 8: The simulated cross section for inclusive π0 production from the PGF subprocess vs.
pT (beam), p2T , and x for Q2 < 0.01 GeV2, 0.2 < y < 0.9. The simulations are done using the
collinear approach ((green/gray) solid line), the collinear approach together with intrinsic kT for
the partons in nucleon and photon (dashed line), and with intrinsic kT together with fragmentation
transverse momenta (solid line). For the first two simulations fragmentation is modeled using the
KKP-fragmentation functions [68], for the third one Jetset with the standard settings listed in
Table 7 is used.
5.3 Analysis of Monte Carlo events
Pythia events are used to calculate cross sections, individual subprocess fractions Ri
and event weights 〈w〉i within the Hermes acceptance. The event weights for the pQCD
processes (Eq. 4.4) are obtained using the hard subprocess asymmetries (see appendix
A) and GRSV (standard scenario) [73] helicity-dependent PDFs in conjunction with the
GRV98 [74] helicity-averaged PDFs to calculate ∆fN/fN for the nucleon. In order to
calculate ∆fγ/fγ for the photon the averages of the maximal and minimal scenarios of the
– 17 –
GRS [75, 76] helicity-dependent PDFs are used in conjunction with the GRS [77] helicity-
averaged PDFs.
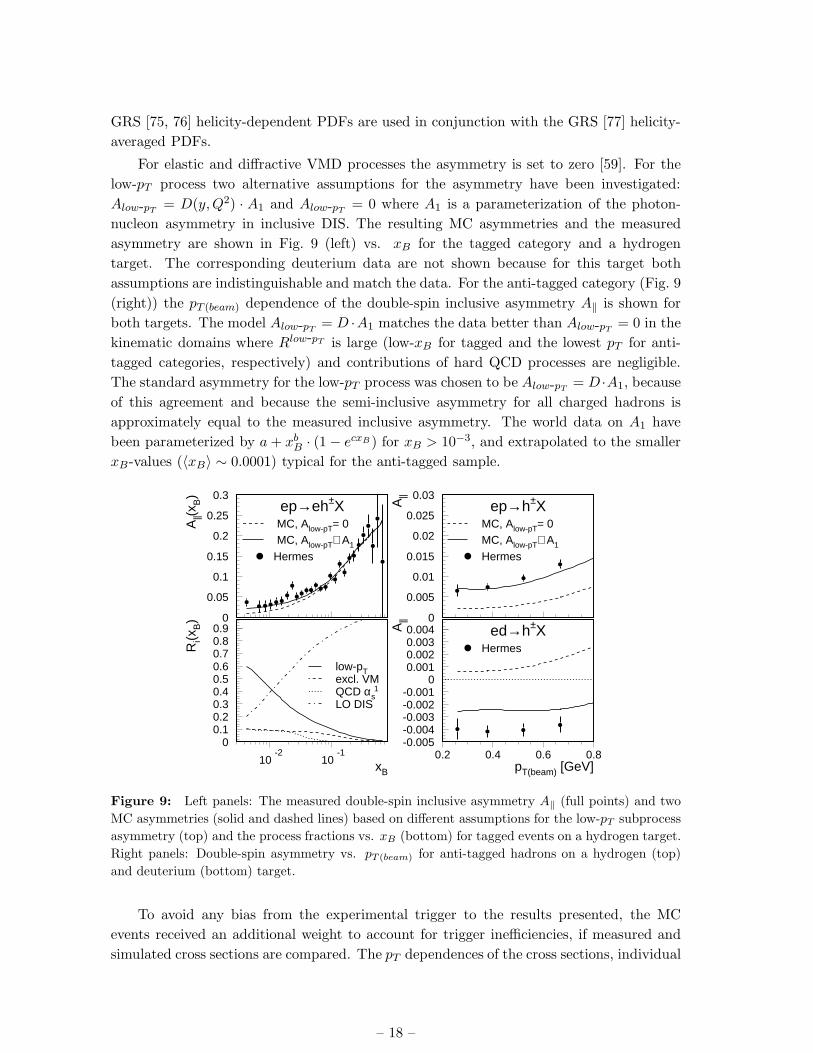
For elastic and diffractive VMD processes the asymmetry is set to zero [59]. For the
low-pT process two alternative assumptions for the asymmetry have been investigated:
Alow-pT = D(y,Q2) · A1 and Alow-pT = 0 where A1 is a parameterization of the photon-
nucleon asymmetry in inclusive DIS. The resulting MC asymmetries and the measured
asymmetry are shown in Fig. 9 (left) vs. xB for the tagged category and a hydrogen
target. The corresponding deuterium data are not shown because for this target both
assumptions are indistinguishable and match the data. For the anti-tagged category (Fig. 9
(right)) the pT (beam) dependence of the double-spin inclusive asymmetry A‖ is shown for
both targets. The model Alow-pT = D ·A1 matches the data better than Alow-pT = 0 in the
kinematic domains where Rlow-pT is large (low-xB for tagged and the lowest pT for anti-
tagged categories, respectively) and contributions of hard QCD processes are negligible.
The standard asymmetry for the low-pT process was chosen to be Alow-pT = D ·A1, because
of this agreement and because the semi-inclusive asymmetry for all charged hadrons is
approximately equal to the measured inclusive asymmetry. The world data on A1 have
been parameterized by a+ xbB · (1− ecxB ) for xB > 10−3, and extrapolated to the smaller
xB-values (〈xB〉 ∼ 0.0001) typical for the anti-tagged sample.
0
0.05
0.1
0.15
0.2
0.25
0.3ep→eh±X
MC, Alow-pT∼ A1
MC, Alow-pT= 0A||(
x B)
Hermes
0
0.005
0.01
0.015
0.02
0.025
0.03ep→h±X
Hermes
MC, Alow-pT∼ A1
MC, Alow-pT= 0
A||
00.10.20.30.40.50.60.70.80.9
10-2
10-1
low-pTexcl. VMQCD αs
1
LO DIS
xB
Ri(x
B)
-0.005-0.004-0.003-0.002-0.001
00.0010.0020.0030.004
0.2 0.4 0.6 0.8
Hermes
ed→h±X
pT(beam) [GeV]
A||
Figure 9: Left panels: The measured double-spin inclusive asymmetry A‖ (full points) and two
MC asymmetries (solid and dashed lines) based on different assumptions for the low-pT subprocess
asymmetry (top) and the process fractions vs. xB (bottom) for tagged events on a hydrogen target.
Right panels: Double-spin asymmetry vs. pT (beam) for anti-tagged hadrons on a hydrogen (top)
and deuterium (bottom) target.
To avoid any bias from the experimental trigger to the results presented, the MC
events received an additional weight to account for trigger inefficiencies, if measured and
simulated cross sections are compared. The pT dependences of the cross sections, individual
– 18 –

subprocess fractions Ri, average event weights Ai, and weighted asymmetries RiAi for the
three event categories are shown in Figs. 10 (anti-tagged), 11 (tagged), and 12 (pairs).
All three categories have in common that:
• The cross sections span four orders of magnitude, decreasing rapidly with pT ;
• Reasonable agreement between data and Monte Carlo is observed for low transverse
momenta. With increasing pT the Monte Carlo description becomes worse, underes-
timating the data by up to a factor of four at the largest pT ;
• The fractions Rlow−pT and Rexcl.VMD decrease with increasing pT and the corre-
sponding asymmetries are very small or zero, respectively;
• In general the contributions from hard QCD subprocesses increase with increasing
pT . At high pT subprocesses involving quarks in the nucleon contribute less than the
signal processes;
• The asymmetries for the two signal subprocesses, QCD 2 → 2(g) and PGF have
opposite sign. For a positive gluon polarization like that of GRSV, this results in
a sizable negative asymmetry for PGF, and positive asymmetries for the 2 → 2(g)
processes;
• Some asymmetries and fractions depend on the charge of the hadron.
Even though soft effects from initial and final state radiation and additional nonper-
turbative processes are taken into account in the Pythia simulation, the Monte Carlo
simulation still fails to describe the cross sections at pT > 1 GeV. This shortcoming may
be explained by missing large higher order corrections to the hard processes. These correc-
tions have been evaluated for the next to leading order (NLO) cross section in Ref. [67], in
the collinear approach for Q2 < 0.01 GeV2 and pcolT = zpT > 1 GeV, for all hard processes
(QCD 2 → 2, PGF, QCDC) contributing in this region. The similar kinematics of hard
processes in the pQCD-calculation and the PYTHIA simulation allows one to approximate
the effect of NLO corrections to the Monte Carlo cross section. A k-factor, i.e., the ratio
of LO to NLO cross sections is applied as a weight to each hadron originating from a hard
process. The k-factors from Ref. [67] are very large (almost 5) at pT ≈ 1 GeV and decrease
with pT to about 2.5 at pT = 2.4 GeV. For the reweighting of the Monte Carlo events they
have been extrapolated down to pT (beam) = 0.8 GeV, and it was assumed that pcolT can be
approximated by pT (beam) (see the discussion in Sect. 5.1 about the collinear approxima-
tion). The results shown in the cross section ratio of Fig. 10 indicate that the inclusion
of NLO effects to the Monte Carlo could significantly improve the description of the cross
section. Effects of similar size may exist for the other categories, but NLO calculations for
those are not yet available. The k-factors for the asymmetry have also been calculated in
[67] and are approximately 2 in the experimental range. Unfortunately it is not possible to
consistently take into account k-factors in the extraction of ∆gg(x, µ2), therefore the result
will essentially be a LO result subject to potentially large NLO corrections.
– 19 –

10-5
10-3
10-11
ed→h+Xdσh /d
p T [µ
b/G
eV]
PYTHIAHermes
ed→h-X
0.5
1LO MCLO MC × k-Factor
σMC/σ
Dat
a
0
0.5
1 low-pTexcl. VMDLO DIS
Ri
QCD 2→2(q)QCDC
PGFQCD 2→2(g)
-0.25
0
0.25
Ai
0
0.2
0 0.5 1 1.5 2
RiA
i
0 0.5 1 1.5 2
pT(beam) [GeV]
Figure 10: The cross sections and subprocess contributions, in the Hermes acceptance as a
function of pT (beam) for the anti-tagged category of events and a deuterium target (left: positively
charged hadrons, right: negatively charged hadrons). Top: The measured cross section and that
generated by Pythia. Second row: The ratio of these two cross sections. Also shown is the effect
of the k-factor based on Ref. [67] (see text). Third row: The subprocess fractions from Pythia.
Bottom two rows: The asymmetries and the asymmetries weighted with the subprocess fractions
for each subprocess using Refs. [73] and [74] for the gluon PDFs.
– 20 –

10-6
10-4
10-2
Hermes
ed→eh+Xdσh /d
p T [µ
b/G
eV]
PYTHIA
ed→eh-X
0.5
1
σMC/σ
Dat
a
0
0.5
1 low-pTexcl. VMDLO DIS
Ri
QCD 2→2(q)QCDCPGFQCD 2→2(g)
-0.2
0
Ai
-0.1
0
0 0.5 1 1.5 2
RiA
i
0 0.5 1 1.5 2
pT(γ*) [GeV]
Figure 11: The cross sections and subprocess contributions, in the Hermes acceptance, as a
function of pT (γ∗) for the tagged category of events and a deuterium target (left: positively charged
hadrons, right: negatively charged hadrons). Top: The measured cross section and that generated
by Pythia. Second row: The ratio of these two cross sections. Third row: The subprocess
fractions from Pythia. Bottom two rows: The asymmetries and the asymmetries weighted with
the subprocess fractions for each subprocess using Refs. [73] and [74] for the gluon PDFs.
– 21 –

10-6
10-4
10-2
Hermesed→eh±h±Xdσ
hh/d
p T2 [µ
b/G
eV2 ]
PYTHIA
0.5
1
σMC/σ
Dat
a
0
0.5
1 low pT QCD 2→2(q)excl. VMDLO DIS
QCDC
PGFQCD 2→2(g)
Ri
-0.2
0
0.2
Ai
-0.1
-0.05
0
2 4
RiA
i
ΣpT2
(beam) [GeV2]
Figure 12: The cross sections and subprocess contributions, in the Hermes acceptance, as a
function of the minimum value of∑
p2T (beam) for the production of inclusive hadron pairs on a
deuterium target. Top: The measured cross section and that generated by Pythia. Second row:
The ratio of these two cross sections. Third row: The subprocess fractions from Pythia. Bottom
two rows: The asymmetries and the asymmetries weighted with the subprocess fractions for each
subprocess using Refs. [73] and [74] for the gluon PDFs.
– 22 –

For the anti-tagged category the LO DIS fraction dominates the yield of positive
hadrons at high pT (beam). This is due to the subsample of events with the positron having
a large scattering angle and missing the Hermes acceptance. The subprocess fractions for
LO DIS and QCDC are larger for positive hadrons because of u-quark dominance. Both
signal subprocesses contribute approximately 20% to the cross section at high pT (beam). The
pairs category has a larger signal fraction than the other categories, but a much smaller
number of events. The mixture of the background processes and their contribution to the
background asymmetry is different for each category.
6. Determination of the gluon polarization
6.1 Kinematic considerations and requirements
The average value of ∆gg
in a pT range is determined directly from Eq. 6.1 (see Sect. 6.2).
However, as shown in Fig. 13, there is a large range of x spanned by the data for each pTrange. In order to circumvent this difficulty, the value of ∆g
gand the appropriate value of
x is determined through a minimization procedure using a functional form for ∆gg(x) (see
Sect. 6.3). The scale dependence of ∆gg
is neglected because almost all pQCD models are
monotonic and vary slowly as a function of µ2 over the relatively small relevant range. In
0
0.02
0.04
0.06
0.08
0.1
0.12
0.14
0.080.09 0.1 0.2 0.3 0.4 0.5 0.6 0.7
1.0<pT(beam)/GeV<1.21.2<pT(beam)/GeV<1.5
1.5<pT(beam)/GeV<1.81.8<pT(beam)/GeV<2.5
x
Fra
ctio
n of
Eve
nts
Figure 13: The range of generated x for different values of pT (beam) calculated by Pythia for all
signal processes, for the anti-tagged category of events and a deuterium target.
order to optimize the accuracy of ∆gg
the following criteria that maximize the sensitivity
of the MC asymmetry to ∆gg, are applied to the individual data samples:
• 1.0 GeV < pT (γ∗) < 2.0 GeV (tagged);
• 1.0 GeV < pT (beam) < 2.5 GeV (anti-tagged);
• 2.0 GeV2 <∑
p2T (pairs).
These requirements balance the statistical accuracy of the measured asymmetries (decreas-
ing with pT , as shown in Figs. 2-4) against the signal process fractions (increasing with pT ,
as shown in Figs. 10-12). For the events within these limits it is observed that:
– 23 –

• The Pythia simulations displayed in Fig. 14 show a strong correlation between the
hard scattering transverse momentum 〈p2T 〉 of the signal subprocesses and the mea-
sured hadronic pT (∑
p2T );
• For larger values of pT , there is greater sensitivity to the hard processes involving
the gluon (see Figs. 2-4), which leads to reduced systematic uncertainties due to
corrections for background asymmetries.
0.751
1.251.5
1.752
2.252.5
2.753
0 1
tagged<p
∧T2>=pT
2(γ*)
pT(γ*) [GeV]
<p∧T2>
[GeV
2 ]
0 1 2
anti-tagged<p
∧T2>=pT
2(beam)
p∧
T2
pT(beam) [GeV]2 4
<p∧
T2>=ΣpT
2(beam)/2
pairs
Σ pT2
(beam) [GeV2]
Figure 14: The correlation of the average hard scattering 〈p2T 〉 of all signal subprocesses as
calculated by Pythia with the hadron pT for inclusive hadrons as calculated for the experimental
data for the deuterium target. Left: tagged category; Center: anti-tagged category; Right: hadron
pairs category. The dotted line goes along 〈p2T 〉 = p2T (h) (〈p2T 〉 =
∑
p2T /2) and the vertical dashed
line shows the minimum pT (∑
p2T ) used for the analysis.
The gluon polarization ∆gg
is determined using Eqs. 4.3, 4.5, and 4.6. The anti-tagged
category has sufficient statistics to allow extraction of ∆gg
in four pT (beam) bins (1.0 - 1.2 -
1.5 - 1.8 - 2.5 GeV), which are obtained by combining the bins shown in Fig. 2 and table 9.
The other categories are represented by a single range in pT .
6.2 pT dependence of ∆gg
If the dependence of ∆gg(x, µ2) on x and µ2 is weak in the limited kinematic range of the
experiment, ∆gg(x) can be factored from the r.h.s of Eqs. 4.5, so that together with Eqs.
4.6 we obtain for the gluon polarization averaged over the covered x and µ2 ranges
〈∆g
g〉(pT ) ≡
Ameas(pT )−RBGABGMC(pT )
RSIG(pT )
⟨
a(s, t, µ2, Q2)∆fγ∗a (xa,µ2)
fγ∗a (xa,µ2)
⟩SIG
(pT )
, (6.1)
where the subprocess fractions and kinematics are determined using Pythia. As is shown
in Fig. 13, different ranges in pT correspond to different ranges and distributions in x. It is
intrinsic to this method that there is no knowledge on the dependence of ∆gg
on x, therefore
no meaningful value of the average x can be determined by this method, which nevertheless
can be used as a consistency check between the different independent data sets.
– 24 –

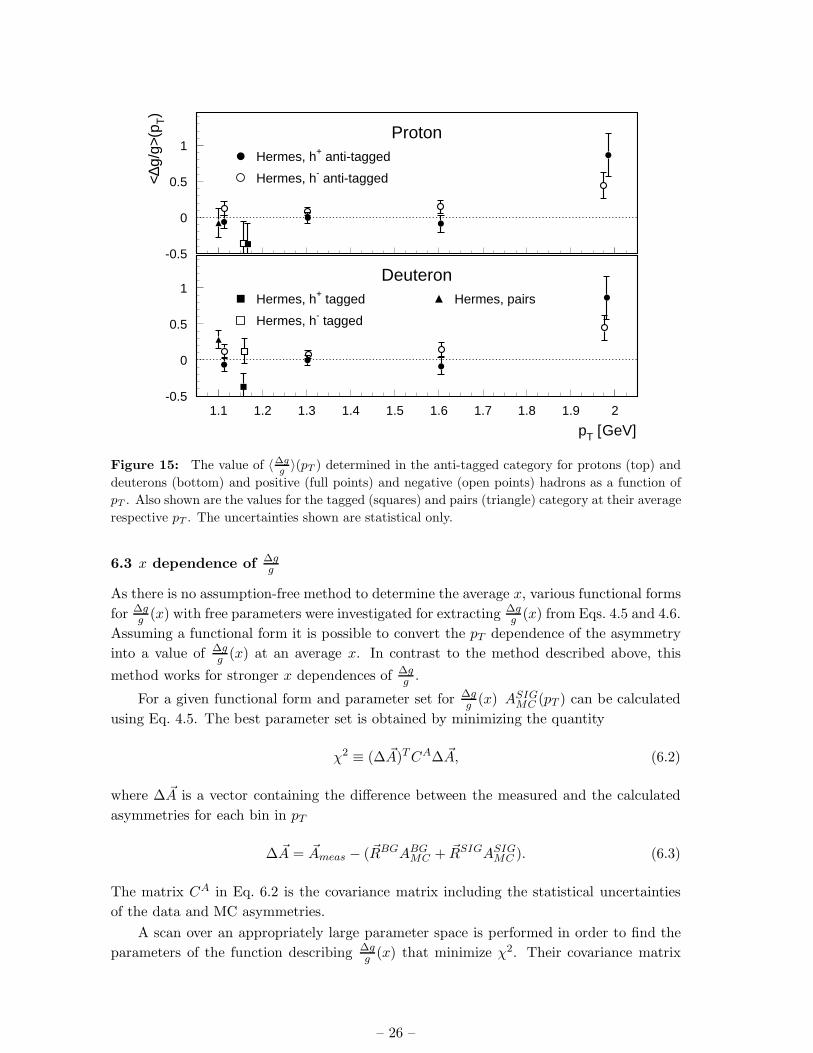
The results for different event categories, targets and hadron charges are listed in
table 4 and shown in Fig. 15 as a function of pT . The results for the pairs category
are displayed at the average√
∑
p2T /2, and those for the tagged category at the average
pT (γ∗). Each of these data sets has a somewhat different mixture of background and signal
processes as a function of pT , as seen in Figs. 10-12. The measured values of 〈∆gg〉(pT )
should be equal for both targets and both hadron charges because of the same range in
x and µ2. The values shown in Fig. 15 within each category and for each pT (beam) bin
indeed agree in general within the statistical uncertainties. This is a strong indication that
Pythia provides a consistent description of the underlying physics. The systematic charge
dependence is accounted for by assigning a systematic uncertainty to the value of the pfragT
(Pythia parameter PARJ(21)).
In [29] the kinematic selections for the hadron pairs used to calculate the asymme-
try to extract ∆gg(x) was ph1
T > 1.5 GeV and ph2
T > 0.8 GeV. These events are mostly
contained in the event sample used to calculate the asymmetry in the left panel of fig. 4
if∑
(p2T (beam))min
= ph1T (beam))
2 + (ph2T (beam))
2 > 3.0 GeV2 is required. The asymmetry
for hadron pairs with∑
(p2T (beam))min
> 3.0 GeV2 presented here is statistically consistent
with the average asymmetry for ph1
T > 1.5 GeV and ph2
T > 0.8 GeV from [29]. The difference
for 〈∆gg〉(pT ) obtained for the inclusive pairs of hadrons in this paper compared to the result
presented in [29] can be explained by the different treatment of the underlying signal and
background subprocesses contributing to the asymmetry and the difference in kinematic
selections of the hadron pairs used calculating the asymmetry. The model presented in
[29] used only 2 subprocesses (PGF and QCDC) to describe the measured negative asym-
metry for the proton target. For the determination of the subprocess fractions also the
VMD process was considered, which was treated to have no subprocess asymmetry, which
is consistent with the model used in this paper. The resulting subprocess fraction for PGF
in [29] is bigger than from the model presented in this paper. This combined with the pos-
itive asymmetry for the QCDC subprocess leads to the sizable positive gluon polarization
reported in [29] (Note: a(s, t, µ2, Q2) is negative for PGF in the probed kinematics).
Proton Deuteron
〈pT 〉 (GeV) h+ h− h+ h−
anti-tagged
1.11 −0.076 ± 0.150 0.201 ± 0.162 −0.063 ± 0.096 0.125 ± 0.096
1.30 0.011 ± 0.120 0.125 ± 0.103 −0.005 ± 0.073 0.080 ± 0.059
1.60 0.116 ± 0.195 0.619 ± 0.174 −0.087 ± 0.119 0.149 ± 0.093
1.98 0.722 ± 0.563 0.154 ± 0.289 0.865 ± 0.297 0.446 ± 0.178
tagged
1.16 −0.373 ± 0.293 −0.363 ± 0.302 −0.372 ± 0.191 0.119 ± 0.174
pairs
1.10 −0.079 ± 0.196 0.282 ± 0.122
Table 4: Results for 〈∆gg〉(pT ) for the three categories of events, both targets and hadron charges.
Only statistical uncertainties are shown.
– 25 –
-0.5
0
0.5
1Proton
Hermes, h+ anti-tagged
Hermes, h- anti-tagged<∆g/
g>(p
T)
-0.5
0
0.5
1
1.1 1.2 1.3 1.4 1.5 1.6 1.7 1.8 1.9 2
Hermes, h+ tagged
Hermes, h- tagged
Hermes, pairs
Deuteron
pT [GeV]
Figure 15: The value of 〈∆g
g〉(pT ) determined in the anti-tagged category for protons (top) and
deuterons (bottom) and positive (full points) and negative (open points) hadrons as a function of
pT . Also shown are the values for the tagged (squares) and pairs (triangle) category at their average
respective pT . The uncertainties shown are statistical only.
6.3 x dependence of ∆gg
As there is no assumption-free method to determine the average x, various functional forms
for ∆gg(x) with free parameters were investigated for extracting ∆g
g(x) from Eqs. 4.5 and 4.6.
Assuming a functional form it is possible to convert the pT dependence of the asymmetry
into a value of ∆gg(x) at an average x. In contrast to the method described above, this
method works for stronger x dependences of ∆gg.
For a given functional form and parameter set for ∆gg(x) ASIG
MC (pT ) can be calculated
using Eq. 4.5. The best parameter set is obtained by minimizing the quantity
χ2 ≡ (∆ ~A)TCA∆ ~A, (6.2)
where ∆ ~A is a vector containing the difference between the measured and the calculated
asymmetries for each bin in pT
∆ ~A = ~Ameas − (~RBGABGMC + ~RSIGASIG
MC ). (6.3)
The matrix CA in Eq. 6.2 is the covariance matrix including the statistical uncertainties
of the data and MC asymmetries.
A scan over an appropriately large parameter space is performed in order to find the
parameters of the function describing ∆gg(x) that minimize χ2. Their covariance matrix
– 26 –

CF is determined from the distribution of probabilities Pk at each scan point k:
CFij =
∑
k (θik − θmaxi )
(
θjk − θmaxj
)
Pk∑
k Pk. (6.4)
In this expression, θik is the value of parameter i at point k, while θmaxi is the value of
parameter i with the maximum probability. The probabilities Pk can be evaluated from
the χ2 cumulative distribution function. The advantage of this scan procedure is that it
ensures finding the global minimum and enables the determination of the average x of the
measurement using the extracted shape of ∆gg.
This determination of ∆gg(x) can be done only for the anti-tagged category because of
the necessity of having several bins in pT . In order to satisfy the fundamental requirement
for ∆gg(x) to vanish at x = 0 the functions are required to behave asymptotically as ∆g
g(x) →
x as x → 0. In addition, limx→1
∆g
g(x) → 1 was required [78]. Omitting this constraint does
not significantly change the results. The small number of pT (beam) bins available limits the
choice of the functional forms to those with no more than two free parameters. Several
functional forms were studied, and the following two selected:
fct. 1: x(1 + p1(1− x)2),
fct. 2: x(1 + p1(1− x)2 + p2(1− x)3).
The parameters are restricted such that the LO positivity constraint: |∆gg(x)| < 1 is sat-
isfied. Figure 16 compares the pT dependence of the measured asymmetry with the
asymmetry calculated using the functional forms fitted to the measured asymmetries us-
ing Eqs. 4.3 and 4.5. The χ2 per degree of freedom is large for both functions because
of the discrepancy between the measured and calculated asymmetries in the highest pTbin. No functional form was found that also accommodates the fourth data point within
the statistical uncertainty. Systematic uncertainties of the Monte Carlo simulation (see
Sect. 6.4) have not been used in this minimization; including them would reduce the χ2
value significantly.
Figure 17 shows the two functional forms of ∆gg(x) and their statistical uncertainties.
The parameter value and uncertainties for fct. 1 are given in table 5. The light shaded
area represents the full x range spanned by the data, 0.07 < x < 0.7 (see Fig. 13). The
dark shaded area represents the range of x spanned by preponderance of the data as seen
in Fig. 13. Although there are considerable differences in the ∆gg(x) functional forms over
the full x range, the resulting Monte Carlo asymmetries are not very different, as can be
seen from Fig. 16. From the behavior of the measured asymmetries together with the
variation of the x-distribution (see Fig. 13) with pT (beam) it can be seen that any smooth
function that describes the data leads to ∆gg(x) for x < 0.2 either small and positive or
slightly negative, and significantly positive at larger x. However, no function with so few
parameters is able to describe the sudden change of ∆gg(x) at x ≈ 0.2 required to match
the measured asymmetry in the largest pT (beam) bin. The average ∆gg
is determined using
the resulting ∆gg(x)
– 27 –

[GeV]T(beam)
p1 1.2 1.4 1.6 1.8 2
A
-0.04
-0.02
0
0.02
0.04
0.06
0.08
/ndf = 12.7/32χMC (1 par. fct.), /ndf = 8.0/22χMC (2 par. fct.),
Hermes
X± h→ed
Figure 16: Measured asymmetries with statistical uncertainties in four pT bins for the anti-tagged
category and a deuterium target, compared to calculated asymmetries using the two functions.
〈∆g
g〉 ≡
∆g
g(〈x〉) =
NSIG∑
k=1
ak(s, t, µ2, Q2)
∆fγ∗
a (xka, µ2)
fγ∗
a (xka, µ2)
∆g
g(xk)
NSIG∑
k=1
ak(s, t, µ2, Q2)
∆fγ∗
a (xka, µ2)
fγ∗
a (xka, µ2)
, (6.5)
where the sum is over all MC hadrons k in the pT range 1 GeV < pT < 2.5 GeV. This
average determines the average 〈x〉 of the distribution probed by this measurement using
the mean value theorem for integration, i.e., 〈x〉 is the value of x at which 〈∆gg〉 ≡ ∆g
g(〈x〉).
Figure 18 shows the total uncertainty (light gray band) of ∆gg(x) vs. x evaluated with
fct. 1 in the pT range 1.0 GeV < pT < 2.5 GeV and ∆gg(〈x〉). The difference between
fct. 1 and fct. 2 is assigned as an additional systematic uncertainty on the results from
fct. 1 included in sys−models (see Sect. 6.4). The values of 〈x〉 determined from the two
functions differ by only 0.007.
The value for the gluon polarization extracted for the anti-tagged category from the
deuterium target at 〈x〉 = 0.22 and a scale 〈µ2〉 = 1.35 GeV2 is∆gg(〈x〉, 〈µ2〉) = 0.049 ± 0.034(stat) ± 0.010(sys-exp)+0.126
−0.099(sys-models).
The scale 〈µ2〉 was determined by averaging over the scale of all signal MC events. The
details on the systematic uncertainties are listed in table 5.
– 28 –

x-210 -110
g/g(
x)∆
-0.2
0
0.2
0.4
0.6
0.8
1
)2(1-x)1
g/g(x)=x(1+p∆
)3(1-x)2
+p2(1-x)1
g/g(x)=x(1+p∆
Figure 17: Functional forms used with the values and statistical uncertainty bands from the fits.
Light shaded area: the total x range spanned by the data (see Fig. 13); dark shaded area: the range
in x where the preponderance of the data lies.
6.4 Systematic uncertainties of ∆gg
6.4.1 Pythia, Jetset, and helicity-dependent (averaged) PDFs
At present there is no Monte Carlo code available beyond leading order that models all
subprocesses relevant at the kinematics of this experiment. Therefore this analysis is
limited to leading order. As explained in Sect. 5.1, the Pythia model was significantly im-
proved to better describe the Hermes helicity-averaged data over a wide kinematic range.
The model contributions to the systematic uncertainty (‘sys − models′) are determined
by varying the parameters controlling the helicity-averaged and helicity-dependent PDFs,
the Pythia subprocess cross sections and Jetset fragmentation process, and the low-pTasymmetry. An individual uncertainty contribution is determined as the difference between∆gg
with the standard setting and ∆gg
obtained with the alternate setting. Related types of
uncertainties are grouped in classes: ‘parton distribution functions’, ‘Pythia parameters’,
‘low-pT asymmetry’, and ‘fit function fct. 2’. All the individual and combined uncertainties
are shown in table 5.
For most types of uncertainties within a class, e.g., helicity-dependent nucleon PDFs,
the uncertainty is conservatively estimated to be the maximum deviation appearing among
the alternative models tested. Within a class these maximum differences are added in
quadrature to form the ‘Total’ uncertainty for each class. The ‘Total sys-models’ uncer-
tainty is obtained by adding those of all classes linearly, because of the complexity of
correlations between them.
Each of the classes investigated is motivated and discussed below.
– 29 –

x0.1 0.15 0.2 0.25 0.3 0.35 0.4
g/g(
x)∆
-0.2
0
0.2
0.4
0.6
0.8
g/g(<x>)∆Hermes,
total uncertainty
Figure 18: The light gray band shows the total uncertainty of ∆g
g(x) vs. x with the statistical
and total systematic uncertainty (see Table 5) added in quadrature. Note that the total systematic
uncertainty contains a component accounting for the difference between fct. 1 and fct. 2. The point
shown represents ∆g
g(〈x〉) at 〈x〉 = 0.22. The inner error bar represents the statistical uncertainty
and the outer the total uncertainty obtained by adding statistical and total systematic uncertainty
in quadrature.
• Parton distribution functions
Spin-dependent nucleon PDFs
The alternative parameterizations for the quark helicity distributions to GRSV, which
were used are: GS-B [79], BB-06 [80], which includes the most recent g1 data from
Refs. [2, 17], and the GRSV standard scenario [73]. The GS-B and BB-06 parame-
terizations result in deviations, which are the second largest systematic uncertainty.
They are of opposite sign and similar magnitude. The third alternative has a negli-
gible effect.
Spin-dependent photon PDFs
Alternative parameterizations chosen are the maximum and minimum scenarios of
GRS [75, 76]. The resulting deviations are of opposite sign and similar magnitude
and make a significant contribution to the overall uncertainty.
Spin-averaged nucleon PDFs
Using the alternative parameterization GRV98 [74] for the spin-averaged quark and
gluon distributions results in a small deviation.
Spin-averaged photon PDFs
The alternative parameterization is GRS [77], which results in a small deviation.
– 30 –
• Pythia parameters
According to the discussion in Sect. 5.2 the following Pythia and Jetset parameters
have been varied around their central values: PARP(91) and PARP(99), respectively
the initial kT of the partons in the nucleon and photon, are varied together; PARJ(21),
which regulates pfragT , where the upper and lower values correspond to an increase
of χ2std by 1 unit with respect to the standard setting [66]; PARP(34), which is the
multiplicative factor for the factorization and renormalization scales (PARP(34) µ2).
The scale in the calculation of the asymmetries was varied accordingly. In order
to vary the subprocess fractions directly PARP(90) was varied. It is a parameter
regulating the cutoff pTmin= PARP (81)
(
WPARP (89)
)PARP (90)between direct and
anomalous processes as well as soft and hard GVMD processes.
The combined uncertainty of this class is comparable to that from the PDFs class,
with PARJ(21) being the largest single contribution.
• Low-pT asymmetry
The logical alternative to Alow−pT = D · A1 (which fits the HERMES low-pT data)
is to assume that at low pT any spin dependence is washed out, e.g., Alow−pT = 0.
Any such reduction of the asymmetry would only affect the lowest two pT bins and
could only increase ∆gg.
• Fit function fct. 2
For the x dependence, there is an additional class corresponding to functions with
the shape of fct. 2.
6.4.2 Experimental systematics
The experimental systematic uncertainty is dominated by the fractional uncertainties in
beam and target polarization, as shown in table 1. They are added in quadrature and
amount to 3.9% for the asymmetry and 20% for ∆gg(〈x〉) from the deuterium target (shown
in tables 5 and 8).
Due to the rapid reversal of the target spin orientation (≈ 90 s) the asymmetry ex-
traction is independent of detector efficiency fluctuations. Possible false asymmetries due
to the luminosity normalization are found to be negligible.
6.5 Comparison to world data and models
Only a few results obtained in leptoproduction exist on ∆gg
at present [26, 30, 31, 32]. They
were obtained from experiments with widely different kinematics and they have different
scales µ2. Therefore, they cannot be easily compared. Nevertheless, for comparison the
measurements are shown together at their respective 〈x〉 value, neglecting the Q2 depen-
dence of ∆gg. The experimental results shown in Fig. 19 are all obtained in leptoproduction,
in LO analyses, although for different final states. The Hermes result is plotted with a
horizontal bar indicating the half width at half maximum of the x distribution from Fig. 13.
Fit function fct. 1 is shown for the full x range spanned by the Hermes data (see Figs. 19
– 31 –

Kinematics 〈x〉 0.217
〈µ2〉 (GeV2) 1.353
∆g/g p1x value 0.049 -1.283
dependence statistical uncertainty 0.034 0.083
Systematic Uncertainties
Category Model δ(∆g/g) δp1
helicity-dependent BB-06 0.029 0.250
Nucleon PDF GS-B 0.007 0.055
GRSV-val 0.006 0.055
helicity-dependent GRV(max) 0.024 0.245
Photon PDF GRV(min) -0.019 -0.195
Nucleon PDF GRV98 -0.005 -0.150
Photon PDF GRS 0.004 0.055
Pythia PARP(90)=0.14 -0.017 -0.140
parameters PARP(90)=0.18 0.007 0.040
PARP(91/99)=0.36 0.002 0.010
PARP(91/99)=0.44 -0.004 -0.025
PARJ(21)=0.38 0.021 0.170
PARJ(21)=0.42 -0.035 -0.290
PARP(34)=0.5 -0.014 -0.170
PARP(34)=2.0 0.016 0.170
low-pT asymmetry 0.046 0.395
Total PDFs ± 0.038 0.385
Total Pythia ± 0.042 0.365
fit function fct. 2 -0.018
Total sys-models + 0.126 1.145
Total sys-models − 0.099 0.749
Experimental Systematic 0.010 0.040
Table 5: Average kinematics and results for ∆g
g(x) and the parameter p1 for fct. 1 with their
statistical and systematic uncertainties, from deuteron data for anti-tagged events and for the full
range in pT . For most types of uncertainties within a class, e.g., helicity-dependent nucleon PDFs,
the uncertainty is conservatively estimated to be the maximum deviation appearing among the
alternative models tested. Within a class (separated box),these maximum differences are added in
quadrature to form the ‘Total’ uncertainty for each class, and referred to as ‘Total PDFs’ and ‘Total
PYTHIA’. These components, the ‘low-pT asymmetry’ and the ‘fit function fct. 2’ uncertainties are
added linearly to form the ‘Total sys-models’ uncertainty.
and 17). The statistical precision of the Hermes result is the best currently available.
The published Compass result for high-pT hadron pairs in the region Q2 < 1 GeV2 [31]
has almost twice the statistical uncertainty. Concerning the systematic uncertainty the
Hermes result is solidly based on varying many parameters of the well-tuned Pythia sim-
– 32 –

ulation and a comparison of results from several event categories and targets. The other
results on ∆gg
[26, 30, 32] are characterized by much larger statistical uncertainties. The
earlier HERMES result of [29] is omitted, because the model used in this paper neglects
important underlying subprocesses contributing to the signal and background asymmetries
in the kinematic region used to extract ∆gg(x) and no systematic uncertainty for the model
used was determined. Altogether, the presently available experimental information from
leptoproduction clearly indicates small values of ∆gg
over the covered x range. This con-
clusion is consistent with the most recent results from polarized pp collisions from Phenix
[24] and Star [25].
x
∆g/g
SMC
Compass (Q2 < 1 GeV2)
Compass (Q2 > 1 GeV2)
Compass (Open Charm)
HERMES
DSSV
BB-09
HERMES fct. 1
-0.8
-0.6
-0.4
-0.2
0
0.2
0.4
0.6
0.8
10-2
10-1
1
Figure 19: The gluon polarization ∆g
g(〈x〉) fromHermes extracted with fct. 1 (〈x〉 = 0.22, 〈µ2〉 =
1.35GeV2) compared to the ones from Compass [31, 32, 26] (low Q2: µ2 = 3 GeV2, high Q2:
µ2 = 2.4 GeV2, open charm: µ2 = 13 GeV2) and SMC [30] (µ2 = 3.6 GeV2) including statistical
uncertainties (inner error bars) and total uncertainties (outer error bars). The x region of the data
is indicated by the horizontal bars. Fit function fct. 1 is shown over the full x range spanned by
the Hermes data. Also shown are a sample of curves from NLO pQCD fits DSSV, and BB-09) at
µ2 = 1.5 GeV2. For clarity only the central values are shown.
Also shown in Fig. 19 is ∆gg(x, µ2) calculated from two NLO pQCD fits, obtained as the
– 33 –
ratio of the helicity-dependent PDFs (DSSV [6], and BB-09 [81] ) to the helicity-averaged
PDFs (MRST02 [82] and DR-09 [83], respectively). The BB-09 NLO pQCD fit is based
on the inclusive DIS world data set. The DSSV NLO pQCD fit includes the world data
on inclusive, semi-inclusive DIS and polarised proton proton scattering. The existing data
obtained in leptoproduction on ∆gg(x) disfavor large magnitudes of the gluon polarization
over the measured x range, in agreement with NLO-QCD fits by DSSV [6].
7. Summary
The gluon polarization in the nucleon has been determined by measuring the longitudi-
nal double-spin asymmetry of high-pT electro-produced single inclusive hadrons at Her-
mes on a deuterium target. The value of ∆gg
has been extracted using the measured
asymmetries along with the subprocesses fractions, asymmetries and kinematics for the
signal and background processes calculated using the leading-order Pythia Monte Carlo
code. The value of ∆gg
is obtained from the product of gluon polarization and subpro-
cess asymmetries summed over a wide range in x. The values of 〈∆gg〉(pT ) and ∆g
g(x)
were determined independently. The systematic uncertainty was evaluated by varying
Pythia parameters and models of background asymmetries. The final result for the av-
erage gluon polarization in the pT range 1.0 GeV < pT < 2.5 GeV is ∆gg(〈x〉, 〈µ2〉) =
0.049±0.034(stat)±0.010(sys-exp)+0.126−0.099(sys-models) at 〈x〉 = 0.22 and 〈µ2〉 = 1.35 GeV2.
Acknowledgments
We thank J. Blumlein, M. Stratmann and W. Vogelsang for helpful discussions and one of
us RBRC for financial support. We gratefully acknowledge the Desy management for its
support and the staff at Desy and the collaborating institutions for their significant effort.
This work was supported by the FWO-Flanders and IWT, Belgium; the Natural Sciences
and Engineering Research Council of Canada; the National Natural Science Foundation of
China; the Alexander von Humboldt Stiftung; the German Bundesministerium fur Bildung
und Forschung (BMBF); the Deutsche Forschungsgemeinschaft (DFG); the Italian Istituto
Nazionale di Fisica Nucleare (INFN); the MEXT, JSPS, and G-COE of Japan; the Dutch
Foundation for Fundamenteel Onderzoek der Materie (FOM); the U.K. Engineering and
Physical Sciences Research Council, the Science and Technology Facilities Council, and
the Scottish Universities Physics Alliance; the U.S. Department of Energy (DOE) and
the National Science Foundation (NSF); the Russian Academy of Science and the Russian
Federal Agency for Science and Innovations; and the Ministry of Economy and the Ministry
of Education and Science of Armenia.
– 34 –
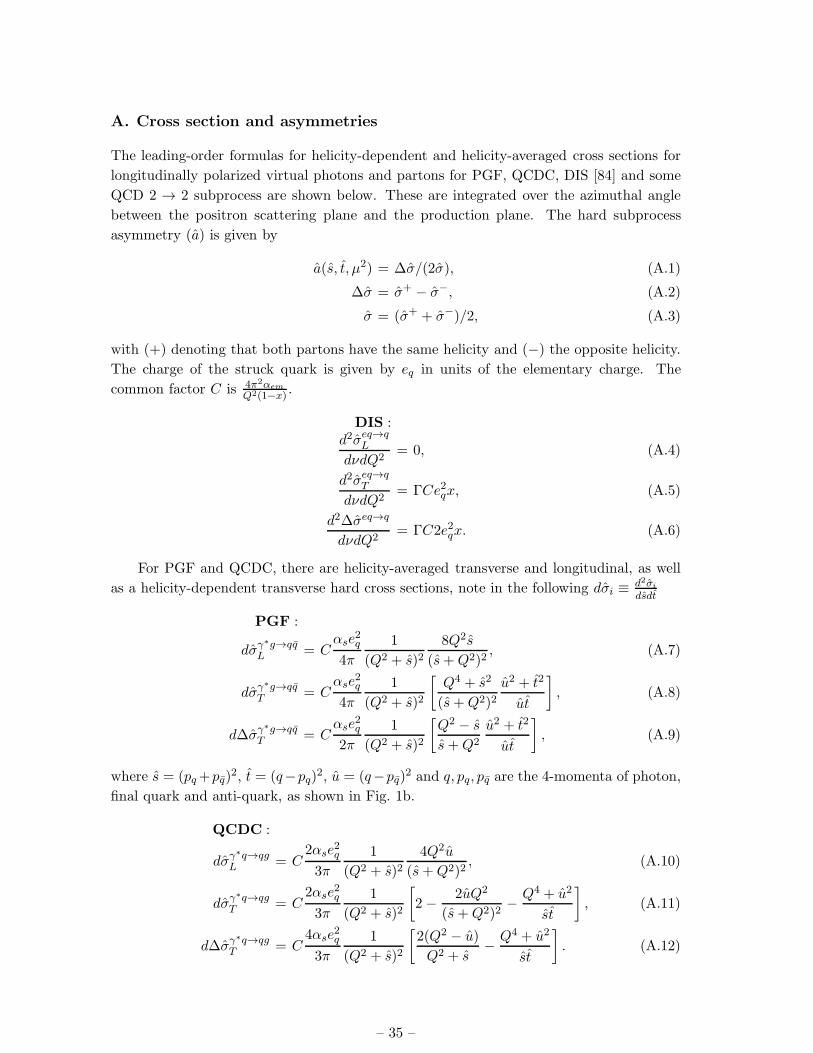
A. Cross section and asymmetries
The leading-order formulas for helicity-dependent and helicity-averaged cross sections for
longitudinally polarized virtual photons and partons for PGF, QCDC, DIS [84] and some
QCD 2 → 2 subprocess are shown below. These are integrated over the azimuthal angle
between the positron scattering plane and the production plane. The hard subprocess
asymmetry (a) is given by
a(s, t, µ2) = ∆σ/(2σ), (A.1)
∆σ = σ+ − σ−, (A.2)
σ = (σ+ + σ−)/2, (A.3)
with (+) denoting that both partons have the same helicity and (−) the opposite helicity.
The charge of the struck quark is given by eq in units of the elementary charge. The
common factor C is 4π2αem
Q2(1−x).
DIS :d2σeq→q
L
dνdQ2= 0, (A.4)
d2σeq→qT
dνdQ2= ΓCe2qx, (A.5)
d2∆σeq→q
dνdQ2= ΓC2e2qx. (A.6)
For PGF and QCDC, there are helicity-averaged transverse and longitudinal, as well
as a helicity-dependent transverse hard cross sections, note in the following dσi ≡d2σi
dsdt
PGF :
dσγ∗g→qqL = C
αse2q
4π
1
(Q2 + s)28Q2s
(s+Q2)2, (A.7)
dσγ∗g→qqT = C
αse2q
4π
1
(Q2 + s)2
[
Q4 + s2
(s+Q2)2u2 + t2
ut
]
, (A.8)
d∆σγ∗g→qqT = C
αse2q
2π
1
(Q2 + s)2
[
Q2 − s
s+Q2
u2 + t2
ut
]
, (A.9)
where s = (pq+pq)2, t = (q−pq)
2, u = (q−pq)2 and q, pq, pq are the 4-momenta of photon,
final quark and anti-quark, as shown in Fig. 1b.
QCDC :
dσγ∗q→qgL = C
2αse2q
3π
1
(Q2 + s)24Q2u
(s+Q2)2, (A.10)
dσγ∗q→qgT = C
2αse2q
3π
1
(Q2 + s)2
[
2−2uQ2
(s+Q2)2−
Q4 + u2
st
]
, (A.11)
d∆σγ∗q→qgT = C
4αse2q
3π
1
(Q2 + s)2
[
2(Q2 − u)
Q2 + s−
Q4 + u2
st
]
. (A.12)
– 35 –

Reaction dσ/dt d∆σ/dt
qg → qg (s2 + u2)[ 1t2− 4
9su ] 2(u2 − s2)[ 49su − 1
t2]
qg → qg (s2 + u2)[ 1t2− 4
9su ] 2(u2 − s2)[ 49us −
1t2]
gg → qq u2+t2
6ut− 3
8t2+u2
s234t2+u2
s2− u2+t2
3ut
gg → gg 92(3−
tus2
− sut2
− stu2 ) 9(−3 + 2 s2
ut+ ut
s2)
qaqb → qaqb49 [
s2+u2
t2+ δab(
s2+t2
u2 − 2s2
3tu)] 8
9 [s2−u2
t2− δab(
t2−s2
u2 + 2s2
3tu)]
qaqb → qcqd49 [δacδbd
u2
t2+ δcdδab
t2+u2
s2− 8
9 [−δacδbdu2
t2− δcdδab
t2+u2
s2+
δadδcd2u2
3st+ δabδbd
s2
t2] δadδcd
2u2
3st+ δabδbd
s2
t2]
qq → gg 3227
t2+u2
ut− 8
3t2+u2
s2−64
27t2+u2
ut+ 16
3t2+u2
s2
Table 6: Subprocess differential cross sections (∆)σab→cd for parton-parton interactions. The
common factor ofπα2
s
s2has been omitted.
For hard QCD 2 → 2 processes the formulas [85] relevant in this analysis are given in
Tab. 6.
For lepton scattering, the helicity-dependent and helicity-averaged cross sections are
given by
d4∆σeq→e′ff
dνdQ2dsdt= DΓT
d2∆σγ∗q→ffT
dsdt, (A.13)
d4σeq→e′ff
dνdQ2dsdt= ΓT (
d2σγ∗q→ffT
dsdt+ ǫ ·
d2σγ∗q→ffL
dsdt), (A.14)
where f stands for a quark, an antiquark or a gluon in the final state and D is the virtual-
photon depolarization factor
D(y,Q2) =y[(
1 + γ2y/2)
(2− y)− 2y2m2e/Q
2]
y2 (1− 2m2e/Q
2) (1 + γ2) + 2(1 +R) (1− y − γ2y2/4), (A.15)
γ2 = Q2/ν2, R = σL/σT for the subprocess, and ΓT is the transverse photon flux factor
ΓT =αem(1− x)
2πQ2ν
[
y2(
1− 2m2e/Q
2)
+2(
1− y − γ2y2/4)
1 + γ2
]
, (A.16)
and
ǫ =
[
1 +1
2
(
1− 2m2e/Q
2) y2 + γ2y2
1− y − γ2y2/4
]−1
. (A.17)
– 36 –

B. Tuned Pythia parameters
MSEL=2 MSTP(13)=2 MSTP(17)=6 MSTP(20)=4
MSTP(38)=4 MSTP(61)=0 MSTP(71)=0 MSTP(81)=0
MSTP(92)=4 MSTP(101)=1 MSTP(121)=1
PARP(2)=7 PARP(18)=0.17 PARP(91)=0.40 PARP(93)=2
PARP(99)=0.40 PARP(102)=0.5 PARP(103)=0.5 PARP(104)=0.3
PARP(111)=0 PARP(121)=2 PARP(161)=3.00 PARP(162)=24.6
PARP(163)=18.8 PARP(165)=0.477 PARP(166)=0.676
PARJ(1)=0.029 PARJ(2)=0.283 PARJ(3)=1.20 PARJ(21)=0.40
PARJ(41)=1.94 PARJ(42)=0.544 PARJ(45)=1.05
MSTJ(12)=1 MSTJ(45)=4
MSTU(112)=4 MSTU(113)=4 MSTU(114)=4
CKIN(1)=1.0 CKIN(65)=1. · 10−9 CKIN(66)=100.
Table 7: The PYTHIA parameters, tuned to HERMES data, which are different from the default
settings that can be found in Ref. [49].
– 37 –

C. Systematic Uncertainties
pT bin (GeV) 1.0-1.2 1.2-1.5 1.5-1.8 1.8-2.5 1.0-2.5
Kinematics 〈pT 〉 (GeV) 1.11 1.30 1.60 1.90 1.20
Values
pT ∆g/g 0.017 0.033 0.026 0.619 0.055
dependence δ(∆g/g)(stat) 0.067 0.046 0.073 0.154 0.033
Systematic Uncertainties
Category Model δ(∆g/g)
spin-dependent BB-06 0.038 0.019 0.026 0.089 0.027
Nucleon PDF GS-B −0.030 −0.031 −0.045 −0.104 −0.037
GRSV-val 0.007 0.005 0.008 0.001 0.006
spin-dependent GRV(max) 0.027 0.019 0.014 0.060 0.025
Photon PDF GRV(min) −0.019 −0.016 −0.013 −0.069 −0.020
Nucleon PDF GRV98 0.020 −0.008 −0.031 −0.144 −0.006
Photon PDF GRS 0.029 0.001 −0.018 0.100 0.004
Pythia PARP(90)=0.14 −0.006 −0.017 0.003 −0.076 −0.016
Parameters PARP(90)=0.18 0.023 −0.006 −0.018 0.014 0.008
PARP(91/99)=0.36 0.002 −0.002 0.002 −0.058 −0.001
PARP(91/99)=0.44 0.004 −0.009 0.002 −0.011 −0.002
PARJ(21)=0.38 0.036 0.018 0.031 0.110 0.021
PARJ(21)=0.42 −0.023 −0.040 −0.032 −0.072 −0.034
PARP(34)=0.5 0.017 −0.006 −0.024 −0.187 −0.014
PARP(34)=2.0 −0.013 0.012 0.012 0.210 0.012
low-pT asymmetry 0.108 0.037 0.009 0.005 0.046
Total PDFs ± 0.058 0.038 0.059 0.215 0.045
Total Pythia± 0.047 0.038 0.047 0.258 0.033
Total sys-Models + 0.212 0.113 0.116 0.473 0.124
Total sys-Models − 0.105 0.076 0.107 0.477 0.078
Experimental Systematic 0.003 0.006 0.009 0.002 0.011
Table 8: Average kinematics and results for 〈∆g
g〉(pT ) with their statistical and systematic uncer-
tainties, from deuteron data for anti-tagged events shown for the four bins and the full range in pT .
For most types of uncertainties within a class, e.g., spin-dependent nucleon PDFs, the uncertainty
is conservatively estimated to be the maximum deviation appearing among the alternative models
tested. Within a class (separated box), these maximum differences are added in quadrature to
form the ‘Total’ uncertainty for each class, and referred to as ‘Total PDFs’ and ‘Total PYTHIA’.
These components and the ‘Alow−pT ’ uncertainties are added linearly into the ‘Total sys-Models’
uncertainty.
– 38 –

D. Hadron Asymmetries
pT -bin 〈pT 〉 deuterium hydrogen
(GeV) (GeV) Ameas(h+) Ameas(h−) Ameas(h+) Ameas(h−)
0.00–0.15 0.12 0.0002 ± 0.0011 -0.0028 ± 0.0011 0.0152 ± 0.0018 0.0109 ± 0.0020
0.15–0.30 0.23 -0.0013 ± 0.0004 -0.0023 ± 0.0004 0.0107 ± 0.0007 0.0081 ± 0.0008
0.30–0.45 0.37 -0.0032 ± 0.0004 -0.0042 ± 0.0004 0.0098 ± 0.0007 0.0080 ± 0.0008
0.45–0.60 0.52 -0.0029 ± 0.0006 -0.0055 ± 0.0006 0.0101 ± 0.0009 0.0095 ± 0.0011
0.60–0.75 0.67 -0.0038 ± 0.0008 -0.0037 ± 0.0009 0.0127 ± 0.0014 0.0119 ± 0.0017
0.75–0.90 0.81 0.0005 ± 0.0012 -0.0027 ± 0.0015 0.0146 ± 0.0021 0.0105 ± 0.0026
0.90–1.05 0.96 -0.0003 ± 0.0019 -0.0007 ± 0.0023 0.0166 ± 0.0033 0.0088 ± 0.0043
1.05–1.20 1.11 0.0069 ± 0.0032 -0.0033 ± 0.0038 0.0351 ± 0.0055 0.0091 ± 0.0071
1.20–1.35 1.26 0.0150 ± 0.0054 -0.0021 ± 0.0063 0.0563 ± 0.0094 0.0167 ± 0.0118
1.35–1.50 1.41 0.0174 ± 0.0091 0.0062 ± 0.0104 0.0487 ± 0.0157 0.0035 ± 0.0197
1.50–1.65 1.56 0.0429 ± 0.0148 -0.0017 ± 0.0172 0.0886 ± 0.0256 -0.0759 ± 0.0327
1.65–1.80 1.71 0.0719 ± 0.0238 -0.0001 ± 0.0277 0.1317 ± 0.0412 -0.0398 ± 0.0530
1.80–2.00 1.88 -0.0075 ± 0.0342 -0.0027 ± 0.0410 0.1605 ± 0.0596 0.0428 ± 0.0776
2.00–2.50 2.16 0.0377 ± 0.0463 -0.0908 ± 0.0572 0.1071 ± 0.0807 0.0575 ± 0.1128
2.50–5.00 3.04 -0.0071 ± 0.0817 0.1201 ± 0.0960 0.0112 ± 0.1405 -0.0102 ± 0.1546
Table 9: Anti-tagged inclusive hadrons: measured longitudinal double-spin asymmetry for positive
and negative hadrons on a deuterium (hydrogen) target. The uncertainty shown is statistical
only. There is an additional overall normalization uncertainty of 3.9% (5.2%), all other systematic
uncertainties are negligible.
– 39 –

pT -bin 〈pT 〉 deuterium hydrogen
(GeV) (GeV) Ameas(h+) Ameas(h−) Ameas(h+) Ameas(h−)
0.00–0.15 0.10 0.0229 ± 0.0045 0.0159 ± 0.0050 0.0896 ± 0.0073 0.0643 ± 0.0089
0.15–0.30 0.23 0.0201 ± 0.0029 0.0120 ± 0.0033 0.0850 ± 0.0048 0.0605 ± 0.0058
0.30–0.45 0.37 0.0188 ± 0.0031 0.0134 ± 0.0036 0.0807 ± 0.0053 0.0479 ± 0.0064
0.45–0.60 0.52 0.0186 ± 0.0040 0.0134 ± 0.0048 0.0789 ± 0.0068 0.0639 ± 0.0085
0.60–0.75 0.67 0.0211 ± 0.0057 0.0066 ± 0.0068 0.0661 ± 0.0095 0.0494 ± 0.0122
0.75–1.00 0.85 0.0104 ± 0.0072 0.0106 ± 0.0088 0.0722 ± 0.0122 0.0683 ± 0.0159
1.00–1.30 1.11 0.0465 ± 0.0143 0.0367 ± 0.0176 0.1055 ± 0.0237 0.1318 ± 0.0314
1.30–1.60 1.40 0.0660 ± 0.0364 -0.0586 ± 0.0431 0.1410 ± 0.0607 0.0481 ± 0.0813
1.60–2.00 1.72 0.0165 ± 0.0903 -0.0390 ± 0.1086 0.0627 ± 0.1501 -0.0229 ± 0.2018
2.00–3.50 2.18 0.1534 ± 0.3059 0.3929 ± 0.3798 -1.5868 ± 0.9548 1.4778 ± 1.4182
Table 10: Tagged inclusive hadrons: measured longitudinal double-spin asymmetry for positive
and negative hadrons on a deuterium (hydrogen) target. The uncertainty shown is statistical
only. There is an additional overall normalization uncertainty of 3.9% (5.2%), all other systematic
uncertainties are negligible.
– 40 –

(∑
p2T (beam))min Ameas(hh)
(GeV2) hydrogen deuterium
1.00 0.023 ± 0.004 -0.005 ± 0.003
1.20 0.018 ± 0.006 -0.005 ± 0.003
1.40 0.016 ± 0.008 -0.000 ± 0.004
1.60 0.031 ± 0.010 0.001 ± 0.006
1.80 0.047 ± 0.013 -0.006 ± 0.007
2.00 0.041 ± 0.016 -0.010 ± 0.009
2.50 0.084 ± 0.028 -0.028 ± 0.015
3.00 -0.001 ± 0.045 -0.041 ± 0.025
4.00 0.042 ± 0.108 -0.080 ± 0.057
Table 11: Inclusive hadron pairs: measured longitudinal double-spin asymmetry for proton and
deuterium targets. The uncertainty shown is statistical only. There is an additional overall nor-
malization uncertainty of 5.2% (3.9%) for hydrogen (deuterium), all other systematic uncertainties
are negligible.
– 41 –
References
[1] R. Jaffe and A. Manohar, Nucl. Phys. B 337 (1990) 509.
[2] HERMES Collaboration, A. Airapetian, et al., Phys. Rev. D 75 (2007) 012007.
[3] COMPASS Collaboration, V. Y. Alexakhin, et al., Phys. Lett. B 647 (2007) 8.
[4] J. Blumlein, H. Bottcher, Nucl. Phys. B 636 (2002) 225.
[5] AAC Collaboration, M. Hirai, S. Kumano, N. Saito, Phys. Rev. D 74 (2006) 014015.
AAC Collaboration, M. Hirai, S. Kumano, N. Saito, Phys. Rev. D 69 (2004) 054021.
[6] D. de Florian, R. Sassot, M. Stratmann, W. Vogelsang, Phys. Rev. Lett. 101 (2008) 72001.
D. de Florian, R. Sassot, M. Stratmann, W. Vogelsang, Phys. Rev. D 80 (2009) 034030.
[7] E. Leader, A. Sidorov, D. Stamenov, Phys. Rev. D 75 (2007) 074027.
E. Leader, A. Sidorov, D. Stamenov, Phys. Rev. D 73 (2006) 034023.
[8] HERMES Collaboration, A. Airapetian, et al., Phys. Rev. D 71 (2005) 012003.
[9] EMC Collaboration, J. Ashman, et al., Phys. Lett. B 206 (1988) 364.
[10] E142 Collaboration, P. Anthony, et al., Phys. Rev. D 54 (1996) 6620.
[11] HERMES Collaboration, K. Ackerstaff, et al., Phys. Lett. B 404 (1997) 383.
[12] E154 Collaboration, K. Abe, et al., Phys. Rev. Lett. 79 (1997) 26.
[13] SMC Collaboration, B. Adeva, et al., Phys. Rev. D 58 (1998) 112001.
[14] E143 Collaboration, K. Abe, et al., Phys. Rev. D 58 (1998) 112003.
[15] E155 Collaboration, P. L. Anthony, et al., Phys. Lett. B 463 (1999) 339.
[16] E155 Collaboration, P. Anthony, et al., Phys. Lett. B 493 (2000) 19.
[17] COMPASS Collaboration, E. Ageev, et al., Phys. Lett. B 612 (2005) 154.
COMPASS Collaboration, V. Yu. Alexakhin, et al., Phys. Lett. B 647 (2007) 330.
[18] Hall A Collaboration, X. Zheng, et al., Phys. Rev. Lett 92 (2004) 012004.
[19] W. A. Bardeen, et al., Phys. Rev. D 18 (1978) 3998.
[20] Y. L. Dokshitzer, Sov. Phys. JETP 46 (1977) 641.
[21] V. N. Gribov, L. N. Lipatov, Sov. J. Nucl. Phys. 15 (1972) 438.
[22] G. Altarelli, G. Parisi, Nucl. Phys. B 126 (1977) 298.
[23] E704 Collaboration, D. L. Adams, et al., Phys. Lett. B 261 (1991) 197.
[24] PHENIX Collaboration, S. S. Adler, et al., Phys. Rev. Lett. 93 (2004) 202002.
PHENIX Collaboration, S. S. Adler, et al., Phys. Rev. D 73 (2006) 091102.
PHENIX Collaboration, A. Adare, et al., Phys. Rev. D 76 (2007) 051106.
PHENIX Collaboration, A. Adare, et al., Phys. Rev. Lett. 103 (2009) 012003.
PHENIX Collaboration, A. Adare, et al., Phys. Rev. D 79 (2009) 012003.
[25] STAR Collaboration, B. I. Abelev, et al., Phys. Rev. Lett. 97 (2006) 252001.
STAR Collaboration, B. I. Abelev, et al., Phys. Rev. Lett. 100 (2008) 232003.
[26] COMPASS Collaboration, M. Alekseev, et al., hep-ex/0802.3023.
COMPASS Collaboration, M. Alekseev, et al., Phys. Lett. B 676 (2009) 31.
– 42 –

[27] COMPASS Collaboration, P. Abbon, et al., Nucl. Instrum. Meth. A 577 (2007) 455.
COMPASS Collaboration, G. Baum, et al., Common Muon and Proton Apperatus for
Structure and Spectroscopy, CERN/SPSLC 96-14 (1996).
[28] E155 Collaboration, P. Anthony, et al., Phys. Lett. B 458 (1999) 536.
[29] HERMES Collaboration, A. Airapetian, et al., Phys. Rev. Lett. 84 (2000) 2584.
[30] SMC Collaboration, B. Adeva, et al., Phys. Rev. D 70 (2004) 012002.
[31] COMPASS Collaboration, E. S. Ageev, et al., Phys. Lett. B 633 (2006) 25.
[32] COMPASS Collaboration, M. Stolarski, Measurements of ∆G/G from high transverse
momentum hadrons pairs in COMPASS, in: Proc. of the 16th International Workshop on
Deep Inelastic Scattering and QCD (DIS2008), April 7–April 11, 2008, London, UK, 2008,
209.
[33] P. Liebing, Can the gluon polarization in the nucleon be extracted from hermes data on
single high-pt hadrons, Ph.D. thesis, Universitat Hamburg (2004), DESY-THESIS-2004-036.
[34] V. Mexner, Determination of the gluon polarization in the nucleon, Ph.D. thesis, Universiteit
van Amsterdam, (December 2005).
[35] A. Sokolov and I. Ternov, Sov. Phys. Dokladi 8 (1964) 1203.
[36] M. Beckmann, et al., Nucl. Inst. & Meth. A 479 (2002) 334.
[37] D. Barber, et al., Nucl. Inst. & Meth. A 338 (1994) 166.
[38] A. Airapetian, et al., Nucl. Inst. & Meth. A 540 (2005) 68.
[39] A. Nass, et al., Nucl. Inst. & Meth. A 505 (2003) 633.
[40] C. Baumgarten, et al., Nucl. Inst. & Meth. A 482 (2002) 606.
[41] C. Baumgarten, et al., Nucl. Inst. & Meth. A 508 (2003) 268.
[42] T. Benisch, et al., Nucl. Inst. & Meth. A 471 (2001) 314.
[43] HERMES Collaboration, K. Ackerstaff, et al., Nucl. Inst. & Meth. A 417 (1998) 230.
[44] J. Brack, et al., Nucl. Inst. & Meth. A 469 (2001) 47.
[45] A. Andreev, et al., Nucl. Inst. & Meth. A 465 (2001) 482.
[46] N. Akopov, et al., Nucl. Inst. & Meth. A 479 (2002) 511.
[47] S. Bernreuther, et al., Nucl. Inst. & Meth. A 416 (1998) 45.
[48] H. Avakian, et al., Nucl. Inst. & Meth. A 417 (1998) 69.
[49] T. Sjostrand, L. Lonnbland, S. Mrenna, P. Skands, hep-ph/0108264.
[50] T. Sjostrand, et al., Comp. Phys. Comm. 135 (2001) 238.
[51] C. Friberg and T. Sjostrand, JHEP 09 (2000) 010.
C. Friberg, Aspects of qcd and the photon structure, Ph.D. thesis, Lund University (2000).
[52] M. Drees, R. Godbole, J. Phys. G 21 (1995) 1559.
[53] A. Donnachie, P. V. Landshoff, Phys. Lett. B 296 (1992) 227.
[54] G. A. Schuler, T. Sjostrand, Phys. Lett. B 300 (1993) 169.
– 43 –
[55] G. A. Schuler, T. Sjostrand, Nucl. Phys. B 407 (1993) 539.
[56] H. Fraas, Nucl. Phys. B 113 (1976) 532.
[57] N.I. Kochelev, et al., Phys. Rev. D 65 (2002) 097504.
[58] N.I. Kochelev, et al., Phys. Rev. D 67 (2003) 074014.
[59] HERMES Collaboration, A. Airapetian, et al., Phys. Lett. B 513 (2001) 301.
[60] B. Andersson, The Lund Model, Camb. Monogr. Part. Phys. Nucl. Phys. Cosmol. 7, 1997.
[61] H. Lai, et al., Eur. Phys. J. C 12 (2000) 375.
[62] G. A. Schuler, T. Sjostrand, Phys. Lett. B 376 (1996) 193.
[63] L. W. Mo, Y. S. Tsai, Rev. Mod. Phys. 41 (1969) 205.
[64] I. Akushevich, H. Bottcher, D. Ryckbosch, hep-ph/9906408.
[65] R. Brun, R. Hagelberg, M. Hansroul, J. Lassalle, CERN-DD-78-2-REV, (1978).
[66] A. Hillenbrand, Measurement and simulation of the fragmentation process at hermes, Ph.D.
thesis, Friedrich–Alexander–Universitat Erlangen–Nurnberg (2005), DESY-THESIS-2005-035.
[67] B. Jager, M. Stratmann, W. Vogelsang, Eur. Phys. J. C 44 (2005) 533.
[68] B. A. Kniehl, G. Kramer, B. Potter, Nucl. Phys. B 582 (2000) 514.
[69] M. Stratmann, Private communication.
[70] M. Anselmino, et al., Phys. Rev. D 71 (2005) 074006.
[71] J. Collins, H. Jung, Need for fully unintegrated parton densities, in: Proceedings of HERA
and LHC: A Workshop on the Implications of HERA for LHC Physics, Hamburg, Germany,
21-24 Mar 2005, hep-ph/0508280.
[72] D. de Florian, W. Vogelsang, Phys. Rev. D 71 (2005) 114004.
Y. Koike, J. Nagashima, W. Vogelsang, Nucl. Phys. B 744 (2006) 59.
[73] M. Gluck, E. Reya, M. Stratmann, W. Vogelsang, Phys. Rev. D 63 (2001) 094005.
[74] M. Gluck, E. Reya, A. Vogt, Eur. Phys. J. C 5 (1998) 461.
[75] M. Gluck, E. Reya, C. Sieg, Eur. Phys. J. C 20 (2001) 271.
[76] M. Gluck, E. Reya, C. Sieg, Phys. Lett. B 503 (2001) 285.
[77] M. Gluck, E. Reya, I. Schienbein, Phys. Rev. D 60 (1999) 054019.
[78] S. Brodsky, M. Burkardt, I. Schmidt, Nucl. Phys. B 441 (1995) 197.
[79] T. Gehrmann, W. J. Stirling, Z. Phys. C 65 (1995) 461.
[80] J. Blumlein, H. Bottcher private communication.
[81] J. Blumlein, H. Bottcher DESY 09-131.
[82] A. D. Martin, R. G. Roberts, W. J. Stirling, and R. S. Thorne, Eur. Phys. J. C 28 (2003) 455.
[83] P. Jimenez-Delgado and E. Reya, Phys. Rev. D 79 (2009) 074023.
[84] A. Bravar, K. Kurek, R. Windmolders, Comput. Phys. Commun. 105 (1997) 42.
[85] J. Babcock, E. Monsay, D. W. Sivers, Phys. Rev. D 19 (1979) 1483.
– 44 –