preparing codes for intel knights landing (knl)
TRANSCRIPT
Preparing Codes for Intel Knights Landing
(KNL)
Getting ready for the next generation Intel Xeon Phi processors

caption
Hey, at least it compiles
Optimized for modern CPUs
An Uncomfortable Truth about Software

The upcoming Intel Knights Landing Platform
• 72 cores– 36 tiles in a 2D mesh
– 16GB MCDRAM (HBM) total
• Each tile: – 2 cores
– 2 AVX-512 vector processing units per core
– 1MB L2 cache
• More info:– http://www.anandtech.com/show/9802/supercomputing-15-intels-
knights-landing-xeon-phi-silicon-on-display
• Extracting performance means:– Using better memory access patterns
– Using more threads
– Using vectorization

Flow for scaling up: Knights Landing codes
1. Analyze a realistic run with Allinea Performance Reports
• Fix any obvious issues!
• Then pursue steps 2 and 3
2. Is memory access dominating?
• Improve cache usage (bandwidth)
• Increase thread count (latency)
3. Scalar numeric ops dominating?
• Go for vectorization!

caption
Out-of-order PipelinedTime per retired
instruction
The performance of processors is complex
• …so it’s important to communicate what is happening at the user’s abstraction level
caption
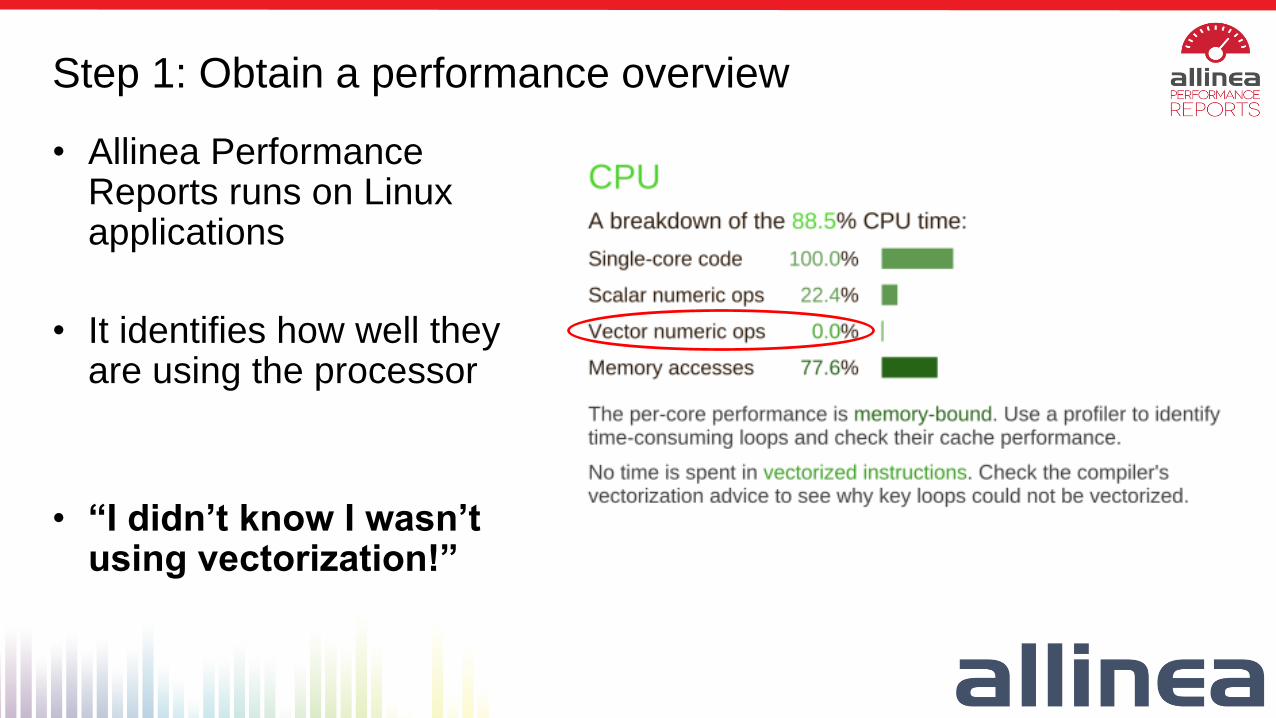
Step 1: Obtain a performance overview
• Allinea Performance Reports runs on Linux applications
• It identifies how well they are using the processor
• “I didn’t know I wasn’t using vectorization!”
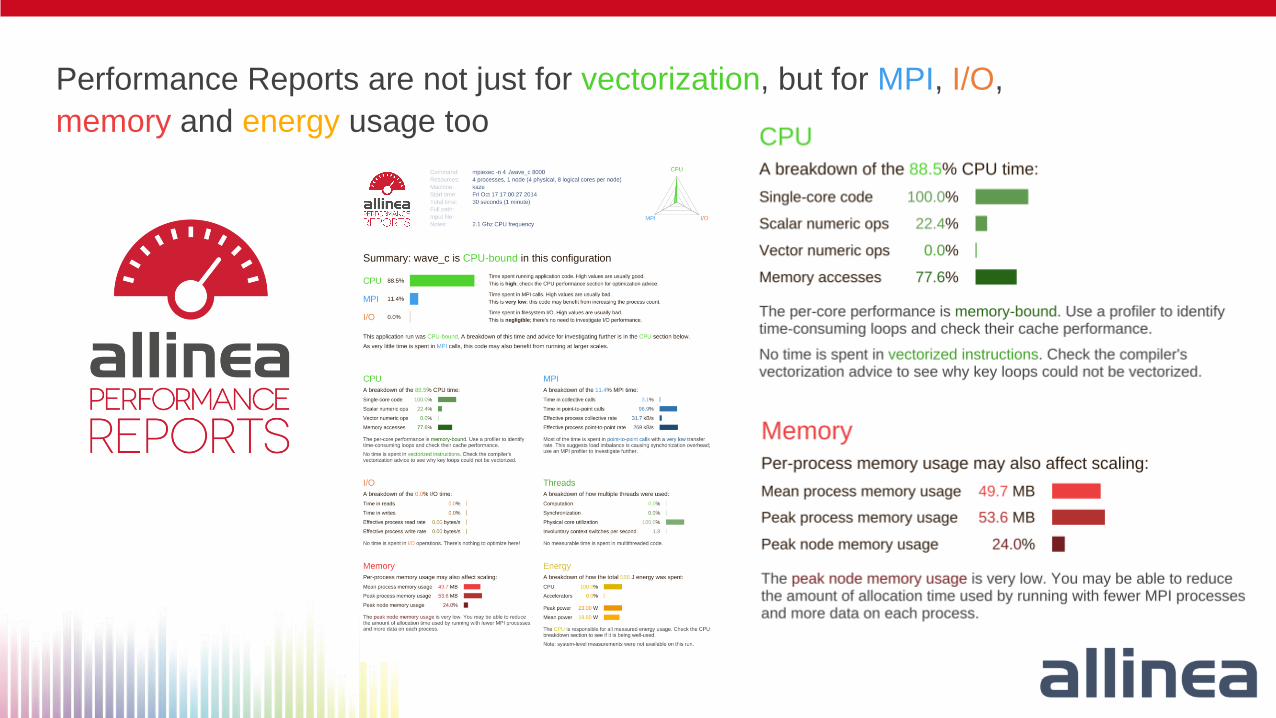
Performance Reports are not just for vectorization, but for MPI, I/O,
memory and energy usage too
caption

caption
Statistical wallclock time estimate of:
• Scalar numeric operations
• AVX/AVX2/… operations
• Memory accesses
• Other (branch, logic, …)
+ simple, actionable advice
Step 1: Focus on CPU performance report section
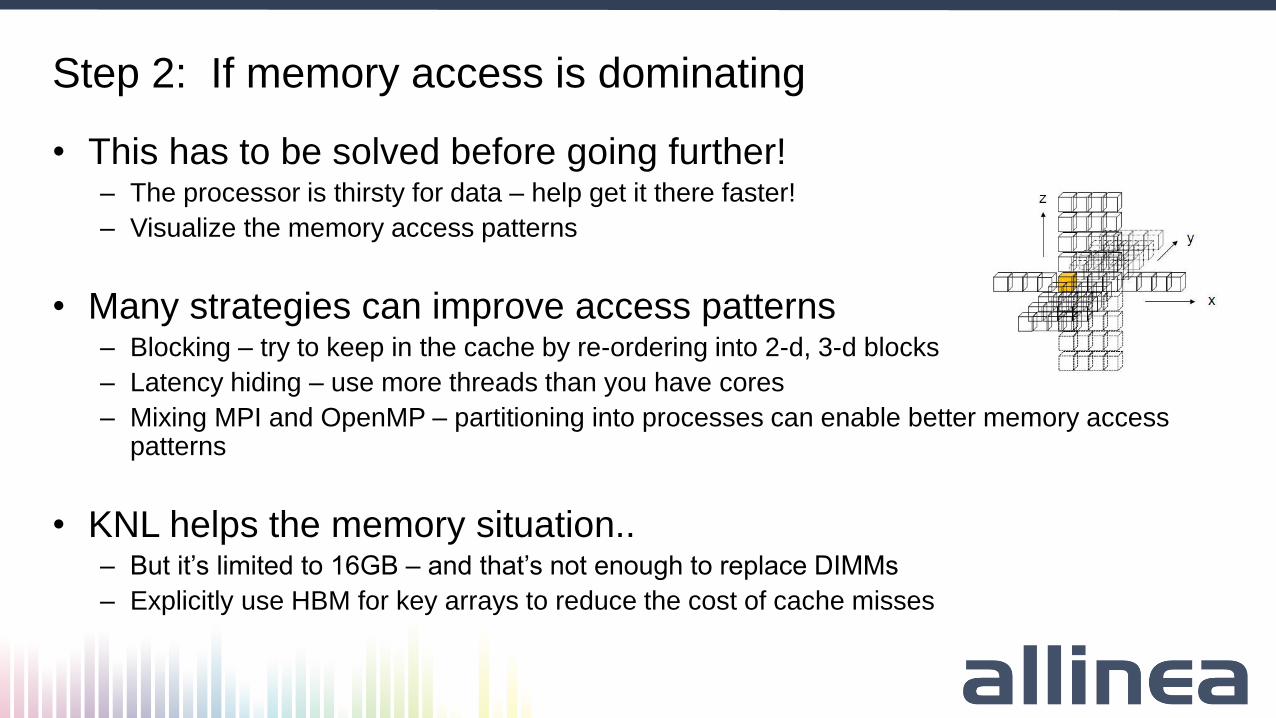
Step 2: If memory access is dominating
• This has to be solved before going further!– The processor is thirsty for data – help get it there faster!
– Visualize the memory access patterns
• Many strategies can improve access patterns– Blocking – try to keep in the cache by re-ordering into 2-d, 3-d blocks
– Latency hiding – use more threads than you have cores
– Mixing MPI and OpenMP – partitioning into processes can enable better memory access patterns
• KNL helps the memory situation..– But it’s limited to 16GB – and that’s not enough to replace DIMMs
– Explicitly use HBM for key arrays to reduce the cost of cache misses

Cache
Knights Landing High Bandwidth Memory detail
Flat (NUMA) Hybrid
• High Bandwidth Memory: 16GB of on-package high-bandwidth MCDRAM
• 3 possible modes of setting (boot time)

Step 2: Our tools that help improve memory access
• Allinea Performance Reports– Follow guidance to improve usage without changing code: Experiment with more/fewer
threads
• Allinea Forge (developer tools)– Allinea MAP – take real workload and find the area of code that dominates
• Rework access patterns that are in the dominating loops
– Allinea DDT – debugger will track memory allocations and leaks within HBM
• Ensure this memory is not wasted
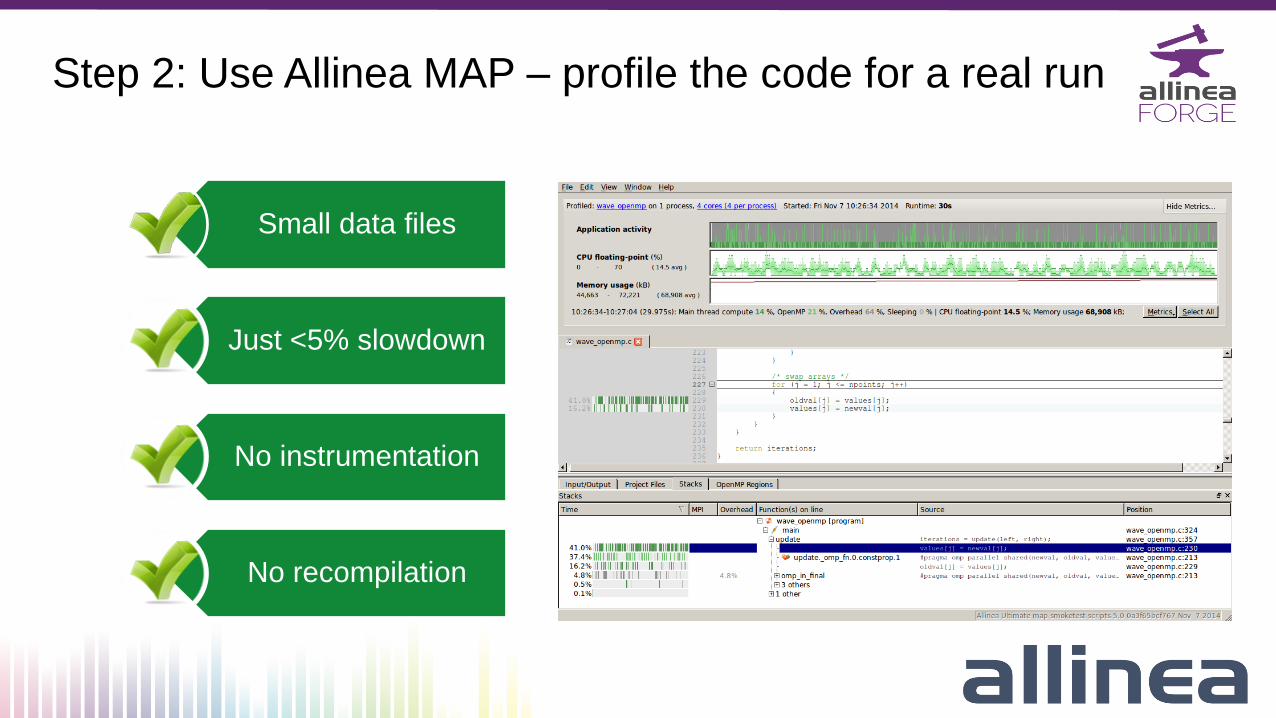
Small data files
Just <5% slowdown
No instrumentation
No recompilation
Step 2: Use Allinea MAP – profile the code for a real run
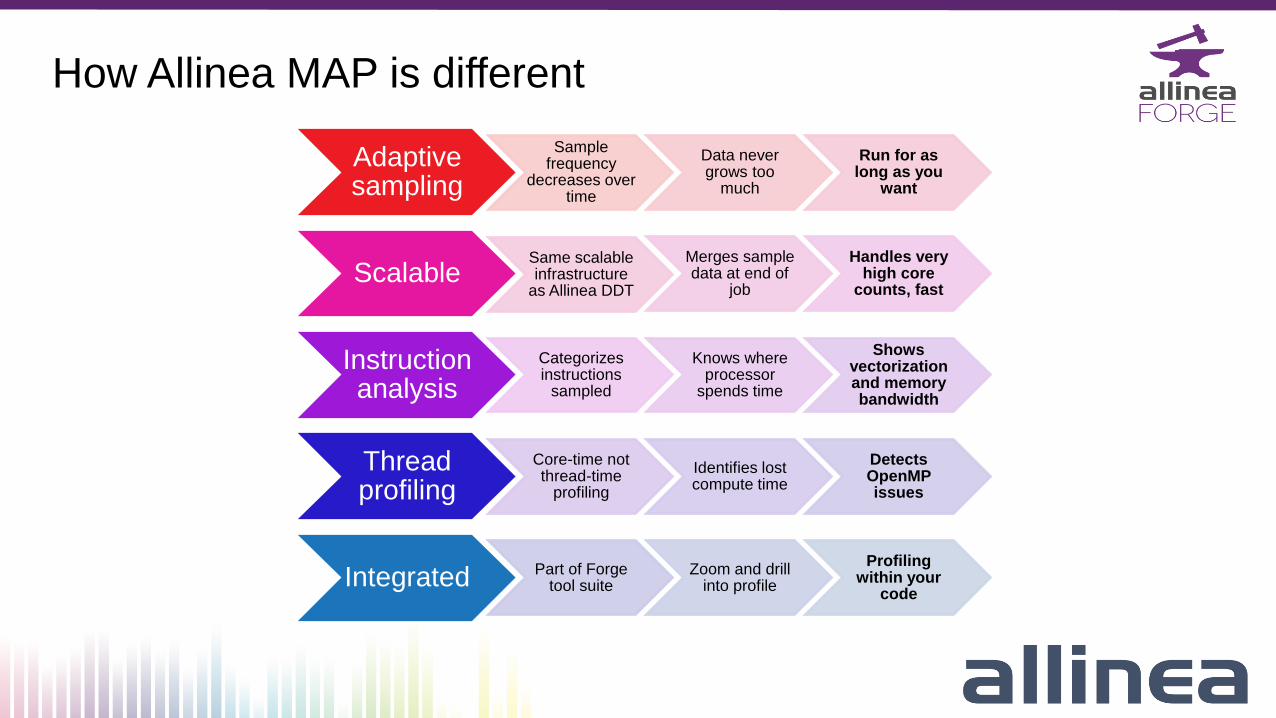
How Allinea MAP is different
Adaptive sampling
Sample frequency
decreases over time
Data never grows too
much
Run for as long as you
want
ScalableSame scalable infrastructure
as Allinea DDT
Merges sample data at end of
job
Handles very high core
counts, fast
Instruction analysis
Categorizes instructions
sampled
Knows where processor
spends time
Shows vectorization and memory bandwidth
Thread profiling
Core-time not thread-time
profiling
Identifies lost compute time
Detects OpenMP issues
Integrated Part of Forge tool suite
Zoom and drill into profile
Profiling within your
code
Above all…
• Aimed at any performance problem that matters
– MAP focuses on time
• Does not prejudge the problem
– Doesn’t assume it’s MPI messages, threads or I/O
• If there’s a problem..
– MAP shows you it, next to your code
• Fix directly – or target with the right follow up tool/activity
– Intel Vtune, Vectorization Adviser, icc…

Step 2: Improve thread usage
• Intel Knights Landing needs lots of threads for performance: OpenMP is a common way to do this– Even if you already use OpenMP… you may have used more threads than the code was designed for
• Profile what actually happens: use Allinea MAP– Common error: using OpenMP for every outer loop – including where one thread would be faster
• This example (above) shows a dark gray area of thread inactivity for OpenMP code– OpenMP threads are stalled sharing a small amount of work
– Removing OpenMP actually improves the performance!
Real optimization of OpenMP regions
• NB – still profiling for
first 300 seconds only
• Significant inactivity in
final 60 seconds
• OpenMP region
– #pragma omp parallel for
• Let’s remove
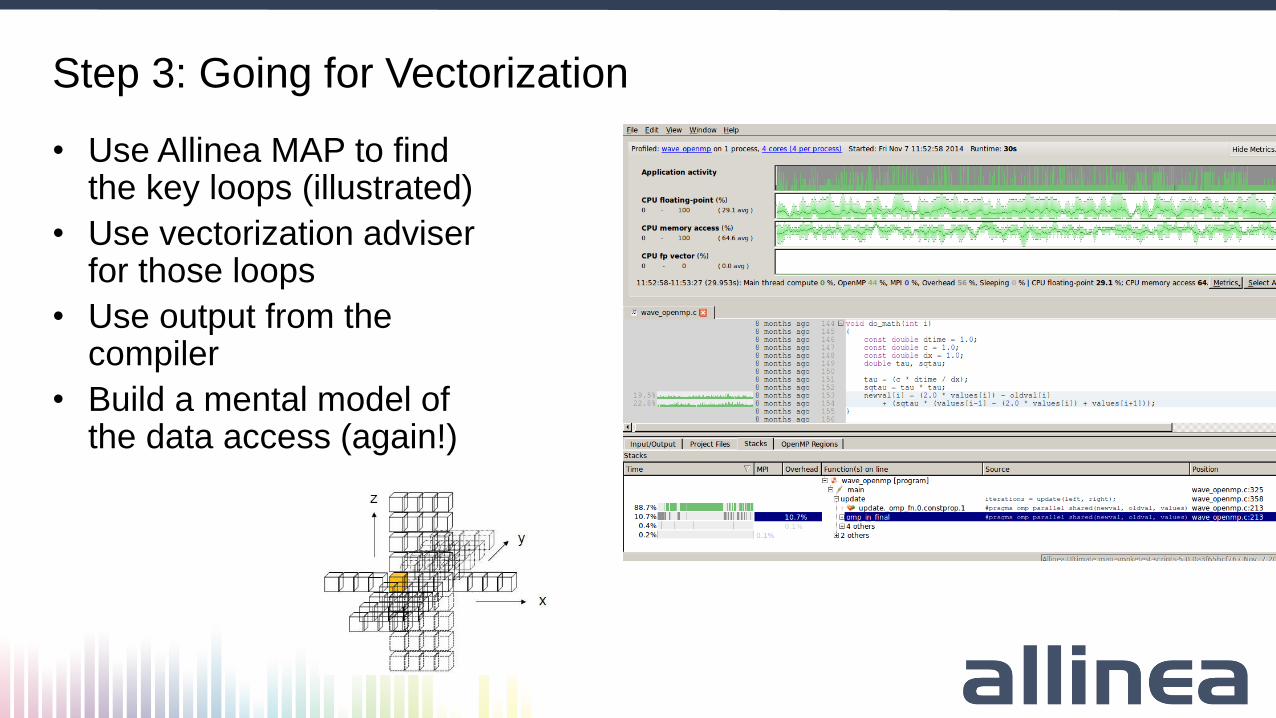
Step 3: Going for Vectorization
• Use Allinea MAP to find the key loops (illustrated)
• Use vectorization adviser for those loops
• Use output from the compiler
• Build a mental model of the data access (again!)
Lessons learned in practice
• Real codes exhibit many different performance patterns– Profiling real data sets at real scales is vital to target the effort
• Changing code can be simple– Use threads wisely – it will not always be faster
– Look for other libraries – someone else might have fixed your problem
• Re-engineering is necessary– Take advantage of vector units
– Take advantage of threads
– Take advantage of HBM
Debug
• First-class Intel® Xeon Phi™ support
• Memory debugging enhancements for HBM
Tune and Analyze
• First-class Intel® Xeon Phi™ support
• Additional Intel® Xeon Phi™ metrics – watch this space!
Profile
• First-class Intel® Xeon Phi™ support
• Additional Intel® Xeon Phi™ metrics – watch this space!
Our Intel® Xeon Phi™ Knights Landing Support

Increase the output of your system
Analyze and tune with Allinea Performance Reports
Develop, profile and debug applications with Allinea Forge
With professional support when you need it most