preparation and characterization of zno/mmt nanocomposite...
TRANSCRIPT
Turk J Chem
(2016) 40: 546 – 564
c⃝ TUBITAK
doi:10.3906/kim-1507-77
Turkish Journal of Chemistry
http :// journa l s . tub i tak .gov . t r/chem/
Research Article
Preparation and characterization of ZnO/MMT nanocomposite for photocatalytic
ozonation of a disperse dye
Alireza KHATAEE1,2,∗, Murat KIRANSAN2, Semra KARACA2,∗, Samira AREFI-OSKOUI11Research Laboratory of Advanced Water and Wastewater Treatment Processes, Department of Applied Chemistry,
Faculty of Chemistry, University of Tabriz, Tabriz, Iran2Department of Chemistry, Faculty of Science, Ataturk University, Erzurum, Turkey
Received: 26.07.2015 • Accepted/Published Online: 14.11.2015 • Final Version: 21.06.2016
Abstract: ZnO was immobilized on the montmorillonite (MMT) to synthesize ZnO/MMT nanocomposite. Physic-
ochemical properties of the as-synthesized nanocomposite were determined using X-ray diffraction, scanning electron
microscopy, transmission electron microscope, Fourier transform infrared spectroscopy, N2 adsorption/desorption, and
point of zero charge pH (pHpzc) analysis. The performance of the prepared ZnO/MMT nanocomposite was examined
for the photocatalytic ozonation of Disperse Red 54 (DR54) and the highest decolorization efficiency (88.75% after
60 min of reaction time) was the result for the mentioned process compared to adsorption, single ozonation, catalytic
ozonation, and photolysis. The influence of various operational parameters including initial dye concentration, catalyst
concentration, pH value, inlet gas concentration, and type of irradiation source was investigated on the efficiency of the
photocatalytic ozonation removal of DR54. Various inorganic and organic reactive oxygen species (ROS) scavengers were
applied to investigate the mechanism of photocatalytic ozonation. In addition, a three-layer perceptron neural network
was developed for modeling the relationship between the operational parameters and decolorization efficiency of the dye.
High R2 values were obtained for both the training and test data.
Key words: ZnO/MMT nanocomposite, Disperse Red 54, photocatalytic ozonation, artificial neural network
1. Introduction
Synthetic dyes give good properties to dyed materials and supply a wide range of different colors, and so they
are widely used in different industries such as cosmetics, textiles, food, and leather.1−4 Among the synthetic
dyes, azo dyes, with an azo group bound to the aromatic rings, are of great importance. However, azo dyes
are considered a threat to the environment due to their potential carcinogenic nature, nonbiodegradability, and
toxicity.5 Therefore, as a consequence, different methods based on the generation of hydroxyl radicals, which
are known as advanced oxidation processes (AOPs),6 have been developed for the degradation of azo dyes in
wastewater. The results of research demonstrate that among the AOPs heterogeneous photocatalysis has a
great potential for degradation of organic pollutants.1,7−14 Although a wide variety of organic compounds can
be destroyed through the photocatalysis process, mineralization of the pollutants is not complete and fast in
some cases.15 The photocatalysis process can be improved by combining with other chemical processes such
as electrochemical treatment, ultrasonic irradiation, photo-Fenton reaction, and ozonation.16,17 Ozone is a
strong oxidizing agent (E◦ = 2.08 V) that can react with various organic compounds via direct or indirect
∗Correspondence: a [email protected], semra [email protected]
546
KHATAEE et al./Turk J Chem
mechanisms, and so it can be used for water treatment. During direct ozonation, ozone molecules react with
organic pollutants through a direct, selective, and electrophilic attack.15 In indirect ozonation, hydroxyl free
radicals can be generated by the decomposition of ozone molecules. The produced hydroxyl radicals react with
organic pollutants via a fast and nonselective reaction.16 However, the results of research demonstrate that
the ozonation process alone leads to incomplete mineralization of the organic compounds, which sometimes
results in the production of toxic intermediates.15,16 Therefore, combination of photocatalysis with ozonation
seems to be a promising method for the degradation and mineralization of stable organic compounds. During
the photocatalytic ozonation process, the decomposition of the ozone and consequently formation of hydroxyl
radicals are controlled by the catalyst.18 More hydroxyl radicals are generated when the photocatalysis and
ozonation processes are used simultaneously, leading to a faster and more complete mineralization compared
to photocatalysis or ozonation alone.18,19 During this process, the photogenerated electrons are captured with
ozone molecules from the conduction band to form ozonid ion radicals, which consequently gives rise to hydroxyl
radicals.15,20 Moreover, this suppresses the recombination of the photogenerated electron-hole pairs, which
results in improving the degradation efficiency and enhancing the reaction rate.20
Among the various semiconductors used in photocatalysis, ZnO has attracted remarkable attention due to
its advantages such as large area-to-volume ratio, large excitation binding energy (60 mV), high photosensitivity,
wide band gap (Eg = 3.37 eV), and low cost.21 The efficiency of heterogeneous photocatalysis is mainly affected
by the specific surface area of the photocatalyst. There are two main effective ways to increase the surface area
of the photocatalyst: reduction in the particle size of the photocatalyst and immobilization of the photocatalyst
on the surface of a support with high specific surface area.22
In the present study, ZnO nanoparticles were synthesized on the surface of montmorillonite, resulting
in ZnO/MMT nanocomposite. The as-synthesized ZnO/MMT nanocomposite was characterized by XRD,
SEM, TEM, FT-IR, N2 adsorption/desorption analysis, and point of zero charge pH (pHpzc) analysis. The
performance of the prepared ZnO/MMT nanocomposite was examined for the photocatalytic ozonation removal
of DR54 and compared with adsorption, photolysis, single ozonation, catalytic ozonation, and photolysis
processes. Moreover, the effects of various operational parameters including initial dye concentration, catalyst
concentration, pH value, inlet ozone gas concentration, type of irradiation source, and presence of organic and
inorganic radical scavengers were investigated on the decolorization efficiency of DR54 through photocatalytic
ozonation. In order to predict the photocatalytic ozonation removal of DR54, an artificial neural network model
(ANN) was developed.
2. Results and discussion
2.1. Characterization of the synthesized ZnO/MMT nanocomposite
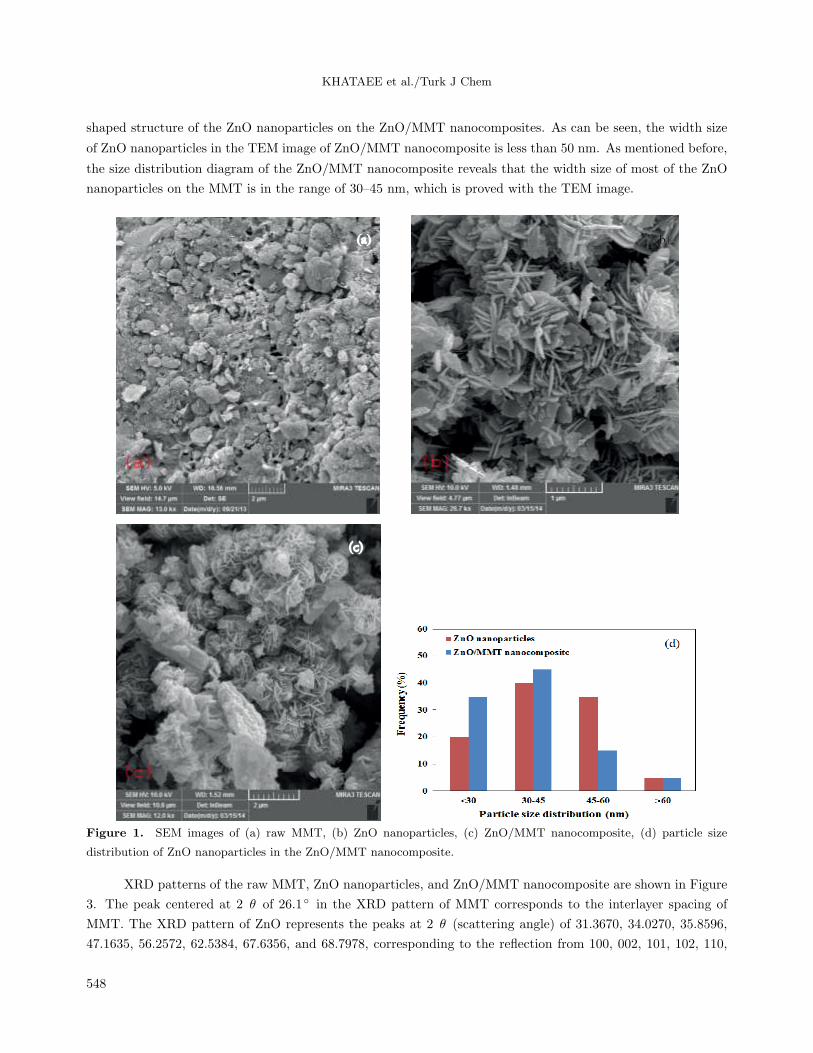
The morphology and size of raw MMT, ZnO nanoparticles, and ZnO/MMT nanocomposite were investigated
using SEM analysis and the results are shown in Figure 1. A flaky texture can be seen in Figure 1(a) for
MMT, reflecting the layered structure of MMT. In addition, the SEM image of as-synthesized ZnO nanoparticles
showed a flaky-shaped structure for ZnO nanoparticles (see Figure 1(b)). Figure 1(c) shows the presence of ZnO
nanoparticles on the surface of MMT, indicating the successful synthesis of ZnO/MMT nanocomposite. Manual
Microstructure Distance Measurement software (Nahamin Pardazan Asia Co., Iran) was used to determine
the average width size of ZnO nanoparticles (Figure 1(d)). The obtained results reveal that both pure and
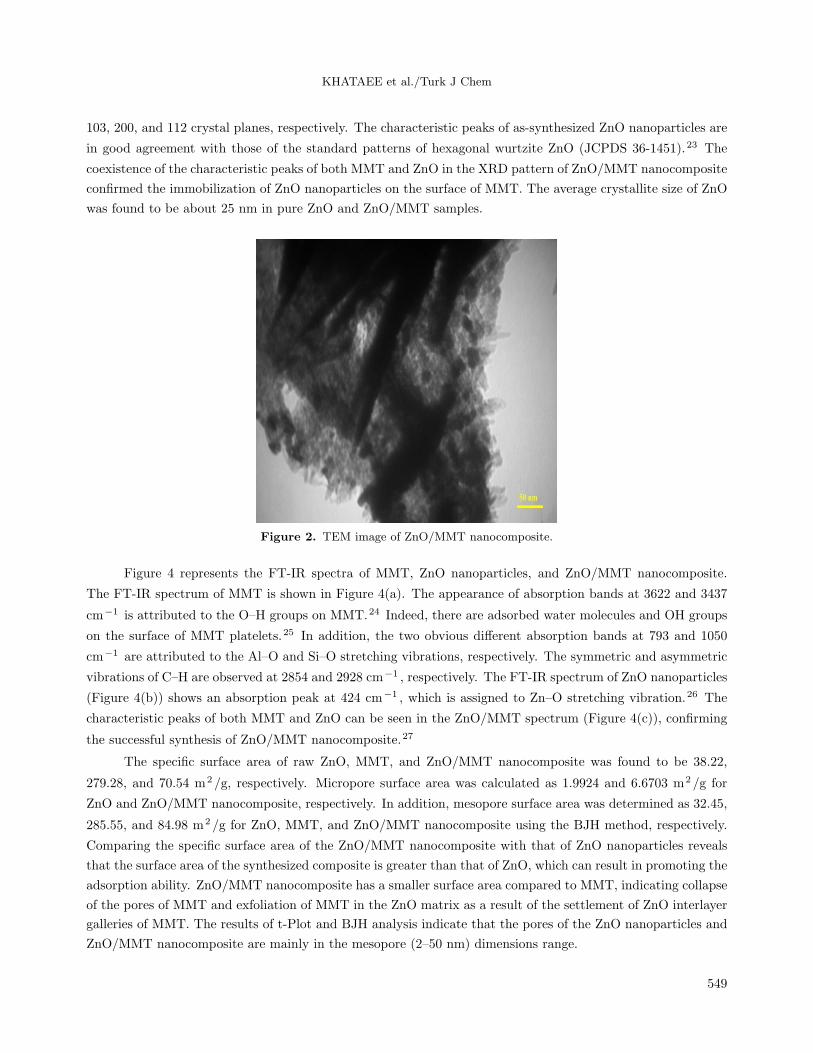
MMT-supported ZnO particles are nanosized with the average width size of 30–45 nm. The TEM image of
ZnO/MMT nanocomposite is shown in Figure 2. The very dark area in the TEM image indicates the flaky-
547
KHATAEE et al./Turk J Chem
shaped structure of the ZnO nanoparticles on the ZnO/MMT nanocomposites. As can be seen, the width size
of ZnO nanoparticles in the TEM image of ZnO/MMT nanocomposite is less than 50 nm. As mentioned before,
the size distribution diagram of the ZnO/MMT nanocomposite reveals that the width size of most of the ZnO
nanoparticles on the MMT is in the range of 30–45 nm, which is proved with the TEM image.
(a)
(c)
(b)
Figure 1. SEM images of (a) raw MMT, (b) ZnO nanoparticles, (c) ZnO/MMT nanocomposite, (d) particle size
distribution of ZnO nanoparticles in the ZnO/MMT nanocomposite.
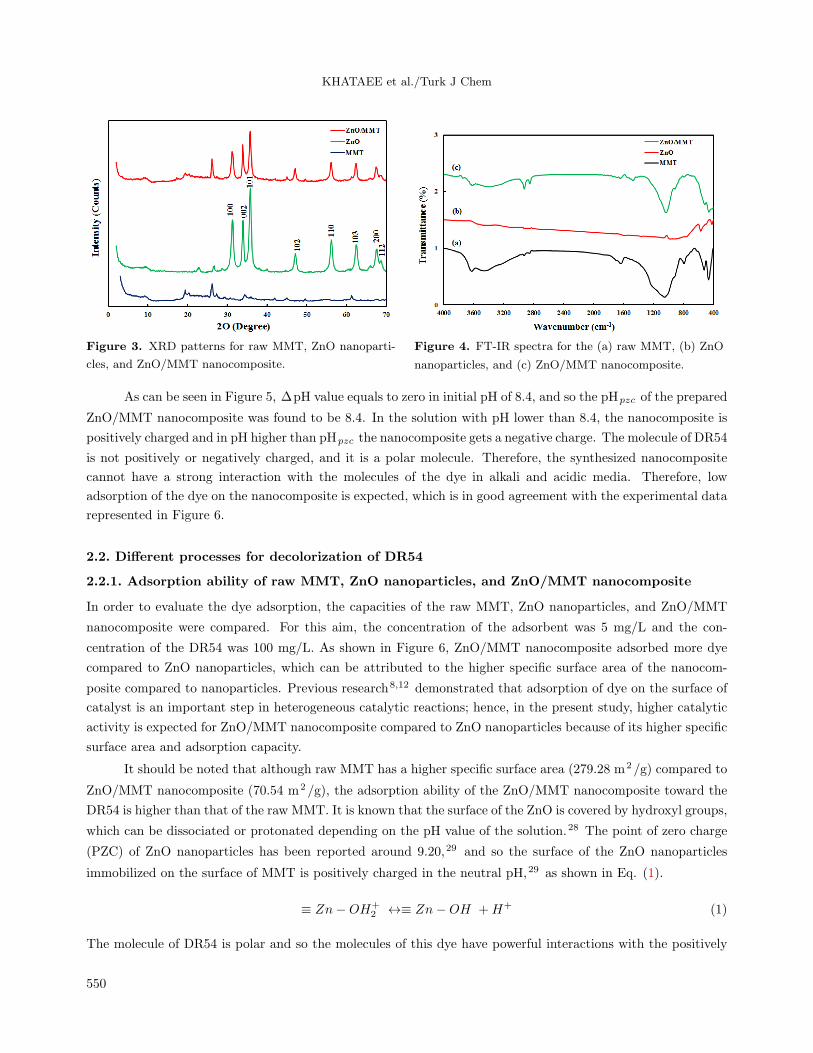
XRD patterns of the raw MMT, ZnO nanoparticles, and ZnO/MMT nanocomposite are shown in Figure
3. The peak centered at 2 θ of 26.1◦ in the XRD pattern of MMT corresponds to the interlayer spacing of
MMT. The XRD pattern of ZnO represents the peaks at 2 θ (scattering angle) of 31.3670, 34.0270, 35.8596,
47.1635, 56.2572, 62.5384, 67.6356, and 68.7978, corresponding to the reflection from 100, 002, 101, 102, 110,
548
KHATAEE et al./Turk J Chem
103, 200, and 112 crystal planes, respectively. The characteristic peaks of as-synthesized ZnO nanoparticles are
in good agreement with those of the standard patterns of hexagonal wurtzite ZnO (JCPDS 36-1451).23 The
coexistence of the characteristic peaks of both MMT and ZnO in the XRD pattern of ZnO/MMT nanocomposite
confirmed the immobilization of ZnO nanoparticles on the surface of MMT. The average crystallite size of ZnO
was found to be about 25 nm in pure ZnO and ZnO/MMT samples.
Figure 2. TEM image of ZnO/MMT nanocomposite.
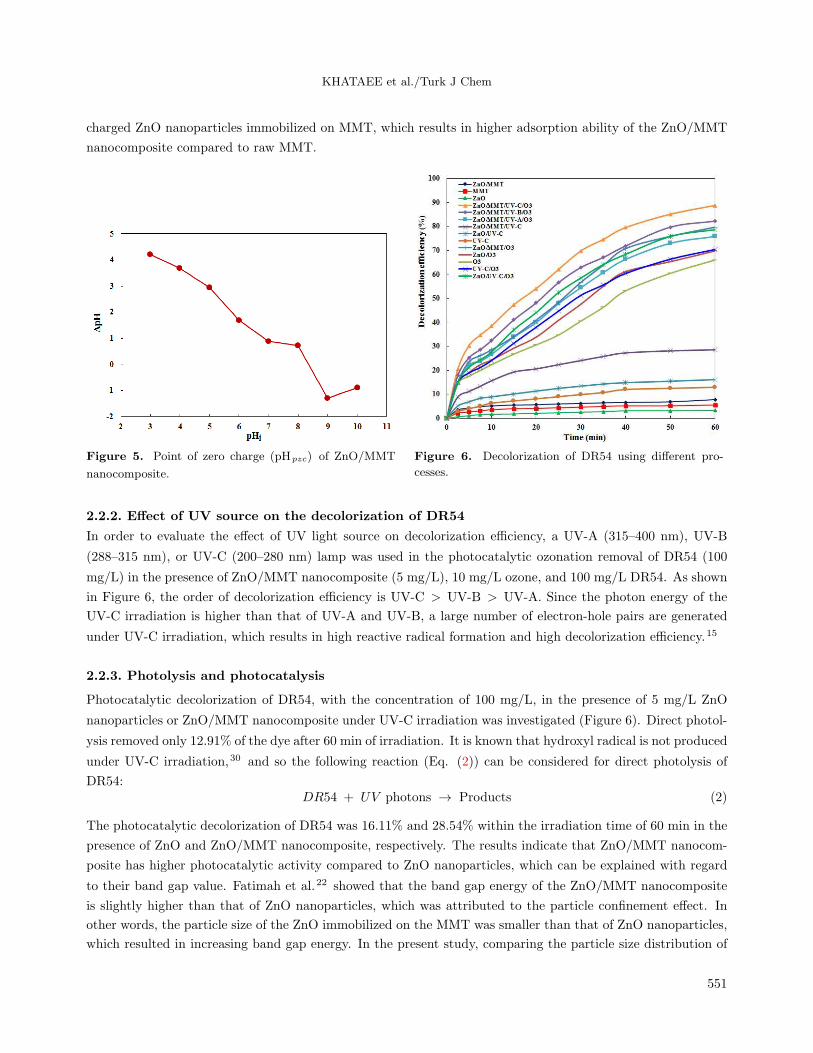
Figure 4 represents the FT-IR spectra of MMT, ZnO nanoparticles, and ZnO/MMT nanocomposite.
The FT-IR spectrum of MMT is shown in Figure 4(a). The appearance of absorption bands at 3622 and 3437
cm−1 is attributed to the O–H groups on MMT.24 Indeed, there are adsorbed water molecules and OH groups
on the surface of MMT platelets.25 In addition, the two obvious different absorption bands at 793 and 1050
cm−1 are attributed to the Al–O and Si–O stretching vibrations, respectively. The symmetric and asymmetric
vibrations of C–H are observed at 2854 and 2928 cm−1 , respectively. The FT-IR spectrum of ZnO nanoparticles
(Figure 4(b)) shows an absorption peak at 424 cm−1 , which is assigned to Zn–O stretching vibration.26 The
characteristic peaks of both MMT and ZnO can be seen in the ZnO/MMT spectrum (Figure 4(c)), confirming
the successful synthesis of ZnO/MMT nanocomposite.27
The specific surface area of raw ZnO, MMT, and ZnO/MMT nanocomposite was found to be 38.22,
279.28, and 70.54 m2 /g, respectively. Micropore surface area was calculated as 1.9924 and 6.6703 m2 /g for
ZnO and ZnO/MMT nanocomposite, respectively. In addition, mesopore surface area was determined as 32.45,
285.55, and 84.98 m2/g for ZnO, MMT, and ZnO/MMT nanocomposite using the BJH method, respectively.
Comparing the specific surface area of the ZnO/MMT nanocomposite with that of ZnO nanoparticles reveals
that the surface area of the synthesized composite is greater than that of ZnO, which can result in promoting the
adsorption ability. ZnO/MMT nanocomposite has a smaller surface area compared to MMT, indicating collapse
of the pores of MMT and exfoliation of MMT in the ZnO matrix as a result of the settlement of ZnO interlayer
galleries of MMT. The results of t-Plot and BJH analysis indicate that the pores of the ZnO nanoparticles and
ZnO/MMT nanocomposite are mainly in the mesopore (2–50 nm) dimensions range.
549
KHATAEE et al./Turk J Chem
Figure 3. XRD patterns for raw MMT, ZnO nanoparti-
cles, and ZnO/MMT nanocomposite.
Figure 4. FT-IR spectra for the (a) raw MMT, (b) ZnO
nanoparticles, and (c) ZnO/MMT nanocomposite.
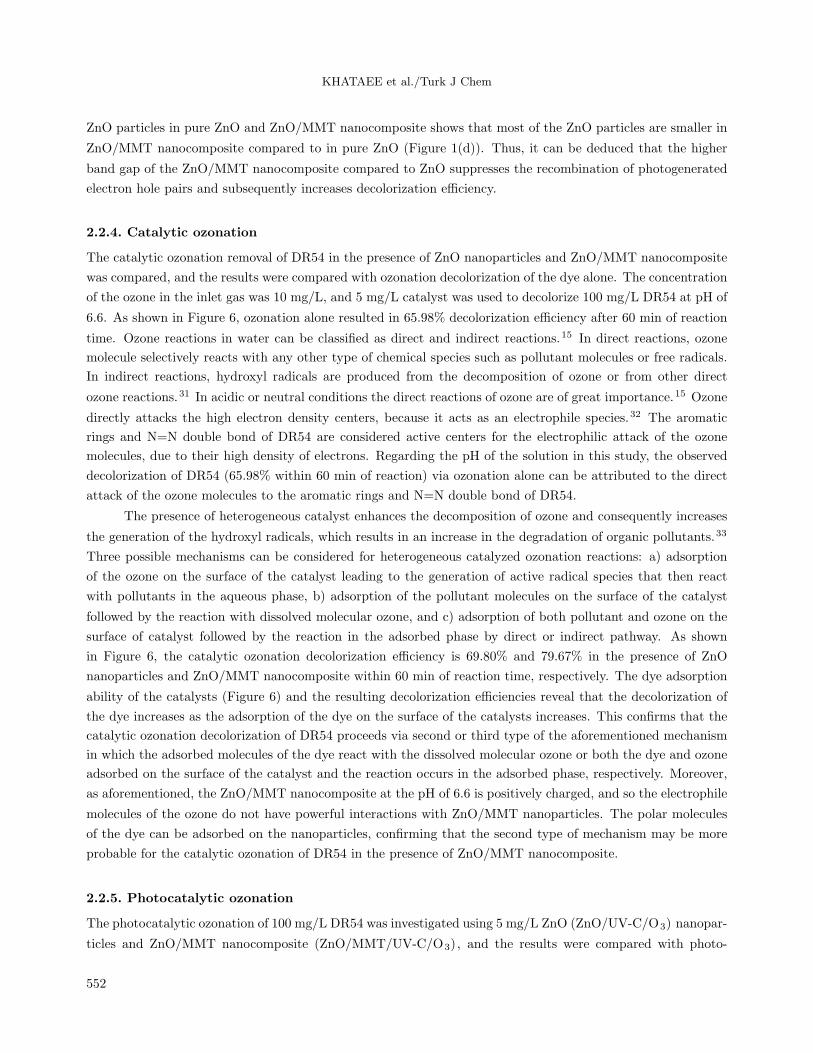
As can be seen in Figure 5, ∆pH value equals to zero in initial pH of 8.4, and so the pHpzc of the prepared
ZnO/MMT nanocomposite was found to be 8.4. In the solution with pH lower than 8.4, the nanocomposite is
positively charged and in pH higher than pHpzc the nanocomposite gets a negative charge. The molecule of DR54
is not positively or negatively charged, and it is a polar molecule. Therefore, the synthesized nanocomposite
cannot have a strong interaction with the molecules of the dye in alkali and acidic media. Therefore, low
adsorption of the dye on the nanocomposite is expected, which is in good agreement with the experimental data
represented in Figure 6.
2.2. Different processes for decolorization of DR54
2.2.1. Adsorption ability of raw MMT, ZnO nanoparticles, and ZnO/MMT nanocomposite
In order to evaluate the dye adsorption, the capacities of the raw MMT, ZnO nanoparticles, and ZnO/MMT
nanocomposite were compared. For this aim, the concentration of the adsorbent was 5 mg/L and the con-
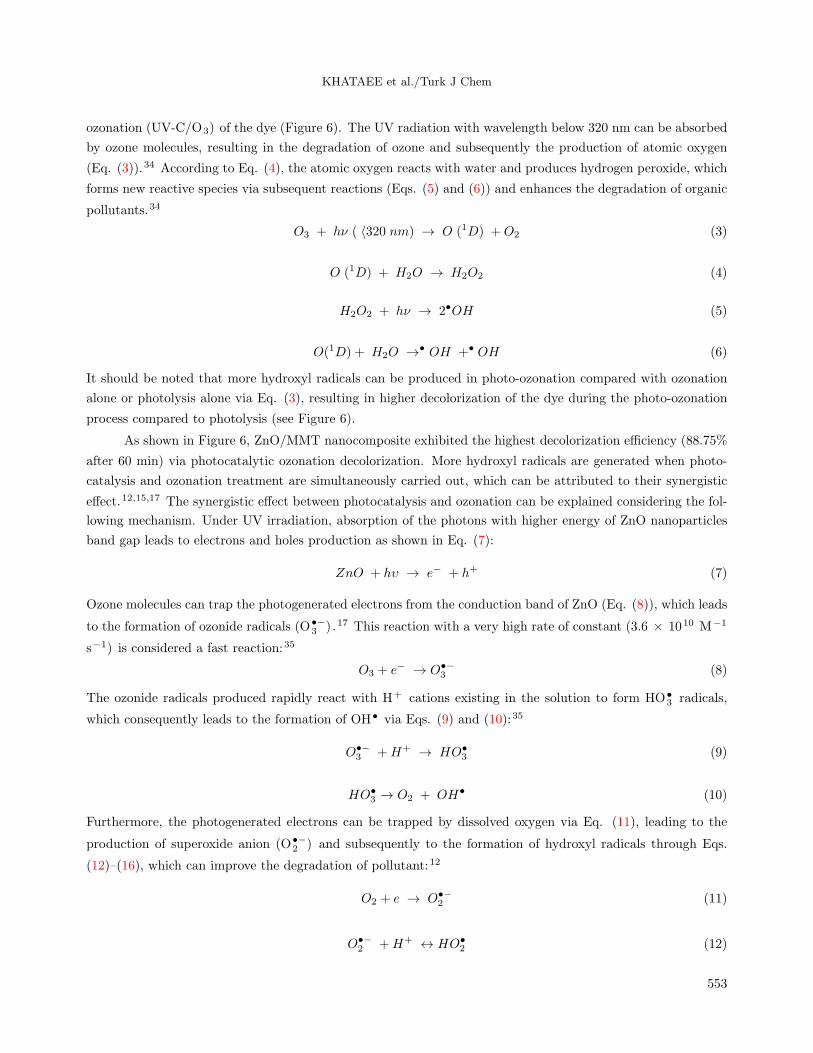
centration of the DR54 was 100 mg/L. As shown in Figure 6, ZnO/MMT nanocomposite adsorbed more dye
compared to ZnO nanoparticles, which can be attributed to the higher specific surface area of the nanocom-
posite compared to nanoparticles. Previous research8,12 demonstrated that adsorption of dye on the surface of
catalyst is an important step in heterogeneous catalytic reactions; hence, in the present study, higher catalytic
activity is expected for ZnO/MMT nanocomposite compared to ZnO nanoparticles because of its higher specific
surface area and adsorption capacity.
It should be noted that although raw MMT has a higher specific surface area (279.28 m2 /g) compared to
ZnO/MMT nanocomposite (70.54 m2 /g), the adsorption ability of the ZnO/MMT nanocomposite toward the
DR54 is higher than that of the raw MMT. It is known that the surface of the ZnO is covered by hydroxyl groups,
which can be dissociated or protonated depending on the pH value of the solution.28 The point of zero charge
(PZC) of ZnO nanoparticles has been reported around 9.20,29 and so the surface of the ZnO nanoparticles
immobilized on the surface of MMT is positively charged in the neutral pH,29 as shown in Eq. (1).
≡ Zn−OH+2 ↔≡ Zn−OH +H+ (1)
The molecule of DR54 is polar and so the molecules of this dye have powerful interactions with the positively
550
KHATAEE et al./Turk J Chem
charged ZnO nanoparticles immobilized on MMT, which results in higher adsorption ability of the ZnO/MMT
nanocomposite compared to raw MMT.
Figure 5. Point of zero charge (pHpzc) of ZnO/MMT
nanocomposite.
Figure 6. Decolorization of DR54 using different pro-
cesses.
2.2.2. Effect of UV source on the decolorization of DR54
In order to evaluate the effect of UV light source on decolorization efficiency, a UV-A (315–400 nm), UV-B
(288–315 nm), or UV-C (200–280 nm) lamp was used in the photocatalytic ozonation removal of DR54 (100
mg/L) in the presence of ZnO/MMT nanocomposite (5 mg/L), 10 mg/L ozone, and 100 mg/L DR54. As shown
in Figure 6, the order of decolorization efficiency is UV-C > UV-B > UV-A. Since the photon energy of the
UV-C irradiation is higher than that of UV-A and UV-B, a large number of electron-hole pairs are generated
under UV-C irradiation, which results in high reactive radical formation and high decolorization efficiency.15
2.2.3. Photolysis and photocatalysis
Photocatalytic decolorization of DR54, with the concentration of 100 mg/L, in the presence of 5 mg/L ZnO
nanoparticles or ZnO/MMT nanocomposite under UV-C irradiation was investigated (Figure 6). Direct photol-
ysis removed only 12.91% of the dye after 60 min of irradiation. It is known that hydroxyl radical is not produced
under UV-C irradiation,30 and so the following reaction (Eq. (2)) can be considered for direct photolysis of
DR54:DR54 + UV photons → Products (2)
The photocatalytic decolorization of DR54 was 16.11% and 28.54% within the irradiation time of 60 min in the
presence of ZnO and ZnO/MMT nanocomposite, respectively. The results indicate that ZnO/MMT nanocom-
posite has higher photocatalytic activity compared to ZnO nanoparticles, which can be explained with regard
to their band gap value. Fatimah et al.22 showed that the band gap energy of the ZnO/MMT nanocomposite
is slightly higher than that of ZnO nanoparticles, which was attributed to the particle confinement effect. In
other words, the particle size of the ZnO immobilized on the MMT was smaller than that of ZnO nanoparticles,
which resulted in increasing band gap energy. In the present study, comparing the particle size distribution of
551
KHATAEE et al./Turk J Chem
ZnO particles in pure ZnO and ZnO/MMT nanocomposite shows that most of the ZnO particles are smaller in
ZnO/MMT nanocomposite compared to in pure ZnO (Figure 1(d)). Thus, it can be deduced that the higher
band gap of the ZnO/MMT nanocomposite compared to ZnO suppresses the recombination of photogenerated
electron hole pairs and subsequently increases decolorization efficiency.
2.2.4. Catalytic ozonation
The catalytic ozonation removal of DR54 in the presence of ZnO nanoparticles and ZnO/MMT nanocomposite
was compared, and the results were compared with ozonation decolorization of the dye alone. The concentration
of the ozone in the inlet gas was 10 mg/L, and 5 mg/L catalyst was used to decolorize 100 mg/L DR54 at pH of
6.6. As shown in Figure 6, ozonation alone resulted in 65.98% decolorization efficiency after 60 min of reaction
time. Ozone reactions in water can be classified as direct and indirect reactions.15 In direct reactions, ozone
molecule selectively reacts with any other type of chemical species such as pollutant molecules or free radicals.
In indirect reactions, hydroxyl radicals are produced from the decomposition of ozone or from other direct
ozone reactions.31 In acidic or neutral conditions the direct reactions of ozone are of great importance.15 Ozone
directly attacks the high electron density centers, because it acts as an electrophile species.32 The aromatic
rings and N=N double bond of DR54 are considered active centers for the electrophilic attack of the ozone
molecules, due to their high density of electrons. Regarding the pH of the solution in this study, the observed
decolorization of DR54 (65.98% within 60 min of reaction) via ozonation alone can be attributed to the direct
attack of the ozone molecules to the aromatic rings and N=N double bond of DR54.
The presence of heterogeneous catalyst enhances the decomposition of ozone and consequently increases
the generation of the hydroxyl radicals, which results in an increase in the degradation of organic pollutants.33
Three possible mechanisms can be considered for heterogeneous catalyzed ozonation reactions: a) adsorption
of the ozone on the surface of the catalyst leading to the generation of active radical species that then react
with pollutants in the aqueous phase, b) adsorption of the pollutant molecules on the surface of the catalyst
followed by the reaction with dissolved molecular ozone, and c) adsorption of both pollutant and ozone on the
surface of catalyst followed by the reaction in the adsorbed phase by direct or indirect pathway. As shown
in Figure 6, the catalytic ozonation decolorization efficiency is 69.80% and 79.67% in the presence of ZnO
nanoparticles and ZnO/MMT nanocomposite within 60 min of reaction time, respectively. The dye adsorption
ability of the catalysts (Figure 6) and the resulting decolorization efficiencies reveal that the decolorization of
the dye increases as the adsorption of the dye on the surface of the catalysts increases. This confirms that the
catalytic ozonation decolorization of DR54 proceeds via second or third type of the aforementioned mechanism
in which the adsorbed molecules of the dye react with the dissolved molecular ozone or both the dye and ozone
adsorbed on the surface of the catalyst and the reaction occurs in the adsorbed phase, respectively. Moreover,
as aforementioned, the ZnO/MMT nanocomposite at the pH of 6.6 is positively charged, and so the electrophile
molecules of the ozone do not have powerful interactions with ZnO/MMT nanoparticles. The polar molecules
of the dye can be adsorbed on the nanoparticles, confirming that the second type of mechanism may be more
probable for the catalytic ozonation of DR54 in the presence of ZnO/MMT nanocomposite.
2.2.5. Photocatalytic ozonation
The photocatalytic ozonation of 100 mg/L DR54 was investigated using 5 mg/L ZnO (ZnO/UV-C/O3) nanopar-
ticles and ZnO/MMT nanocomposite (ZnO/MMT/UV-C/O3), and the results were compared with photo-
552
KHATAEE et al./Turk J Chem
ozonation (UV-C/O3) of the dye (Figure 6). The UV radiation with wavelength below 320 nm can be absorbed
by ozone molecules, resulting in the degradation of ozone and subsequently the production of atomic oxygen
(Eq. (3)).34 According to Eq. (4), the atomic oxygen reacts with water and produces hydrogen peroxide, which
forms new reactive species via subsequent reactions (Eqs. (5) and (6)) and enhances the degradation of organic
pollutants.34
O3 + hν ( ⟨320 nm) → O (1D) +O2 (3)
O (1D) + H2O → H2O2 (4)
H2O2 + hν → 2•OH (5)
O(1D) + H2O →• OH +• OH (6)
It should be noted that more hydroxyl radicals can be produced in photo-ozonation compared with ozonation
alone or photolysis alone via Eq. (3), resulting in higher decolorization of the dye during the photo-ozonation
process compared to photolysis (see Figure 6).
As shown in Figure 6, ZnO/MMT nanocomposite exhibited the highest decolorization efficiency (88.75%
after 60 min) via photocatalytic ozonation decolorization. More hydroxyl radicals are generated when photo-
catalysis and ozonation treatment are simultaneously carried out, which can be attributed to their synergistic
effect.12,15,17 The synergistic effect between photocatalysis and ozonation can be explained considering the fol-
lowing mechanism. Under UV irradiation, absorption of the photons with higher energy of ZnO nanoparticles
band gap leads to electrons and holes production as shown in Eq. (7):
ZnO + hυ → e− + h+ (7)
Ozone molecules can trap the photogenerated electrons from the conduction band of ZnO (Eq. (8)), which leads
to the formation of ozonide radicals (O•−3 ).17 This reaction with a very high rate of constant (3.6 × 10¹⁰ M−1
s−1) is considered a fast reaction:35
O3 + e− → O•−3 (8)
The ozonide radicals produced rapidly react with H+ cations existing in the solution to form HO•3 radicals,
which consequently leads to the formation of OH• via Eqs. (9) and (10):35
O•−3 +H+ → HO•
3 (9)
HO•3 → O2 + OH• (10)
Furthermore, the photogenerated electrons can be trapped by dissolved oxygen via Eq. (11), leading to the
production of superoxide anion (O•−2 ) and subsequently to the formation of hydroxyl radicals through Eqs.
(12)–(16), which can improve the degradation of pollutant:12
O2 + e → O•−2 (11)
O•−2 +H+ ↔ HO•
2 (12)
553
KHATAEE et al./Turk J Chem
2O•−2 + 2H+ → H2O2 (13)
2HO•2 → H2O2 + O2 (14)
H2O2 + O•−2 → OH• + OH− +O2 (15)
H2O2 + e → OH• +OH− (16)
The results discussed in the previous sections indicated that ZnO/MMT nanocomposite exhibited higher activity
compared to raw MMT and ZnO nanoparticles. As can be seen in Figure 6, the decolorization of DR54 was
7.79% for adsorption and 12.91% for direct photolysis after 60 min, indicating that adsorption and photolysis do
not have significant contributions to decolorization of the dye. The presence of the ZnO/MMT nanocomposite
under UV-C irradiation increases the decolorization efficiency to 28.54% after 60 min due to the formation
of photogenerated electron-hole pairs by immobilized ZnO and subsequently production of hydroxyl radicals
through photocatalytic oxidation. The decolorization efficiency of the dye is 65.98% after 60 min of reaction using
ozonation alone, which is significantly higher than that of photocatalytic oxidation. It should be noted that the
presence of UV-C and ZnO/MMT nanocomposite in the ozonation process slightly increases the decolorization
efficiency, suggesting that in this study DR54 was mainly decolorized via ozonation.
2.3. Effect of operational parameters on the photocatalytic ozonation process
2.3.1. Effect of solution pH
The surface properties and the ozone decomposition reactions can be affected by the pH of the solution, and
so the effect of solution pH was investigated on the decolorization efficiency of the dye. The pH of dye solution
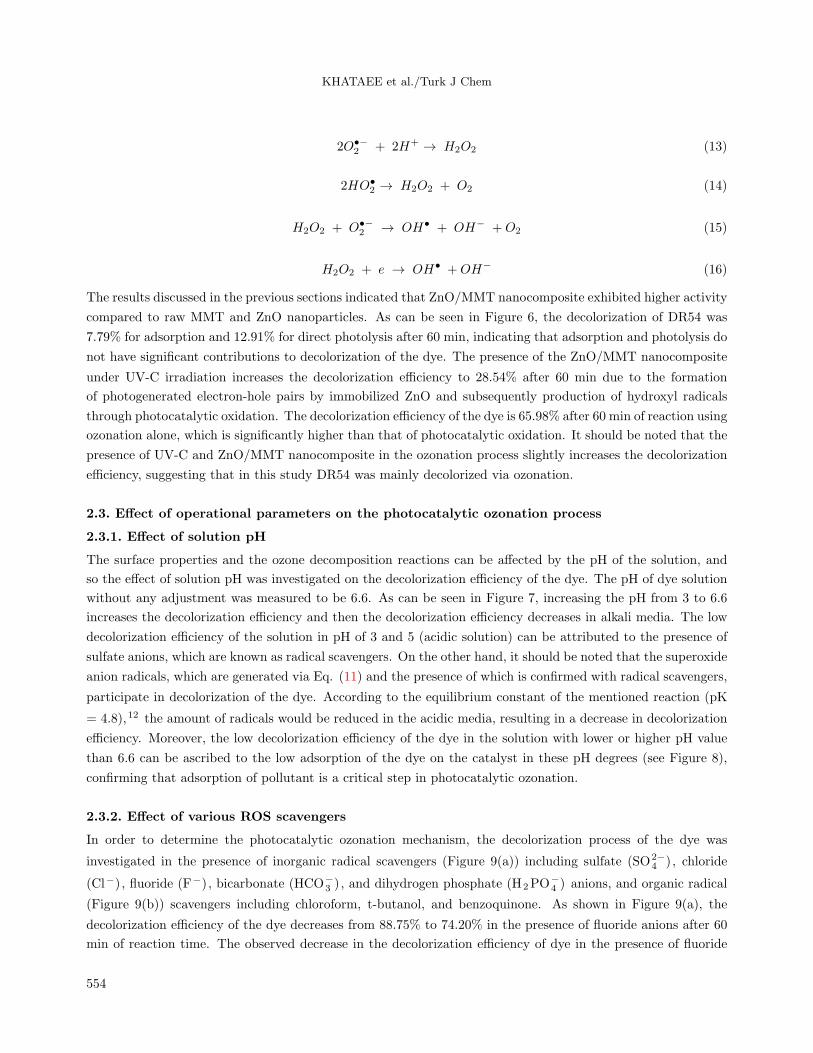
without any adjustment was measured to be 6.6. As can be seen in Figure 7, increasing the pH from 3 to 6.6
increases the decolorization efficiency and then the decolorization efficiency decreases in alkali media. The low
decolorization efficiency of the solution in pH of 3 and 5 (acidic solution) can be attributed to the presence of
sulfate anions, which are known as radical scavengers. On the other hand, it should be noted that the superoxide
anion radicals, which are generated via Eq. (11) and the presence of which is confirmed with radical scavengers,
participate in decolorization of the dye. According to the equilibrium constant of the mentioned reaction (pK
= 4.8),12 the amount of radicals would be reduced in the acidic media, resulting in a decrease in decolorization
efficiency. Moreover, the low decolorization efficiency of the dye in the solution with lower or higher pH value
than 6.6 can be ascribed to the low adsorption of the dye on the catalyst in these pH degrees (see Figure 8),
confirming that adsorption of pollutant is a critical step in photocatalytic ozonation.
2.3.2. Effect of various ROS scavengers
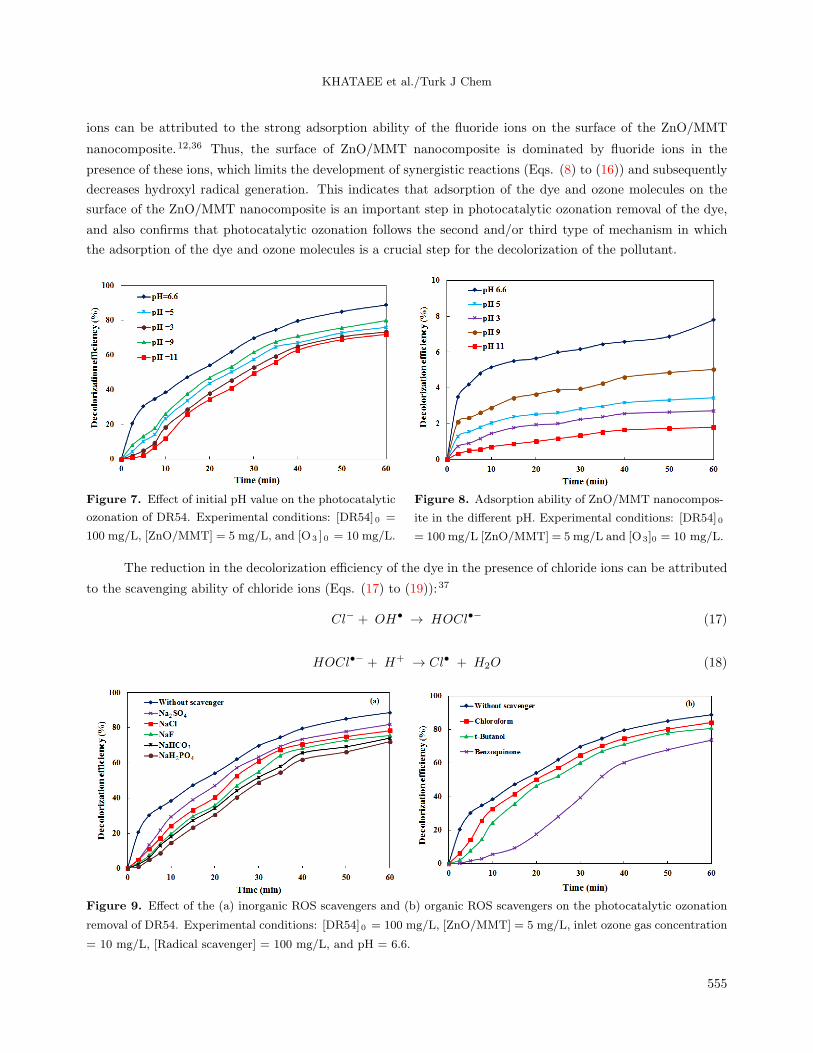
In order to determine the photocatalytic ozonation mechanism, the decolorization process of the dye was
investigated in the presence of inorganic radical scavengers (Figure 9(a)) including sulfate (SO2−4 ), chloride
(Cl−), fluoride (F−), bicarbonate (HCO−3 ), and dihydrogen phosphate (H2PO
−4 ) anions, and organic radical
(Figure 9(b)) scavengers including chloroform, t-butanol, and benzoquinone. As shown in Figure 9(a), the
decolorization efficiency of the dye decreases from 88.75% to 74.20% in the presence of fluoride anions after 60
min of reaction time. The observed decrease in the decolorization efficiency of dye in the presence of fluoride
554
KHATAEE et al./Turk J Chem
ions can be attributed to the strong adsorption ability of the fluoride ions on the surface of the ZnO/MMT
nanocomposite.12,36 Thus, the surface of ZnO/MMT nanocomposite is dominated by fluoride ions in the
presence of these ions, which limits the development of synergistic reactions (Eqs. (8) to (16)) and subsequently
decreases hydroxyl radical generation. This indicates that adsorption of the dye and ozone molecules on the
surface of the ZnO/MMT nanocomposite is an important step in photocatalytic ozonation removal of the dye,
and also confirms that photocatalytic ozonation follows the second and/or third type of mechanism in which
the adsorption of the dye and ozone molecules is a crucial step for the decolorization of the pollutant.
Figure 7. Effect of initial pH value on the photocatalytic
ozonation of DR54. Experimental conditions: [DR54]0 =
100 mg/L, [ZnO/MMT] = 5 mg/L, and [O3 ]0 = 10 mg/L.
Figure 8. Adsorption ability of ZnO/MMT nanocompos-
ite in the different pH. Experimental conditions: [DR54]0
= 100 mg/L [ZnO/MMT] = 5 mg/L and [O3]0 = 10 mg/L.
The reduction in the decolorization efficiency of the dye in the presence of chloride ions can be attributed
to the scavenging ability of chloride ions (Eqs. (17) to (19)):37
Cl− + OH• → HOCl•− (17)
HOCl•− + H+ → Cl• + H2O (18)
Figure 9. Effect of the (a) inorganic ROS scavengers and (b) organic ROS scavengers on the photocatalytic ozonation
removal of DR54. Experimental conditions: [DR54]0 = 100 mg/L, [ZnO/MMT] = 5 mg/L, inlet ozone gas concentration
= 10 mg/L, [Radical scavenger] = 100 mg/L, and pH = 6.6.
555
KHATAEE et al./Turk J Chem
Cl• + Cl• → Cl2 (19)
Dihydrogen phosphate anions react with hydroxyl radical according to Eq. (20), leading to inorganic radicals
with lower reactivity, and so produced radicals do not participate in the decolorization of the dye.38
H2PO−4 +OH• → HPO•−
4 +H2O (20)
The decrease in decolorization efficiency in the presence of bicarbonate ions can be attributed to the hydroxyl
radical decrease, which occurs according to Eq. (2):8
HCO−3 +OH• → CO•−
3 + H2O (21)
In addition, sulfate ions can scavenge the produced hydroxyl radicals via Eq. (22), leading to a decrease in the
decolorization efficiency of the dye:8
SO2−4 + OH• → SO•−
4 +OH− (22)
In addition to the inorganic hydroxyl radical scavengers, the effects of some organic radical scavengers were
investigated on the photocatalytic ozonation removal of DR54. Among the organic radical scavengers, t-
butanol is known as a very commonly used hydroxyl radical scavenger in ozonation systems,39 with reaction
rate constants of 3 × 10⁻³ M−1 s−1 with ozone and 6 × 10⁸ M−1 s−1 with hydroxyl radicals, indicating
that the reaction of the scavenger with ozone molecule can be neglected compared to its reaction with hydroxyl
radicals. As can be seen in Figure 9(b), the presence of t-butanol decreases the decolorization efficiency of DR54
from 88.75% to 80.72% after 60 min of reaction time. The decrease in decolorization efficiency that occurs in
the presence of inorganic scavengers and t-butanol confirms the role of hydroxyl radicals in the decolorization
of the dye during the photocatalytic ozonation process.
Benzoquinone, which is an excellent superoxide anion scavenger,40 was added to the solution to investigate
the effect of superoxide anion on decolorization of the dye. As indicated in Figure 9(b), the decolorization
efficiency decreases from 88.75% to 73.75% in the presence of benzoquinone after 60 min of reaction time,
confirming that the superoxide anion radicals generated according to Eq. (11) exist in the solution and
participate in the decolorization of the dye. The observed reduction in the decolorization efficiency from 88.75%
to 84.23% after 60 min of reaction in the presence of chloroform, as another superoxide anion radical scavenger,
further confirms that superoxide anion radicals (produced via Eq. (11)) participate in the decolorization of
DR54 during the photocatalytic ozonation process.
2.3.3. Effect of initial DR54 concentration
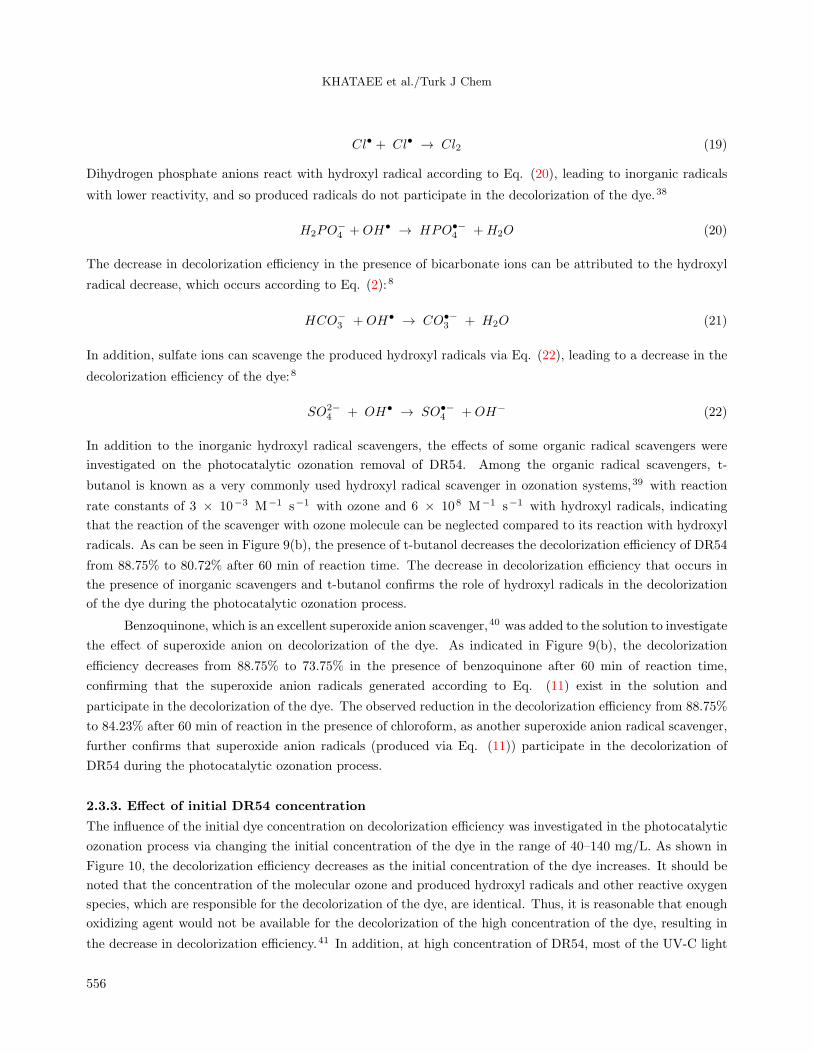
The influence of the initial dye concentration on decolorization efficiency was investigated in the photocatalytic
ozonation process via changing the initial concentration of the dye in the range of 40–140 mg/L. As shown in
Figure 10, the decolorization efficiency decreases as the initial concentration of the dye increases. It should be
noted that the concentration of the molecular ozone and produced hydroxyl radicals and other reactive oxygen
species, which are responsible for the decolorization of the dye, are identical. Thus, it is reasonable that enough
oxidizing agent would not be available for the decolorization of the high concentration of the dye, resulting in
the decrease in decolorization efficiency.41 In addition, at high concentration of DR54, most of the UV-C light
556
KHATAEE et al./Turk J Chem
is absorbed by the dye molecules instead of ZnO nanoparticles immobilized on the MMT, resulting in a decrease
in production of photogenerated electron-hole pairs and consequently resulting in a decrease in the formation
of oxidizing agents, which leads to a decrease in decolorization efficiency.
2.3.4. Effect of the ZnO/MMT nanocomposite concentration
The effect of catalyst concentration on the decolorization of DR54 was investigated over the range of 1 mg/L
to 20 mg/L ZnO/MMT nanocomposite under UV-C irradiation. The results shown in Figure 11 demonstrate
that an increase in catalyst concentration improves the decolorization of the dye via photocatalytic ozonation,
which is in good agreement with the results of other research.29 Indeed, the heterogeneous catalytic surface is
enhanced as the amount of catalyst increases, leading to more hydroxyl radicals generated via Eqs. (8) to (16),
which improves the decolorization efficiency of DR54.
Figure 10. Effect of initial DR54 concentration on the
photocatalytic ozonation of DR54. Experimental condi-
tions: [ZnO/MMT] = 5 mg/L, [O3 ]0 = 10 mg/L, and pH
= 6.6.
Figure 11. Effect of the ZnO/MMT nanocomposite con-
centration on the photocatalytic ozonation of DR54. Ex-
perimental conditions: [DR54]0 = 100 mg/L, [O3 ]0 = 10
mg/L, and pH = 6.6.
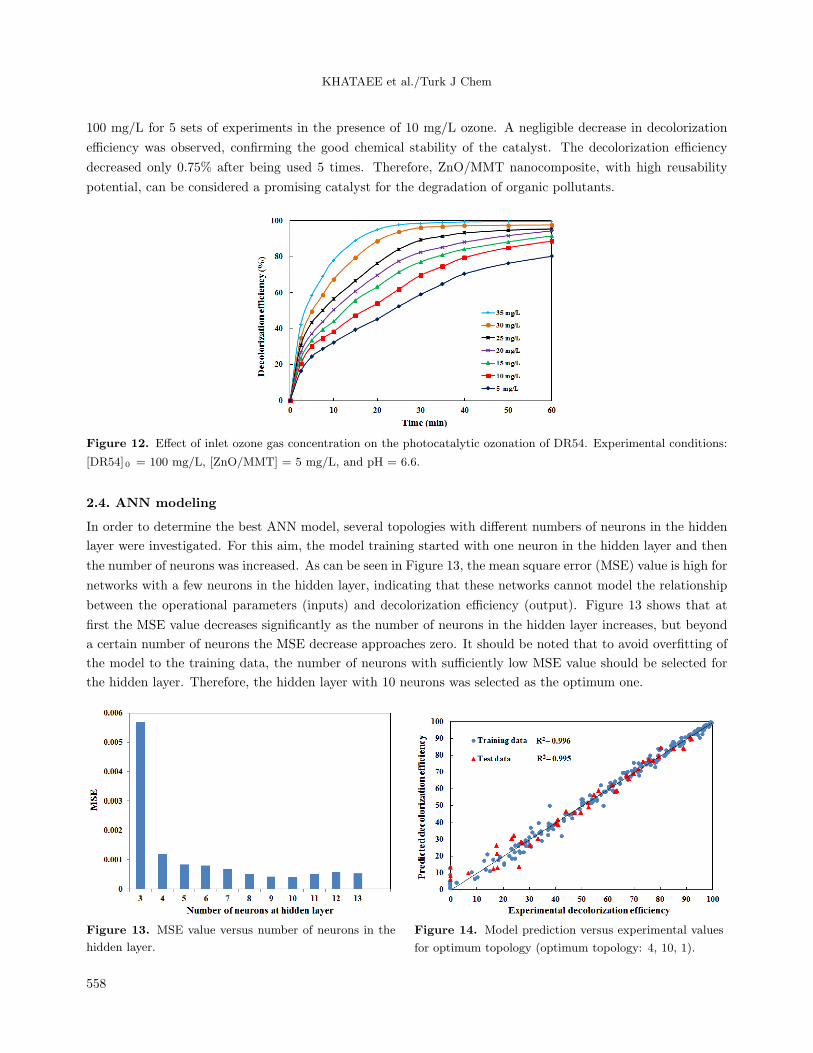
2.3.5. Effect of inlet ozone gas concentration
The effect of ozone concentration in the inlet gas on the decolorization efficiency of DR54 was investigated by
varying the ozone concentration from 5 mg/L to 35 mg/L. As can be seen in Figure 12, increasing the ozone
concentration raises the degradation efficiency, indicating that the reaction is limited by the mass-transfer
phenomenon in the investigated ozone concentration range.41,42 Indeed, increasing the ozone concentration
improves the mass transfer of ozone, resulting in an improvement of decolorization efficiency. In other words,
these results indicate that the decolorization of the dye depends on the concentration of ozone in the inlet gas,
which affects the amount of dissolved ozone and consequently affects the amount of radical hydroxyls produced.
2.3.6. The reusability of the ZnO/MMT nanocomposite
The reusability of catalysts is of great importance from an economic point of view. In order to investigate the
reusability of ZnO/MMT nanocomposite, the catalyst was recovered by centrifugation from the reaction mixture,
washed with distilled water, and reused for the decolorization of fresh dye solution with initial concentration of
557
KHATAEE et al./Turk J Chem
100 mg/L for 5 sets of experiments in the presence of 10 mg/L ozone. A negligible decrease in decolorization
efficiency was observed, confirming the good chemical stability of the catalyst. The decolorization efficiency
decreased only 0.75% after being used 5 times. Therefore, ZnO/MMT nanocomposite, with high reusability
potential, can be considered a promising catalyst for the degradation of organic pollutants.
Figure 12. Effect of inlet ozone gas concentration on the photocatalytic ozonation of DR54. Experimental conditions:
[DR54]0 = 100 mg/L, [ZnO/MMT] = 5 mg/L, and pH = 6.6.
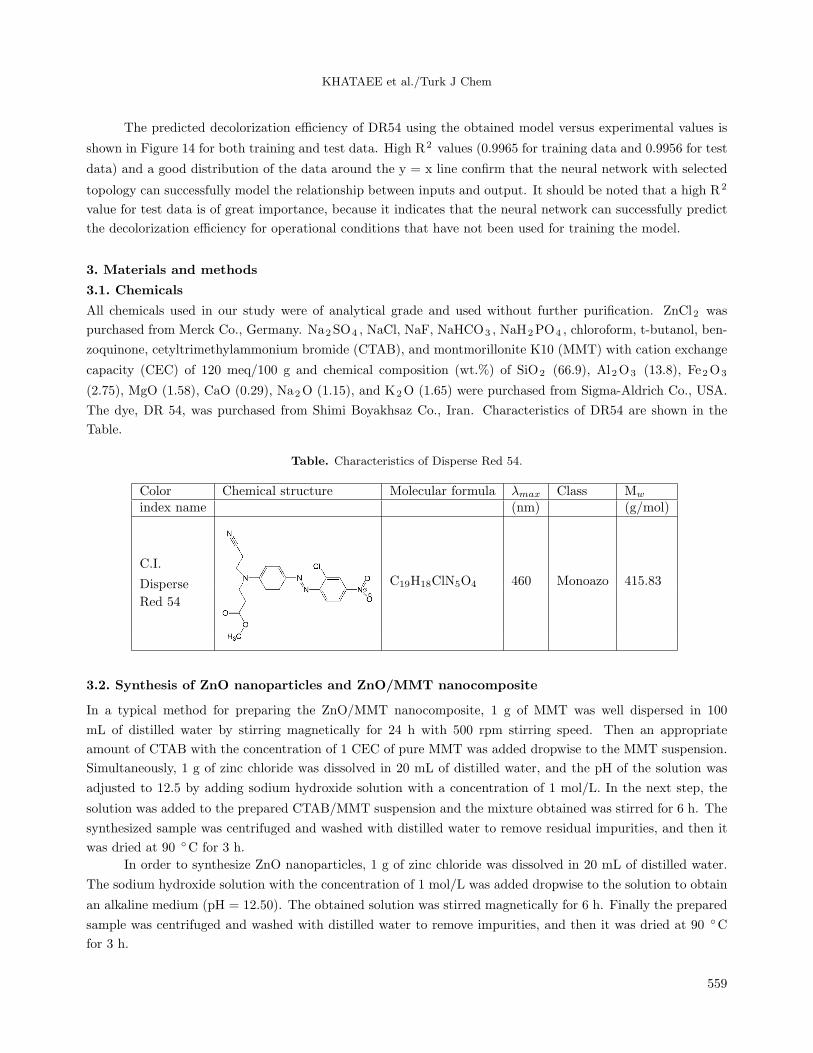
2.4. ANN modeling
In order to determine the best ANN model, several topologies with different numbers of neurons in the hidden
layer were investigated. For this aim, the model training started with one neuron in the hidden layer and then
the number of neurons was increased. As can be seen in Figure 13, the mean square error (MSE) value is high for
networks with a few neurons in the hidden layer, indicating that these networks cannot model the relationship
between the operational parameters (inputs) and decolorization efficiency (output). Figure 13 shows that at
first the MSE value decreases significantly as the number of neurons in the hidden layer increases, but beyond
a certain number of neurons the MSE decrease approaches zero. It should be noted that to avoid overfitting of
the model to the training data, the number of neurons with sufficiently low MSE value should be selected for
the hidden layer. Therefore, the hidden layer with 10 neurons was selected as the optimum one.
Figure 13. MSE value versus number of neurons in the
hidden layer.
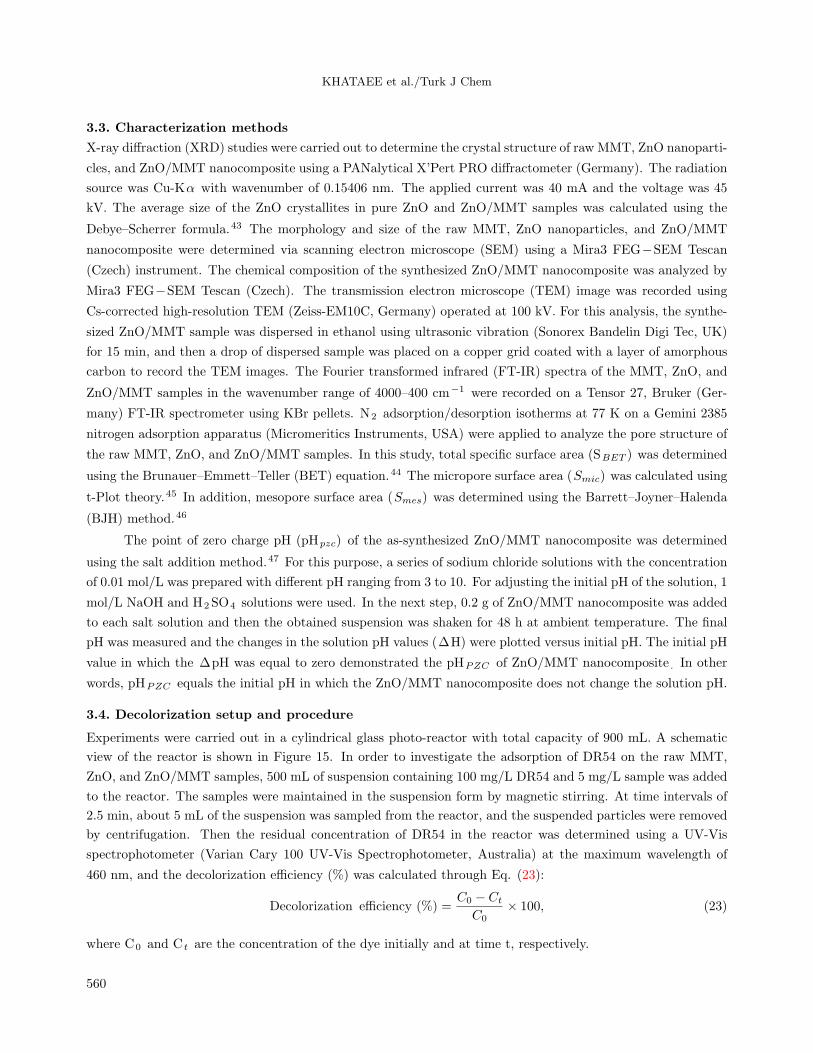
Figure 14. Model prediction versus experimental values
for optimum topology (optimum topology: 4, 10, 1).
558
KHATAEE et al./Turk J Chem
The predicted decolorization efficiency of DR54 using the obtained model versus experimental values is
shown in Figure 14 for both training and test data. High R2 values (0.9965 for training data and 0.9956 for test
data) and a good distribution of the data around the y = x line confirm that the neural network with selected
topology can successfully model the relationship between inputs and output. It should be noted that a high R2
value for test data is of great importance, because it indicates that the neural network can successfully predict
the decolorization efficiency for operational conditions that have not been used for training the model.
3. Materials and methods
3.1. Chemicals
All chemicals used in our study were of analytical grade and used without further purification. ZnCl2 was
purchased from Merck Co., Germany. Na2SO4 , NaCl, NaF, NaHCO3 , NaH2PO4 , chloroform, t-butanol, ben-
zoquinone, cetyltrimethylammonium bromide (CTAB), and montmorillonite K10 (MMT) with cation exchange
capacity (CEC) of 120 meq/100 g and chemical composition (wt.%) of SiO2 (66.9), Al2O3 (13.8), Fe2O3
(2.75), MgO (1.58), CaO (0.29), Na2O (1.15), and K2O (1.65) were purchased from Sigma-Aldrich Co., USA.
The dye, DR 54, was purchased from Shimi Boyakhsaz Co., Iran. Characteristics of DR54 are shown in the
Table.
Table. Characteristics of Disperse Red 54.
Color Chemical structure Molecular formula λmax Class Mw
index name (nm) (g/mol)
C.I.
C19H18ClN5O4 460 Monoazo 415.83Disperse
Red 54
3.2. Synthesis of ZnO nanoparticles and ZnO/MMT nanocomposite
In a typical method for preparing the ZnO/MMT nanocomposite, 1 g of MMT was well dispersed in 100
mL of distilled water by stirring magnetically for 24 h with 500 rpm stirring speed. Then an appropriate
amount of CTAB with the concentration of 1 CEC of pure MMT was added dropwise to the MMT suspension.
Simultaneously, 1 g of zinc chloride was dissolved in 20 mL of distilled water, and the pH of the solution was
adjusted to 12.5 by adding sodium hydroxide solution with a concentration of 1 mol/L. In the next step, the
solution was added to the prepared CTAB/MMT suspension and the mixture obtained was stirred for 6 h. The
synthesized sample was centrifuged and washed with distilled water to remove residual impurities, and then it
was dried at 90 ◦C for 3 h.
In order to synthesize ZnO nanoparticles, 1 g of zinc chloride was dissolved in 20 mL of distilled water.
The sodium hydroxide solution with the concentration of 1 mol/L was added dropwise to the solution to obtain
an alkaline medium (pH = 12.50). The obtained solution was stirred magnetically for 6 h. Finally the prepared
sample was centrifuged and washed with distilled water to remove impurities, and then it was dried at 90 ◦C
for 3 h.
559
KHATAEE et al./Turk J Chem
3.3. Characterization methods
X-ray diffraction (XRD) studies were carried out to determine the crystal structure of raw MMT, ZnO nanoparti-
cles, and ZnO/MMT nanocomposite using a PANalytical X’Pert PRO diffractometer (Germany). The radiation
source was Cu-Kα with wavenumber of 0.15406 nm. The applied current was 40 mA and the voltage was 45
kV. The average size of the ZnO crystallites in pure ZnO and ZnO/MMT samples was calculated using the
Debye–Scherrer formula.43 The morphology and size of the raw MMT, ZnO nanoparticles, and ZnO/MMT
nanocomposite were determined via scanning electron microscope (SEM) using a Mira3 FEG−SEM Tescan
(Czech) instrument. The chemical composition of the synthesized ZnO/MMT nanocomposite was analyzed by
Mira3 FEG−SEM Tescan (Czech). The transmission electron microscope (TEM) image was recorded using
Cs-corrected high-resolution TEM (Zeiss-EM10C, Germany) operated at 100 kV. For this analysis, the synthe-
sized ZnO/MMT sample was dispersed in ethanol using ultrasonic vibration (Sonorex Bandelin Digi Tec, UK)
for 15 min, and then a drop of dispersed sample was placed on a copper grid coated with a layer of amorphous
carbon to record the TEM images. The Fourier transformed infrared (FT-IR) spectra of the MMT, ZnO, and
ZnO/MMT samples in the wavenumber range of 4000–400 cm−1 were recorded on a Tensor 27, Bruker (Ger-
many) FT-IR spectrometer using KBr pellets. N2 adsorption/desorption isotherms at 77 K on a Gemini 2385
nitrogen adsorption apparatus (Micromeritics Instruments, USA) were applied to analyze the pore structure of
the raw MMT, ZnO, and ZnO/MMT samples. In this study, total specific surface area (SBET ) was determined
using the Brunauer–Emmett–Teller (BET) equation.44 The micropore surface area (Smic) was calculated using
t-Plot theory.45 In addition, mesopore surface area (Smes) was determined using the Barrett–Joyner–Halenda
(BJH) method.46
The point of zero charge pH (pHpzc) of the as-synthesized ZnO/MMT nanocomposite was determined
using the salt addition method.47 For this purpose, a series of sodium chloride solutions with the concentration
of 0.01 mol/L was prepared with different pH ranging from 3 to 10. For adjusting the initial pH of the solution, 1
mol/L NaOH and H2SO4 solutions were used. In the next step, 0.2 g of ZnO/MMT nanocomposite was added
to each salt solution and then the obtained suspension was shaken for 48 h at ambient temperature. The final
pH was measured and the changes in the solution pH values (∆H) were plotted versus initial pH. The initial pH
value in which the ∆pH was equal to zero demonstrated the pHPZC of ZnO/MMT nanocomposite . In other
words, pHPZC equals the initial pH in which the ZnO/MMT nanocomposite does not change the solution pH.
3.4. Decolorization setup and procedure
Experiments were carried out in a cylindrical glass photo-reactor with total capacity of 900 mL. A schematic
view of the reactor is shown in Figure 15. In order to investigate the adsorption of DR54 on the raw MMT,
ZnO, and ZnO/MMT samples, 500 mL of suspension containing 100 mg/L DR54 and 5 mg/L sample was added
to the reactor. The samples were maintained in the suspension form by magnetic stirring. At time intervals of
2.5 min, about 5 mL of the suspension was sampled from the reactor, and the suspended particles were removed
by centrifugation. Then the residual concentration of DR54 in the reactor was determined using a UV-Vis
spectrophotometer (Varian Cary 100 UV-Vis Spectrophotometer, Australia) at the maximum wavelength of
460 nm, and the decolorization efficiency (%) was calculated through Eq. (23):
Decolorization efficiency (%) =C0 − Ct
C0× 100, (23)
where C0 and C t are the concentration of the dye initially and at time t, respectively.
560
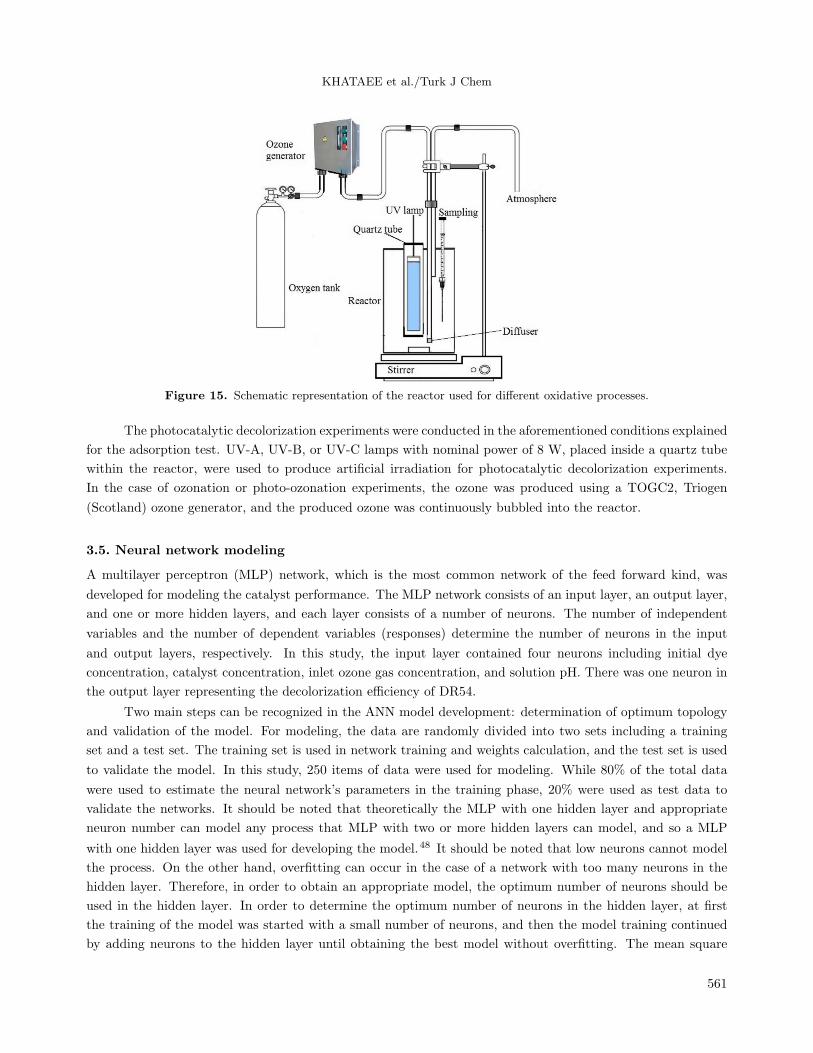
KHATAEE et al./Turk J Chem
Figure 15. Schematic representation of the reactor used for different oxidative processes.
The photocatalytic decolorization experiments were conducted in the aforementioned conditions explained
for the adsorption test. UV-A, UV-B, or UV-C lamps with nominal power of 8 W, placed inside a quartz tube
within the reactor, were used to produce artificial irradiation for photocatalytic decolorization experiments.
In the case of ozonation or photo-ozonation experiments, the ozone was produced using a TOGC2, Triogen
(Scotland) ozone generator, and the produced ozone was continuously bubbled into the reactor.
3.5. Neural network modeling
A multilayer perceptron (MLP) network, which is the most common network of the feed forward kind, was
developed for modeling the catalyst performance. The MLP network consists of an input layer, an output layer,
and one or more hidden layers, and each layer consists of a number of neurons. The number of independent
variables and the number of dependent variables (responses) determine the number of neurons in the input
and output layers, respectively. In this study, the input layer contained four neurons including initial dye
concentration, catalyst concentration, inlet ozone gas concentration, and solution pH. There was one neuron in
the output layer representing the decolorization efficiency of DR54.
Two main steps can be recognized in the ANN model development: determination of optimum topology
and validation of the model. For modeling, the data are randomly divided into two sets including a training
set and a test set. The training set is used in network training and weights calculation, and the test set is used
to validate the model. In this study, 250 items of data were used for modeling. While 80% of the total data
were used to estimate the neural network’s parameters in the training phase, 20% were used as test data to
validate the networks. It should be noted that theoretically the MLP with one hidden layer and appropriate
neuron number can model any process that MLP with two or more hidden layers can model, and so a MLP
with one hidden layer was used for developing the model.48 It should be noted that low neurons cannot model
the process. On the other hand, overfitting can occur in the case of a network with too many neurons in the
hidden layer. Therefore, in order to obtain an appropriate model, the optimum number of neurons should be
used in the hidden layer. In order to determine the optimum number of neurons in the hidden layer, at first
the training of the model was started with a small number of neurons, and then the model training continued
by adding neurons to the hidden layer until obtaining the best model without overfitting. The mean square
561
KHATAEE et al./Turk J Chem
error (MSE) was used to study the relation between the number of neurons in the hidden layer and network
error.41 The tan-sigmoid (hyperbolic tangent sigmoid) (Eq. (24)) and a linear function (Eq. (25)) were used
as the activation function of the hidden layer and output layer, respectively:
f(x) =1
1 + exp (−x)(24)
f(x) = x (25)
Before training the model, all data were normalized over the range of 0 to 1 using Eq. (26):
xi =1
Xmax −Xmin(Xi −Xmin), (26)
where Xmax and Xmin are the highest and the lowest limits of the ith variable, respectively. X i is the actual
value of the ith variable and x i is the dimensionless coded value of the ith variable.
4. Conclusion
In this research, ZnO nanoparticles were immobilized on the surface of MMT through the synthesis of ZnO
nanoparticles in the presence of MMT, resulting in the preparation of ZnO/MMT nanocomposite. The FT-IR
spectrum and SEM and TEM images of the ZnO/MMT nanocomposite confirmed successfully immobilization
of the ZnO nanoparticles on the surface of MMT. The average size of the ZnO plates immobilized on the MMT
was found to be in the range of 30–45 nm. The coexistence of characteristic peaks of both MMT and ZnO in the
XRD pattern of ZnO/MMT nanocomposite confirmed the immobilization of wurtzite ZnO nanoparticles on the
surface of MMT. The average crystallite size of ZnO was calculated about 25 nm in ZnO/MMT sample. The
prepared ZnO/MMT nanocomposite activity was examined for the photocatalytic ozonation of Disperse Red
54 (DR54) under UV-C irradiation and the highest decolorization efficiency (88.75% after 60 min of reaction
time) was obtained for the mentioned process compared to the other systems such as adsorption, photolysis,
single ozonation, catalytic ozonation, and photolysis. The highest decolorization was obtained in pH = 6.6
in which the highest amount of the dye is adsorbed on the ZnO/MMT nanocomposite, indicating that the
adsorption of pollutant on the surface of catalyst is a determining step in the photocatalytic ozonation process.
The reduction of decolorization efficiency in the presence of various organic and inorganic radical scavengers
confirms that hydroxyl radicals and peroxide anion radicals are the main oxidizing species in this process. The
decolorization efficiency increased as the nanocomposite concentration and the inlet ozone gas concentration
increased, but the decolorization efficiency decreased with increasing initial concentration of the dye. The results
of the reusability study demonstrated that synthesized ZnO/MMT nanocomposite had good capability after 5
sets of photocatalytic reaction. Finally, a three-layer perceptron neural network was applied for modeling and
expressing the relationship between decolorization efficiency and operational parameters.
Acknowledgments
The authors thank TUBITAK for support via the 2221- Fellowship Program for Visiting Scientists and Scientists
on Sabbatical Leave. The financial support by the Ataturk University Scientific Research Project Council
(Project No: 2015/117) is gratefully acknowledged. The authors also thank the University of Tabriz (Iran) for
all of the support provided.
562
KHATAEE et al./Turk J Chem
References
1. Fathinia, M.; Khataee, A. R.; Zarei, M.; Aber, S. J. Mol. Catal. A: Chem. 2010, 333, 73-84.
2. Khataee, A. R.; Dehghan, G.; Zarei, M.; Fallah, S.; Niaei, G.; Atazadeh, I. Chem. Ecol. 2013, 29, 221-233.
3. Khataee, A. R.; Marandizadeh, H.; Zarei, M.; Aber, S.; Vahid, B.; Hanifehpour, Y.; Joo, S. W. Curr. Nanosci.
2013, 9, 387-393.
4. Junejo, Y.; Baykal, A. Turk. J. Chem. 2014, 38, 765-774.
5. Khataee, A. R.; Vahid, B.; Behjati, B.; Safarpour, M. Environ. Prog. Sustainable Energy 2013, 32, 557-563.
6. Hassani, A.; Kiransan, M.; Darvishi Cheshmeh Soltani, R.; Khataee, A. R.; Karaca, S. Turk. J. Chem. 2015, 39,
734-749.
7. Khataee, A. R.; Darvishi Cheshmeh Soltani, R.; Hanifehpour, Y.; Safarpour, M.; Gholipour Ranjbar, H.; Joo, S.
W. Ind. Eng. Chem. Res. 2014, 53, 1924-1932.
8. Khataee, A. R.; Khataee, A. R.; Fathinia, M.; Hanifehpour, Y.; Joo, S. W. Ind. Eng. Chem. Res. 2013, 52,
13357-13369.
9. Khataee, A. R.; Fathinia, M.; Aber, S.; Zarei, M. J. Hazard. Mater. 2010, 181, 886-897.
10. Khataee, A. R.; Fathinia, M.; Zarei, M.; Izadkhah, B.; Joo, S. W. J. Ind. Eng. Chem. 2014, 20, 1852-1860.
11. Khataee, A. R.; Safarpour, M.; Zarei, M.; Aber, S. J. Mol. Catal. A: Chem. 2012, 363, 58-68.
12. Fathinia, M.; Khataee, A. R. Appl. Catal., A 2015, 491, 136-154.
13. Khataee, A. R.; Hanifehpour, Y.; Safarpour, M.; Hosseini, M.; Joo, S. Sci. Adv. Mater. 2013, 5, 1074-1082.
14. Khataee, A. R.; Fathinia, M.; Joo, S. W. Spectrochim. Acta Mol. Biomol. Spectros. 2013, 112, 33-45.
15. Zou, L.; Zhu, B. J. Photochem. Photobiol., A 2008, 196, 24-32.
16. Augugliaro, V.; Litter, M.; Palmisano, L.; Soria, J. J. Photochem. Photobiol. 2006, 7, 127-144.
17. Fathinia, M.; Khataee, A.; Naseri, A.; Aber, S. Spectrochim. Acta Mol. Biomol. Spectros. 2015, 136, Part C,
1275-1290.
18. Mohammad Mahmoodi, N. J. Mol. Catal. A: Chem. 2013, 366, 254-260.
19. Liao, G.; Zhu, D.; Li, L.; Lan, B. J. Hazard. Mater. 2014, 280, 531-535.
20. Aguinaco, A.; Beltran, F. J.; Garcıa Araya, J. F.; Oropesa, A. Chem. Eng. J. 2012, 189-190, 275-282.
21. Saraf, L. V.; Engelhard, M. H.; Wang, C. M.; Lea, A. S.; McCready, D. E.; Shutthanandan, V.; Baer, D. R.;
Chambers, S. A. J. Mater. Res. 2007, 22, 1230-1234.
22. Fatimah, I.; Wang, S.; Wulandari, D. Appl. Clay Sci. 2011, 53, 553-560.
23. Habibi, M. H.; Karimi, B. J. Ind. Eng. Chem. 2014, 20, 1566-1570.
24. Su, X.; Zhang, G.; Xu, K.; Wang, J.; Song, C.; Wang, P. Polym. Bull. 2008, 60, 69-78.
25. Lu, X.; Mi, Y. Macromolecules 2005, 38, 839-843.
26. Suresh Babu, K.; Narayanan, V. Chem. Sci. Trans. 2013, 2(S1), S33-S36.
27. Echeverria, J.; Morera, M. T.; Mazkiaran, C.; Garrido, J. J. Eur. J. Soil Sci. 1999, 50, 497-503.
28. Nawrocki, J. Appl. Catal., B 2013, 142, 465-471.
29. Zhai, X.; Chen, Z.; Zhao, S.; Wang, H.; Yang, L. J. Environ. Sci. 2010, 22, 1527-1533.
30. Moussavi, G.; Hossaini, H.; Jafari, S. J.; Farokhi, M. J. Photochem. Photobiol., A 2014, 290, 86-93.
31. Beltran, F. J. Ozone Reaction Kinetics for Water and Wastewater Systems; Boca Raton, FL, USA: CRC Press,
2004.
32. Hammad Khan, M.; Jung, J. Y. Chemosphere 2008, 72, 690-696.
33. Gottschalk, C.; Libra, J. A.; Saupe, A. Ozonation of Water and Waste Water: A Practical Guide to Understanding
Ozone and Its Applications; New York, NY, USA: Wiley, 2009.
563
KHATAEE et al./Turk J Chem
34. Cernigoj, U.; Stangar, U. L.; Trebse, P. Appl. Catal., B 2007, 75, 229-238.
35. Rodrıguez, E. M.; Marquez, G.; Leon, E. A.; Alvarez, P. M.; Amat, A. M.; Beltran, F. J. J. Environ. Manage.
2013, 127, 114-124.
36. Ma, Y.; Zhang, J.; Tian, B.; Chen, F.; Bao, S.; Anpo, M. Res. Chem. Intermed. 2012, 38, 1947-1960.
37. Liao, C. H.; Kang, S. F.; Wu, F. A. Chemosphere 2001, 44, 1193-1200.
38. Mitrovic, J.; Radovic, M.; Bojic, D.; An−delkovic, T.; Purenovic, M.; Bojic, A. J. Serb. Chem. Soc. 2012, 77,
465-481.
39. Hu, C.; Xing, S.; Qu, J.; He, H. J. Phys. Chem. C 2008, 112, 5978-5983.
40. Li, N.; Lu, X.; Zhang, S. Chem. Eng. J. 2014, 257, 253-261.
41. Aghaeinejad Meybodi, A.; Ebadi, A.; Shafiei, S.; Khataee, A. R.; Rostampour, M. J. Taiwan Inst. Chem. Eng.
2014, 48, 40-48.
42. Song, S.; Xu, X.; Xu, L.; He, Z.; Ying, H.; Chen, J.; Yan, B. Ind. Eng. Chem. Res. 2008, 47, 1386-1391.
43. Patterson, A. L. Phys. Rev. 1939, 56, 978.
44. Brunauer, S.; Emmett, P. H.; Teller, E. J. Amer. Chem. Soc. 1938, 60, 309-319.
45. Lippens, B. C.; de Boer, J. H. J. Catal. 1965, 4, 319-323.
46. Barrett, E. P.; Joyner, L. G.; Halenda, P. P. J. Amer. Chem. Soc. 1951, 73, 373-380.
47. Sheydaei, M.; Aber, S. Clean 2013, 41, 890-898.
48. Arefi Oskoui, S.; Niaei, A.; Tseng, H. H.; Salari, D.; Izadkhah, B.; Hosseini, S. A. ACS. Comb. Sci. 2013, 15,
609-621.
564