preparation and characterization of …etd.lib.metu.edu.tr/upload/12613291/index.pdf ·...
TRANSCRIPT

PREPARATION AND CHARACTERIZATION OF ORGANOCLAY-POLYPROPYLENE NANOCOMPOSITES WITH MALEIC ANHYDRIDE
GRAFTED POLYPROPYLENE COMPATIBILIZER
A THESIS SUBMITTED TO THE GRADUATE SCHOOL OF NATURAL AND APPLIED SCIENCES
OF MIDDLE EAST TECHNICAL UNIVERSITY
BY
ŞULE SEDA YILMAZ
IN PARTIAL FULFILLMENT OF THE REQUIREMENTS FOR
THE DEGREE OF MASTER OF SCIENCE IN
CHEMICAL ENGINEERING
JUNE 2011

Approval of the thesis:
PREPARATION AND CHARACTERIZATION OF ORGANOCLAY-POLYPROPYLENE NANOCOMPOSITES WITH MALEIC ANHYDRIDE GRAFTED
POLYPROPYLENE COMPATIBILIZER
submitted by ŞULE SEDA YILMAZ in partial fulfillment of the requirements for the degree of Master of Science in Chemical Engineering Department, Middle East Technical University by, Prof. Dr. Canan Özgen ____________________ Dean, Graduate School of Natural and Applied Sciences Prof. Dr. Deniz Üner ____________________ Head of Department, Chemical Engineering Prof. Dr. Ülkü Yılmazer ____________________ Supervisor, Chemical Engineering Dept., METU Examining Committee Members: Prof. Dr. Hayrettin Yücel _____________________ Chemical Engineering Dept., METU Prof. Dr. Ülkü Yılmazer _____________________ Chemical Engineering Dept., METU Prof. Dr. Erdal Bayramlı _____________________ Chemistry Dept., METU Prof. Dr. Necati Özkan _____________________ Polymer Science and Technology Dept., METU Assoc. Prof. Dr. Halil Kalıpçılar _____________________ Chemical Engineering Dept., METU
Date: 15.06.2011

iii
I hereby declare that all information in this document has been obtained and presented in accordance with academic rules and ethical conduct. I also declare that, as required by these rules and conduct, I have fully cited and referenced all material and results that are not original to this work. Name, Last name: Şule Seda YILMAZ Signature:

iv
ABSTRACT
PREPARATION AND CHARACTERIZATION OF ORGANOCLAY-POLYPROPYLENE NANOCOMPOSITES WITH MALEIC ANHYDRIDE
GRAFTED POLYPROPYLENE COMPATIBILIZER
YILMAZ, Şule Seda
M.Sc., Department of Chemical Engineering
Supervisor: Prof. Dr. Ülkü YILMAZER
June 2011, 129 pages
The aim of this study was to improve the mechanical properties “Moplen” EP300L
which is a heterophase copolymer. Polymer blends and nanocomposites were
prepared by melt compounding method in a twin screw extruder. Nanofil® 5 (N5) and
Nanofil® 8(N8) were used as the organoclays, and maleic anhydride grafted
polypropylene (M) was used as the compatibilizer. The effects of additive
concentrations and types of organoclays on the morphology, mechanical and thermal
properties were investigated.
Organoclay loading over 2 wt% prevented the intercalation mechanism resulting in
large aggregates of clay, thus the material properties became poor even in the
presence of compatibilizer. Compatibilizer addition improved the intercalation ability
of the polymer, however a substantial increase in mechanical properties was not
obtained up to 6 wt % loading of the compatibilizer.
XRD analysis revealed that intercalated structures were formed with the addition of
compatibilizer and organoclay. The nanocomposites that were prepared with N5 type
organoclay showed delaminated structures at 6 wt % compatibilizer loading.

v
Nanofill ® 5 exhibited the highest improvements in mechanical properties, since the
degree of organoclay dispersion was better in Nanofill ® 5 containing
nanocomposites in comparison to Nanofill ® 8 containing ones. The DSC analysis
indicated a insignificant reduction in the melting temperature of the ternary
nanocomposites.
Keywords: Polypropylene; Nanocomposite; Organoclay; Compatibilizer; Extrusion

vi
ÖZ
MALEİK ANHİDRİT AŞILANMIŞ POLİPROPİLEN UYUMLAŞTIRICISI İÇEREN ORGANOKİL-POLİPROPİLEN NANOKOMPOZİTLERİN
HAZIRLANMASI VE KARAKTERİZASYONU
YILMAZ, Şule Seda
Yüksek Lisans, Kimya Mühendisliği
Tez Yöneticisi: Prof. Dr. Ülkü YILMAZER
Haziran 2011, 129 sayfa
Bu çalışmanın amacı, heterofaz yapılı “Moplen” EP300L polipropilen malzemesinin
mekanik özelliklerinin iyileştirilmesidir. Polimer karışımları ve nanokompozitleri, çift
vidalı bir ekstruderde eriyik karıştırma metoduyla hazırlanmışlardır. Organik kil olarak
Nanofill ® 5 ve Nanofill ® 8, uyumlaştırıcı olarak ise maleik anhidrit aşılanmış
polipropilen (M) kullanılmıştır. Katkı maddesi konsantrasyonlarının ve organik kil
tiplerinin morfoloji ile, mekanik ve ısıl özelliklerine etkileri araştırılmıştır.
Kütlece 2%’den fazla organik kil eklenmesi, büyük kil topaklarının oluşumu sonucu,
uyumlaştıcının var olduğu durumlarda dahi tabakaların aralanma mekanizmasını ve
malzeme özelliklerini kötüleştirmiştir. Uyumlaştırıcı eklenmesi polimerin tabakaların
arasına girme kabiliyetini iyileştirmiş, ancak mekanik özelliklerde ağırlıkça %6
uyumlaştırıcı derişimine kadar önemli bir artış elde edilmemiştir.
XRD analiz sonuçlarına göre uyumlaştırıcı ve organokil eklenmesi ile polimerin kil
tabakaları arasına girdiği ve dağılımı iyi yapılar oluşturduğu görülmüştür. Nanofill ® 5
ile üretilen kompozitlerin %6 uyumlaştırıcı eklenmesi ile matris içinde daha iyi
dağıldığı gözlemlenmiştir.

vii
Organik kil dağılım derecesinin Nanofill ® 5 ile üretilen nanokompozitlerde daha iyi
olduğu görülmüştür ve dolayısı ile bu malzemelerin mekanik özelliklerindeki artış da
Nanofill ® 8 ile üretilen kompozitlerden daha fazladır. DSC analizleri, üçlü
kompozitlerin erime sıcaklıklarında çok az bir azalma olduğu gözlemlenmiştir.
Anahtar Kelimeler: Polipropilen; Nanokompozit; Organik Kil; Uyumlaştırıcı;
Ekstrüzyon

viii
To my parents and grandparents

ix
ACKNOWLEDGEMENTS
I would like to express my deepest gratitude to my supervisor, Prof. Dr. Ülkü
Yılmazer, for his continuous support, guidance, constructive criticism, advice, and
insight throughout my thesis study. It was a pleasing honor for me to work with him.
I am greateful to Prof. Dr. Göknur Bayram from Department of Chemical Engineering
for letting me use the instruments in her laboratory. Special thanks go to Cengiz Tan
from Department of Metallurgical and Materials Engineering for SEM analysis,
Mihrican Açıkgöz from Department of Chemical Engineering for DSC analysis, and
Necmi Avcı from Department of Metallurgical Engineering for XRD analysis.
I would like to thank my dear friends Sibel Dönmez, Bijen Kadaifçi, Sena Yüzbaşı,
Ayşe İrem Balcı, Didem Polat, Edibe Eda Oral, Gamzenur Özsin, and Berk Baltacı for
their endless support and for making my graduate study enjoyable and full of
friendship.
I sincerely thank to Canan Yeniova and Wissam Abdallah for their help, advice and
contributions during my study. Friendly and helpful support of all my friends in the
Polymer Laboratory including Sertan Yeşil, Tijen Seyidoğlu, Ali Sinan Dike, Fatma
Işık, and Fadile Kapaklı are also greatly acknowledged.
I am forever greateful to my parents Mehmet and Nilgün Yılmaz, my brother Yunus
Emre Yılmaz, my love M. Asım Ay and all my family for their endless love,
encouragement and support trough out my life.
This study was supported by SAN-TEZ 00112.STZ.2007-1.

x
TABLE OF CONTENT
ABSTRACT ………………………………………………………………………..……….iv
ÖZ …………………………………………………………………………………………vi
ACKNOWLEDGEMENTS ……………………………………………………………….ix
TABLE OF CONTENTS …………………………………………………………………x
LIST OF TABLES ………………………………………………………………………xiii
LIST OF FIGURES ………………………………………………………………………xiv
NOMENCLATURE ………………………………………………………………………xx
CHAPTERS
1. INTRODUCTION ………………………...........................................................1
2. BACKGROUND …………………………….....................................................5
2.1 Composite Materials ……...........................................................................5
2.1.1 Types of Composites …....................................................................6
2.1.2 Polymer Matrix Composites ..…........................................................7
2.2 Nanocomposites …...................................................................................7
2.2.1 Polymer Layered Silicate Nanocomposites (PLSN) ...........................8
2.2.1.1 Organically Modified Layered Silicates …….........................8
2.2.2 Nanocomposite Types ..………........................................................10
2.2.3 Nanocomposite Preparation Methods ………...................................11
2.2.3.1 In-situ Polymerization Method ……...................................11
2.2.3.2 Solution Intercalation …...................................................12
2.2.3.3 Sol-Gel Technology ……..................................................13
2.2.3.4 Melt Intercalation ………...................................................13
2.3 Polymer Matrix of the Study ...................................................................14
2.3.1 Polypropylene .................................................................................14
2.3.1.1 Polymerization, Structure and Tacticity of Polypropylene ..15
2.4 Polypropylene Nanocomposites …..........................................................16
2.4.1 Maleic Anhydride (MAH) Functionality .............................................18
2.5 Polymer Processing ...............................................................................19
2.5.1 Extrusion .......................................................................................19

xi
2.5.1.1 Screw Design ..................................................................20
2.5.1.2 Extruder Types .................................................................21
2.5.2 Injection Molding .............................................................................23
2.6 Characterization of Nanocomposites ……................................................24
2.6.1 Mechanical Properties ………………...............................................24
2.6.1.1 Tensile Test ………...........................................................24
2.6.1.2 Impact Test ……...............................................................27
2.6.2 Thermal Analysis ………..................................................................28
2.6.2.1 Differential Scanning Calorimetry (DSC) …........................28
2.6.3 Morphological Analysis ………..........................................................30
2.6.3.1 X-Ray Diffraction (XRD) Analysis .....................................30
2.6.3.2 Scanning Electron Microscopy (SEM) ..............................32
2.7 Previous Studies ………………................................................................32
3. EXPERIMENTAL ………………......................................................................35
3.1 Materials ……………...............................................................................35
3.1.1 Polymer Matrix ……………................................................................35
3.1.2 Organoclays ……………....................................................................36
3.1.2.1 Nanofill ® 8 ………….........................................................36
3.1.2.2 Nanofill ® 5 ……….............................................................37
3.1.3 Compatibilizers …............................................................................39
3.2 Preparation of Nanocomposites …….......................................................40
3.2.1 Injection Molding …………...............................................................46
3.3 Characterization ………..…......................................................................47
3.3.1 Morphological Testing Procedure and Equipment …….....................47
3.3.1.1 X-Ray Diffraction Analysis …….........................................47
3.3.1.2 Scanning Electron Microscopy (SEM) Analysis ….............47
3.3.2 Mechanical Properties ………...........................................................48
3.3.2.1 Tensile Test …………………..............................................49
3.3.2.2 Impact Test ……….…….....................................................50
3.3.3 Thermal Analysis …………...............................................................50
3.3.3.1 Differential Scanning Calorimetry (DSC) Analysis …..........51
4. RESULTS AND DISCUSSION ………………..................................................52
4.1. Morphological Analysis ………….............................................................52
4.1.2 X-RAY Diffraction Analysis ………....................................................52
4.1.2.1 Effects of Compatibilizer …….............................................55

xii
4.1.2.2 Effects of Clay Content ………...........................................62
4.1.2.3 Effects of Clay Type …………............................................66
4.1.3 Scanning Electron Microscopy Analysis (SEM) …………..................71
4.1.3.1 Effects of Clay Content ……………...................................73
4.1.3.2 Effects of Compatibilizer Content ……...............................74
4.1.3.3 Ternary Nanocomposites ……………................................76
4.1.3.4 Effects of Clay Type ……………........................................78
4.2 Mechanical Properties …………...............................................................80
4.2.1 Tensile Tests ………………..................................................80
4.2.1.1 Effects of Compatibilizer ……….….....................................81
4.2.1.2 Effects of Clay Content ……..............................................85
4.2.1.3 Improved Nanocomposites ……………..............................89
4.2.1.4 Effects of Clay Type …………............................................92
4.2.2 Impact Test ……………........................................................95
4.2.2.1 Effects of Clay Content ……..............................................95
4.2.2.2 Effects of Compatibilizer Content …..................................97
4.2.2.3 Effects of Clay Type ……...................................................99
4.3 Differential Scanning Calorimetry (DSC) Analysis ..………...........100
5. CONCLUSIONS ……….…………………………......................................105
REFERENCES ………………..................................................................107
APPENDICES ……………........................................................................115
xiii
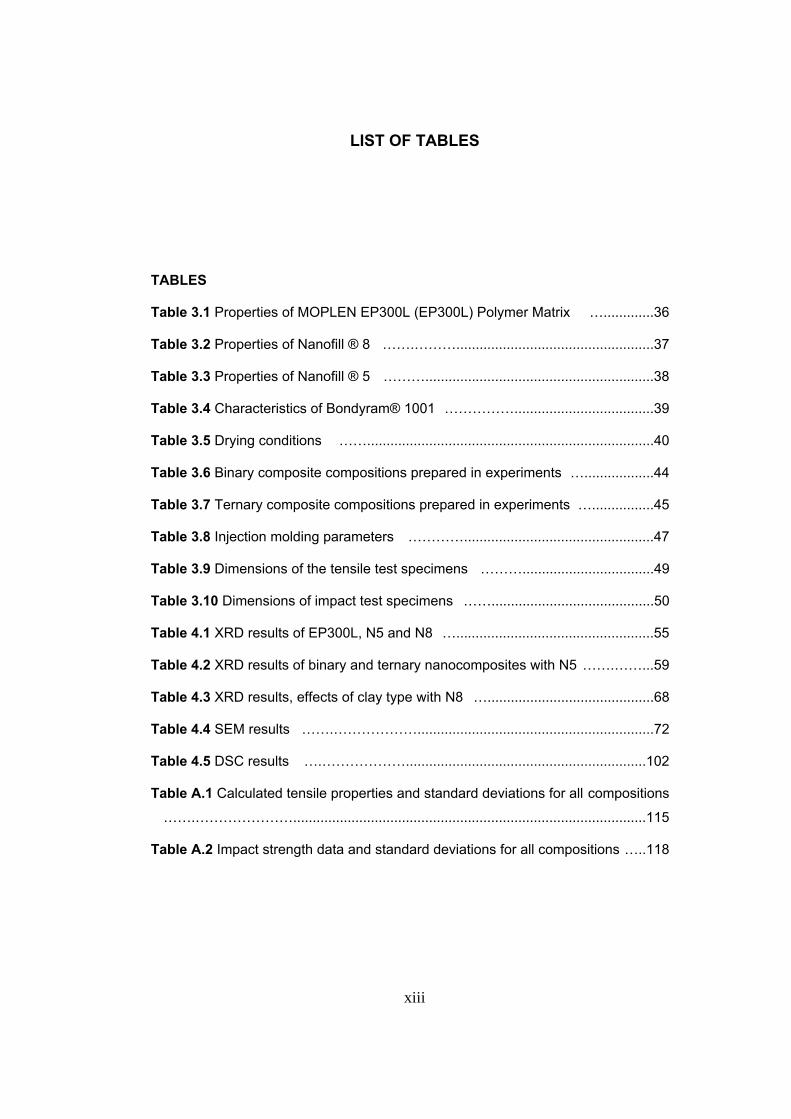
LIST OF TABLES
TABLES
Table 3.1 Properties of MOPLEN EP300L (EP300L) Polymer Matrix ….............36
Table 3.2 Properties of Nanofill ® 8 …….………...................................................37
Table 3.3 Properties of Nanofill ® 5 ………...........................................................38
Table 3.4 Characteristics of Bondyram® 1001 ……………....................................39
Table 3.5 Drying conditions ……..........................................................................40
Table 3.6 Binary composite compositions prepared in experiments …..................44
Table 3.7 Ternary composite compositions prepared in experiments …................45
Table 3.8 Injection molding parameters ………….................................................47
Table 3.9 Dimensions of the tensile test specimens ………..................................49
Table 3.10 Dimensions of impact test specimens ……..........................................50
Table 4.1 XRD results of EP300L, N5 and N8 …...................................................55
Table 4.2 XRD results of binary and ternary nanocomposites with N5 …….……...59
Table 4.3 XRD results, effects of clay type with N8 …...........................................68
Table 4.4 SEM results …….……………….............................................................72
Table 4.5 DSC results ….………………..............................................................102
Table A.1 Calculated tensile properties and standard deviations for all compositions
…….…………………...........................................................................................115
Table A.2 Impact strength data and standard deviations for all compositions …..118

xiv
LIST OF FIGURES
FIGURES
Figure 2.1 Structure of 2:1 layered silicates ………...............................................9
Figure 2.2 Idealized structures of organically modified silicates ……....................10
Figure 2.3 Nanocomposite types ………..............................................................11
Figure 2.4 In-situ polymerization methods ………….............................................12
Figure 2.5 Solution intercalation method ............................................................13
Figure 2.6 Melt intercalation method …….............................................................14
Figure 2.7 Polymerization of polypropylene …......................................................15
Figure 2.8 Stereochemical configurations of polypropylene .................................16
Figure 2.9 Structure of maleic anhydride grafted polypropylene and its reaction with
hydroxyl groups ………….....................................................................................18
Figure 2.10 Schematic representation of the intercalation process of MAPP …....19
Figure 2.11 A simple extruder scheme and representation of the sections ...........20
Figure 2.12 The sections of an extruder screw ………..........................................21
Figure 2.13 Different types of screw configurations for twin-screw extruders .......22
Figure 2.14 Screw configurations for twin screw extruders …..............................22
Figure 2.15 Co-rotating twin-screw extruder used in nanocomposite production in
this study …….......................................................................................................23
Figure 2.16 Tensile test machine and dog bone shaped specimen …...................25
Figure 2.17 Idealized stress-strain curve for a polymer that undergoes ductile failure
…………….........................................................................................................26

xv
Figure 2.18 Stress–strain curves at various temperatures (increasing from a to e): (a)
low extensibility followed by brittle fracture; (b) localized yielding followed by fracture;
(c) necking and cold drawing; (d) homogeneous deformation with indistinct yield; (e)
rubber-like behavior ...…….................................................................................27
Figure 2.19 Charpy and Izod impact tests ………................................................28
Figure 2.20 Power compensated differential scanning calorimeter ……...............29
Figure 2.21 Typical DSC curves ………..............................................................30
Figure 2.22 Diffraction of X-Rays …....................................................................31
Figure 2.23 Schematic diagram representing the main components of a scanning
electron microscope ……….................................................................................32
Figure 3.1 Chemical structure of Nanofill ® 8 ……..............................................37
Figure 3.2 Chemical structure of Nanofill ® 5 …...................................................38
Figure 3.3 Chemical structure of maleic anhydride grafted polypropylene ...........39
Figure 3.4 Thermoprism TSE 16 TC twin-screw extruder …...............................41
Figure 3.5 Schematic diagram of processing parameters; barrel temperature and
screw speed ……….............................................................................................42
Figure 3.6 Flow chart for nanocomposite production and characterization ...........43
Figure 3.7 Injection molding equipment ……........................................................46
Figure 3.8 Specimens used in morphological analysis …......................................48
Figure 3.9Tensile test specimen ………...............................................................49
Figure 3.10 Impact test specimen …….................................................................50
Figure 4.1 X-Ray Diffraction pattern of EP300L ……............................................53
Figure 4.2 XRD pattern of Nanofill ® 5 (N5) in powder form …….........................54
Figure 4.3 XRD pattern of Nanofill ® 8 (N8) in powder form …….........................55
Figure 4.4 XRD pattern of binary composites of N5 ……..………......................56
Figure 4.5 XRD patterns of ternary composites with 2wt%, 3wt%, 4wt%, 6wt% and
8wt% compatibilizer and 1wt% clay loadings …………..........................................57

xvi
Figure 4.6 XRD patterns of ternary composites with 2wt%, 3wt%, 4wt%, 6wt% and
8wt% compatibilizer M and 2wt% clay loadings ……..……....................................61
Figure 4.7 XRD patterns of ternary composites with 2wt%, 3wt%, 4wt%, 6wt% and
8wt% compatibilizer M and 3wt% clay loadings ………..…………………………….61
Figure 4.8 XRD patterns of ternary composites with 2wt%, 3wt%, 4wt%, 6wt% and
8wt% compatibilizer M and 4wt% clay loadings ……….……………........................62
Figure 4.9 XRD patterns of ternary composites with 1wt%, 2wt%, 3wt% and 4wt%
clay and 2wt% compatibilizer M loadings ……….…...............................................63
Figure 4.10 XRD patterns of ternary composites with 1wt%, 2wt%, 3wt% and 4wt%
clay and 3wt% compatibilizer M loadings ……..………………….............................64
Figure 4.11 XRD patterns of ternary composites with 1wt%, 2wt%, 3wt% and 4wt%
clay and 4wt% compatibilizer M loadings …….……………………………................64
Figure 4.12 XRD patterns of ternary composites with 1wt%, 2wt%, 3wt% and 4wt%
clay and 6wt% compatibilizer M loadings …….…...................................................65
Figure 4.13 XRD patterns of ternary composites with 1wt%, 2wt%, 3wt% and 4wt%
clay and 8wt% compatibilizer M loadings …….……………….................................65
Figure 4.14 XRD patterns of binary composites prepared with Nanofill® 8 ….......67
Figure 4.15 XRD patterns of ternary nanocomposites with different Nanofill® 8 and
low compatibilizer loadings …….………………......................................................69
Figure 4.16 XRD patterns of ternary nanocomposites with different Nanofill® 8 and
high compatibilizer loadings …….……….…………................................................70
Figure 4.17 SEM micrographs of EP300L extruded once a) x250 b) x3000 ….…..73
Figure 4.18 SEM micrographs of binary composites with organoclay N5 a) 1wt% N5
(x250) b) 1wt% N5 (x3000) c) 8 wt% of N5 (x250) d) 8 wt% of N5 (x3000) ….……74
Figure 4.19 SEM micrographs of binary blends with compatibilizer a) 2wt% M (x250)
b) 2 wt% M (x3000) c) 6 wt% of M (x250) d) 6 wt% of M (x3000) ……….………....75
Figure 4.20 SEM micrographs of ternary composites a) 6M1N5 (x250) b) 6M1N5
(x3000) c) 6M2N5 (x250) d) 6M2N5 (x3000) e) 6M4N5 (x250) f) 6M4N5 (x3000)
…….………………………………………………………………………………………..77

xvii
Figure 4.21 SEM micrographs of binary composites with organoclay N8 a) 1wt% N8
(x250) b) 1wt% N8 (x3000) c) 8 wt% of N8 (x250) d) 8 wt% of N8 (x3000) ….…....79
Figure 4.22 SEM micrographs of ternary composites with organoclay N8 a) 3M1N8
(x250) b) 3M1N8 (x3000) …….……………….........................................................80
Figure 4.23 Typical engineering stress-strain curve of EP300L polymer matrix.
…….……………………………………………………………………….………...........81
Figure 4.24 Young’s Modulus of binary blends and ternary nanocomposites prepared
with compatibilizer M and N5 clay at different loadings ……….………...................83
Figure 4.25 Tensile stress at yield values of binary blends and ternary
nanocomposites prepared with compatibilizer M and N5 clay at different loadings
………….…………………………………………………………………………………..83
Figure 4.26 Tensile strength values of of binary blends and ternary nanocomposites
prepared with compatibilizer M and N5 clay at different loadings …..…….............84
Figure 4.27 Elongation at break (%) values of binary blends and ternary
nanocomposites prepared with compatibilizer M and N5 clay at different loadings
……………..…………….…………………………………………………………………84
Figure 4.28 Young’s Modulus of binary and ternary nanocomposites prepared with
compatibilizer M and N5 at different loadings ……................................................86
Figure 4.29 Tensile stress at yield values of binary and ternary nanocomposites
prepared with compatibilizer M and N5 at different loadings ….………………........87
Figure 4.30 Tensile strength values of binary and ternary nanocomposites prepared
with compatibilizer M and N5 at different loadings ………………...........................88
Figure 4.31 Elongation at break (%) values of binary and ternary nanocomposites
prepared with compatibilizer M and N5 at different loadings …..............................88
Figure 4.32 Young’s Modulus of ternary nanocomposites prepared with 6 wt%
compatibilizer M and N5 at different loadings of clay …………………....................89
Figure 4.33 Tensile stresses at yield values of ternary nanocomposites prepared
with 6 wt% compatibilizer M and N5 at different loadings of clay ………................90
Figure 4.34 Tensile strength values of ternary nanocomposites prepared with 6 wt%
compatibilizer M and N5 at different loadings of clay ……………...........................90

xviii
Figure 4.35 Elongation at break (%) values of ternary nanocomposites prepared with
6 wt% compatibilizer M and N5 at different loadings of clay ……….......................91
Figure 4.36 Young’s Modulus of binary and ternary nanocomposites prepared with
N8 at low content and compatibilizer M at different loadings ….….........................93
Figure 4.37 Tensile stress at yield values of binary and ternary nanocomposites
prepared with N8 at low content and compatibilizer M at different loadings ….......93
Figure 4.38 Tensile strength values of binary and ternary nanocomposites prepared
with N8 at low content and compatibilizer M at different loadings ….………...........94
Figure 4.39 % Elongation at break values of binary and ternary nanocomposites
prepared with N8 at low content and compatibilizer M at different loadings …........94
Figure 4.40 Impact strength values of binary and ternary nanocomposites prepared
with N5 and compatibilizer M at different loadings …….…….................................96
Figure 4.41 Impact strength values of binary blends and ternary nanocomposites
prepared with N5 and compatibilizer M at different loadings ………………….........98
Figure 4.42 Impact strength values of binary and ternary nanocomposites prepared
with N8 and compatibilizer M at different loadings ..…….....................................100
Figure 4.43 DSC thermogram of EP300L ..…....................................................101
Figure 4.44 DSC thermogram of compatibilizer M ….…………...........................101
Figure B.1 DSC thermogram of binary blend containing 2 wt% M …….…..........120
Figure B.2 DSC thermogram of binary blend containing 6 wt% M …….…...........121
Figure B.3 DSC thermogram of binary nanocomposite containing 1 wt% Nanofill ® 5
……….………….................................................................................................121
Figure B.4 DSC thermogram of binary nanocomposite containing 8 wt% Nanofill ® 5
…..………………………………………………………………………………………..122
Figure B.5 DSC thermogram of binary nanocomposite containing 1 wt% Nanofill ® 8
….………….........................................................................................................122
Figure B.6 DSC thermogram of binary nanocomposite containing 8 wt% Nanofill® 8
……….................................................................................................................123

xix
Figure B.7 DSC thermogram of ternary nanocomposite containing 2 wt% Nanofill ®
5 and 2 wt% M …….…….....................................................................................123
Figure B.8 DSC thermogram of ternary nanocomposite containing 2 wt% Nanofill ®
5 and 3 wt% M ………………...............................................................................124
Figure B.9 DSC thermogram of ternary nanocomposite containing 2 wt% Nanofill ®
5 and 4 wt% M ……….………..............................................................................124
Figure B.10 DSC thermogram of ternary nanocomposite containing 1 wt% Nanofill ®
5 and 6 wt% M …..………………………………………………………………………125
Figure B.11 DSC thermogram of ternary nanocomposite containing 2 wt% Nanofill ®
5 and 6 wt% M ………………………………………………………………………….125
Figure B.12 DSC thermogram of ternary nanocomposite containing 3 wt% Nanofill ®
5 and 6 wt% M ……..………….............................................................................126
Figure B.13 DSC thermogram of ternary nanocomposite containing 4 wt% Nanofill ®
5 and 6 wt% M …..……………..............................................................................126
Figure B.14 DSC thermogram of ternary nanocomposite containing 2 wt% Nanofill ®
5 and 8 wt% M …….…………………………………………………………………….127
Figure B.15 DSC thermogram of ternary nanocomposite containing 2 wt% Nanofill ®
8 and 2 wt% M …..…………………......................................................................127
Figure B.16 DSC thermogram of ternary nanocomposite containing 2 wt% Nanofill ®
8 and 3 wt% M ………………………………………………………………………….128
Figure B.17 DSC thermogram of ternary nanocomposite containing 2 wt% Nanofill ®
8 and 4 wt% M ……….…………...........................................................................128
Figure B.18 DSC thermogram of ternary nanocomposite containing 2 wt% Nanofill ®
8 and 6 wt% M …….…………………………………………………………………….129

xx
NOMENCLATURE
A Average area of domains in SEM analysis, μm2
Ai Area of a number of domains in SEM analysis, μm2
A0 Cross-sectional area of the gauge region, mm2
d Interlayer spacing, Å
dav Average domain size, nm
d Average domain size, nm
D Distance between grips of tensile test specimen, mm
D Diameter of the screws, mm
E Young’s Modulus, MPa
F Force, N
g Gauge length of tensile test specimen, mm
ΔH f Heat of fusion, J/g
ΔHºf Heat of fusion for pure crystalline form of polymer, J/g
L Length of the Extruder Barrel, mm
L Total length of impact test specimen, mm
L0 Initial gauge length, mm
L0 Overall length of tensile test specimen, mm
ΔL Change in sample length, mm
n Degree of diffraction
n Notch length (v type, 45º), mm
Ni Number of domains analyzed in SEM analysis
t Thickness of tensile test specimen, mm
t Thickness of impact test specimen, mm
Tg Glass Transition Temperature, ºC
Tm Melting Temperature, ºC
Tc Crystallization Temperature, ºC
Xc Crystallinity, %
w Unnotched width of impact test specimen, mm
W Width of narrow section of tensile test specimen, mm

xxi
Greek Letters
σ Stress, MPa
ε Strain, mm/mm
θ Diffraction angle, º
λ Wavelength, nm
Abbreviations
CCC Carbon-Carbon Matrix Composites
CEC Cation Exchange Capacity
CMC Ceramic Matrix Composites
COOH Carboxyl
CRT Cathode Ray Tube
DSC Differential Scanning Calorimetry
EP300L MOPLEN EP300L, Polymer matrix of the study
FTIR Fourier Transform Infrared Spectroscopy
ISO International Organization for Standardization
MAH Maleic Anhydride
MAPP Maleic Anhydride Grafted Polypropylene
M Bondyram® 1001 (Maleic Anhydride Modified Polypropylene)
MB Melt mixing sequence in which organoclay and M are fed into
extruder 1st and added into EP300L in the 2nd extrusion
MMC Metal Matrix Composites
MMT Montmorillonite
N5 Nanofill ® 5
N8 Nanofill ® 8
OH Hydroxyl
OMLS Organically Modified Layered Silicate
PLSN Polymer Layered Silicate Nanocomposites
PMC Polymer Matrix Composites
PP Polypropylene
SAXS Small Angle X-ray Scattering

xxii
SEM Scanning Electron Microscopy
TEM Transmission Electron Microscopy
XRD X-Ray Diffraction
WAXS Wide Angle X-Ray Scattering

1
CHAPTER 1
INTRODUCTION
Composite materials enable more functional and esthetic structures that have
optimum performance which traditional materials do not have. They are preferred
and widely used for their design flexibility, outstanding thermal, mechanical,
electrical, etc. properties compared to their single phase counterparts [1].
Composites are the combinations of two or more materials which are physically and
chemically distinct, arranged or distributed phases with an interface in between that
separates them. Reinforcing material is embedded in a matrix material in a controlled
manner to obtain the composite. This new material, carrying the identity of each
constituent, exhibits unique properties that cannot be achieved by a single
component [2, 3].
In composite applications due to their low cost and weight, low heat and pressure
requirement and ease of processing advantages, polymer matrices are the most
preferred matrix type [3]. Despite these advantages, their low maximum service
temperature and high thermal expansion coefficient may lead to dimensional
instability and sensitivity to moisture and UV. Also, their mechanical and electrical
properties, such as mechanical strength, impact resistance and electrical
conductivity, are lower than metallic and ceramic matrices which make the
reinforcement utilization with inorganic, synthetic and/or natural compounds a must
[4]. Polymer matrices have low density when compared with heavy metallic and
ceramic composites whose ductility is rather low, and this is a great advantage for
usage [5, 6].
2
Nanometer scale dispersed fillers in polymer matrices form composites showing
improved properties (mechanical, thermal, physical and barrier properties) when
compared to conventional polymer composites. These are called polymer matrix
nanocomposites [7].
Polymer-clay nanocomposites, which are in the content of this study, are the
composites whose reinforcement material is in the form of lamellae and has a high
aspect ratio with one to a few nanometer thickness and hundreds to thousands of
nanometers in length. Montmorillonite, which is a layered silicate, is especially used
as filler in polymer-clay nanocomposites. Montmorillonite (MMT) is a crystalline; 2:1
layered clay mineral. A central alumina sheet is placed between two silica tetrahedral
sheets. Usually montmorillonite clays are modified by the substitution reaction of alkyl
ammonium ion with surface sodium ions, making the hydrophobic silicate surfaces
organophilic to enable insertion of organic materials to the clay layers. Functional
group providing alkyl ammonium cations can react with the polymer or initiate
polymerization of monomers [7, 8, 9]
Following the studies done by Toyota research group that revealed the significant
improvements in thermal and mechanical properties of Nylon-6/MMT
nanocomposites, the observations of Vaia et al. [10] on the possible melt
intercalation mechanism in the absence of solvent renewed the interest for layered
silicates [11, 12].
There are three methods to synthesize nanocomposites: In situ polymerization,
solution intercalation and melt intercalation. Melt intercalation method has more
advantages among all the three methods, such as compatibility with the current
industrial processes, ease of application proper for any type of polymer matrix
including polar ones, and solvent free operation type. The state of dispersion and
interactions between the filler and polymer matrix are the key parameters affecting
the final properties of the nanocomposites prepared by the melt intercalation method.
There are three types of polymer layered silicate nanocomposites that are
thermodynamically achievable depending on the strength of interfacial interactions
between layered silicates and the matrix; intercalated, intercalated-flocculated, and
exfoliated-delaminated. As surface area and interactions between the matrix and

3
silicate layers enhanced, the degree of dispersion increases by changing the
morphology from intercalated structure to exfoliated structure [11]. The degree of
dispersion is affected by the polarity of the polymer matrix, compatibilizer type and
the organic modifier of the nanoclay [13]. Polypropylene, which is a thermoplastic
linear hydrocarbon polymer, is a very appropriate material for room temperature
applications due to its convenient physical, mechanical and thermal properties [14].
The bottleneck of using polyolefins such as polypropylene with the direct melt
intercalation method is having a low level of dispersion of silicate layers due to its
nonpolarity. By using compatibilizer with functional groups, exfoliation is facilitated in
addition to the affect of modification of the clay surfaces [15].
The aim of this study was to improve the mechanical properties of polypropylene by
using montmorillonite type layered silicate, and compatibilizer having functional
groups. The matrix used was; EP300L (EP300L) which is a heterophase copolymer.
Nanofil® 5 and Nanofil® 8 were used as the organoclays and maleic anhydride
grafted polypropylene (MAPP) was used as the compatibilizer. Throughout the study,
the effects of organoclay types, and organoclay and compatibilizer content on the
final properties of the nanocomposites were investigated.
During the study, the processing sequence and processing parameter values of the
study by Cengiz F. [23] “Preparation and Characterization of Recycled Polypropylene
Based Nanocomposites”, which was the previously completed study of the SAN-TEZ
00112.STZ.2007-1 project, were used for production and characterization of the
polymer matrix. Processing parameters were set to a temperature of 180 ºC and
screw speed of 350 rpm, and masterbatch method (MB) was applied in order to
process nanocomposites with several organoclay contents and increase the
interactions between the compatibilizer M and organoclay.
All materials were dried before extrusion and injection molding processes at proper
temperatures and durations. Standard test specimens were prepared according to
the standard of ISO 527-2 5A for characterization, and specimens were conditioned
for specified durations prior to analysis.
Finally, tensile and impact tests were conducted to determine the mechanical
properties. Morphological characterization and organoclay dispersion were evaluated

4
by Scanning Electron Microscopy (SEM) and X-Ray Diffraction (XRD) analysis.
Melting and crystallization behavior of the composites were examined by Differential
Scanning Calorimetry (DSC) measurements.

5
CHAPTER 2
BACKGROUND
2.1 Composite Materials
Composites are the combinations of two or more materials, which are physically and
chemically distinct, arranged or distributed phases with a distinct interface in between
that separates them. This new material, carrying the identity of each constituent,
exhibits unique properties that cannot be achieved by a single component [2-3].
Although the composite material may be in homogeneous phase, each constituent of
the composite dominates its own distinct structural features remaining their identity in
the mixture [16].
Despite the fact that modern composites were started to be used in late 1903s, after
the invention of fiber glass reinforced resins, natural composites existed in nature
and used by man such as wood, bamboo and bone for hundreds of years. After fiber
glass reinforced resins; in 1970s carbon, boron and aramid fibers became popular
with new composite systems with metal and ceramic matrices [2]. In recent years, by
development of new and improved composite manufacturing processes, unlimited
product opportunities with low costs, lead composite materials to be used by many
industries like automotive, marine, army, aerospace etc. [3, 5].
Composite materials offer improved strength, stiffness, fatigue and impact resistance,
thermal conductivity, corrosion resistance, etc. [2]. These improved properties
increased the interest and demand in composite materials due to their design
flexibility that provides unlimited selection of characteristics for the invented material
[1].
Generally there are two different phases in the structure of composites; matrix and
the reinforcement. Matrix is the continuous component in the composite governing

6
the mechanical properties of the new designed material which can be metallic,
ceramic or polymeric. The other phase “reinforcement”, which is mostly stiffer and
harder with some exceptions such as phase reinforcement in a brittle polymer matrix,
improves the mechanical properties of the matrix [3, 5].
In determining the effectiveness of the reinforcement material, shape and dimension
of the reinforcing phase is one of the major parameters. Also, the mechanical
properties of composites are a function of the geometry of the reinforcement material
[3, 5]. Composites are classified in two ways; according to their matrix and their
geometry of reinforcement: flake, particulate and fibers [2]. Flake particles offer high
out-of-plane flexural modulus, higher strength, and low cost, since they consist of
matrices like mica and glass. Particulate composites’ reinforcement particles, which
are spherical, platelet, cubic or any regular or irregular geometry, are immersed in the
matrices and the load is carried mostly by the matrix phase [2, 3]. In fibrous
reinforcement type, the load is mostly carried by fiber phase which has a high aspect
ratio, i.e. high particle length to cross-sectional proportion [3]. The interaction of
matrix and reinforcement at phase boundaries, which is called as interface or
interphase, is one of the parameters affecting the behavior of a composite besides
the matrix and reinforcement properties. Throughout this thick interface, which is
often considered as a separate phase and bonds the two constituent, material
parameters such as density, concentration, elastic modulus etc. can vary. If load is
effectively transmitted from one component to another through the interface, the
performance of the composite will be improved. Effective load transmission is
possible with optimum interfacial interaction. Wettability, bonding and surface
roughness are the parameters affecting interfacial interaction [5].
2.1.1 Types of Composites
There are three types of composites according to their matrix types; metal matrix
composites (MMC), ceramic matrix composites (CMC), carbon-carbon matrix
composites (CCC), and polymer matrix composites (PMC).
In MMC, the matrix is a metal which is ductile, naturally strong and tough. Metal
matrix composites may be utilized at higher service temperatures than their matrix
material with the reinforcement. Reinforcement improves specific stiffness and
7
strength, abrasion resistance, creep resistance, dimensional stability and thermal
conductivity. Although MMCs have some advantages over other composites like high
operating temperatures and non-flammability, their high cost make their usage limited
[6].
Since ceramic materials are widely used at high temperature applications due to their
high strength and stiffness, CMCs are also applicable for high temperatures and
severe stresses. Fibers are incorporated with CMCs to improve failure strain [2].
When both the reinforcement and the matrix is carbon, these composites are called
carbon-carbon composites. In these types of composites, carbon fiber reinforcement
is embedded in a carbon matrix. They have high tensile modulus, high tensile
strength and low creep at very high temperatures up to 3315ºC, and they are 20
times stronger and 30% lighter than carbon structured graphite. However, their
susceptibility to oxidation and high cost are their major disadvantages [2].
2.1.2 Polymer Matrix Composites
Polymeric materials are the most commonly used matrix materials since they are
easily processed at low temperatures and pressures. However, their mechanical
properties need to be improved for industrial applications [3]. Matrix material can be
thermoplastic, thermoset or rubber according to their response to temperature. PMCs
are made by addition of inorganic/organic additives in certain geometries such as
fibers, flakes and particulates [4].
2.2 Nanocomposites
Composites, in which one of the component’s phases, at least in one dimension, is
less than 100 nm, are called nanocomposites [17]. At nanometer scale, the
properties of the materials differ from that of the bulk phase [2]. With these materials,
it is possible to achieve multifunctional behavior for any specific property of the
material which is more than the sum of the individual components [17]. Researches
in this area showed that with only a small amount of nanofiller addition outstanding

8
mechanical properties are achievable due to large surface area to volume ratio of
nanoadditives [18].
Depending on how many dimensions of the dispersed particles are in the nanometer
range, nanocomposites are divided into three classes. If all three dimensions are in
the nanometer size, isodimensional particle structure exists. Secondly, when two
dimensions of the particles are in nanometer level and the third one is larger,
elongated structures are formed. Lastly, if one dimension is in the nanometer scale
and nanofiller are present in the form of sheets of one to a few nanometer thick, and
hundreds to thousands nanometers long, they are called polymer-layered crystal
nanocomposites [19].
2.2.1 Polymer Layered Silicate Nanocomposites (PLSN)
Polymer layered silicate nanocomposites are hybrids between the polymer matrix
phase and the inorganic phase [20]. With the increase in interest in PLSNs regarding
the significant enhancements of thermal and mechanical properties and the
possibility of melt mixing polymer with layered silicates without using solvents, today,
almost all types of polymer matrices are being studied for the development of these
promising organic-inorganic mixtures [11].
2.2.1.1 Organically Modified Layered Silicates
Layered silicate is a member of the 2:1 phyllosilicates family. Their crystal lattice
structure is shown in Figure 2.1. Layer thickness of the structure is approximately 1
nm and lateral dimensions may range from Å level to several microns. The layers
are organized in parallel to form stacks with their interspace distances which are
named as interlayer or gallery. Interlayers are the regular Van der Waals gaps
between the layers. Isomorphic substitution within the layers generates negative
charges which are counterbalanced by alkaline earth cations occupied in the
interlayer, like Al3+ replaced by Mg2+ or by Fe2+, or Mg2+ replaced by Li+ [19]. Thus,
they have cation exchange capacity (CEC) to characterize the surface charge which
is generally expressed as meq/100g, and their layer morphology is considered as
hydrophobic colloids of the constant-charge type.

9
Figure 2.1 Structure of 2:1 layered silicates [21].
In order to overcome the incompatibility of the layered silicates with most organic
structured polymers with hydrophilic structure, layered silicates are organically
modified. This modification makes intercalation mechanism for many polymers
possible. Modification is done by replacement of the cations, which are present in the
galleries, with organic cations. The most used ions for modification of the surface of
the layers are alkyl ammonium ions. By the effect of these salts, the negative charge
is located on the surface of the silicate and the cationic head of the alkyl ammonium
is attached to the wall of the interlayer. Its aliphatic tail renders the hydrophilic silicate
surface organophilic. These cations also increase the distance between the layers
and reduce the surface energy of the filler. In addition, they provide functional groups
which can react with the polymer to improve the strength of the interface between the
inorganic component and the polymer. Figure 2.2 represents the ideal structure of
the organically modified layered silicates, i.e. organoclays.
~1

10
Figure 2.2 Idealized structures of organically modified silicates [21].
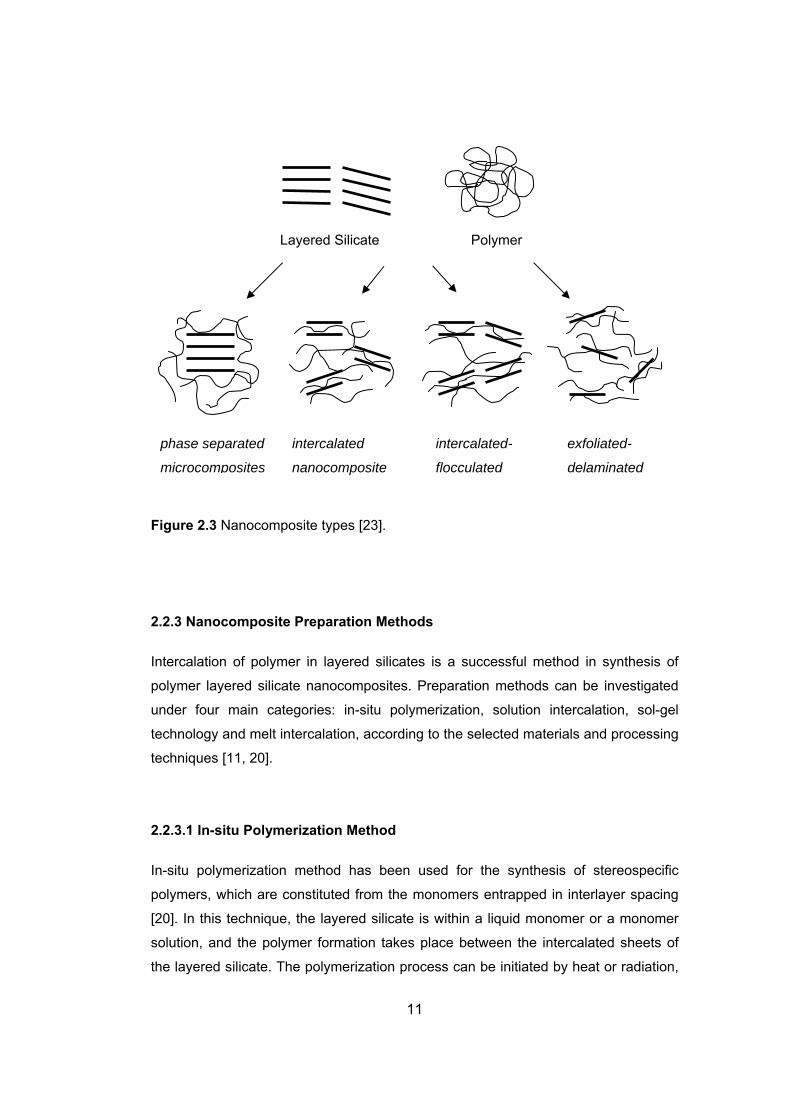
2.2.2 Nanocomposite Types
Depending of the nature of the components used, achievable types of the
nanocomposites are divided into four; microcomposites (in which polymer and
organoclays are phase separated, i.e. remain immiscible, by the absence of
intercalation), intercalated nanocomposites, intercalated-flocculated nanocomposites
and exfoliated-delaminated nanocomposites. Figure 2.3 shows the types of
nanocomposites. Better dispersion of the layered silicates, which have remarkably
high aspect ratio (e.g. 10-1000) throughout the polymer matrix, would increase the
surface area for polymer filler interaction which promotes enhancements in material
properties [11].
Polymer chains are inserted into the gallery space between parallel individual clay
layers in a well order in intercalated structures [22]. The difference between the
intercalated and the flocculated nanocomposites is the flocculation of the silicate
layers due to hydroxylated edge–edge interactions. On the other hand a complete
and uniform dispersion of the silicates in the polymer matrix, forms exfoliated or
delaminated structures maximizing the polymer-clay interactions and making the
entire surface of layers available for polymer. Then, this structure provides the most
significant improvements in mechanical and physical properties [3].
11
Figure 2.3 Nanocomposite types [23].
2.2.3 Nanocomposite Preparation Methods
Intercalation of polymer in layered silicates is a successful method in synthesis of
polymer layered silicate nanocomposites. Preparation methods can be investigated
under four main categories: in-situ polymerization, solution intercalation, sol-gel
technology and melt intercalation, according to the selected materials and processing
techniques [11, 20].
2.2.3.1 In-situ Polymerization Method
In-situ polymerization method has been used for the synthesis of stereospecific
polymers, which are constituted from the monomers entrapped in interlayer spacing
[20]. In this technique, the layered silicate is within a liquid monomer or a monomer
solution, and the polymer formation takes place between the intercalated sheets of
the layered silicate. The polymerization process can be initiated by heat or radiation,
Layered Silicate Polymer
phase separated
microcomposites
intercalated
nanocomposite
intercalated-
flocculated
exfoliated-
delaminated

12
by diffusion of a suitable initiator or by an organic initiator or catalyst residing inside
the interlayer [19].
Figure 2.4 In-situ polymerization method [24].
2.2.3.2 Solution Intercalation
Since the forces stacking the layers together are weak, layered silicates are
dispersed into single layers in a proper solvent such as water, chloroform or toluene.
The solvated polymer and swelled layered silicates are then mixed. The solvated
polymer chains diffuse within the silicate layers. After the solvent is removed by
evaporation or precipitation of the mixture, the polymer is adsorbed onto the
delaminated sheets. The sheets are reassembled by sandwiching the polymer to
form an ordered multilayer structure [11, 19]. The intercalation process is
represented in Figure 2.5. The advantage of this method is to synthesize intercalated
nanocomposites with low or no polarity. But the use of large quantities of solvent
makes the process difficult in industrial applications [25].

13
Figure 2.5 Solution intercalation method [24].
2.2.3.3 Sol-Gel Technology
Hydrothermal treatment of a gel is implemented in Sol-Gel technology. The gel
containing organics and organometallics including polymer is crystallized by heat. For
the crystallization of the clay, silica sol, magnesium hydroxide sol and lithium fluoride
are used. High dispersion of the silicate layers is achieved by this method and this
method does not require onium ions [20].
2.2.3.4 Melt Intercalation
In this method, polymer chains diffuse into the space between the clay and the
galleries above the softening point. The dispersion of the clay particles starts when
the hydrodynamic separating forces applied by the matrix fluid exceed the cohesive
forces. The degree of dispersion depends on the matrix viscosity, average shear rate
and the residence time in the mixing process [26]. To increase the interlayer spacing,
using organically modified clays is a usual application. Another reason for this
application is to extenuate the incompatibility between the polymer and the layered
silicate because of the polarity [20].

14
Figure 2.6 Melt intercalation method [24].
Selection of the organically modified layered silicate (OMLS) is one of the most
important parts of the process, since by addition of the organoclay the layer
separation is increased and the interaction at the interlayer surface should be
optimized. The structure of the polar groups of a polymer may help or lead to
intercalation but in the presence of a polar polymer the functional group in the OMLS
may cause undesired interactions [11].
Since there is no need for a solvent, melt intercalation technique is economically and
environmentally favorable over solution polymerization and in-situ polymerization.
Another advantage of this technique is the compatibility with the industrial processes.
The polymers which are not suitable for solution intercalation or in-situ polymerization
can be processed by melt intercalation [11].
2.3 Polymer Matrix of the Study
2.3.1 Polypropylene
Polypropylene (PP) is a thermoplastic polymer of propylene monomer, which was
first produced by G. Natta and his coworkers in 1954 after the development of K.
Ziegler catalyst [14, 27].
15
Polypropylene is used in a wide variety of applications including packaging, textiles,
plastic parts, laboratory equipments, automotive components, etc. Since propylene
monomer is a petroleum byproduct, the ease of availability and low cost makes it
favorable. Moreover, the ability to process by different techniques due to its physical
properties increases the demand, i.e. in 2007; the global market for polypropylene
had a volume of 45.1 million tons [14, 28]. Low density, high melting point, resistance
to many chemical solvents, acids and basis and the bending resistance are the main
characteristics of polypropylene [29].
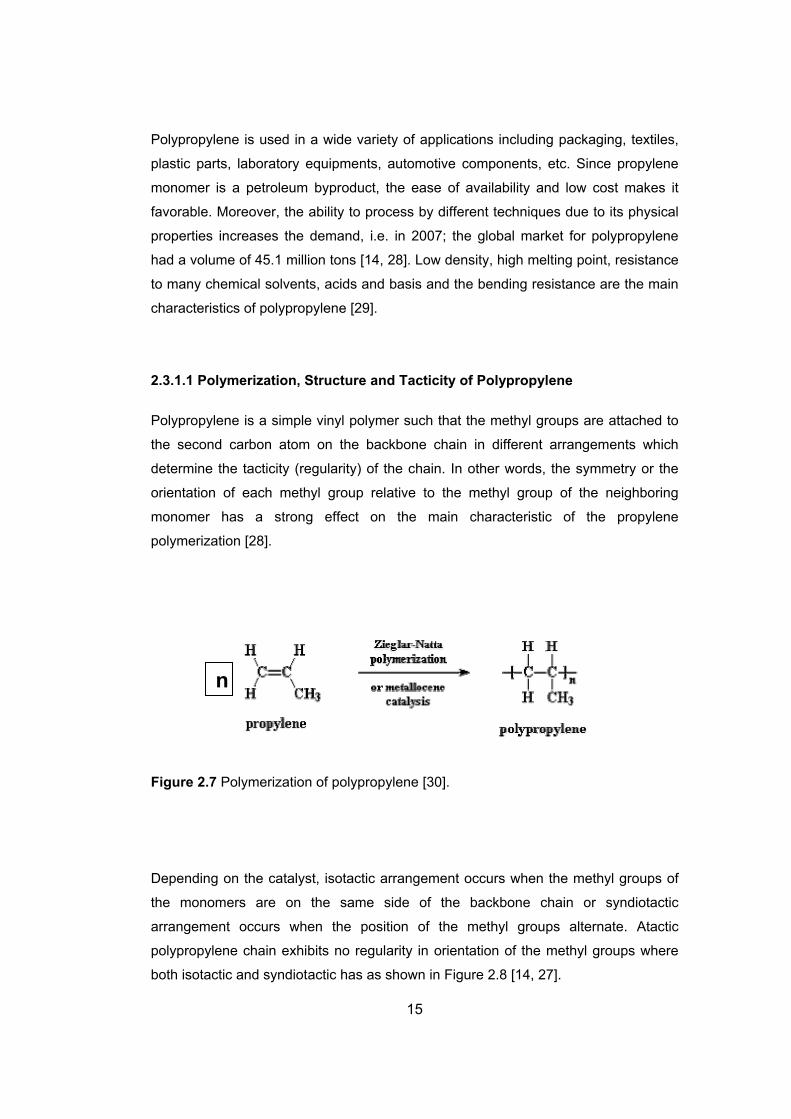
2.3.1.1 Polymerization, Structure and Tacticity of Polypropylene
Polypropylene is a simple vinyl polymer such that the methyl groups are attached to
the second carbon atom on the backbone chain in different arrangements which
determine the tacticity (regularity) of the chain. In other words, the symmetry or the
orientation of each methyl group relative to the methyl group of the neighboring
monomer has a strong effect on the main characteristic of the propylene
polymerization [28].
Figure 2.7 Polymerization of polypropylene [30].
Depending on the catalyst, isotactic arrangement occurs when the methyl groups of
the monomers are on the same side of the backbone chain or syndiotactic
arrangement occurs when the position of the methyl groups alternate. Atactic
polypropylene chain exhibits no regularity in orientation of the methyl groups where
both isotactic and syndiotactic has as shown in Figure 2.8 [14, 27].
n

16
Figure 2.8 Stereochemical configurations of polypropylene [27]
As mentioned before, the structure of the chain determines the tacticity and the
properties of the polymer. Isotactic PP has an intermediate level of crystallinity due to
the helical chain, high melting point and low density because of the space created by
the methyl groups. Syndiotactic PP is less crystalline than isotactic PP and has a
lower melting point. Atactic PP is a viscous liquid and has a little use which is
generally with other polymers. So, high tacticity or high isotactic content PP is
favorable and is used commercially due to the advantages of processing, especially
by injection molding and extrusion, low cost, low density, and resistance to
temperature, fatigue, chemicals and cracking [14].
2.4 Polypropylene Nanocomposites
Besides the many advantages and attractive properties of PP as mentioned above,
PP has some disadvantages such as; low service temperature and low toughness. In
order to improve the mechanical properties conventional fillers such as talc, mica and
silicate nanolayers are used. The loading rate and dispersion of the filler is very
critical for the process conditions and the resultant product [31, 32].

17
The required loading for talc and mica is relatively high in order to improve stiffness,
and it results in an increase in weight and rough surface. Silicate nanolayers are
used to enhance stiffness and scratch resistance at much lower loading since they
have high aspect ratio [33]. The nanoscale structure maximizes the interactions
between the fillers and the PP molecules if they are well dispersed. However, the
dispersion of the silicate layers is very difficult at nanometer level since PP has no
polar group in its chain and is one of the most hydrophobic polymers, whereas,
nanofillers have polar hydroxyl groups in their structure and are naturally hydrophilic
[34, 35]. In order to solve this problem clay surface is modified with organic cations
as previously mentioned and clays become chemically compatible with the polymer
matrix.
The miscibility and linkage between the polypropylene and the layered silicates can
also be improved by using compatibilizers having functional groups such as maleic
anhydride (MAH) or acrylic acid grafted onto a polymer matrix [36, 37]. Since the
dispersion and the resultant PP properties depend on the compatibilizer content,
choosing the compatibilizer is very critical. The polarity of the compatibilizer should
be high enough to have a stronger interaction between the compatibilizer and the
clay surface than the interaction between the clay surface and the surfactant in order
to obtain delamination of the silicates. The compatibilizer must also be miscible with
PP. The content of the functional groups should be optimized due to the effect of the
functional groups on the miscibility with the polypropylene [38]. In polypropylene
preparation, one of the most used compatibilizers is maleic anhydride grafted
polypropylene (MAPP) which is also used in this study. Presence of the functional
group, which is MAH in this case, is capable of forming hydrogen bonding with the
clay while providing compatibility with the matrix through its polypropylene backbone.
There are some studies done in order to investigate the effect of MAPP to organoclay
ratio on the morphology and the performance of the PP based nanocomposites [15,
39] and to observe degree of functionality and effect of maleic anhydride content of
MAPP on the nanocomposite structure [40, 41].
In this study, a heterophasic polypropylene copolymer is used in production of the
nanocomposites. With introduction of the organoclay into the blend, well dispersed
silicate layers create a barrier effect and avoid agglomeration of the immiscible

18
domains and the mechanical properties and toughness are positively affected [33,
42]. Addition of the compatibilizer can stabilize the blend morphology by reducing the
interfacial tension, hindering and coarsening by forming a protecting layer as in the
case of organoclays [43, 44].
2.4.1 Maleic Anhydride (MAH) Functionality
Maleic anhydride is used to increase the adhesion onto polar substrates. Reaction
occurs between the hydroxyl groups generated from the hydrolysis of the maleic
anhydride and the oxygen group of the layered silicates [45, 46]. The polar character
of the MAH group causes an affinity for the organoclay surface and the functionality
imparts compatibility between the reinforcing phase and the polymer matrix [15].
Figure 2.9 Structure of maleic anhydride grafted polypropylene and its reaction with
hydroxyl groups [47].
The main driving force for intercalation is originated from the strong hydrogen
bonding between the maleic anhydride group, more specifically the carboxyl (COOH)
or hydroxyl (OH) groups generated from the hydrolysis of the maleic anhydride
group, and the oxygen group of the silicates as represented in Figure 2.9.

19
The intercalation of the silicate layers into the PP matrix is obtained by this
mechanism as represented in Figure 2.10. The strong hydrogen bonding between
the maleic anhydride group and the oxygen group of the silicates is the driving force
of intercalation mechanism [45, 46]. The polarity of the MAPP also allows the
polypropylene macromolecules enter the galleries.
Figure 2.10 Schematic representation of the intercalation process of MAPP [48].
2.5 Polymer Processing
Polymer processing is simply, getting the shaped valuable product from polymeric
materials as well as stabilizing the polymer morphology. There are a number of
industrial applications such as extrusion and injection molding.
2.5.1 Extrusion
An extruder is used for extrusion to pump the molten material, by means of pressure
created by the rotation of the screw, through the die which is the discharge of the
extruder. The pressure required for the operation depends on the type of the
material, flow rate and the die section. Generally, the polymer is fed to the hopper as
granules or powder and conveyed along the screw. The product is a solid polymer

20
which is tempered in the extruder. Extrusion process is used to produce significant
quantities of products continuously. A representative drawing of an extruder is shown
in Figure 2.11 [49].
Figure 2.11 A simple extruder scheme and representation of the sections [50].
2.5.1.1 Screw Design
The screw in an extruder is designed in three sections as feed, compression and
metering, see Figure 2.12. The function of the feed section is to preheat the solid
polymer and convey it to the next section as melt. The energy needed to melt the
resin is supplied from the walls of the barrels and the friction of the rotating screw. In
the compression section, which has a variable depth, the molten polymer is
squeezed to have homogeneity and better heat transfer with reduced thickness. The
depth is decreased in this section with increasing root diameter since the screw flight
is constant along the screw. In metering zone, the depth is constant, but less than as
it is in the feed zone, in order to have a constant temperature and pressure to the die

21
section. The stability and the quality mostly depend on the design of the screw, thus
a screw designed for a specific process is used preferably for that purpose only [50].
Figure 2.12 The sections of an extruder screw [28].
2.5.1.2 Extruder Types
Most of the extruders designed and used are single screw type which is the one
described above. There are also twin-screw extruders, which perform the same
process as single screws do, have some additional advantages and properties due to
effects of the mechanism of two screws, co-rotating or counter-rotating depending on
the design, see Figure 2.13 [51].

22
Figure 2.13 Different types of screw configurations for twin-screw extruders [52]
As seen from the figure, the non-intermeshing screws have space between the flights
of the screws used generally for the reactive extruders. The intermeshing screws are
conjugated to transfer the polymer from one to the other to improve mixing effect
during conveyance [50]. Figure 2.14 shows the screw configurations for twin screw
extruders.
Figure 2.14 Screw configurations for twin screw extruders [53].

23
Co-rotating twin-screw extruders are generally preferred to produce nanocomposites.
The extrusion process parameters such as, feed rate, screw speed, temperature and
pressure of the die are monitored and controlled with the control panel on the
cabinet. Figure 2.15 the co-rotating twin-screw extruder used in nanocomposite
production during this study.
Figure 2.15 Co-rotating twin-screw extruder used in nanocomposite production in
this study [47].
2.5.2 Injection Molding
Injection molding is a common process for especially thermoplastics which is simply
described in four stages; melting, injecting into the mold, cooling the mold and
removing the part from the mold. Injection molding is a batch process, whereas
extrusion is continuous. Cycle time, temperature and pressure, which are the main
process parameters, are controlled with very complex control systems. The injection
molding machines and the molds are very expensive due to the control system and
the pressure needed for injection [54].
Melting and the injection are carried by a screw through a nozzle like extrusion,
cooling and the final shape is obtained in the mold. Decreasing the cycle time is

24
preferred due to economical reasons. The temperature of the melt, and the
temperature and the shape of the mold determine the cycle time. The temperature of
the melt is directly related to the polymer properties. In order to decrease the cycle
time mold temperature is kept as low as possible, however, crystallization on the
surface may occur which is generally not desired. Injection is done as fast as
possible to decrease the cycle time and not to have pre-crystallization in the mold,
especially if the parts are complicated [55].
2.6 Characterization of Nanocomposites
In order to evaluate the properties of nanocomposites, different test methods are
carried out, such as; tensile and impact tests for mechanical properties, differential
scanning calorimetry (DSC) for thermal properties, X-ray diffraction (XRD) analysis
and scanning electron microscopy (SEM) for morphological properties.
2.6.1 Mechanical Properties
The structure of the polymer, determined by the bonds in the chain and the
interactions between the chains, determines the mechanical behavior of a polymer
under applied forces such as tension, shear, torsion, compression and bending. The
results of these tests are very important for the applications of a polymer [28].
2.6.1.1 Tensile Test
Tensile test is done to predict how the material will react under forces in opposite
direction until it fails. During the test the elongation of the sample is recorded against
the force applied. The shape of the sample is like a dog bone to ensure that the
rupture takes place in the middle and it is called the gage section. The grips used for
holding the sample are shown in Figure 2.16 [56].

25
Figure 2.16 Tensile test machine and dog bone shaped specimen [57].
The specimen is clamped by holders and pulled by the movable head with increasing
tensile load while the strain or elongation rate is constant during the test. According
to the mechanical properties of the material, the test results may vary with the
ambient temperature, thus it is better to do quality control tests at the temperature of
use [28].
The strength of the material and the modulus of elasticity are determined from the
stress-strain curve plotted during the test. Engineering stress and strain are
calculated with the equations, respectively;
σ = F/ A0 [2.1]
ε = ΔL / L0 [2.2]
where, σ is the engineering stress (MPa), F is the load at any time as a function of
elongation (N), A0 is the original cross sectional area of the gage section (mm2), ε is
the engineering strain, ΔL is the change in length (mm) and L0 is the initial gage
length (mm) [56].

26
Figure 2.17 Idealized stress-strain curve for a polymer that undergoes ductile failure
[58].
The ratio of stress to strain where the load is proportional to the strain is the modulus
of elasticity (E) or Young’s Modulus which is the deformation resistance of the
material expressed in MPa. The area under the curve represents the toughness and
is the work for deformation in units of energy per unit volume. The deformation is
called elastic, if it is recoverable after removing the load, thus the elastic region of the
curve extends up to a specific load. With a high modulus (σ / ε), the material is hard
since the elastic region of the curve is very narrow due to the slope of the curve [57].
Typical behaviors of polymers under load are shown in Figure 2.18.

27
Figure 2.18 Stress–strain curves at various temperatures (increasing from a to e): (a)
low extensibility followed by brittle fracture; (b) localized yielding followed by fracture;
(c) necking and cold drawing; (d) homogeneous deformation with indistinct yield; (e)
rubber-like behavior [28].
2.6.1.2 Impact Test
Impact test is another method of evaluating the toughness. The energy required to
fracture the sample is the impact resistance of a material. The test is performed with
the machines designed to apply high loads, in two types; Izod or Charpy, according
to the geometry of the support as shown in Figure 2.19 [28].

28
Figure 2.19 Charpy and Izod impact tests [28].
The specimen is often notched for both tests to promote fracture and have a
standard weak point to break. The main difference of the tests is the support point of
the specimen. Results are generally reported in J/m2 or kJ/m2.
2.6.2 Thermal Analysis
In order to determine the thermal properties of nanocomposites, thermal analysis
such as differential scanning calorimetry (DSC), differential thermal analysis (DTA),
thermogravimetry (TG), thermomechanical analysis (TMA), dynamic mechanical
analysis (DMA) methods are applied. In this study, DSC analysis was applied to
determine crystallinity and the melting temperature of the polymer.
2.6.2.1 Differential Scanning Calorimetry (DSC)
Differential Scanning Calorimetry, DSC, analysis is to measure the required heat to
increase the temperature of a small amount of sample and a reference which are
kept at the same temperature, at the same time as shown in Figure 2.20 [59]. At the
point of phase transformation such as thermal transition the sample and the
reference is kept at the same and constant temperature by giving more heat or giving

29
less heat by the power supply. More or less heat during thermal transition is directed
by the process if it is endothermic or exothermic. The temperature and the power are
recorded and plotted throughout the experiment to have a DSC curve [60].
Figure 2.20 Power compensated differential scanning calorimeter [28].
With the DSC curve as shown in Figure 2.21 (Tg), melting temperature (Tm),
crystallization temperature (Tc) and heat of fusion of polymers which is the area
under the curve (ΔHf) are determined. If the heat of fusion of 100 % crystalline
polymer is known, then the % crystallinity of the sample is obtained by using the
measured heat of fusion [59].

30
Figure 2.21 Typical DSC curves [59].
Since the molecular motions increase during transition the heat capacity of the
material also increases. So, Tg is detected from shift on the endothermic side of the
curve, as well as Tm which is the sudden phase change, is detected by a peak on the
curve [61].
2.6.3 Morphological Analysis
2.6.3.1 X-Ray Diffraction (XRD) Analysis
X-Ray Diffraction, XRD, analysis is applied to the crystalline substances since 1912
to obtain information about the crystallographic structure, physical properties, and
chemical composition of the materials. There are two types of X-ray scattering; wide
angle X-Ray scattering (diffraction) (WAXS) and small angle X-ray scattering (SAXS).
The crystallinity is analyzed by WAXS and structural analysis is done by SAXS [57].
X-Rays having very short wavelengths are diffracted by the crystalline phases. The
wavelength of the x-rays for the polymer studies are typically 0.1 – 0.2 nm. The
waves are scattered from the structure at an angle depending on the structure and

31
the length within the structure. If the structures are regular or periodic so are the
angles, then the scattering is called diffraction [62].
The regular reflection of x-rays from parallel planes according to Bragg’s law is
recorded by the diffractometer. The manipulated intensity of the diffracted beams
versus angular position in terms of 2θ is plotted [63]. The spacing between the planes
is calculated with Bragg’s equation;
nλ=2d sinθ [2.3]
where, λ is the wavelength of the radiation, d is the distance between the parallel
planes in the crystal, θ is the angle between the x-ray beam and the plane, and n is
the order of diffraction [64].
Figure 2.22 Diffraction of X-Rays [6].
With peaks in the XRD plots, d-spacing can be determined. Increase in d-spacing will
lead to shift to lower angles of the clay peak which represents intercalated structure,
whereas no peak will be observed in exfoliated systems.

32
2.6.3.2 Scanning Electron Microscopy (SEM)
Scanning electron microscopy, SEM, is a qualitative analysis for the surface and
surface morphology in 3D images with magnification up to 50000 times. The
synchronized scanning of electron beams on the sample, which is generally coated
with a thin layer of gold or silver to have conductivity, and the cathode ray tube (CRT)
gives the three dimensional images on screen as shown in Figure 2.23. The
magnification is adjusted first and the image is adjusted with the CRT according to
detected scattered electrons [65].
Figure 2.23 Schematic diagram representing the main components of a scanning
electron microscope [65].
2.7 Previous Studies
Deshmane et al. [66] studied the effects of same clay loadings on the properties of
the nanocomposites with polypropylene and polyethylene. 4 % clay loading improved
the impact strength of polypropylene based nanocomposites, whereas the behavior
polyethylene based nanocomposites was the opposite. Tensile properties of both

33
were improved but the improvement for polypropylene was higher. The different
results for PP and PE caused by the different interactions of the polymers with clay,
resulting in different structural characteristics, such as crystallization and glass
transition temperature, increased intergallery spacing and decreased spherulite size.
Zhang et al. [67] used a twin screw extruder to prepare PP-MMT nanocomposites
with MAPP compatibilizer. XRD and TEM analysis were performed during the study.
At low clay content, high dispersion of the silicate layers and highly improved impact
properties were observed, while tensile properties were the same compared to
conventionally filled PP nanocomposites.
Thon-That et al. [68] prepared three different types of organoclay nanocomposites in
a twin screw extruder. Two grades of MAPP and two different methods of processes
were investigated. The presence of coupling agent improved the degree of
intercalation. Organoclay, having high thermal stability, and MAPP coupling agent
with high molecular weight, enhanced tensile and impact properties. Mixing
procedures did not alter the results significantly.
Kim et al. [15] investigated the structures and properties of melt blended
nanocomposites composed of thermoplastic polyolefin, organoclay and MAPP with
respect to MAPP to organoclay ratio. As MAPP to organoclay ratio was increased
tensile properties were enhanced. Increasing clay stacks, at fixed ratio of MAPP,
resulted in improvement of percolation networks caused by physical interaction of
clay particles.
Lertwimolnum et al. [69] prepared nanocomposites in a twin screw extruder with
MAPP compatibilizer to investigate the effects of the compatibilizer and processing
conditions on nanoclay dispersion. With MAPP degree of dispersion was improved
and clay aggregates were smaller for increased loading of MAPP. It was observed
that increasing shear stress and mixing time, and decreasing mixing temperature
enhanced exfoliation and increases the yield stress.
Modesti et al. [35] reported the mechanical properties of polypropylene based
nanocomposites with MAPP compatibilizer and organoclay in which the process
conditions were changed. The process conditions at low temperature and high screw
34
speed enhanced tensile properties. Excluding the effect of the process conditions,
addition of compatibilizer and organoclay already improved tensile properties, and
exfoliation of clay platelets was only achieved only when MAPP compatibilizer was
present.
In the following study of Modesti et al. [70], thermal properties of melt blended
nanocomposites were reported. The process condition had significant effect only on
the mechanical properties. Thermal stability, crystallinity and flammability behavior
were affected mainly by the composition of the nanocomposites, and improvement
was observed with MMT and MAPP.
Deenadayalan et al. [107] studied the effect of the compatibilizers such as, MAPP
and maleic anhydride grafted polyethylene (MAPE), on the mechanical properties of
PP nanocomposites. MAPP improved the modulus and strength due to the well
dispersion of clay particles but decreased the ductility, whereas the use of MAPE
resulted in opposite results.
Zhu et al. [71] investigated the effects of mixing procedures and screw configurations
and reported the effects on dispersion. Pre-mixing of clay and MAPP was compared
with the concurrent processing of the components. Since residence time was
increased, pre-mixing has shown better exfoliation of nanocomposites.
In the previous study in this SAN-TEZ 00112.STZ.2007-1 project which is completed
by Filiz Cengiz [23], in order to improve the mechanical properties of a recycled
grade of polypropylene, the effects of additive concentrations, types of organoclays
and compatibilizers, processing conditions, and the compatibilizer to organoclay
ratio, on the morphology and mechanical, thermal and flow properties were
investigated. Cloisite® 15A, Cloisite® 25A and Cloisite® 30B were used as
organoclays, and ethylene-methyl acrylate-glycidyl methacrylate and maleic
anhydride grafted polypropylene were used as compatibilizers in the production of
the nanocomposites by melt compounding method. Mechanical properties were
improved significantly at low temperatures and high screw speeds. More effective
dispersion of organoclay and improved tensile properties were obtained as the MAPP
to clay ratio was increased.

35
CHAPTER 3
EXPERIMENTAL
3.1 Materials
3.1.1 Polymer Matrix
The polymer matrix used in the study was a heterophasic copolymer “MOPLEN
EP300L” and it was purchased from LyondellBasell Company, Holland at 25 kg
polyethylene bags. For simplicity MOPLEN EP300L is abbreviated as EP300L in the
thesis and the material properties are shown in Table 3.1.

36
Table 3.1 Properties of MOPLEN EP300L (EP300L) Polymer matrix
Characteristics Unit Value Test Method
Physical Properties
Density g/cm3 0.905 ISO 1183
Melt Flow Index (230oC; 2,16 kg) g/10 min 6 ISO 1133
Mechanical Properties
Young’s Modulus (at 23ºC) MPa 1434 ISO 527 (15 mm/min)
Notched Charpy Impact Strength
(at 23ºC) kJ/m2 11.9 ISO179
Ball Indentation Hardness MPa 53 ISO 2039-1
Thermal Properties
Distortion temperature under load
(load=0.45 MPa) ºC 77 ISO 75B-1,-2
Vicat softening temperature(50 N) ºC 151 IS0 306
3.1.2 Organoclays
In this study, two types of layered silicates were used; Nanofil® 8 and Nanofil® 5.
They were purchased from Southern Clay Products, Texas, USA and used as
reinforcing agents. They are natural off-white montmorillonites produced by a cation
exchange reaction with different organic modifiers. The tallow (long alkyl chain)
structures in both type of the clays are constituted of primarily 18 carbon chains (~65
%) and the rest of the components are chains with 16 carbons (~30 %) and 14
carbons (~5 %).
3.1.2.1 Nanofill ® 8
Nanofill ® 8 (N8) is an organically modified, nanodispersible layered silicate based on
a natural bentonite, and the surface treatment of the clay is a dimethyl,
di(hydrogenated tallow)alkyl quaternary ammonium salt. According to information
supplied by the production company, the clay has high hydrophobicity. The chemical

37
structure of the modifier is shown in Figure 3.1 and the properties are shown in Table
3.2.
Figure 3.1 Chemical structure of Nanofill ® 8.
Table 3.2 Properties of Nanofill ® 8 [72].
Properties Unit Value
Modifier Content meq/100g clay 125
Interlayer spacing nm 3.5
Moisture Content % 1.6
Weight Loss on Ignition % 43
Bulk Density g/l 270
Typical Dry Particle Sizes
50% μ, by volume 5
3.1.2.2 Nanofill ® 5
Nanofill ® 5(N5) is an organically modified, nanodispersible layered silicate based on
a natural bentonite, and the surface treatment of the clay is a dimethyl,
di(hydrogenated tallow) alkyl quaternary ammonium salt. According to information

38
supplied by the production company, this clay has a lower hydrophobicity than
Nanofill ® 8. The chemical structure of the modifier is shown in Figure 3.2 and the
properties are shown in Table 3.3. The main differences between the two
organoclays are the modifier content and d-spacing. Nanofill ® 8 has a higher
modifier content and d-spacing then Nanofill ® 5.
Figure 3.2 Chemical structure of Nanofill ® 5.
Table 3.3 Properties of Nanofill ® 5 [72].
Properties Unit Value
Modifier Content meq/100g clay 93
Interlayer spacing nm 2.8
Moisture Content % 1.3
Weight Loss on Ignition % 38
Bulk Density g/l 270
Typical Dry Particle Sizes
50% μ, by volume 8
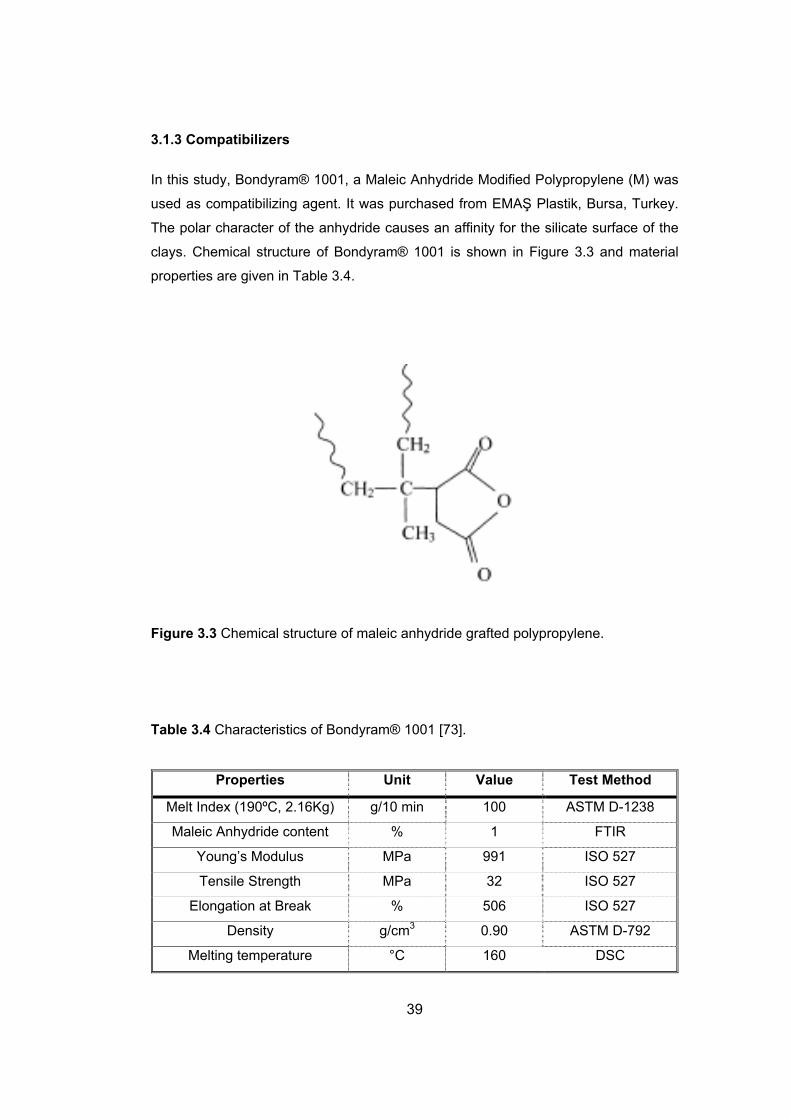
39
3.1.3 Compatibilizers
In this study, Bondyram® 1001, a Maleic Anhydride Modified Polypropylene (M) was
used as compatibilizing agent. It was purchased from EMAŞ Plastik, Bursa, Turkey.
The polar character of the anhydride causes an affinity for the silicate surface of the
clays. Chemical structure of Bondyram® 1001 is shown in Figure 3.3 and material
properties are given in Table 3.4.
Figure 3.3 Chemical structure of maleic anhydride grafted polypropylene.
Table 3.4 Characteristics of Bondyram® 1001 [73].
Properties Unit Value Test Method
Melt Index (190ºC, 2.16Kg) g/10 min 100 ASTM D-1238
Maleic Anhydride content % 1 FTIR
Young’s Modulus MPa 991 ISO 527
Tensile Strength MPa 32 ISO 527
Elongation at Break % 506 ISO 527
Density g/cm3 0.90 ASTM D-792
Melting temperature °C 160 DSC
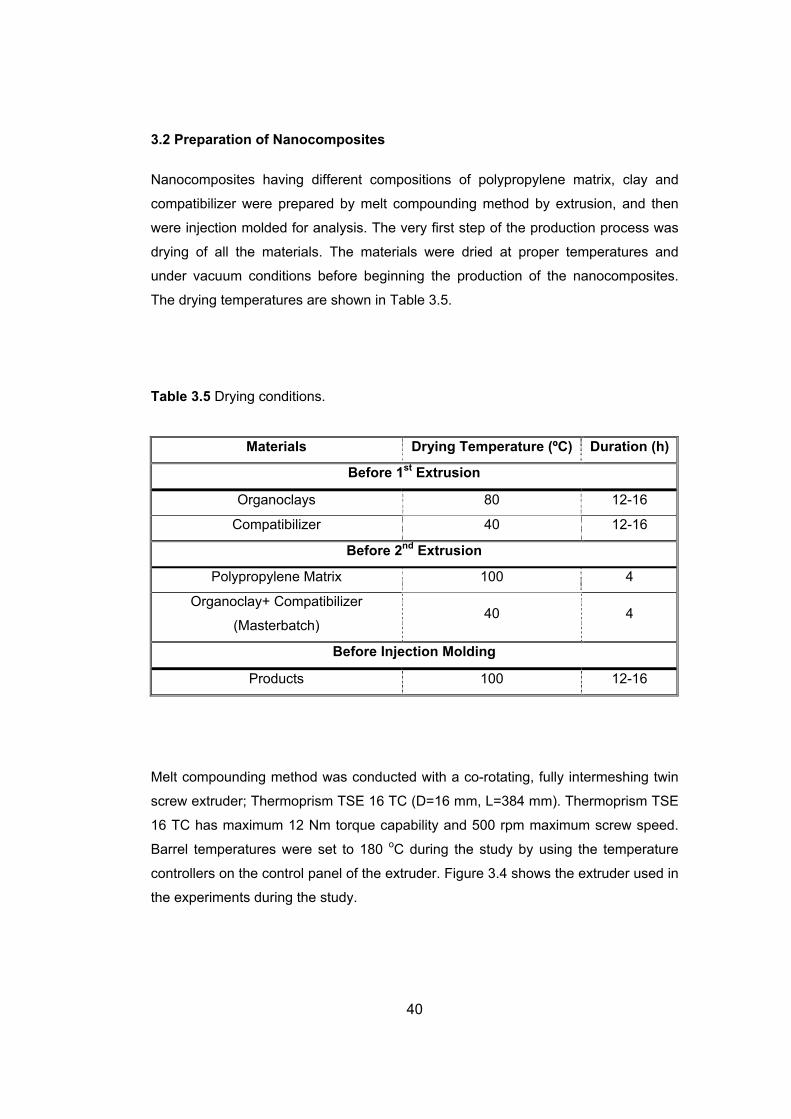
40
3.2 Preparation of Nanocomposites
Nanocomposites having different compositions of polypropylene matrix, clay and
compatibilizer were prepared by melt compounding method by extrusion, and then
were injection molded for analysis. The very first step of the production process was
drying of all the materials. The materials were dried at proper temperatures and
under vacuum conditions before beginning the production of the nanocomposites.
The drying temperatures are shown in Table 3.5.
Table 3.5 Drying conditions.
Materials Drying Temperature (ºC) Duration (h)
Before 1st Extrusion
Organoclays 80 12-16
Compatibilizer 40 12-16
Before 2nd Extrusion
Polypropylene Matrix 100 4
Organoclay+ Compatibilizer
(Masterbatch) 40 4
Before Injection Molding
Products 100 12-16
Melt compounding method was conducted with a co-rotating, fully intermeshing twin
screw extruder; Thermoprism TSE 16 TC (D=16 mm, L=384 mm). Thermoprism TSE
16 TC has maximum 12 Nm torque capability and 500 rpm maximum screw speed.
Barrel temperatures were set to 180 oC during the study by using the temperature
controllers on the control panel of the extruder. Figure 3.4 shows the extruder used in
the experiments during the study.

41
Figure 3.4 Thermoprism TSE 16 TC twin-screw extruder.
During extrusion, polymer matrix and compatibilizer were fed from the main feeder;
and clays were fed from the side feeder. Total feeding rate of the materials was set to
25 g/min and kept constant during the study. Materials were melt and mixed at 180 oC and 350 rpm screw speed in the extruder. The processing parameters are shown
in Figure 3.5. The molten product was cooled by passing through a water bath, and
the wet product was dried by an air knife after the water bath, and then the product
was pelletized.

42
Figure 3.5 Schematic diagram of processing parameters; barrel temperature and
screw speed.
In the previous study of Cengiz F. [23]; experiments were done under several
processing conditions. When the screw speed was increased to 350 rpm and the
barrel temperature was 180 ºC, i.e. with low temperature and high screw speed,
improvements on nanocomposite mechanical properties were maximized. High screw
speed decreases the residence time, and with low temperature the diffusive effect
decreases and the melt viscosity increases. On the other hand, the shear stress
exerted on the polymer and silicate layer during the extrusion, reaches a level that
compensates the effects of low temperature [23]. It is stated in the literature that, in
order to obtain exfoliated structures, the shear stress should be sufficient to
overcome the electrostatic forces between silicate layers. It is also reported that low
temperature profile, high screw speed and high polymer viscosity are recommended
for enhanced mixing properties [35, 74, 75]. Experimental steps of the preparation of
ternary nanocomposites are shown schematically in Figure 3.6. In order to
investigate the effects of adding compatibilizer or organoclay as a third component,
binary blends of polypropylene-compatibilizer polypropylene -organoclay were also
prepared.

43
Figure 3.6 Flow chart for nanocomposite production and characterization.
Drying
1st Extrusion (MB1)
Drying
2nd Extrusion
Drying
Injection Molding
Characterization Tests
Morphological Tests
-XRD
Side Feeder(Organoclay)
Main Feeder(Compatibilizer)
Main Feeder(1st Blend +
Mechanical Tests
-Tensile Test
Thermal Tests
-DSC

44
The aim of extruding organoclay and compatibilizer simultaneously in the first
extrusion is to increase the reaction between the clay and the compatibilizer and
provide expansion in interlayer spacings of organoclay particulates in order to obtain
enhanced polymer intercalation in the second extrusion.
In the first extrusion of organoclay and compatibilizer (MB1); the organoclay was fed
to the extruder from the side feeder and the compatibilizer was fed from the main
feeder. In the second extrusion; after the drying step, polypropylene and first mixture
that resulted from were dry blended and fed to the extruder from the main feeder to
obtain ternary nanocomposites. Nanocomposite compositions prepared in this study
are given in Table 3.6 and Table 3.7.
Table 3.6 Binary composite compositions prepared in experiments.
Binary composites EP300L +
2 % Compatibilizer (M) EP300L + % 2 M (2M)
EP300L + 6 % Compatibilizer (M)
EP300L + % 6 M (6M)
Nanofil 5 (N5) Nanofil 8 (N8)
EP300L +
1 % Organoclay EP300L + 1% N5 (1N5) EP300L + 1% N8 (1N8)
EP300L +
8 % Organoclay EP300L + 8% N5 (8N5) EP300L + 8% N8 (8N8)

45
Table 3.7 Ternary composite compositions prepared in experiments.
Ternary Nanocomposites
EP300L +
8 % Compatibilizer (M) + Organoclay
Nanofil 5 (N5) Nanofil 8 (N8)
EP300L+8% M+1%N5 (8M1N5) -
EP300L+8% M+2% N5 (8M2N5) -
EP300L+8% M+3% N5 (8M3N5) -
EP300L+8% M+4% N5 (8M4N5) -
EP300L + 6 % Compatibilizer (M)
+ Organoclay
EP300L+6% M+1% N5 (6M1N5) EP300L+6% M+1% N8 (6M1N8)
EP300L+6% M+2% N5 (6M2N5) EP300L+6% M+2% N8 (6M2N8)
EP300L+6% M+3% N5 (6M3N5) -
EP300L+6% M+4% N5 (6M4N5) -
EP300L + 4 % Compatibilizer (M)
+ Organoclay
EP300L+4% M+1% N5 (4M1N5) EP300L+4% M+1% N8 (4M1N8)
EP300L+4% M+2% N5 (4M2N5) EP300L+4% M+2% N8 (4M2N8)
EP300L+4% M+3% N5 (4M3N5) -
EP300L+4% M+4% N5 (4M1N5) -
EP300L +
3 % Compatibilizer (M) + Organoclay
EP300L+3% M+1% N5 (3M1N5) EP300L+2% M+1% N8 (3M1N8)
EP300L+3% M+2% N5 (3M2N5) EP300L+2% M+2% N8 (3M2N8)
EP300L+3% M+3% N5 (3M3N5) -
EP300L+3% M+4% N5 (3M4N5) -
EP300L + 2 % Compatibilizer (M)
+ Organoclay
EP300L+2% M+1% N5 (2M1N5) EP300L+1% M+1% N8 (2M1N8)
EP300L+2% M+2% N5 (2M2N5) EP300L+1% M+2% N8 (2M2N8)
EP300L+2% M+3% N5 (2M3N5) -
EP300L+2% M+4% N5 (2M4N5) -

46
3.2.1 Injection Molding
The nanocomposite samples for analysis were made by injection molding with DSM
Xplore (laboratory scale of 10 cc) micro injection molding equipment, as shown in
Figure 3.7. The melt and mold temperatures were set to 220°C and 30°C respectively
for all the experiments. Hold time for melting of the polymer was 3 minutes and 30
seconds, including the feeding time of 10 seconds. Molding cycle of the injection
machine had three steps; filling step (pressure: 10 bar, duration: 5 seconds), packing
in order to offset shrinkage (15 bar, 10 seconds), cooling step (no pressure, 10
seconds. After cooling step, specimens were taken out at 30 °C temperature.
Specimens were conditioned at room temperature for 24 hours before conducting the
characterization tests. Molding parameters are shown in Table 3.8.
Figure 3.7 Injection molding equipment.

47
Table 3.8 Injection molding parameters.
Molding Parameters
Nozzle temperature 220 ºC
Mold temperature 30 ºC
Hold time 3.5 min
Injection pressure 15 bar
3.3 Characterization
3.3.1 Morphological Testing Procedure and Equipment
In order to determine the basal spacings of the organoclay layers and dispersion of
the clay particles in the polymer matrix; X-ray Diffraction (XRD) analyses were done.
Also, in order to see the surface morphologies, failure mechanisms and phase
structures of the composites, Scanning electron Microscopy (SEM) photographs were
taken from the fracture surface of the specimens in impact tests. Specimens used in
morphological tests are shown in Figure 3.8.
3.3.1.1 X-Ray Diffraction Analysis
The samples were analyzed by Rigaku D/Max-2200/PC X-Ray diffractometer with
monochromatic Cu Kα radiation source (l =1.5418) at 40 kV and 40 mA. Diffraction
angle 2θ was scanned from 1º to 8º at a scan rate of 1º/min with a step size of 0.01º.
Peak positions were used to calculate the d-spacings of organoclay layers by using
Bragg’s Law. Molded, dog bone shaped tensile bars were used in XRD analysis.
3.3.1.2 Scanning Electron Microscopy (SEM) Analysis
SEM micrographs were taken with a JEOL JSM-6400 low voltage scanning electron
microscope after gold coating of the samples. Average domain was calculated by
Image J program.

48
Figure 3.8 Specimens used in morphological analysis.
3.3.2 Mechanical Properties
In this study, mechanical tests were done to determine the tensile strength, tensile
stress at yield, Young’s Modulus, elongation at break (%) and impact strength.
Effects of clay type and composition on composite performance could easily be
detected by mechanical testing. The tensile test results show the stiffness of the
materials, while impact test gives information about the impact toughness. The
improvements of the mechanical properties of the materials are expected to be a
reflection of the degree of dispersion of the organoclays and compatibility of the
compatibilizer with the polymer matrix.
All mechanical tests were conducted at 23ºC ± 2°C, and at least five specimens were
tested for each set of experiment. After injection molding, specimens were left for 24
h in desiccators for slow cooling and completion of crystallization. Tensile test
specimens were molded according to ISO 527-5A and impact test specimens were
molded according to ISO 179 standards. Test results reported are the average
results of five specimens. The standard deviations for each set are also shown on the
figures.

49
3.3.2.1 Tensile Test
Tensile tests were performed by Lloyd 30K universal testing machine according to
ISO 527 [76]. The dimensions of the specimens are shown in Figure 3.9 and
tabulated in Table 3.9. The strain rate applied was 0.5 min-1 (Crosshead speed: 15
mm/min, gauge length of the specimen: 30 mm). At the end of the test, stress-strain
curve of the sample was obtained and the tensile stress, tensile strength, elongation
at break (%) and Young’s Modulus values were calculated from the stress-strain
curve.
Figure 3.9 Tensile test specimen.
Table 3.9 Dimensions of the tensile test specimens.
Symbol Definition Value (mm)
W Width of narrow section 4
D Distance between grips 50
L0 Overall length 75
g Gauge Length 30
t Thickness >2
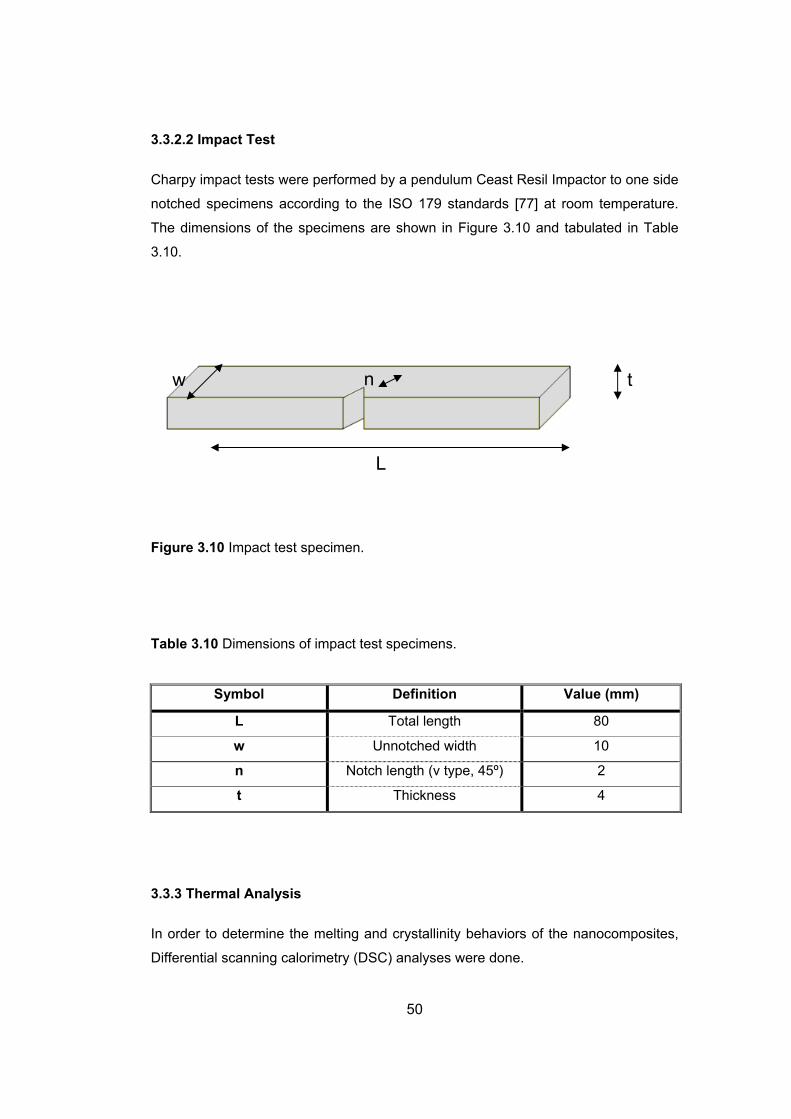
50
3.3.2.2 Impact Test
Charpy impact tests were performed by a pendulum Ceast Resil Impactor to one side
notched specimens according to the ISO 179 standards [77] at room temperature.
The dimensions of the specimens are shown in Figure 3.10 and tabulated in Table
3.10.
Figure 3.10 Impact test specimen.
Table 3.10 Dimensions of impact test specimens.
Symbol Definition Value (mm)
L Total length 80
w Unnotched width 10
n Notch length (v type, 45º) 2
t Thickness 4
3.3.3 Thermal Analysis
In order to determine the melting and crystallinity behaviors of the nanocomposites,
Differential scanning calorimetry (DSC) analyses were done.
n
L
w t

51
3.3.3.1 Differential Scanning Calorimetry (DSC) Analysis
In order to evaluate the deviations in melting point (Tm) and percent crystallinity value
due to the addition of organoclay and compatibilizer, Differential scanning calorimetry
(DSC) measurements were carried out under nitrogen atmosphere with DSC-60
Shimadzu differential scanning calorimeter. Samples weighing 3-4 mg were cut from
the middle of the molded dog bone specimens. Samples were placed in aluminum
pans and heated from room temperature to 250 ºC at a rate of 5 ºC/min.
Percent crystallinity values were calculated using the heat of fusion and the weight
fraction of the polymer matrix of the specimen and the heat of fusion of 100 %
crystalline polypropylene for EP300L polymer matrix. The proportion of the heat of
fusion (ΔHf) values of the specimens divided by the weight fraction of EP300L (w) in
the nanocomposite and the heat of fusion of the pure crystalline form of the PP (ΔHºf)
gives the percent crystallinity. Heat of fusion value of 100% crystalline PP was taken
as 209 J/g [78].

52
CHAPTER 4
RESULTS AND DISCUSSION
4.1. Morphological Analysis
In order to examine the morphological structure of nanocomposites XRD and SEM
analyses were done.
4.1.2 X-RAY Diffraction Analysis
X-ray diffraction is a simple, useful and widely used characterization technique for
determination of clay dispersibility. By monitoring the reflections from the silicate
layers in the clay, regarding to their periodic arrangement and repetitive multilayer
structure, intercalation of the clay can be examined [19, 21].
Intensity versus 2θ values graphs were obtained after XRD analysis, and interlayer
spacings were calculated by using Bragg’s Law. Intercalation of the polymer chains is
indicated by the shift of the diffraction peak towards lower angles in the XRD graphs
(a shift to left in the graph) [19]. On the other hand, the disappearance of the d1 peak
indicates exfoliated structure in nanocomposites due to disordered silicate layers [19,
22, and 79]. As the amount of intercalated clay decreases, the intensity of the peak
decreases; implying breakdown of the platelet agglomerates or partial exfoliation.
There is also a possibility of intermediate structures which may have the
characteristics of both intercalated and exfoliated morphologies. If in the XRD
analysis the intensity is decreased and the diffraction peak is broadened, then in this
case the structure is partially exfoliated or delaminated [19].

53
Figure 4.1 shows the X-Ray Diffraction pattern of the polymer matrix used (EP300L)
and d-spacing values are given in Table 4.1. As it seen from the pattern, there is no
diffraction peak observed in 1-8 2θ (o) range.
Figure 4.1 X-Ray Diffraction pattern of EP300L
XRD of organoclays Nanofill ® 5(N5) and Nanofill ® 8(N8) in powder form are shown
in Figures 4.2 - 4.3 and Table 4.1. N5 has two diffraction peaks and N8 has three
diffraction peaks which are consistent with the data provided by their producer. The
first basal reflections exists at 2θ=2.79º (d1=31.6 Å) for N5 and 2θ=2.59º (d1=34.1 Å)
for N8; representing the characteristic peaks of the organoclay silicate layers. The
intercalation and exfoliation of the nanocomposites were determined by analyzing the
changes in these characteristic diffraction peaks.
If d2 is twice d1, it may have resulted from secondary reflections. Also appearance of
a second peak may result from the existence of another silicate layer or as a
consequence of the presence of unmodified natural MMT due to improper
modification [80-82]. In Nanofil ® 5 d2 is due to unmodified MMT,since the main peak
in natural(unmodified) MMT is observed at approximately 12 Å.

54
Figure 4.2 XRD pattern of Nanofill ® 5 (N5) in powder form.
In N8 organoclay, the second peak may has resulted from some inorganic cations of
the smectite clay that are not fully replaced by organic ions after modification in the
clay. The third peak in N8 is due to unmodified MMT clay layers, since it occurs at 12
Å.

55
Figure 4.3 XRD pattern of Nanofill ® 8 (N8) in powder form.
Table 4.1 XRD results of EP300L, N5 and N8.
Sample Peak-I Peak-II Peak-III
2θ (º) d1 (Å) 2θ (º) d2 (Å) 2θ (º) d3 (Å)
Polymer Matrix
EP300L - - - - - -
Organoclay
N5 2.8 31.6 6.8 12.9 - -
N8 2.6 34.1 4.9 18.1 7.36 12.0
4.1.2.1 Effects of Compatibilizer
Polypropylene is a non polar and highly hydrophobic polymer that makes diffusion of
polypropylene macromolecules between silicate layers difficult due to thermodynamic
restrictions [34, 67]. In order to promote intercalation between MMT and
polypropylene, usually compatibilizers are added and high shear and dispersive

56
forces are applied during compounding [40, 41]. In this study Bondyram®
1001(Maleic Anhydride Modified Polypropylene (M)) was added in different
compositions as the compatibilizer.
In order to determine the effects of the compatibilizer, binary composites of EP300L
and Nanofill ® 5, having 1wt% and 8wt% clay loading, were analyzed. Figure 4.4
shows the XRD diagrams of the binary composites. The basal spacing d1 of the
composites were increased from 31.6 Å to 32.93 Å and 33.05 Å respectively. The
degree of intercalation was not significant. But these results, which are obtained in
the absence of the compatibilizer, indicate that although the polymer and clay are
incompatible, presence of sufficient shear and adequate residence time, resulted in
some intercalation of the polymer at these clay loadings [83]. The second peak would
be due to the intercalation of the unmodified silicate layers that had d1 12.9 Å before
compounding.
Figure 4.4 XRD patterns of binary composites of N5.

57
Figure 4.5 shows the effects of different compatibilizer loadings in 1 wt % N5
organoclay loaded nanocomposites. All the XRD data are also summarized in Table
4.2. Adding Bondyram® 1001 (Maleic Anhydride Modified Polypropylene) (M) as a
compatibilizer increased d1 values up to 35.87 Å at 3 wt % compatibilizer loading,
when compared with 1 wt% N5 loaded binary composite (with no compatibilizer).
There were significant reductions in the intensity of peak amplitudes at 3 and 6 wt%
compatibilizer loadings. When binary composite and ternary composite observations
are considered together, the results indicate that M acted as a compatibilizer and
resulted in the intercalation of polymer chains inside the organoclay interlayer, and
there are partially delaminated layers of Nanofill ® 5 in the polymer matrix.
Figure 4.5 XRD patterns of ternary composites with 2wt%, 3wt%, 4wt%, 6wt% and
8wt% compatibilizer M and 1wt% clay loadings.
Since the d-spacing value of the 8wt% compatibilizer loaded nanocomposite was
lower than those of 2wt%, 3wt%, 4wt% and 6 wt% compatibilizer loaded composites,
increasing the weight fraction of the compatibilizer more than 6 wt% did not

58
significantly contribute to further expansion of the galleries. Polypropylene has no
polar groups in its structure, but on the other hand, even if the hydrophilic clay
surfaces are modified with long alkyl groups, they may remain polar, and non polar
polyolefins cannot enter the clay galleries without the compatibilizing agent. The
balance between the polarities of the organoclay surface and the polymer matrix can
be accomplished by an interaction between the polar group of the compatibilizer and
the oxygen group of the silicates. So, resulting polarity could be the reason of
compatibilization effect [84].

59
Table 4.2 XRD results of binary and ternary nanocomposites with N5.
Sample Peak-I Peak-II Peak-III
2θ (º) d1 (Å) 2θ (º) d2 (Å) 2θ (º) d3 (Å)
N5 2.8 31.6 - - 6.8 12.9
1N5 2.68 32.93 4.99 17.69 6.95 12.70
8N5 2.67 33.05 4.74 18.62 6.80 12.98
2M1N5 2.56 34.47 4.72 18.70 6.64 13.30
3M1N5 2.46 35.87 4.50 19.61 6.52 13.54
4M1N5 2.48 35.58 4.68 18.86 6.30 14.01
6M1N5 2.58 34.20 5.16 17.11 6.42 13.75
8M1N5 2.59 34.07 5.16 17.11 - -
2M2N5 2.56 34.47 4.76 18.54 7.36 12.00
3M2N5 2.56 34.47 3.94 22.40 6.56 13.46
4M2N5 2.64 35.89 4.68 18.86 6.56 13.46
6M2N5 2.53 34.88 4.80 18.39 6.68 13.22
8M2N5 2.55 34.61 4.88 18.09 - -
2M3N5 2.56 34.47 4.48 19.70 6.62 13.34
3M3N5 2.56 34.47 3.06 28.84 6.50 13.58
4M3N5 2.58 34.20 4.64 19.02 6.96 13.69
6M3N5 2.60 33.94 4.90 18.01 6.64 13.30
8M3N5 2.61 33.81 4.90 18.01 - -
2M4N5 2.60 33.94 4.64 19.02 6.72 13.14
3M4N5 2.68 32.93 3.52 25.07 6.60 13.38
4M4N5 2.60 33.94 4.42 19.97 6.58 13.42
6M4N5 2.78 31.74 5.12 17.24 6.66 13.26
8M4N5 2.80 31.52 5.13 17.21 6.84 12.91

60
In the presence of M, the driving force for intercalation is the strong hydrogen
bonding between MAH (or carboxyl group in the case of the hydrolysis of MAH
group) and the oxygen groups of the silicates on the organoclay surface [11, 46].
Owing to compounding compatibilizer M and organoclay first in the MB method, the
interactions between silicate layers were initially weakened, and hence the polymer
chains were more easily intercalated into the clay galleries under strong shear field
[39]. Compatibilizer M has both polar MAH group and nonpolar polypropylene moiety
combined in its structure bridging the gap between MMT and polymer [85]. Moreover,
the polar character of the anhydride in the M has caused an affinity for the silicate
surface [15]. So, as the proportion of maleic anhydride was increased, a stronger
affinity would be formed on the silicates layers and separate them more easily during
compounding. Since there was no phase separation observed, matrix and filler
interaction was also promoted by the miscibility of EP300L in the M structure. Figures
4.6 to 4.8 show the X-Ray Diffraction patterns of the ternary composites. The
corresponding d-spacings are given in Table 4.2.
According to the Table 4.2 and Figures 4.6 to 4.8, shifting of the second peak of the
organoclay to lower angles was observed. This change was more remarkable with
increasing compatibilizer addition. This shift may have resulted from the intercalation
of the polymer chains between the unmodified silicate layers owing to the
compatibilization effect and breakage of large clay agglomerates into small tactoids
under applied shear at low temperature and high screw speed.
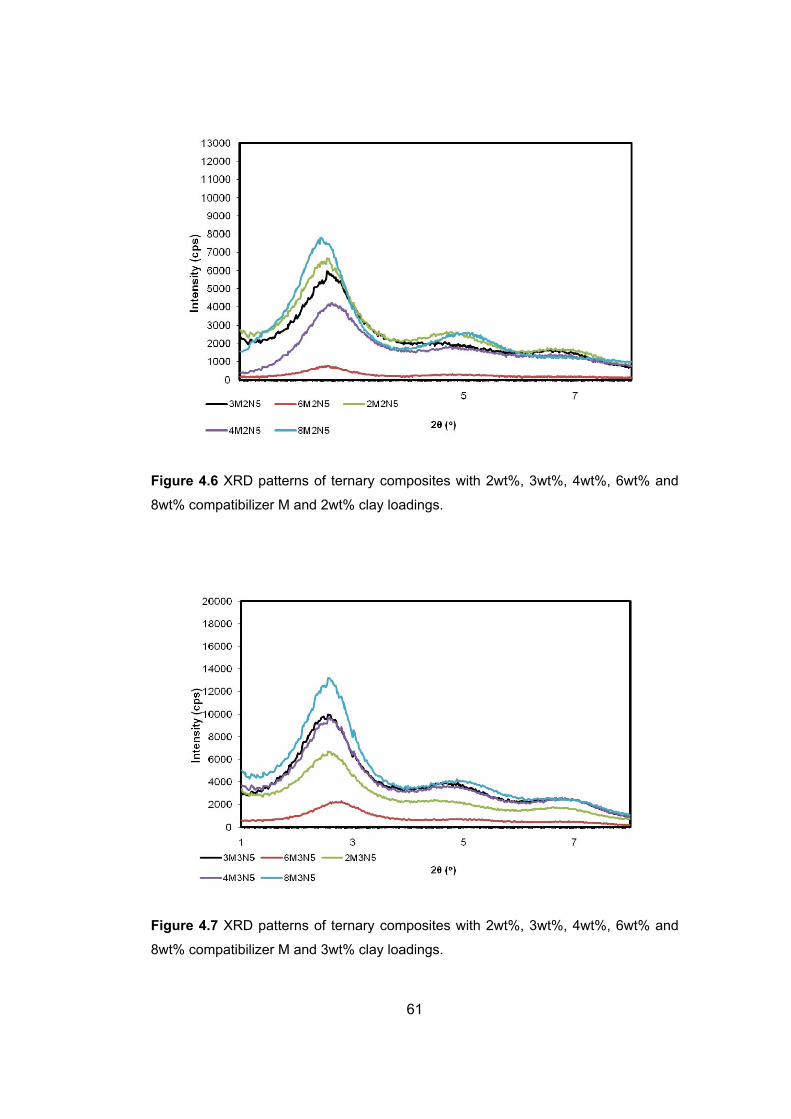
61
Figure 4.6 XRD patterns of ternary composites with 2wt%, 3wt%, 4wt%, 6wt% and
8wt% compatibilizer M and 2wt% clay loadings.
Figure 4.7 XRD patterns of ternary composites with 2wt%, 3wt%, 4wt%, 6wt% and
8wt% compatibilizer M and 3wt% clay loadings.

62
Figure 4.8 XRD patterns of ternary composites with 2wt%, 3wt%, 4wt%, 6wt% and
8wt% compatibilizer M and 4wt% clay loadings.
Moreover, it was also observed in Figures 4.5 to 4.8 that, 6 wt% compatibilizer
loaded nanocomposites have XRD patterns with lower intensity and broadened
peaks. This reduction was more significant for the nanocomposites prepared with
lower organoclay loadings (1wt% and 2wt%, Figures 4.5 and 4.6 respectively)
indicating the formation of a delaminated structure.
4.1.2.2 Effects of Clay Content
Figures 4.9 to 4.13 show the X-Ray Diffraction patterns of ternary composites
prepared with Nanofil® 5 (N5) from 1wt% to 4 wt% and compatibilizer with 2wt%,
3wt%, 4wt%, 6wt% and 8wt% compositions, i.e. the previous data are shown with
respect to clay content at fixed compatibilizer loading. These data are already shown
in Table 4.2. When the clay content was higher than 2wt%, diffraction peaks shifted
to higher angles with increasing peak intensity, in the binary mixtures of
polypropylene and Nanofil® 5.

63
Following the surface treatment of organoclays attractions between the particles are
rendered and the interlayer galleries are expanded, but there are other factors
affecting the polymer intercalation mechanism such as chemical compatibility,
polarity and dispersive forces, etc. [34]. Nanofil® 5 does not have any functional
groups in its modified structure, so dispersive forces, which are applied during
compounding, are more effective in delamination of the organoclay. The shear stress
applied by the matrix polymer could not overcome the cohesive forces between the
clay platelets when the clay loading was higher than a certain concentration (2 wt%
for this study). In this case, silicate layers only break down to large agglomerates
[74].
Figure 4.9 XRD patterns of ternary composites with 1wt%, 2wt%, 3wt% and 4wt%
clay and 2wt% compatibilizer loadings.

64
Figure 4.10 XRD patterns of ternary composites with 1 wt%, 2 wt%, 3 wt% and 4
wt% clay and 3wt% compatibilizer loadings.
Figure 4.11 XRD patterns of ternary composites with 1 wt%, 2 wt%, 3 wt% and 4
wt% clay and 4wt% compatibilizer loadings.
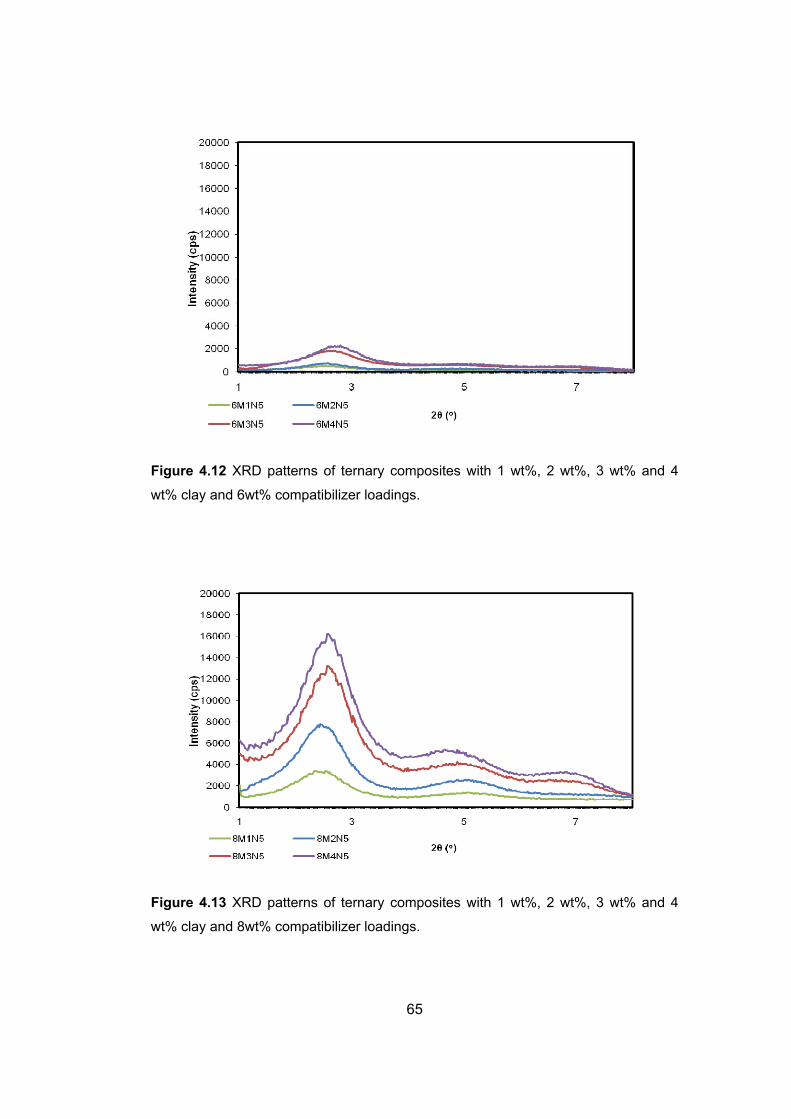
65
Figure 4.12 XRD patterns of ternary composites with 1 wt%, 2 wt%, 3 wt% and 4
wt% clay and 6wt% compatibilizer loadings.
Figure 4.13 XRD patterns of ternary composites with 1 wt%, 2 wt%, 3 wt% and 4
wt% clay and 8wt% compatibilizer loadings.
66
The decrease in d-spacing values of the composites having more than 2 wt% clay
loading observed in Figures 4.9 to 4.13, could be also a consequence of collapsed
clay sheet due to displacement of ammonium compounds during thermal and
mechanical treatment [86].
The most significant reduction in intensity and broadening of the peaks with increase
in the basal spacing was observed in 6 wt% compatibilizer loaded composites
indicating intercalated-delaminated structure formation. The positive effect of
compatibilization was also observed in these nanocomposites even with high clay
loadings (3 wt% and 4 wt %) but still with poor intercalation. As a result of these
patterns, clay contents above 2 wt% were found to be ineffective.
4.1.2.3 Effects of Clay Type
Effects of different clay types were investigated in the last part of the study. XRD
patterns of the nanocomposites, which were prepared with Nanofill® 5 and Nanofill®
8, were compared. In this part of the study, the clay content was limited up to 2 wt%
and the compatibilizer content was limited up to 6 wt% since additive content higher
than these were found to be nonproductive in the previous experiments.
In Figure 4.14, XRD diagram of binary nanocomposites of Nanofill® 8 and EP300L
polymer matrix are shown exhibiting three distinct diffraction peaks, and it was
observed that the characteristic peak of Nanofill® 8 was shifted to lower angles at
low clay loadings even in the absence of the compatibilizer. All of the XRD data with
N8 are shown in Table 4.3. At high clay loadings a decrease in d-spacing values
were observed compared to pure clay powder, which could be a consequence of
collapsed clay layers due to displacement of ammonium compounds during thermal
and mechanical treatment [86]. In the diagrams, three distinct diffraction peaks were
observable.

67
Figure 4.14 XRD patterns of binary composites prepared with Nanofill® 8.

68
Table 4.3 XRD results, effects of clay type with N8.
Sample Peak-I Peak-II Peak-III
2θ (º) d1 (Å) 2θ (º) d2 (Å) 2θ (º) d3 (Å)
Organoclay
N8 2.59 34.1 4.9 18.1 7.36 12.0
Binary nanocomposites
1N8 2.58 34.20 5.0 17.65 7.32 12.06
8N8 2.79 31.63 5.05 17.48 7.36 12.0
Ternary nanocomposites
2M1N8 2.34 37.71 4.44 19.88 6.54 13.50
2M2N8 2.44 36.16 4.64 19.02 6.88 12.83
3M1N8 2.32 38.04 4.42 19.97 6.50 13.58
3M2N8 2.46 35.87 4.58 19.27 6.62 13.34
4M1N8 2.34 37.71 4.50 19.61 6.36 13.88
4M2N8 2.44 36.16 4.64 19.02 6.68 13.22
6M1N8 2.36 37.39 4.54 19.44 6.50 13.58
6M2N8 2.33 37.87 4.52 19.53 6.63 13.32
Figures 4.15 and 4.16 show the XRD pattern of the ternary composites with N8 and
the results are already given in Table 4.3. XRD diagrams of ternary composites
prepared with Nanofill® 8 and compatibilizer M reveal that the characteristic peak of
the organoclay was shifted to lower angles indicating intercalated structure. However,
partial delamination was not observed since, the peak intensities did not decrease or
the peaks did not broaden.
When the two organoclays are compared it is observed that, Nanofill® 5 based
nanocomposites exhibit mostly intercalated-delaminated structure, while Nanofill® 8
based nanocomposites are mostly intercalated. Nanofill® 8 has a higher initial d-
spacing than Nanofill® 5, and when the structures are compared it is observed that,
Nanofill® 8 and Nanofill® 5 both contain two long tallow chains. These two aliphatic
chains in the organoclay structure would be limiting the entrance of PP
macromolecules to the silicate surface. Two long tails create a shielding effect
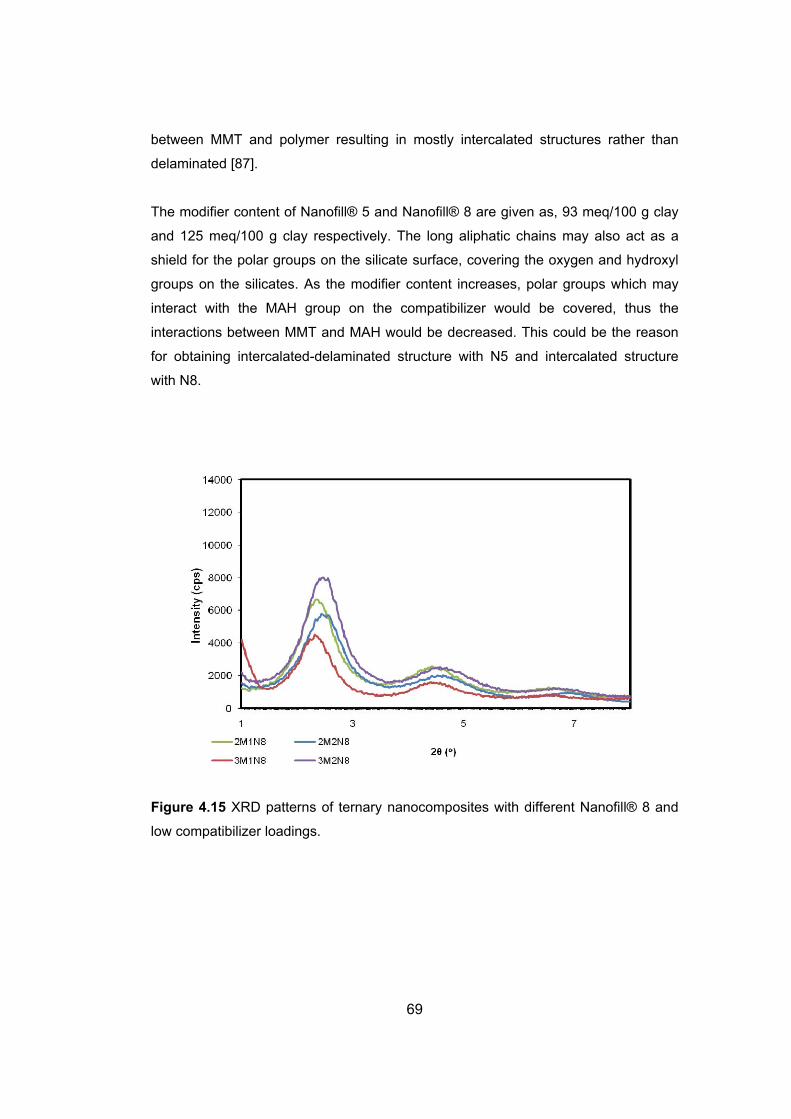
69
between MMT and polymer resulting in mostly intercalated structures rather than
delaminated [87].
The modifier content of Nanofill® 5 and Nanofill® 8 are given as, 93 meq/100 g clay
and 125 meq/100 g clay respectively. The long aliphatic chains may also act as a
shield for the polar groups on the silicate surface, covering the oxygen and hydroxyl
groups on the silicates. As the modifier content increases, polar groups which may
interact with the MAH group on the compatibilizer would be covered, thus the
interactions between MMT and MAH would be decreased. This could be the reason
for obtaining intercalated-delaminated structure with N5 and intercalated structure
with N8.
Figure 4.15 XRD patterns of ternary nanocomposites with different Nanofill® 8 and
low compatibilizer loadings.

70
Figure 4.16 XRD patterns of ternary nanocomposites with different Nanofill® 8 and
high compatibilizer loadings.
In conclusion, excess amount of clay loading (above 2wt % in this case), diminished
the intercalation mechanism even in the presence of compatibilizer. High affinity of
maleic anhydride content enhanced possible reactions between organoclay and
compatibilizer and favored intercalation up to a certain content (6 wt% for this case).
In addition to these, it was observed that the structure and accommodation of alkyl
chains are more important than polarity or initial d spacing of an organoclay.
The method of production of the nanocomposites could be a reason for improved
intercalation mechanism in nearly all of the compositions, since with masterbatch
(MB) method expansion of silicate layers is achieved before the addition of polymer.
In the MB mixing process, compatibilizer M chains penetrate into organoclay layer
and react with silicate surfaces. Then, the matrix polymer can easily penetrate into
these thick layers and form a broad interphase, thus polymer molecules can easily
penetrate between the silicate layers [88].

71
4.1.3 Scanning Electron Microscopy Analysis (SEM)
In order to investigate the morphology of the composites and examine the dispersion
of the organoclays and compatibilizers, SEM analysis was conducted. Dispersion of
the organoclays and compatibilizers are important factors in toughening
mechanisms. The base polymer EP300L is a heterophasic PP with elastomeric
phase (elastomeric domains). Using Equation 4.1-4.2 and Image J program, average
sizes of the elastomeric phase (size of the domains) in EP300L were calculated. For
each calculation 100 to 200 domains were selected. The calculated number average
area values were converted to number average diameters. In the Equation 4.1 Ni is
the number of the domains selected with calculated area of Ai.
∑∑
=i
ii
N
ANA [4.1]
πA4d = [4.2]
The morphological structure of once extruded EP300L polypropylene matrix was
porous owing to its heterophasic copolymer structure, which is also confirmed by its
producer. Figure 4.17 shows the SEM images EP300L that was extruded once. The
surface morphologies of the nanocomposites are shown in Figures 4.17 to 4.22 and
the domain sizes calculated are given in Table 4.4. The ternary composites analyzed
by SEM were the ones having the most intercalated-delaminated structures
according to XRD analysis. The samples analyzed were not etched since there was
no significant change expected with etching.

72
Table 4.4 SEM results and the domain sizes of the heterophasic EP300L.
Components d (µ)
EP300L (extruded once) 1.14
Polymer Matrix- Compatibilizer Blends
EP300L+ 2 wt% M (2M) 1.09 EP300L+ 6 wt% M (6M) 1.0
Polymer Matrix- Organoclay Blends
EP300L+1 wt% N5 (1N5) 1.11 EP300L+8 wt% N5 (8N5) 1.05
EP300L+1 wt% N8 (1N8) 1.10 EP300L+8 wt% N8 (8N8) 1.01
Ternary Nanocomposites
EP300L+ 1wt% N5+ 6wt% M (6M1N5) 0.99 EP300L+ 2wt% N5+ 6wt% M (6M2N5) 0.96 EP300L+ 4wt% N5+ 6wt% M (6M4N5) 0.98
EP300L+ 1wt% N8+ 3wt% M (3M1N8) 0.98
The mechanism of the formation of the domains can be explained as the stretching of
the dispersed phases and then breaking down of the stretched fibers into the smaller
droplets during blending. Finally, these droplets coalesce and form larger particles
[89]. Due to the forced collisions of the dispersed domains with an input of energy,
coalescence and recombination of the domains occur and new surfaces and
interfaces form [90, 91].
The optimum domain size is achieved when the number of coalescence of the
droplets and breakdown of the stretched fibers are balanced [92]. Domain sizes are
controlled by the viscosity and melt elasticity of the components, shear stresses and
rates, mobility of the interface and surface tension [89].

73
Figure 4.17 SEM micrographs of EP300L extruded once a) x250 b) x3000.
4.1.3.1 Effects of Clay Content
Figure 4.18 shows the binary mixtures of Nanofill® 5 and EP300L at different clay
contents. The figures indicate that, increasing clay loading from 1 wt% to 8 wt%
caused reduction in the size of the EP300L domains. During extrusion the breakage
of domains into smaller sizes occurred, and on the other hand, by the barrier effect of
the organoclay, recombination of the domains could be suppressed [42]. As the
organoclay loading was increased the coalescence of the domains became more
difficult and the domain sizes were smaller.
It is also observed in Figure 4.18 that, the crack lines go through the surface
structure. The fracture surface of neat EP300L (Figure 4.17a) is more tortuous than
the fracture surface of binary composites (Figure 4.18a and 4.18c). The roughness of
the surface indicates that, in the binary composites cracks progressed along a less
tortuous path which decreases the fracture surface area, toughness and tensile
strength with respect to neat EP300L. SEM observations also show that, in binary
composites clay particles were dispersed in the polymer matrix in the form of
aggregates indicating the incompatibility of the matrix and the clay without the
compatibilizer.
(b) (a)

74
Figure 4.18 SEM micrographs of binary composites with organoclay N5 a) 1wt% N5
(x250) b) 1wt% N5 (x3000) c) 8 wt% of N5 (x250) d) 8 wt% of N5 (x3000)
4.1.3.2 Effects of Compatibilizer Content
Figure 4.19 shows the SEM images of binary blends prepared with compatibilizer M
and EP300L. It is observed that as the compatibilizer content increased the domain
size of the dispersed phase decreased, average interdomain spacing increased and
the crack lines became more significant. Toughness values measured are also
consistent with these observations as discussed later. These results are also similar
in the ternary composites with compatibilizer M.
(a) (b)
(c) (d)
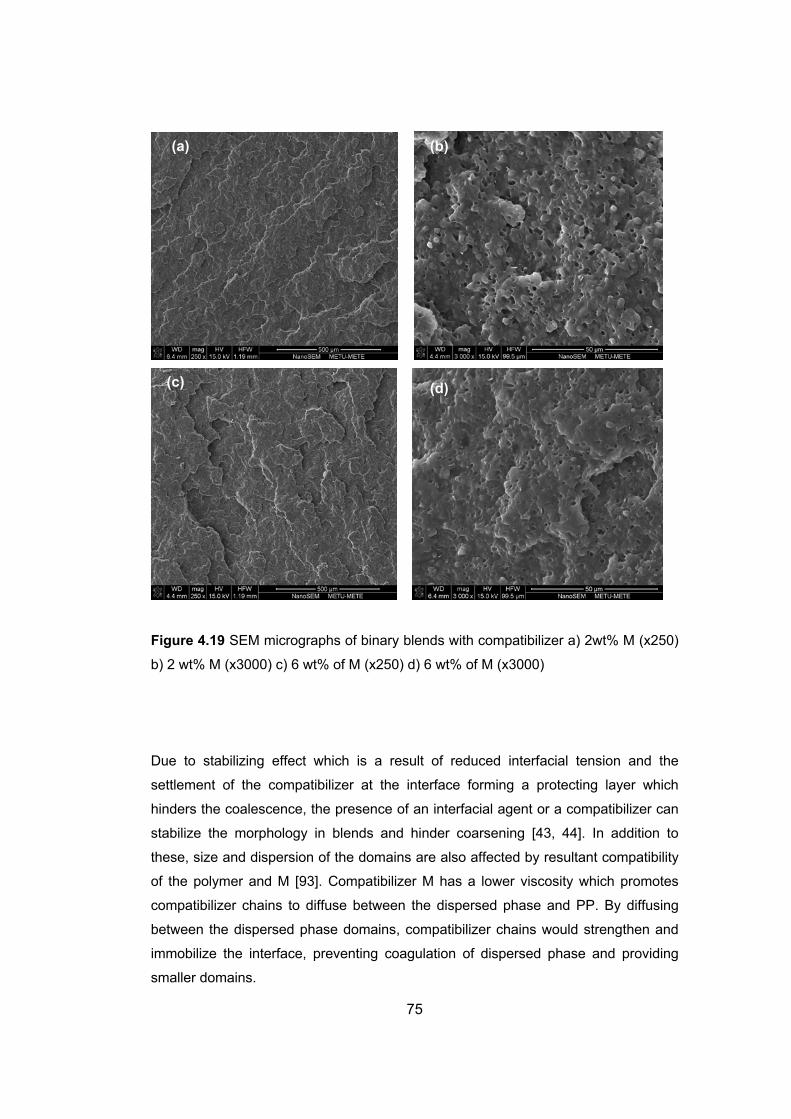
75
Figure 4.19 SEM micrographs of binary blends with compatibilizer a) 2wt% M (x250)
b) 2 wt% M (x3000) c) 6 wt% of M (x250) d) 6 wt% of M (x3000)
Due to stabilizing effect which is a result of reduced interfacial tension and the
settlement of the compatibilizer at the interface forming a protecting layer which
hinders the coalescence, the presence of an interfacial agent or a compatibilizer can
stabilize the morphology in blends and hinder coarsening [43, 44]. In addition to
these, size and dispersion of the domains are also affected by resultant compatibility
of the polymer and M [93]. Compatibilizer M has a lower viscosity which promotes
compatibilizer chains to diffuse between the dispersed phase and PP. By diffusing
between the dispersed phase domains, compatibilizer chains would strengthen and
immobilize the interface, preventing coagulation of dispersed phase and providing
smaller domains.
(a) (b)
(c) (d)

76
The presence of the functional groups in the structure of the compatibilizer M would
also promote the interaction of composite components and reduce the interfacial
tension due to chemical bonding of the polar groups, strengthening the effect of the
Van Der Waals attraction. This mechanism may also provide sufficient adhesion for
toughening [94, 95].
4.1.3.3 Ternary Nanocomposites
In Figure 4.20, the SEM micrographs of nanocomposites prepared with 6 wt%
compatibilizer and different Nanofill® 5 loadings are shown. When these micrographs
are compared, it is seen that the reduction of the domain size and increase in the
interdomain spacings are most significant in the nanocomposite containing 2 wt%
organoclay loading. This result is in accordance with the XRD results and mechanical
results discussed later. Owing to the enhanced adhesion due to the high amount of
compatibilizer M and well dispersion of organoclay layers in the matrix, possible
coagulation of the dispersed phase is inhibited, the average domain size is reduced.
Figure 4.20 shows that, as the clay content is increased above 2wt%, the average
domain size increased slightly and the organoclay agglomerates became more
visible. It is also observed that crack lines became more significant and went through
a more tortuous path in the 6M2N5 nanocomposite which indicates that the
toughness and mechanical properties of the composite could be improved.

77
Figure 4.20 SEM micrographs of ternary composites a) 6M1N5 (x250) b) 6M1N5
(x3000) c) 6M2N5 (x250) d) 6M2N5 (x3000) e) 6M4N5 (x250) f) 6M4N5 (x3000)
(a) (b)
(c) (d)
(e) (f)

78
These results could also be related to the processing conditions of the
nanocomposites at high screw speed and low temperature. At low temperatures the
matrix viscosity is higher, hence the exerted the shear rate and shear stresses would
be higher. In the literature, the effects of shear rate and shear stresses on the
homogeneous dispersion of the domains are mentioned to be significant [23, 89].
4.1.3.4 Effects of Clay Type
In the final part of the study, the effects of clay type were investigated. Figures 4.21
and 4.22 show the SEM micrographs of binary and ternary composites prepared with
organoclay N8 respectively. Increasing clay loading from 1 wt% to 8 wt% caused
reduction in the size of the domains regardless of the type of organoclay. As the
organoclay loading was increased the coalescence of domains became more difficult
and the domain sizes remained smaller. However, in addition to the well dispersion of
the domains, the increase in the interdomain spacings was more significant in the
nanocomposites prepared with N5 type of organoclay. Also, the fracture surface is
more tortuous in N5 nanocomposites in comparison to N8 nanocomposites,
indicating higher toughness, which could be due to the enhanced interactions
between compatibilizer M and the N5. In the ternary blend, which is shown in Figure
4.22, the reduction in the domain size is significant. However, crack propagation path
is less tortuous than the corresponding N5 nanocomposite and the clay
agglomerates are more significantly observed. Due to the agglomeration of the clay,
non-homogeneous coalescence of the domains was observed altering the barrier
effect of the clay, which decreases the impact strength of the nanocomposite with
N8.
To conclude, the domain sizes are reduced and well dispersion of the dispersed
phase is obtained with organoclay and compatibilizer additions owing to the barrier
effect of organoclay and enhanced adhesion between matrix and the domains by
incorporation of the compatibilizer. Finally, a significant difference on the morphology
is not observed by the addition of different types of organoclay.

79
Figure 4.21 SEM micrographs of binary composites with organoclay N8 a) 1wt% N8
(x250) b) 1wt% N8 (x3000) c) 8 wt% of N8 (x250) d) 8 wt% of N8 (x3000)
(a) (b)
(c) (d)

80
Figure 4.22 SEM micrographs of ternary composites with organoclay N8 a) 3M1N8
(x250) b) 3M1N8 (x3000)
4.2 Mechanical Properties
In this study, tensile and Charpy impact tests were done in order to determine the
degree of changes in stiffness and toughness of the matrix material owing to
modifications.
4.2.1 Tensile Tests
Stress-strain curves were obtained during the tensile tests of the materials and
Young’s Modulus, tensile stress at yield, tensile strength and elongation at break (%)
values were determined from these curves. The tensile test results of the EP300L
and the nanocomposites are given in Figures 4.24 to 4.43 and the numerical values
are given in Appendix A for all the composites. The given results of stress and strain
are all engineering stress and engineering strain values.
Typical stress strain curves of polypropylene matrix (EP300L) used in this study are
shown in Figure 4.23. EP300L is a ductile material, displaying linear elastic behavior
up to a specific strain which is the yield strain. After yielding, polymer matrix
undergoes strain hardening period due to stretched polymer chains in the direction of
(a) (b)

81
load. Young’s Modulus, tensile stress at yield, tensile strength and elongation at
break values of the EP300L were 1434 MPa, 36.5 MPa, 51.4 MPa and 812.3%,
respectively.
Figure 4.23 Typical engineering stress-strain curve of EP300L polymer matrix.
In Figures 4.24 to 4.39 the tensile properties of the binary blends and ternary
nanocomposites prepared with compatibilizer M, organoclay N5 and EP300L with
several compositions are shown.
4.2.1.1 Effects of Compatibilizer
Figures 4.24 to 4.27 show the tensile test results of the binary blends and ternary
nanocomposites prepared with compatibilizer M at different compatibilizer and clay
loadings. In binary blends with 2 wt% and 6 wt% M content, all of the tensile
properties except % elongation at break values are reduced. Since M has a lower
tensile modulus than polymer matrix (for the compatibilizer M Young’s Modulus is
991 MPa and tensile strength is 32 MPa), EP300L+M binary blends have lower
Tensile strength
Stress at yield
% Strain at break
Strain (%)

82
Young’s Modulus, yield stress and tensile strength values when compared to neat
EP300L due to the addition of the compatibilizer. Compatibilizer phase is added to
improve organoclay dispersion and to compensate for the decrease in the tensile
properties in the presence of the silicate layers. Young’s Modulus and tensile stress
at yield values of the ternary nanocomposites are also lower and the reductions in
these values are more significant as the compatibilizer content was increased.
The reduction in the tensile strength values of the ternary composites is more
significant when the clay content is above 2 wt%. Especially, at high concentrations
of organoclay, aggregates of clay platelets may act as defects and stress
concentrators in the matrix and promote the failure mechanism [96]. In addition to
aggregation of clay platelets, increase in the number of micro voids in the matrix
would be increased with further addition of organoclay. Micro voids may form due to
high organoclay content in the matrix and then combine causing tearing and failure in
the matrix. Increase in % elongation at break values when compared to the neat
EP300L, especially at low clay loadings, could be due to good adhesion between
clay layers and matrix which is enhanced with the compatibilizer, leading to reduction
of the number of micro voids in the matrix. At low clay loadings, especially at 2 wt%,
as the compatibilizer content is increased, tensile properties are improved except for
the composites having 8 wt% compatibilizer loading.

83
Figure 4.24 Young’s Modulus of binary blends and ternary nanocomposites prepared
with compatibilizer M and N5 clay at different loadings.
Figure 4.25 Tensile stress at yield values of binary blends and ternary
nanocomposites prepared with compatibilizer M and N5 clay at different loadings.

84
Figure 4.26 Tensile strength values of binary blends and ternary nanocomposites
prepared with compatibilizer M and N5 clay at different loadings.
Figure 4.27 Elongation at break (%) values of binary blends and ternary
nanocomposites prepared with compatibilizer M and N5 clay at different loadings.

85
In Figures 4.24 to 4.27, the most significant improvement is observed in the
nanocomposites which have 6 wt% compatibilizer loading. This result is expected
since, these are the only composites exibiting both intercalated and partially
delaminated structure in the XRD analysis, and increased amount of compatibilizer
results in better intercalation owing to higher affinity and hydrogen bonding with the
compatibilizer M. It can be concluded that the organoclay particles are dispersed
more uniformly as M content increases. This is also is stated in the literature and
desired nanoscale dispersion of organoclay is achieved with M through strong
hydrogen bonding between hydroxyl group of silicate structures and the maleic
anhydrate group, while relying on chemical similarity of isotactic PP and grafted PP in
the M structure [15, 97].
Mechanical properties, especially elongation at break, are very sensitive to adhesion
strength between the components or partial miscibility at the interface of blend
components in phase separated systems [98]. Thus, increase in the elongation at
break values together with the stiffness properties can be attributed to possible
increased adhesion provided by both compatibilizer and organoclay system in the
nanocomposites containing 6 wt% M.
4.2.1.2 Effects of Clay Content
Figures 4.28 to 4.31 show that in binary composites prepared with organoclay N5,
addition of organoclay increases Young’s Modulus and tensile stress at yield and
decreases the % elongation at break and tensile strength values. The effect of clay is
observed more significantly as the content of the N5 increases. Improvement in
modulus and yield stress indicates the reinforcing effect of organoclay due to clay’s
high aspect ratio, platelet structure and large contact area with the polymer matrix
[42, 99]. At constant compatibilizer loading, the same increasing trend in tensile
modulus and yield stress is also observed in the ternary composites as the N5
content is increased. In Figures 4.28 to 4.30, the effect of increasing clay content in
ternary nanocomposites is clearly observed. According to these figures, Young’s
Modulus and tensile strength values are generally reduced due to compatibilizer
phase addition, but significantly less reduction occurrs at 2 wt% clay loading.
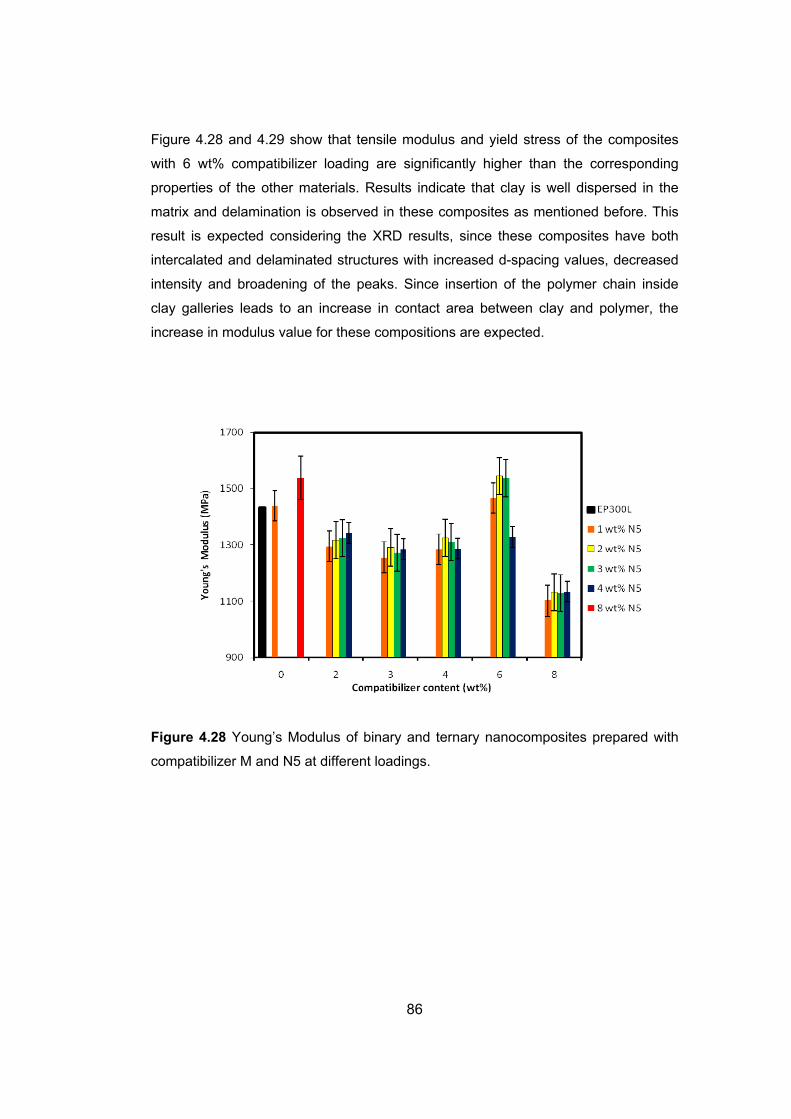
86
Figure 4.28 and 4.29 show that tensile modulus and yield stress of the composites
with 6 wt% compatibilizer loading are significantly higher than the corresponding
properties of the other materials. Results indicate that clay is well dispersed in the
matrix and delamination is observed in these composites as mentioned before. This
result is expected considering the XRD results, since these composites have both
intercalated and delaminated structures with increased d-spacing values, decreased
intensity and broadening of the peaks. Since insertion of the polymer chain inside
clay galleries leads to an increase in contact area between clay and polymer, the
increase in modulus value for these compositions are expected.
Figure 4.28 Young’s Modulus of binary and ternary nanocomposites prepared with
compatibilizer M and N5 at different loadings.

87
Figure 4.29 Tensile stress at yield values of binary and ternary nanocomposites
prepared with compatibilizer M and N5 at different loadings.
Elongation at break values decreases (Figures 4.30) as the clay content increases,
except for the 6 wt% compatibilizer content, at 1w% and 2 wt% clay loadings. The
improvement of % elongation values of the mentioned nanocomposites could be due
to good dispersion as observed in the XRD pattern. This structure allows for chain
mobility under extension. In the other nanocomposites which exhibit decrease in %
elongation at break values, it is believed that presence of clay platelets reduce the
mobility of the polymer chains [100]. It is a known fact that silicate layers cannot
undergo elongation under applied external stresses due to their rigidity [89]. Because
of the possible decrease in the amount of the tie chains between crystalline domains,
the stress applied cannot be transferred through the composite and an early rupture
might occur [101]. Figures 4.26 and 4.30 also reveal that due to early rupture, the
tensile strength at break values decreased as the clay content increases.

88
Figure 4.30 Tensile strength values of binary and ternary nanocomposites prepared
with compatibilizer M and N5 at different loadings.
Figure 4.31 Elongation at break (%) values of binary and ternary nanocomposites
prepared with compatibilizer M and N5 at different loadings.

89
The only reduction in d-spacing value is observed in 8M4N5 nanocomposite which
contains 8 wt% compatibilizer and 4 wt% N5 organoclay. XRD results indicate that
when compared with pure N5 powder; d-spacing value of 8M4N5 nanocomposite is
lower. As a result of this, all tensile properties of this nanocomposite are low as
expected. This could be a consequence of the collapsed clay layers owing to
displacement of ammonium compounds during thermal and mechanical treatment.
4.2.1.3 Improved Nanocomposites
In Figures 4.32 to 4.35 the tensile test results of the ternary composites having 6 wt%
compatibilizer loading are shown in detail since the highest improvements in all the
tensile properties are observed in these nanocomposites. XRD patterns of these
composites indicate the best dispersion and delamination of clay layers enhancing
the stiffness properties of these composites. According to the figures, 6M4N5
composite which has the highest clay content showed reduction in the tensile
properties, since XRD analysis of this composite showed less intercalation in
comparison to the d-spacing values of the others.
Figure 4.32 Young’s Modulus of ternary nanocomposites prepared with 6 wt%
compatibilizer M and N5 at different loadings of clay.

90
Figure 4.33 Tensile stress at yield values of ternary nanocomposites prepared with 6
wt% compatibilizer M and N5 at different loadings of clay.
Figure 4.34 Tensile strength values of ternary nanocomposites prepared with 6 wt%
compatibilizer M and N5 at different loadings of clay.

91
Figure 4.35 Elongation at break (%) values of ternary nanocomposites prepared with
6 wt% compatibilizer M and N5 at different loadings of clay.
Tensile modulus, yield stress, tensile strength and the % elongation at break values
significantly increased for the composites having 1 wt% and 2 wt % clay loading, but
the best improvement is observed in the 6M2N5 composite. This improvement could
be due to the good dispersion as observed in the XRD pattern. Results show that the
lower the amount of the clay, the smaller is the degree of agglomeration due to
cohesive forces resulting in better dispersion.
Mentioning the blend morphology, location of the organoclay particles at the interface
during compounding, can lead to a significant decrease in interfacial tension and
reduction in domain size. In this case, organoclay acts both as a reinforcing agent
and a compatibilizer in the immiscible blend systems [11]. SEM analysis indicate that
the domain sizes are reduced in the ternary composites with 6 wt% compatibilizer
content leading to a general increase in the % elongation at break values. In a
previous study, it was found that the enhancement in Young’s Modulus with the
addition of organoclay and M could be attributed to the increase in the crystallinity of
the PP phase and increased adhesion between the phases [23].
Mechanical properties, especially elongation at break, are very sensitive to adhesion
strength between components or partial miscibility at the interface of blend

92
components in phase separated systems [98]. Thus, increase in the elongation at
break values together with the stiffness properties can be attributed to possible
increased adhesion provided by both the compatibilizer and the organoclay in the
nanocomposites containing 6 wt% M.
Moreover, according the DSC results shown later, an increase in the crystallinity of
these composites is observed, indicating that the compatibilizer M strengthens the
matrix at 6 wt % compatibilizer loading; increases crystallinity and consequently the
mechanical properties are enhanced. Nanocomposite containing 6 wt% M and 2 wt%
N5 exhibited 7.7% increase in Young’s Modulus which is the highest improvement in
the modulus obtained in this study.
4.2.1.4 Effects of Clay Type
In the last part of the study, effects of different clay types on mechanical properties
were investigated at low organoclay content and different compatibilizer loadings.
Figures 4.40 to 4.43 show the results of the nanocomposites prepared with N8 type
of organoclay. XRD patterns of N8 nanocomposites indicated that these composites
have intercalated structure but delamination did not occur.
In the binary composites’ tensile test results, as well as the ternary ones, a general
decreasing trend is observed. Young’s modulus and tensile stress at yield values of
3M1N8 composite are improved with respect to other ternary nanocomposites, while
tensile strength and % elongation at break values are reduced. These results are
consistent with the SEM and XRD results of this composite, since the dispersion of
the domains is not uniform and clay agglomeration is present. XRD patterns of the
composite indicate that, higher intercalation is observed which is consistent with the
low reduction observed in elastic modulus and yield strength values of this
composite. With the effect of higher filler-compatibilizer interactions, and more
effective clay dispersion with N5, less reduction in tensile properties is observed and
with appropriate load of compatibilizer and at low clay content, improvements are
observed. However, even in the presence of the intercalated structures, N8
organoclay addition significantly decreases the tensile properties.

93
Figure 4.36 Young’s Modulus of binary and ternary nanocomposites prepared with
N8 at low content and compatibilizer M at different loadings.
Figure 4.37 Tensile stress at yield values of binary and ternary nanocomposites
prepared with N8 at low content and compatibilizer M at different loadings.

94
Figure 4.38 Tensile strength values of binary and ternary nanocomposites prepared
with N8 at low content and compatibilizer M at different loadings.
Figure 4.39 % Elongation at break values of binary and ternary nanocomposites
prepared with N8 at low content and compatibilizer M at different loadings.
95
4.2.2 Impact Tests
Notched Charpy impact tests were carried out for determination of impact strength of
the blends and nanocomposites. The polymer matrix of the study is a semi-crystalline
polymer. Polypropylene exhibits ductile behavior at low strain rates and brittle
behavior at high strain rates [66]. In order to increase the impact resistance and
toughness of the PP, PP’s are blended with modifiers [88].
Initiation of the crack due to impact stress begins by stress concentrators which are
sharp points, voids and notches in the matrix. Impact stress is concentrated in
inhomogeneities and creates micro cracks followed by the tearing of the matrix in a
single direction.
Toughening of the thermoplastic materials is attributed to the conversion of the high
impact strength in one direction into small multidirectional stresses. The absorption of
the impact stress is also possible, preventing the crack formation.
Toughness of the PP is affected by the size and dispersion of the domains, adhesion
at the interface of the modifier and the continuous phase, interdomain distances and
modulus ratio of the polymer matrix and dispersed phase [89]. Interfacial adhesion,
modulus of the matrix and ratio between the modulus of the matrix and compatibilizer
domains are intrinsic parameters which affect interdomain distances. On the other
hand, domain size is also affected by the stability of the surface mobility and
interfacial tension reduction [89]. Extrinsic parameters such as impact speed, test
temperature and deformation mode were kept constant during the study.
4.2.2.1 Effects of Clay Content
Figure 4.40 shows the effects of clay content on the impact strength in binary and
ternary nanocomposites. Organoclay particles have a large surface area decreasing
the chain mobility. This reduction in the chain mobility is inversely proportional with
the stiffness of the polymer [103]. Thus, impact strength of the EP300L decreases
and the material experiences more brittle fracture as the organoclay content is
increased. The decrease in the impact strength of the matrix was much more
significant at high clay contents in both the binary and ternary nanocomposites.

96
Figure 4.40 Impact strength values of binary and ternary nanocomposites prepared
with N5 and compatibilizer M at different loadings.
To prevent crack propagation, the domain sizes which are observed by SEM analysis
should be optimum. Also, in the literature it is mentioned that, cavitation formation
may become easier in the presence of larger domains [104]. When the fracture
ligament size is larger than the dispersed phase size, existence of the domains
cannot influence the crack propagation [93]. Thus, there should be an optimum
domain size to prevent crack formation. Due to the barrier effect of the organoclays
preventing the coalescence of the domains, the domain sizes in the binary
composites were reduced and failed in preventing crack formation. This result was
also observed in the SEM images of the binary nanocomposites. The agglomeration
of the organoclay particles which is more significant and expected at high clay
loadings due to incompatibility of the clay and the matrix, also promotes crack
formation.

97
Figure 4.40 shows that at any compatibilizer content the impact strength decreases
with increasing clay content. The XRD data show that agglomeration increases with
the clay content. The agglomerated clay particles, acting as very sensitive crack tips,
initiate crack propagation, decrease impact strength of the matrix and inhibit the
toughening mechanism.
4.2.2.2 Effects of Compatibilizer Content
Figure 4.41 shows the impact resistance of binary blends and ternary
nanocomposites prepared with EP300L, N5 and compatibilizer M. In the binary
blends with compatibilizer M, a significant improvement in impact toughness behavior
is observed with the addition of 2 wt% compatibilizer, and the toughness is further
enhanced with 6 wt% compatibilizer addition. In ternary nanocomposites, impact
strength values of the materials increase as higher amount of M is added; resulting in
more effectively absorbed and dissipated impact energy by increased compatibilizer
content. Since the modulus of the compatibilizer used is lower than the matrix
material, the energy absorption capacity of the compatibilizer is higher than the
matrix. In addition to this, the critical interdomain spacings increases as the modulus
of the modifier decreases, and it decreases as the modulus of the matrix increases
[46, 105].

98
Figure 4.41 Impact strength values of binary blends and ternary nanocomposites
prepared with N5 and compatibilizer M at different loadings.
There are no improvements in toughness values observed in the nanocomposites
having less than 6 wt% compatibilizer loading. For the 6 and 8 wt% compatibilizer
loadings, due to increased energy absorption capacity of the nanocomposite, the
toughness reduction effect of organoclay addition is compensated. More than 6 wt %
compatibilizer addition does not significantly further improve the toughness values. In
addition to this, since the interaction between the clay and the compatibilizer M
increases as the M content increases, more homogeneous organoclay dispersion is
observed at 6 wt% compatibilizer content.
6 wt% M and 2 wt% N5 type of organoclay containing nanocomposite (6M2N5),
which has the highest improvement in toughness values, exhibits a more significant
increase in interdomain distances in the SEM analysis. In this nanocomposite,
decrease in the domain size and a well dispersion of the domains are also observed.
Moreover, in the XRD patterns of 6 wt % M containing nanocomposites, more
delaminated structures are observed. Better dispersion of organoclay, i.e.
delamination of the clay, decreases the domain size by its barrier effect [42]. Since
the impact strength of the nanocomposites is also improved, the optimum domain

99
size to prevent crack propagation may have been obtained. On the other hand, as
the organoclay content increases, the improvements in toughness values are
reduced due to possible agglomeration of the organoclay. Thus, clay content and
dispersion are the controlling factors for the toughness properties since partial
delamination of the organoclay was seen only at 6 wt % M loading based on XRD
results.
4.2.2.3 Effects of Clay Type
Binary nanocomposites prepared with N8 type of organoclay, exhibit the same
behavior as N5 type of organoclay as it is seen in Figure 4.42. Due to decrease in
chain mobility and the stiffness of the matrix, impact strength of the binary
nanocomposites decreases as the clay content increases. There are no significant
improvements in the toughness of the materials up to 6 wt% compatibilizer loading.
Considering the same compatibilizer loading, the composites with N8 type of
organoclay, have less improvement than the ones with N5 type of organoclay. In the
XRD, it is observed that nanocomposites having N8 have mostly intercalated
structures. High intercalation of the polymer chains decreases the chain mobility and
prevents coalescence of the heterophasic domains. Thus, the domain sizes remain
smaller than the optimum size needed to prevent crack propagation. On the other
hand delaminated structures and improved adhesion properties of the N5 type of
organoclay improve the impact strength in nanocomposites with N5. Moreover, in the
N8 type of organoclay containing nanocomposites, there are clay agglomerates as
observed in SEM analysis, acting as stress concentrators and promoting crack
formation.

100
Figure 4.42 Impact strength values of binary and ternary nanocomposites prepared
with N8 and compatibilizer M at different loadings.
4.3 Differential Scanning Calorimetry (DSC) Analysis
In order to determine the crystallization behavior of the nanocomposites, DSC
analyses are done. DSC thermogram of polypropylene is shown in Figure 4.43 which
exhibits a peak at 163.77 ºC, indicating to a single crystalline phase in the
polypropylene. Compatibilizer M also exhibits one peak at 164 ºC and its DSC
thermogram is shown in Figure 4.44. Related representative DSC thermographs of
the samples are given in Appendix B. The glass transition temperatures of the
samples are not detected in the thermograms, since they are below the room
temperature.
The percent crystallinity values of each nanocomposite are calculated by dividing the
heat of fusion of the sample (ΔHf) with the weight fraction of the polymer matrix in the
nanocomposite and the heat of fusion of the pure crystalline form of the
polypropylene which is 209 J/g [78]. Crystallinity of pure EP300L is calculated as
37.6 % under a low crystallization rate of 5 ºC/min.

101
Figure 4.43 DSC thermogram of EP300L.
Figure 4.44 DSC thermogram of compatibilizer M.

102
The heat of fusion, melting temperature and the calculated % crystallinity values of
the samples are given in Table 4.5. The melting temperatures of the samples
decreases with respect to increasing clay and compatibilizer content, but this
decrease is not considerable in all the compositions.
Table 4.5 DSC results
Sample
Peak-II
Tm, (°C)
ΔH,
(J/g) Xc,
(%)
Polymer Matrix
Polypropylene (EP300L) 166.2 78.5 37.6
Compatibilizer
M 164.0 71.8 34.4
Binary blends
2M 165.1 73.7 36.0
6M 166.2 68.2 34.7
Binary nanocomposites
1N5 165.2 81.9 39.6
8N5 165.5 89.9 46.8
1N8 165.0 77.4 37.4
8N8 165.3 73.6 38.3

103
Table 4.5 (cont’d) DSC results
Sample
Peak-II
Tm, (°C)
ΔH,
(J/g) Xc,
(%)
Polymer Matrix
Polypropylene (EP300L) 166.2 78.5 37.6
Compatibilizer
M 164.0 71.8 34.4
Binary blends
2M 165.1 73.7 36.0
6M 166.2 68.2 34.7
Binary nanocomposites
1N5 165.2 81.9 39.6
8N5 165.5 89.9 46.8
1N8 165.0 77.4 37.4
8N8 165.3 73.6 38.3
Ternary nanocomposites
2M2N5 165.9 72.9 36.3
3M2N5 165.5 71.0 35.8
4M2N5 165.1 70.8 36.0
6M1N5 165.8 74.5 38.3
6M2N5 164.8 87.7 45.6
6M3N5 165.5 74.1 39.0
6M4N5 165.5 76.1 40.4
8M2N5 166.8 66.5 35.3
2M2N8 165.4 78.2 39.0
3M2N8 165.5 74.1 37.3
4M2N8 166.0 73.8 37.6
6M2N8 166.4 67.0 34.9

104
In the binary composites containing N5 type of organoclay, % crystallinity values are
increased significantly as the content of the clay increases. It is mentioned in the
literature that, in the presence of dispersed clay platelets in the matrix,
heterogeneous nucleation is enhanced. Thus, crystallization rate and the crystallinity
of the polymer matrix would increase [70]. Addition of organoclay also decreases the
crystallization temperature and increases the number of crystallite sizes [106]. The
increasing trend in crystallinity values, which is observed as the organoclay content
increases, is also seen in the ternary nanocomposites at same compatibilizer
loading.
In the binary blends of the polymer matrix and the compatibilizer, crystallinity values
of the samples are reduced as the M content increases. Since compatibilizer M is a
less crystalline material then EP300L, the reduction in crystallinity values are
expected.
The increase in crystallinity values of the N5 type organoclay loaded nanocomposites
is observed only in the ones with 6 wt% compatibilizer content. As expected, as the
organoclay content increases, the % crystallinity also increases. The results are
attributed to the well dispersion of the organoclay platelets owing to high interaction
with the compatibilizer M and N5 at this compatibilizer loading. XRD results of these
nanocomposites have revealed that, these specimens are partially delaminated.
Relatively better dispersion of organoclays in the presence of compatibilizer M affects
the rate of heterogeneous nucleation and increases the crystallinity. 6M2N5
nanocomposite shows the most significant increase in crystallinity values which is
expected, since the most delaminated structure and the best dispersion is observed
in this sample. Since the best dispersion is obtained with N5 type of organoclay
addition as it is shown in XRD and SEM results, the increase in % crystallinity is
negligible with N8 type of organoclay containing nanocomposites.

105
CHAPTER 5
CONCLUSIONS
In order to improve the mechanical properties of a heterophasic polypropylene
copolymer, binary blends and binary and ternary nanocomposites were prepared by
melt compounding method with a twin screw extruder. Effects of organoclay types
and concentrations, as well as the effects of compatibilizer content on the
morphology, mechanical and thermal properties of the nanocomposites were
investigated.
XRD results revealed that, as the compatibilizer content increased, intercalation of
the polymer chains was enhanced due to high interaction between the polymer
matrix and the compatibilizer. Increase in the d-spacing values and decrease in the
intensity of the peaks were observed indicating more effective dispersion of the clay
platelets. The driving forces of the interaction between the clay and the polymer
matrix were the high affinity of the compatibilizer M, hydrogen bonding between the
maleic anhydride group and the silicate surfaces and also the chemical compatibility
between the polypropylene matrix and polypropylene present in the compatibilizer
structure. Since compatibilizer M had lower crystallinity than the polymer matrix, with
the increasing compatibilizer content, the % crystallinity values of the ternary
composites and binary blends were reduced in general, except for 6 wt%
compatibilizer loaded nanocomposites. This was an expected result based on XRD
analysis, since these composites were partially delaminated with better dispersion of
the organoclay.
Nanocomposites with two different types of organoclay, Nanofill® 5 (N5) and
Nanofill® 8 (N8), were prepared in order to investigate the effects of organoclay
types. N8 loaded nanocomposites showed mostly intercalated structures while N5

106
loaded ones showed both intercalated-delaminated structures with better dispersion
of the clay platelets. At low organoclay contents, the dispersive forces easily
overcame the cohesive forces between the clay platelets for both of the nanoclay
types. In addition, the % crystallinity was increased and domain sizes observed in the
SEM images were reduced regardless of the clay type at low clay contents. Tensile
properties and the impact strength of the N5 loaded nanocomposites were improved
more than those of the nanocomposites with N8, due to better dispersion of the clay
platelets and the increased interdomain distances observed by XRD and SEM
analysis respectively.
Intercalated structures were observed nearly in all of the composites. However, when
the organoclay content exceeded 2 wt%, increase in the d-spacing values was
diminished in both binary and ternary nanocomposites. In the presence of the
organoclay, % crystallinity and stiffness were increased due to the nucleating effect
and stiffness of the organoclay at high clay loadings. On the other hand, in the SEM
analysis, a significant reduction in the domain size and clay agglomeration was
observed in N8 type of organoclay loaded nanocomposites. The barrier effect of the
organoclay prevented the coalescence of the heterophasic domains, hence the
domain size was decreased. Moreover, clay agglomerates present in the matrix,
acted as stress concentrators and initiated the crack propagation; both effects
decreased the impact strength of the nanocomposites at high clay loadings.
Introduction of the compatibilizer M to the polymer increased the toughness owing to
its higher energy absorbing capacity in the absence of the clay. Addition of
organoclay, decreased the toughness values, however increased the tensile
properties of the ternary nanocomposites at low clay loadings (1 wt % and 2 wt %).
Finally, the best improvement in mechanical properties were obtained for the
nanocomposites containing 6 wt% M and 2 wt% N5 with %7.7 increase in Young’s
Modulus, %2.2 increase in tensile stress at yield, %3.9 in tensile strength, % 3.5 in
elongation at break and % 44.5 in impact strength.

107
REFERENCES
1. Lubin G., “Handbook of Composites”, Van Nostrand Reinhold, New York,
1982.
2. Kaw A.K., “Mechanics of Composite Materials”, 2nd Edition, CRS Press,
Boca Raton, Fla., 2006.
3. Matthews F.L., Rowlings R.D., “Composite Materials, Engineering &
Science”, Chapman & Hall, London, New York, 1994.
4. Fischer H., Materials Science and Engineering, C 23, 763–772, 2003.
5. Chawla K., “Composite Materials Science and Engineering”, 2nd Ed.,
Springer -Verlag, New York, 1998.
6. Callister W., “Materials Science and Engineering: An Introduction”, 4th
Edition, John-Wiley & Sons, USA, 1997.
7. Giannelis E.P., 1996. Polymer Layered Silicate Nanocomposites, Review,
Advanced. Materials, 8, 29-35.
8. Isik I., Yilmazer U. and Bayram G., 2003., Polymer, 44, 6371-6377.
9. Huang X., Lewis S., Brittain W. J. and Vaia R. A., 2000., Macromolecules,
33, 2000-2004.
10. Vaia R.A., Ishii H., Giannelis E.P., Chemistry of Materials, 5, 1694-6, 1993.
11. Ray S.S., Okamoto M., Progress in Polymer Science, 28, 1539-1641, 2003.
12. Manias E., Touny A., Wu L., Strawhecker K., Lu B., Chung T.C., Chemistry
of Materials, 13, 3516-3523, 2001.
13. Lertwimolnun W., Vergnes B., Polymer Engineering Science, 46, 314-323,
2006.

108
14. Karian H.G., “Handbook of Polypropylene and Polypropylene Composites”,
Marcel Dekker Incorporated, New York, 1999.
15. 16. Kim D.H., Fasulo P.D., Rodgers W.R., Paul D.R., Polymer, 48, 5308-
5323, 2007.
16. Starr F.L., “Composites: A Profile of the Worldwide Reinforced Plastics
Industry, Markets and Suppliers”, 3rd Edition, Elsevier, Kidlington, Oxford,
UK, 1999.
17. Ajayan P.M., Schadler L.S., Braun P.V., “Nanocomposite Science and
Technology”, Wiley-VCH, Weinheim, Great Britain, 2003.
18. Mai Y.W., Yu Z.Z., “Polymer Nanocomposites”, CRS Press, Boca Raton,
Fla., Woodhead, Cambridge, England, 2006.
19. Alexandre M., Dubois P., Materials Science and Engineering, 28, 1-63,
2000.
20. Zanetti M., Lomakin S. and Camino G., Macromolecular Materials and
Engineering, 279, 1-9, 2000.
21. Giannelis E.P., Krishnamoorti R., Manias E., Advances in Polymer Science,
138, 107-147, 1999.
22. Gilman J.W., Jackson C.L., Morgan A.B., Harris R., Chemistry of. Materials,
12, 1866-1873, 2000.
23. Cengiz, F., (2008). Ms. Thesis “Preparation and Characterization of
Recycled Polypropylene Based Nanocomposites”, Graduate School of
Natural and Applied Sciences of Middle East Technical University
24. Kornmann, X., PhD Thesis, “Synthesis and Characterization of Thermoset-
clay Nanocomposites”, Division of Polymer Engineering, Luleå University of
Technology: Luleå, Sweden, 2001.
25. Beyer G., Polymer Additives and Compounding, 22-28, 2002.
26. Cho J.W., Paul D.R., Polymer, 42, 1083-1094, 2001.

109
27. Vasile C., “Handbook of Polyolefins”, 2nd Edition, CRC Press, 2000.
28. Kroschwitz J.I., Mark H.F., “Encyclopedia of Polymer Science and
Technology”, 3rd Ed., Wiley Interscience, 2003.
29. Van der Vegt A.K., “From Polymers to Plastics”, Delft University Press,
Delft, The Netherlands, 2002.
30. Tripathi D., “Practical Guide to Polypropylene”, 1st Edition, Rapra
Technology Ltd., UK, 2002.
31. Long Y., Shanks R.A., Journal of Applied Polymer Science, 62, 639-646,
1996.
32. Li Y., Wei G.X., Sue H.J., Journal of Material Science, 37, 2447-2459, 2002.
33. Kim D.H., Fasulo P.D., Rodgers W.R., Paul D.R., Polymer, 48, 5960-5978,
2007.
34. Lei S.G., Hoa S.V., Ton-That, M.T, Composites Science and Technology,
66, 1274-1279, 2006.
35. Modesti M., Lorenzetti A., Bon D., Besco S., Polymer, 46, 10237-10245,
2005.
36. Mehrabzadeh M., Hossein N.K., Journal of Applied Polymer Science, 72,
1257–1265, 1999.
37. Zhao R.F., Dai G., Journal of Applied Polymer Science, 86, 2486–2491,
2002.
38. Utracki L. A., “Clay-Containing Polymeric Nanocomposites”, first edition,
Rapra Technology Ltd., Shawbury, UK, 2004.
39. Kawasumi M., Hasegawa N., Kato M., Usuki A., Okada A., Macromolecules,
30, 6333, 1997.
40. Garcia Lopez D., Gobernado Mitre I., Merino J.C., Pastor J.M., Polymer
Bulletin, 59, 667–676, 2007.

110
41. Hasegawa N., Usuki A., Journal of Applied Polymer Science, 93, 464-470,
2004.
42. Hassan A., Othman N., Wahit M.U., Wei L.J., Rahmat A.R., Ishak
Z.A.M.,Macromolecular Symposia, 239, 182-191, 2006.
43. Baker W.E., Scott C.E., Hu G.H., “Reactive Polymer Blending”, Hanser,
Munich, Germany, 2001.
44. Macosko C.W., Guegan P., Khandpur A.K, Macromolecules, 29, 5590-5598,
1996.
45. Kato M., Usuki A., Okada, A., Kurauchi T., Journal of Applied Polymer
Science, 63, 137-139, 1997.
46. Liu X., Wu Q., Polymer, 42, 10013-10019, 2001.
47. Yayla, S., (2007). “Production and Characterization of
Polypropylene/Organoclay Nanocomposites”, Graduate School of Natural
And Applied Sciences of Middle East Technical University
48. Hasegawa N., Okamoto H., Kawasumi M., Kato M., Tsukigase A., Usuki A.,
Macromolecular. Materials and Engineering, 280/281, 76-79, 2000.
49. Middleman S., “Fundamentals of Polymer Processing”, McGraw-Hill, New
York, 1997.
50. Harper, C.A., “Modern Plastics Handbook”, McGraw-Hill Professional
Publishing, Blacklick, OH, USA, 2000.
51. Tadmor Z., Gogos C.G., “Principles of Polymer Processing”, Wiley, New
York, 1979.
52. Crawford R. J., “Plastics Engineering”, third edition, BH., Oxford, 1998.
53. Todd D.B., “Plastics Compounding-Equipment and Processing”, Hanser
Publishers, Munich, 1998.
54. Ram A., “Fundamentals of Polymer Engineering”, Plenum Press, New York,
1997.

111
55. Margolis J.M., “Engineering Plastics Handbook”, McGraw-Hill, New York,
2006.
56. Shigley J.E., Mischke C.R., Brown T.H, “Standard Handbook of Machine
Design”, McGraw-Hill, New York, 2004.
57. Seymour R.B., “Polymer Chemistry: An Introduction”, 4th Edition, Marrel
Dekker, New York, 1996.
58. Fried J. R., “Polymer Science and Technology”, 2nd Edition, Prentice Hall
Publications, USA, 2003.
59. Sandler S.R, “Polymer Synthesis and Characterization: A Laboratory
Manual”, Academic Press, San Diego, 1998.
60. Billmeyer F.W., “Textbook of Polymer Science”, John Wiley & Sons, New
York, 1984.
61. Rosen S.L., “Fundamental Principles of Polymeric Materials”, Wiley, New
York, 1982.
62. Cao G., “Nanostructures and Nanomaterials: Synthesis, Properties and
Applications”, Imperial College Press, 2004.
63. Ramakrishna, S., “An Introduction to Electrospinning and Nanofibers”, River
Edge, NJ, USA: World Scientific Publishing Company, 2005.
64. Sperling, L.H., “Introduction to Physical Polymer Science”, 4th Edition, Wiley,
2006.
65. Goodhew P.J., Humphreys F.J., Beanland R., “Electron Microscopy and
Analysis”, 3rd Edition, Taylor & Francis, 1975.
66. Deshmane C., Yuan Q., Perkins R.S., Misra R.D.K, Materials Science and
Engineering, A458, 150-157, 2007.
67. Zhang Q., Fu Q., Jiang L., Lei Y., Polymer International, 49, 1561-1564,
2000.

112
68. Ton-That M. T., Perrin-Sarazin F., Cole K. C., Bureau M. N., Denault J.,
Polymer Engineering and Science, 44, 1212-1219, 2004.
69. Lertwimolnun W., Vergnes B., Polymer, 46, 3462-3471, 2005.
70. Modesti M., Lorenzetti A., Bon D., Besco S., Polymer Degradation and
Stability, 91, 672-680, 2006.
71. Zhu L., Xanthos M., Journal of Applied Polymer Science, 93, 1891-1899,
2004.
72. Southern Clay Products, “http://www.scprod.com”, last accessed; on 5th of
June, 2010.
73. Polyram, “http://www.polyram.co.il”, last accessed; on 7th June, 2010.
74. Kim S.W., Jo W.H., Lee M.S., Ko M.B., Jho J.Y., Polymer Journal, 34, 103-
111, 2002.
75. Yilmazer U, Cansever M., Polymer Composites, 23, 61-71, 2002.
76. ISO 527, International Organization for Standardization - Plastics,
“Determination of Tensile Properties” & “Test Conditions for Molding and
Extrusion Plastics”.
77. ISO 179, International Organization for Standardization - Plastics,
“Determination of Charpy Impact Properties”.
78. Chen J.H., Zhong J.C., Cai Y.H., Su W.B., Yang Y.B., Polymer, 48, 2946-
2957, 2007.
79. Xu W., Liang G., Wang W., Tang S., He P., Pan W.P., Journal of Applied
Polymer Science, 88, 3225-3231, 2003.
80. Park K.W., Chowdhury S.R., Park C.C, Kim G.H., Journal of Applied
Polymer Science, 104, 3879-3885, 2007.
81. Mirzadeh A., Kokabi M., European Polymer Journal, 43, 3757-3765, 2007.

113
82. Gonzáles I., Eguiazábal J.I., Nazábal J., Composites Science and
Technology, 66, 1833-1843, 2006.
83. Marchant D., Jayaraman K., Industrial and Engineering Chemistry
Research, 41, 6402-6408, 2002.
84. Chang Y.W., Lee D., Bae S.Y., Polymer International, 55, 184-189, 2006.
85. Chung Y.C., Cho T.K., and Chun B.C., Fibers and Polymers, 9, 7-14, 2008.
86. Pozsgay A., Frater T., Papp L., Sajo I., Pukanszky B., Journal of
Macromocular Science, Part B, 41, 1249, 2002.
87. Fornes T.D., Yoon P.J., Hunter D.L., Keskkula H., Paul D.R., Polymer, 43,
5915-5933, 2002.
88. Lim J.W., Hassan A., Rahmat A.R., Wahit M.U., Journal of Applied Polymer
Science, 99, 3441-3450, 2006.
89. Contreras V., Cafiero M., Da Silva S., Rosales C., Perera R. and Matos M.,
Polymer Engineering and Science, 46, 1111-1120, 2006.
90. Plochocki A.P., Dagli S.S., Andrews R.D., Polymer Engineering Science,
30, 741, 1990.
91. Pukanszky B., Tudos F., Kolarik J., Lednicky F., Polymer Composites, 11,
98, 1990.
92. Tokita N., Rubber Chem. Technology, 50, 292, 1977.
93. Liang J. Z., Li R. K. Y., Journal of Applied Polymer Science, 77, 409-417,
2000.
94. Wu S., Polymer Engineering Science, 27, 335, 1987.
95. Arcana I.M., Bundjali B., Yudistra I., Jariah B., Sukria L., Polymer Journal,
39, 1337-1344, 2007.

114
96. Solomon M.J., Somwangthanaroj A, “Intercalated Polypropylene
Nanocomposites,” Dekker Encyclopedia of Nanoscience and
Nanotechnology, Marcel Dekker, 1483-1490, 2004.
97. Hasegawa N., Okamoto H., Kawasumi M., Usuki A., Journal of Applied
Polymer Science, 74, 3359, 1999.
98. Nielsen L.E., Landel R.F.,”Mechanical Properties of Polymers and
Composites”, 2nd Edition, Marcel Dekker Inc., USA, 1994.
99. Chow, W. S., Mohd Ishak Z. A., Karger-Kocsis J., Apostolov A. A., Ishiaku
U. S., Polymer, 44, 7427, 2003.
100. Saminathan K., Selvakumar P., Bhatnagar N., Polymer Testing, 27, 296-
307, 2008.
101. Vlasveld D.P.N, Vaidya S.G., Bersee H.E.N, Picken S.J, Polymer, 46, 3452-
3461, 2005.
102. Galgali G., Agarwal S., Lele A., Polymer, 45, 6059-6069, 2004.
103. Tjong S.C., Bao S.P., Journal of Polymer Science, Part B, Polymer Physics,
43, 585-595, 2005.
104. Van der Wal, A., Gaymans, R., Journal of Polymer, 40, 6067, 1999.
105. Jiang W., Liu C. H., Wang Z. G., An L. J., Liang H. J., Jiang B.Z., Wang X.
H. And Zhang H. X., Polymer, 39, 3285-3288, 1998.
106. Qin H., Su Q., Zhang S., Zhao B., Yang M., Polymer, 44, 7533-7538, 2003
107. Deenadayalan E., Vidhate S., Lele A., Polymer International, 55, 1270-
1276, 2006.
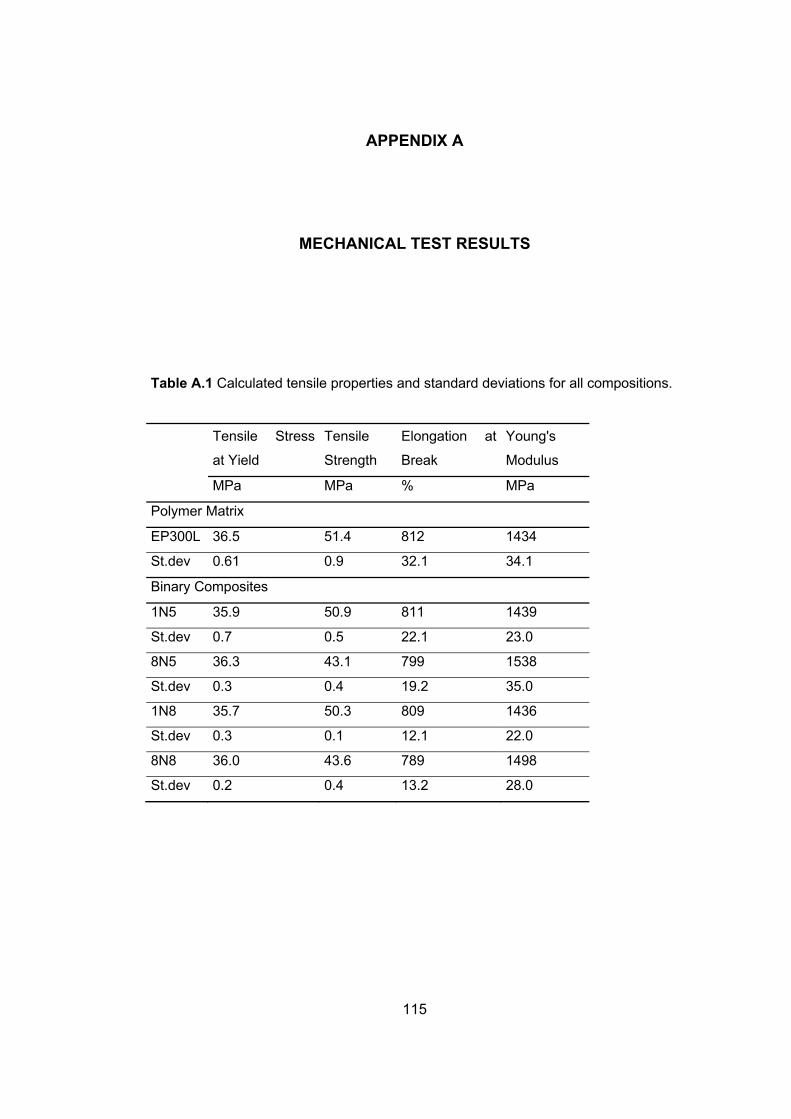
115
APPENDIX A
MECHANICAL TEST RESULTS
Table A.1 Calculated tensile properties and standard deviations for all compositions.
Tensile Stress
at Yield
Tensile
Strength
Elongation at
Break
Young's
Modulus
MPa MPa % MPa
Polymer Matrix
EP300L 36.5 51.4 812 1434
St.dev 0.61 0.9 32.1 34.1
Binary Composites
1N5 35.9 50.9 811 1439
St.dev 0.7 0.5 22.1 23.0
8N5 36.3 43.1 799 1538
St.dev 0.3 0.4 19.2 35.0
1N8 35.7 50.3 809 1436
St.dev 0.3 0.1 12.1 22.0
8N8 36.0 43.6 789 1498
St.dev 0.2 0.4 13.2 28.0

116
Table A.1 Calculated tensile properties and standard deviations for all compositions
(Cont’d).
Tensile Stress at Yield
Tensile Strength
Elongation at Break
Young's Modulus
MPa MPa % MPa
Binary Blends
2M 33.3 50.9 822 1240
St.dev 1.2 0.2 1.7 29.0
6M 32.1 50.1 827 1129
St.dev 0.9 0.3 3.2 36.0
Ternary Composites
8M1N5 34.4 45.6 801 1102
St.dev 0.77 1.3 11.4 25.9
8M2N5 35.2 46.0 812 1131
St.dev 1.05 0.9 7.4 35.1
8M3N5 34.7 44.0 810 1129
St.dev 0.88 1.4 23.6 24.0
8M4N5 33.7 43.1 795 1134
St.dev 3.89 1.7 22.1 11.1
6M1N5 36.9 51.8 825 1467
St.dev 0.56 2.6 5.2 21.0
6M2N5 37.3 53.4 841 1545
St.dev 0.7 1.6 3.7 17.5

117
Table A.1 Calculated tensile properties and standard deviations for all compositions
(Cont’d).
Tensile Stress at Yield
Tensile Strength
Elongation at Break
Young's Modulus
MPa MPa % MPa
Ternary Composites
6M3N5 36.7 52.7 809 1537
St.dev 1.19 2.7 8.6 23.1
6M4N5 36.8 50.2 803 1327
St.dev 1.12 1.4 9.6 39.9
6M1N8 32.3 43.2 794 1149
St.dev 0.93 1.7 24.9 43.1
6M2N8 32.6 41.2 755 1169
St.dev 1.1 0.9 26.2 43.1
4M1N5 35.0 45.8 817 1285
St.dev 1.2 1.2 15.6 32.9
4M2N5 36.1 46.3 818 1324
St.dev 0.7 0.6 6.4 43.7
4M3N5 35.4 44.3 807 1310
St.dev 1.14 3.8 17.6 36.8
4M4N5 36.3 43.2 801 1287
St.dev 0.8 1.7 25.2 27.6
4M1N8 32.8 46.3 788 1186
St.dev 0.9 1.8 35.7 16.9
4M2N8 33.5 44.6 765 1135
St.dev 0.5 1.4 30.3 15.1

118
Table A.2 Impact strength data and standard deviations for all compositions.
Sample Impact Strength
(kJ/m2) St.dev
Polymer Matrix
EP300L 11.9 0.9
Binary Composites
1N5 10.5 1.8
8N5 8.3 0.3
1N8 9.9 0.9
8N8 8 1.9
Binary Blends
2M 13.4 0.7
6M 18.2 1.3
Ternary Nanocomposites
8M1N5 17.0 0.4
8M2N5 16.8 0.8
8M3N5 16.5 1.0
8M4N5 16.4 1.1
6M1N5 16.8 0.5
6M2N5 17.2 0.7
6M3N5 16.7 1.3
6M4N5 14.6 1.1
4M1N5 11.9 0.7
4M2N5 11.9 0.9
4M3N5 11.4 1.9
4M4N5 11.1 0.7
3M1N5 11.0 1.3
3M2N5 10.9 1.1
3M3N5 10.9 2.8
3M4N5 10.5 0.3
2M1N5 11.2 1.1
2M2N5 11.0 0.9
2M3N5 9.5 1.3
2M4N5 9.3 2.6

119
Table A.2 Impact strength data and standard deviations for all compositions (Cont’d).
Sample Impact
Strength (kJ/m2)
St.dev
Ternary Nanocomposites
6M1N8 13.2 0.5
6M2N8 12.1 1.2
4M1N8 10.1 1.1
4M2N8 10.5 0.9
3M1N8 9.3 1.3
3M2N8 9.8 0.4
2M1N8 9.4 2.8
2M2N8 9.1 2.7

120
APPENDIX B
DSC ANALYSIS
Figure B.1 DSC thermogram of binary blend containing 2 wt% M.

121
Figure B.2 DSC thermogram of binary blend containing 6 wt% M.
Figure B.3 DSC thermogram of binary nanocomposite containing 1 wt% Nanofill® 5.

122
Figure B.4 DSC thermogram of binary nanocomposite containing 8 wt% Nanofill® 5.
Figure B.5 DSC thermogram of binary nanocomposite containing 1 wt% Nanofill® 8.

123
Figure B.6 DSC thermogram of binary nanocomposite containing 8 wt% Nanofill® 8.
Figure B.7 DSC thermogram of ternary nanocomposite containing 2 wt% Nanofill ®
5 and 2 wt% M.

124
Figure B.8 DSC thermogram of ternary nanocomposite containing 2 wt% Nanofill ®
5 and 3 wt% M.
Figure B.9 DSC thermogram of ternary nanocomposite containing 2 wt% Nanofill ®
5 and 4 wt% M.

125
Figure B.10 DSC thermogram of ternary nanocomposite containing 1 wt% Nanofill ®
5 and 6 wt% M.
Figure B.11 DSC thermogram of ternary nanocomposite containing 2 wt% Nanofill ®
5 and 6 wt% M.

126
Figure B.12 DSC thermogram of ternary nanocomposite containing 3 wt% Nanofill ®
5 and 6 wt% M.
Figure B.13 DSC thermogram of ternary nanocomposite containing 4 wt% Nanofill ®
5 and 6 wt% M.

127
Figure B.14 DSC thermogram of ternary nanocomposite containing 2 wt% Nanofill ®
5 and 8 wt% M.
Figure B.15 DSC thermogram of ternary nanocomposite containing 2 wt% Nanofill ®
8 and 2 wt% M.

128
Figure B.16 DSC thermogram of ternary nanocomposite containing 2 wt% Nanofill ®
8 and 3 wt% M.
Figure B.17 DSC thermogram of ternary nanocomposite containing 2 wt% Nanofill ®
8 and 4 wt% M.

129
Figure B.18 DSC thermogram of ternary nanocomposite containing 2 wt% Nanofill ®
8 and 6 wt% M.