preliminary results of vodafone group plc for the year ended 31
TRANSCRIPT

Vodafone Group Plc Vodafone House, The Connection, Newbury, Berkshire RG14 2FN, England www.vodafone.com Investor Relations Media Relations Telephone: +44 7919 990230 Telephone: +44 1635 664444 Registered Office: Vodafone House, The Connection, Newbury, Berkshire RG14 2FN, England. Registered in England No. 1833679
news release Vodafone announces results for the year ended 31 March 2012 22 May 2012
Robust financial performance in a difficult environment
• Group revenue up 1.2% to £46.4 billion; full year organic service revenue growth +1.5%*; Q4 +2.3%*
• EBITDA down 1.3% at £14.5 billion; EBITDA margin 31.2%, down 0.8 percentage points (0.6 percentage points before restructuring costs)
• Verizon Wireless service revenue up 7.3%*; our share of profits up 9.3%* to £4.9 billion
• Adjusted operating profit at £11.5 billion, up 2.5%* on an organic basis
• Gain on disposal of investments of £3.5 billion1 and impairment charges of £4.0 billion
• Free cash flow £6.1 billion after capex of £6.4 billion
• Final dividend per share of 6.47 pence, giving total dividends per share for the year of 13.52 pence (including 4.0 pence special dividend), up +51.9%
Financial highlights
Year ended Change year-on-year 31 March 2012 Reported Organic £m % % Group revenue 46,417 +1.2 +2.2 Group service revenue 42,885 +0.3 +1.5 Europe 29,914 (0.6) (1.1) Africa, Middle East and Asia Pacific ('AMAP') 12,751 +3.7 +8.0 Adjusted operating profit 11,532 (2.4) +2.5 Free cash flow 6,105 (13.4) EPS 13.74p (9.6) Adjusted EPS 14.91p (11.0) Total ordinary dividends per share2 9.52p +7.0 Continued strategic progress
• Service revenue growth driven by focus on data (+22.2%*), enterprise (+2.2%*) and emerging markets (India +19.5%*3, Vodacom +7.1%*, Turkey +25.1%*)
• Smartphone penetration in Europe 26.9%, +8.3 percentage points year-on-year; 43.2% of consumer contract revenue in our major European markets from integrated tariffs in Q4
• £14.8 billion raised from disposals since September 2010, of which £6.8 billion committed to share buybacks – programme now 91% complete
• £2.9 billion income dividend received from Verizon Wireless (‘VZW’), of which £2.0 billion was paid out as a special dividend to Vodafone shareholders

2
Guidance for the 2013 financial year
• On an underlying basis, we expect growth in adjusted operating profit and stability in free cash flow
• Adjusted operating profit expected to be in the range of £11.1billion to £11.9 billion, reflecting the weaker euro offset by continued profit growth from VZW
• Free cash flow expected to be in the range of £5.3 billion to £5.8 billion, reflecting the weaker euro and the loss of the dividend from SFR
Vittorio Colao, Group Chief Executive, commented:
“Our focus on the key growth areas of data, emerging markets and enterprise is positioning us well in a difficult macroeconomic environment. Our commercial performance and our ability to leverage scale continue to be strong, enabling us to gain or hold market share in most of our key markets, and reduce the rate of margin decline. Our robust cash generation and the dividend received from Verizon Wireless have enabled us to translate this operational success into good returns for shareholders.
“Our goal over the next three years is to continue to strengthen our technology and commercial platforms through reliable and secure high speed data networks, significantly enhanced customer service across all channels, and improved data pricing models, to enrich customers’ experience and maximise our share of value in the markets in which we operate.”
Notes: * All amounts in this document marked with an “*” represent organic growth which presents performance on a comparable basis, both in terms
of merger and acquisition activity and movements in foreign exchange rates. At the start of Q3 the Group revised its intra-group roaming charges. Whilst neutral to Group revenue and profitability, these changes do have an impact on reported service revenue by country and regionally from Q3 onwards. Whilst prior period reported revenue has not been restated, to ensure comparability in organic growth rates, country and regional revenue in the prior financial year have been recalculated based on the new pricing structure to form the basis for our organic calculations.
1 Includes a £3.4 billion gain on disposal of the Group’s 44% interest in SFR and a £0.1 billion net after tax gain on disposal of the Group’s 24.4% interest in Polkomtel.
2 Excludes the special dividend of 4.0 pence per share paid out of the VZW income dividend received. 3 Financial amounts in relation to India comprise Vodafone India Limited, the Group’s share of Indus Towers Limited and certain Indian shared
service functions.
CHIEF EXECUTIVE’S STATEMENT
3
Financial review
Our overall financial performance this year has been steady. Our major emerging markets operations have had a very strong year. In addition, Verizon Wireless, our 45% owned associate in the United States, combined continued good revenue growth with substantial cash flow. On the other hand, the tough macroeconomic and regulatory environment in much of Europe has made revenue growth in that region increasingly challenging. However, on a relative basis, we have held or gained share in most of our major markets, continuing last year’s trend. The quality of our network continues to improve, with high speed data now available across a growing proportion of our voice network in our European markets, and low frequency spectrum for 4G/LTE services now secured in Italy and Spain. Cash flow generation and shareholder remuneration, even after sustained network investment, continue to be significant. Group revenue for the year was up 1.2% to £46.4 billion, with Group organic service revenue up 1.5%* and data revenue up 22.2%*. Group EBITDA margin fell 0.8 percentage points, as a result of continuing high levels of commercial costs associated with the migration to smartphones, and the difficult trading environment in Spain in particular. Group EBITDA was £14.5 billion, down 1.3% year-on-year, but flat organically before restructuring costs. Group adjusted operating profit was £11.5 billion, down 2.4% year-on-year but at the top of our guidance range of £11.0 billion – £11.8 billion based on guidance exchange rates. The decline in adjusted operating profit was due to the sale of our interest in SFR at the start of the year; on an organic basis, adjusted operating profit was up 2.5%*, as a result of the good performance at VZW. We recognised £3.5 billion of net gains on the disposals of our interests in SFR and Polkomtel, and we recorded impairment charges of £4.0 billion relating to our businesses in Italy, Spain, Portugal and Greece primarily driven by lower projected cash flows within business plans and an increase in discount rates, resulting from adverse changes in the economic environment. Free cash flow was £6.1 billion and within our guidance range of £6.0 billion – £6.5 billion for the year. The year-on-year decline reflected the loss of dividends from China Mobile Limited, the reduction in dividends from SFR, and the conclusion of our prior year working capital programme. Capex was up 2.3% at £6.4 billion, as we continued to maintain our significant level of investment to support our network strategy. In addition to our reported free cash flow we received an income dividend of US$4.5 billion (£2.9 billion) from VZW. Adjusted earnings per share was 14.91 pence, down 11.0% on last year. The decline was driven by the loss of our share of SFR and Polkomtel profits, the loss of income from our interests in China Mobile Limited and SoftBank, and higher finance charges as the result of our decision to take advantage of low prevailing interest rates to fix a higher proportion of our debt. The Board is recommending a final dividend per share of 6.47 pence, to give total ordinary dividends per share of 9.52 pence, up 7.0% year-on-year. During the year we also paid a special dividend of 4.0 pence per share, paid out of the income dividend we received from VZW. Total dividends per share were therefore up 51.9%. Europe Organic service revenue in Europe was down 1.1%* year-on-year. Excluding the impact of regulated cuts to mobile termination rates (‘MTRs’), service revenue grew by 1.4%*. As in the prior year, we saw a broad divide between the more stable major markets of northern Europe, with Germany, the UK and the Netherlands all growing; and the much weaker markets of southern Europe, with Italy and Spain suffering from strong competition and a very poor macroeconomic environment. Data revenue growth was strong at 20.2%*, with smartphone penetration on contract customers of 44.9%, up 11.5 percentage points during the year. We have continued our major commercial push towards integrated voice, SMS and data tariffs, so that in the final quarter, 43.2% of consumer contract service revenue in our major European markets came from customers on integrated tariffs. Organic EBITDA was down 4.5%*, and the EBITDA margin fell 1.5* percentage points. The decline in EBITDA margin was almost entirely driven by margin erosion in Spain, where we put through significant price cuts during the year. Elsewhere, we benefited from increased cost efficiency. AMAP Organic service revenue growth in AMAP was 8.0%*. Our two major businesses, India and Vodacom, reported growth of 19.5%* and 7.1%* respectively. In India, pricing showed clear signs of stabilisation after a prolonged price war. In South Africa, growth continued to be strong, despite significant price cuts on data tariffs. In Australia, revenue declined sharply as our network perception continued to suffer after service issues experienced more than a year ago.

CHIEF EXECUTIVE’S STATEMENT
4
Organic EBITDA was up 7.8%* with EBITDA margin down 0.1* percentage points. EBITDA margins in our two biggest AMAP businesses, Vodacom and India, increased, but this positive impact was offset by a significant decline in the EBITDA margin in Australia. Verizon Wireless Our share of the net income of VZW represented 42.2% of our Group adjusted operating profit. VZW enjoyed another very strong year, with organic service revenue up 7.3%* and EBITDA up 7.9%*. Our share of profits from VZW amounted to £4.9 billion, up 9.3%* year-on-year. In December 2011 VZW announced the proposed acquisition of 122 Advanced Wireless Services spectrum licenses, covering a population of 259 million, from SpectrumCo for US$3.6 billion (£2.3 billion). Update on strategic priorities
1) Mobile data Data services offer the single biggest growth opportunity for the mobile industry since the launch of voice services over 25 years ago. Increasing data speeds, combined with the proliferation of new mobile devices and customer applications, are leading to rapid adoption. Our success in data is absolutely central to our strategy. Data revenue was up 22.2%* year-on-year, and now represents 14.5% of Group service revenue. We have continued to stimulate data adoption by encouraging customers to upgrade to smartphones, and offering a broad portfolio of these handsets across a range of price points. Smartphone penetration in Europe is now 44.9% of contract customers, or 26.9% of the total European base. The proportion of these customers who now take some form of data inclusive bundle has reached 76.9%. In addition, we have made good progress on integrated tariffs, which combine allowances for voice, SMS and data in one monthly fee. In Q4, 43.2% of consumer contract revenue in Europe was from customers on integrated tariffs. This gives us improved visibility of revenue and reduces our exposure to customers using data bundles to substitute voice and SMS usage. Network quality is key to our data strategy, and we continue to make significant investments to enhance the coverage, reliability and speed of our service. 82% of our European network can now deliver speeds of up to 14.4 Mbps, compared to 66% 12 months ago. In Germany and Portugal we have launched fourth generation LTE services, offering yet higher speeds and quicker response times. During the year we spent £1.4 billion acquiring spectrum in Italy, Spain, Greece, Portugal and Hungary. 2) Enterprise and total communications The enterprise market, where Vodafone is already a leading player, offers attractive growth opportunities. Multinationals and smaller companies alike are looking not only to manage costs but also to move to converged platforms and improve mobile connectivity and productivity for their workforces – making the choice of a mobile telecoms provider an increasingly strategic one. Group enterprise revenue growth was 2.2%* and represented 23% of our overall service revenue. Within this, Vodafone Global Enterprise, which serves our largest multinational customers, achieved revenue growth of 11%, driven by customer wins and increased penetration of existing accounts. Our broad geographical footprint, further extended through our partner market agreements, is a key differentiator for multinational accounts. At the other end of the scale, Vodafone One Net, our converged voice proposition targeted at small-to-medium-sized businesses, is now live in six countries with over two million end users – with over half a million new users this year. 3) Emerging markets Emerging markets offer long-term growth potential for mobile operators. Voice penetration, though already high, still has further scope to grow and has been a key enabler of development and economic growth. Data remains in its infancy in most emerging markets, but we expect most customers’ experience of the internet to be entirely mobile given the relative lack of fixed line infrastructure. Finally, the prospects for strong GDP growth over the longer term is supportive of increased consumer wealth and spending. Our major emerging markets operations, Vodacom, India and Turkey, saw organic service revenue growth of 7.1%*, 19.5%* and 25.1%* respectively year-on-year. We expect these and our other emerging markets to represent an increasing proportion of our revenue, profit and cash flow in the coming years.

CHIEF EXECUTIVE’S STATEMENT
5
4) New services Machine-to-machine (‘M2M’) platforms, mobile commerce and operator billing, among other new services, all offer potential for incremental growth. We made good progress in all these areas in the last 12 months. Growth in M2M, driven by the automotive and utilities sectors, has been strong, with M2M SIMs growing from 5.3 million to 7.8 million year-on-year. In mobile commerce, we continued to expand M-Pesa, our mobile money transfer service. Total active users now number 14.4 million, and the service is established in six markets. During the year we launched a trial in Rajasthan in India, with a view to a full launch in the 2012/13 financial year. Operator billing allows customers to pay for mobile applications and other goods and services using their Vodafone monthly phone bill. During the year, we were the first to launch the service in Europe for the Android market, and it is also available on the Nokia and Blackberry platforms. 5) Liquidity or cash flow from our non-controlled interests In the 2011 financial year we realised £7.2 billion from the sale of our stake in China Mobile Limited and our interests in SoftBank. This strong progress continued in the 2012 financial year with the sale of our 44% holding in SFR, the French operator, for £6.8 billion, and our 24.4% interest in Polkomtel, the Polish operator, for £0.8 billion. Furthermore, VZW paid an income dividend of US$10 billion, of which our 45% interest equated to US$4.5 billion (£2.9 billion). As a result of these developments, we have now sold all our significant non-controlled interests apart from VZW, where we believe future prospects for value creation and cash generation remain strong. 6) Disciplined capital allocation Our capital allocation strategy aims to balance a strong balance sheet and low financing costs with a consistent level of reinvestment into the business and attractive shareholder remuneration. During the year we maintained our low single A credit rating while at the same time investing £6.4 billion in capital expenditure to continue to deliver on our network strategy. Our returns to shareholders have been exceptional this year. From the proceeds from our recent disposals we have committed a total of £6.8 billion to share buybacks, which we expect to complete within the next few weeks. In addition, we paid a special dividend of 4.0 pence per share from the VZW income dividend, on top of the regular dividend of 9.52 pence. Over the last four years we have returned a total of £25.9 billion in cash to shareholders – equivalent to approximately 30% of our market capitalisation as at 31 March 2012. Prospects for the 2013 financial year Vodafone is well positioned for the coming year. We have continued to gain revenue share in many of our markets, as we lead the migration to smartphones and the adoption of data services by the mass market. Our exposure to the enterprise segment and our emerging market assets will continue to be strategic drivers of our performance and, with VZW set for another strong year, our overall geographical exposure is a positive differentiator. We have a strong balance sheet and will continue our major focus on shareholder remuneration, while reinvesting substantially in our network to enhance the customer experience. Nevertheless, the environment in Europe is set to remain very difficult. Weak consumer demand from poor macroeconomic conditions, a harsh regulatory backdrop and ongoing competition create material barriers to growth. MTRs alone will have a negative impact, similar in percentage terms to the 2012 financial year, on service revenue growth in the 2013 financial year. On an underlying basis, excluding foreign exchange rate movements, we expect growth in adjusted operating profit, and stability in free cash flow, compared with the 2012 financial year. Adjusted operating profit is expected to be in the range of £11.1 billion to £11.9 billion. We anticipate free cash flow for the coming year of £5.3 billion to £5.8 billion. The loss of dividends from SFR following the sale of our 44% stake, as well as a weaker euro year-on-year, are the main differences from the 2012 financial year. We expect capital expenditure to remain broadly steady on a constant currency basis. We expect the Group EBITDA margin decline to continue its improving trend, supported by continued strong growth and operating leverage in our AMAP region, and improving control of commercial costs in Europe. We remain committed to continuing to deliver a good return to our shareholders through the achievement of our targets for free cash flow and dividend growth; our focused investment in profitable growth areas; and our ongoing capital discipline.

GROUP FINANCIAL HIGHLIGHTS
6
2012 2011 % change Page £m £m Reported Organic
Financial information1 Revenue 23 46,417 45,884 1.2 2.2 Operating profit 23 11,187 5,596 99.9
Profit before taxation 23 9,549 9,498 0.5
Profit for the financial year 23 7,003 7,870 (11.0)
Basic earnings per share (pence) 23 13.74p 15.20p (9.6)
Capital expenditure 18 6,365 6,219 2.3
Cash generated by operations 18 14,824 15,392 (3.7)
Performance reporting1 2 Group EBITDA 8 14,475 14,670 (1.3) (0.6) Group EBITDA margin 31.2% 32.0% (0.8pp) (0.9pp) Adjusted operating profit 8, 31 11,532 11,818 (2.4) 2.5 Adjusted profit before tax 10, 31 9,918 11,003 (9.9)
Adjusted effective tax rate 10 25.3% 24.5%
Adjusted profit attributable to equity shareholders 10, 31 7,550 8,776 (14.0)
Adjusted earnings per share (pence) 10, 31 14.91p 16.75p (11.0)
Free cash flow3 18 6,105 7,049 (13.4)
Net debt 18, 19 24,425 29,858 (18.2)
Notes: 1 Amounts presented at 31 March or for the year then ended. 2 See page 28 for “Use of non-GAAP financial information” and page 33 for “Definitions of terms”. 3 All references to free cash flow are to amounts before licence and spectrum payments. For the year ended 31 March 2012, payments in
respect of a tax case settlement, tax relating to the disposal of our 24.4% interest in Polkomtel, income dividend received from VZW in January 2012 and the return of a court deposit made in respect of the India tax case are also excluded. For the year ended 31 March 2011, other items excluded included tax relating to the disposal of China Mobile Limited, payments in respect of a tax case settlement, proceeds from the SoftBank disposal and a court deposit made in respect of the India tax case.
GUIDANCE
7
Please see page 28 for “Use of non-GAAP financial information”, page 33 for “Definitions of terms” and page 34 for “Forward-looking statements”.
Performance against 2012 financial year guidance
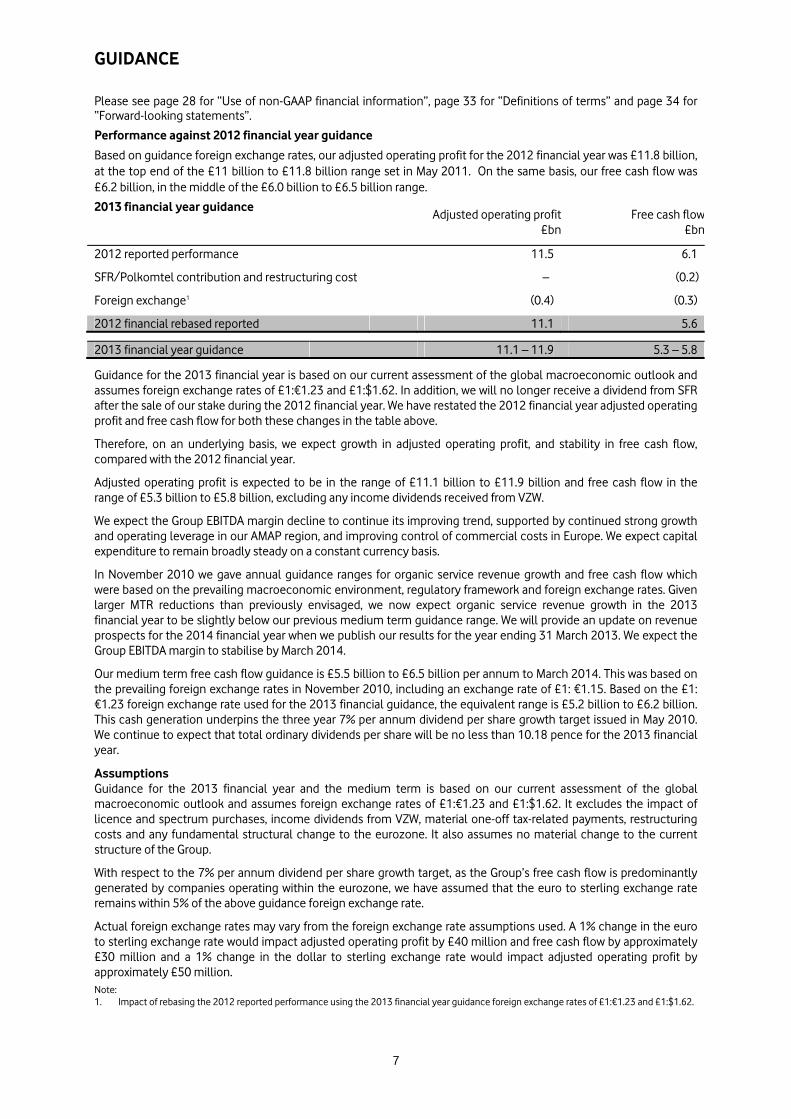
Based on guidance foreign exchange rates, our adjusted operating profit for the 2012 financial year was £11.8 billion, at the top end of the £11 billion to £11.8 billion range set in May 2011. On the same basis, our free cash flow was £6.2 billion, in the middle of the £6.0 billion to £6.5 billion range.
2013 financial year guidance Adjusted operating profit
£bnFree cash flow
£bn
2012 reported performance 11.5 6.1
SFR/Polkomtel contribution and restructuring cost – (0.2)
Foreign exchange1 (0.4) (0.3)
2012 financial rebased reported 11.1 5.6 2013 financial year guidance 11.1 – 11.9 5.3 – 5.8 Guidance for the 2013 financial year is based on our current assessment of the global macroeconomic outlook and assumes foreign exchange rates of £1:€1.23 and £1:$1.62. In addition, we will no longer receive a dividend from SFR after the sale of our stake during the 2012 financial year. We have restated the 2012 financial year adjusted operating profit and free cash flow for both these changes in the table above.
Therefore, on an underlying basis, we expect growth in adjusted operating profit, and stability in free cash flow, compared with the 2012 financial year.
Adjusted operating profit is expected to be in the range of £11.1 billion to £11.9 billion and free cash flow in the range of £5.3 billion to £5.8 billion, excluding any income dividends received from VZW. We expect the Group EBITDA margin decline to continue its improving trend, supported by continued strong growth and operating leverage in our AMAP region, and improving control of commercial costs in Europe. We expect capital expenditure to remain broadly steady on a constant currency basis. In November 2010 we gave annual guidance ranges for organic service revenue growth and free cash flow which were based on the prevailing macroeconomic environment, regulatory framework and foreign exchange rates. Given larger MTR reductions than previously envisaged, we now expect organic service revenue growth in the 2013 financial year to be slightly below our previous medium term guidance range. We will provide an update on revenue prospects for the 2014 financial year when we publish our results for the year ending 31 March 2013. We expect the Group EBITDA margin to stabilise by March 2014. Our medium term free cash flow guidance is £5.5 billion to £6.5 billion per annum to March 2014. This was based on the prevailing foreign exchange rates in November 2010, including an exchange rate of £1: €1.15. Based on the £1: €1.23 foreign exchange rate used for the 2013 financial guidance, the equivalent range is £5.2 billion to £6.2 billion. This cash generation underpins the three year 7% per annum dividend per share growth target issued in May 2010. We continue to expect that total ordinary dividends per share will be no less than 10.18 pence for the 2013 financial year. Assumptions Guidance for the 2013 financial year and the medium term is based on our current assessment of the global macroeconomic outlook and assumes foreign exchange rates of £1:€1.23 and £1:$1.62. It excludes the impact of licence and spectrum purchases, income dividends from VZW, material one-off tax-related payments, restructuring costs and any fundamental structural change to the eurozone. It also assumes no material change to the current structure of the Group. With respect to the 7% per annum dividend per share growth target, as the Group’s free cash flow is predominantly generated by companies operating within the eurozone, we have assumed that the euro to sterling exchange rate remains within 5% of the above guidance foreign exchange rate. Actual foreign exchange rates may vary from the foreign exchange rate assumptions used. A 1% change in the euro to sterling exchange rate would impact adjusted operating profit by £40 million and free cash flow by approximately £30 million and a 1% change in the dollar to sterling exchange rate would impact adjusted operating profit by approximately £50 million. Note: 1. Impact of rebasing the 2012 reported performance using the 2013 financial year guidance foreign exchange rates of £1:€1.23 and £1:$1.62.

CONTENTS
8
Page Financial results 8 Liquidity and capital resources 18 Other significant developments 22 Consolidated financial statements 23 Use of non-GAAP financial information 28 Additional information 29 Other information (including forward-looking statements) 33
FINANCIAL RESULTS Group1
Africa,
Middle East and Asia
Non-Controlled
Interests and Common
Europe
Pacific Functions2 Eliminations 2012 2011 % change
£m £m £m £m £m £m £ Organic Voice revenue 16,445 9,074 175 – 25,694 27,213 Messaging revenue 4,310 931 35 – 5,276 5,082 Data revenue 4,690 1,520 23 – 6,233 5,122 Fixed line revenue 3,178 440 – – 3,618 3,402 Other service revenue 1,291 786 39 (52) 2,064 1,919 Service revenue 29,914 12,751 272 (52) 42,885 42,738 0.3 1.5 Other revenue 2,267 1,117 151 (3) 3,532 3,146 Revenue 32,181 13,868 423 (55) 46,417 45,884 1.2 2.2 Direct costs (7,589) (3,661) (74) 52 (11,272) (11,322) Customer costs3 (7,192) (2,289) (37) – (9,518) (8,951) Operating expenses 3 (6,955) (3,803) (397) 3 (11,152) (10,941) EBITDA 10,445 4,115 (85) – 14,475 14,670 (1.3) (0.6) Depreciation and amortisation:
Acquired intangibles (96) (736) (3) – (835) (1,106)
Purchased licences (1,100) (201) (1) – (1,302) (1,177)
Other (3,992) (1,742) (35) – (5,769) (5,684) Share of result in associates 3 36 4,924 – 4,963 5,115 Adjusted operating profit 5,260 1,472 4,800 – 11,532 11,818 (2.4) 2.5
Impairment loss (4,050) (6,150)
Other income and expense4 3,705 (72)
Operating profit 11,187 5,596
Non-operating income and expense5
(162) 3,022 Net (financing costs)/investment income
(1,476) 880
Income tax expense (2,546) (1,628)
Profit for the financial year 7,003 7,870
Notes: 1 Current year results reflect average foreign exchange rates of £1:€1.16 and £1:US$1.60. 2 Common Functions primarily represent the results of the partner markets and the net result of unallocated central Group costs. 3 Commercial operating expenses have been reallocated from customer costs to operating expenses. The prior year comparatives have been restated. 4 Other income/(expense) for the year ended 31 March 2012 includes a £3,419 million gain on disposal of the Group’s 44% interest in SFR and a £296 million gain
on disposal of the Group’s 24.4% interest in Polkomtel. The year ended 31 March 2011 included £56 million representing the net loss on disposal of certain Alltel investments by VZW. This is included within the line item “Share of results in associates” in the consolidated income statement.
5 Non-operating (expense)/income for the year ended 31 March 2011 included £3,019 million profit arising on the sale of the Group’s 3.2% interest in China Mobile Limited.

FINANCIAL RESULTS
9
Revenue
Group revenue was up 1.2% to £46.4 billion, with service revenue of £42.9 billion, an increase of 1.5%* on an organic basis. Our overall performance reflects continued strong demand for data services and further voice penetration growth in emerging markets, offset by regulatory changes, on-going competitive pressures and challenging macro economic conditions in a number of our mature markets. As a result of the leap year, service revenue growth of 2.3%* in Q4 benefited from the additional day by around 1 percentage point. AMAP service revenue was up by 8.0%*, with a strong performance in India, Qatar, Ghana and Vodacom and a return to growth in Egypt offset by a decline in Australia. In Europe, service revenue was down by 1.1%* reflecting challenging macroeconomic conditions in Southern Europe partially offset by growth in Germany, the UK, the Netherlands and Turkey.
EBITDA and profit
Group EBITDA was down 1.3% to £14.5 billion, as revenue growth was offset by higher customer investment due to increased smartphone penetration. Adjusted operating profit was down 2.4% to £11.5 billion, driven by a reduction in our share of profits from associates following the disposal of our 44% interest in SFR in June 2011. Our share of profits of VZW grew by 9.3%* to £4.9 billion. Operating profit increased by 100% to £11.2 billion, primarily due to the gain on disposal of the Group’s 44% interest in SFR and 24.4% interest in Polkomtel, and lower impairment losses compared to the prior year. An impairment loss of £4.0 billion was recorded in relation to Italy, Spain, Portugal and Greece, primarily driven by lower projected cash flows within business plans and an increase in discount rates, resulting from adverse changes in the economic environment. Net (financing costs)/investment income 2012 2011 £m £m Investment income 456 1,309 Financing costs (1,932) (429) Net (financing costs)/investment income (1,476) 880 Analysed as: Net financing costs before income from investments (1,642) (852) Potential interest charges arising on settlement of outstanding tax issues1 9 (46) Income from investments 19 83 (1,614) (815) Foreign exchange2 138 256 Equity put rights and similar arrangements3 – 95 Interest related to the settlement of tax cases – 872 Disposal of SoftBank Mobile Corp. financial instruments – 472 (1,476) 880
Notes: 1 Excluding interest credits related to a tax case settlement. 2 Comprises foreign exchange rate differences reflected in the income statement in relation to certain intercompany balances and the foreign exchange rate differences on financial instruments received as consideration on the disposal of Vodafone Japan to SoftBank in April 2006. 3 Includes foreign exchange rate movements, accretion expense and fair value charges. Net financing costs before income from investments increased from £852 million to £1,642 million, primarily due to the decision to increase the fixed rate debt mix, which is expected to result in lower interest in future periods, and the subsequent recognition of mark-to-market losses. Income from investments decreased by £64 million as a result of the disposal of the Group’s 3.2% interest in China Mobile Limited and the Group’s interests in SoftBank Mobile Corp. Limited during the 2011 financial year.

FINANCIAL RESULTS
10
Taxation 2012 2011 £m £m Income tax expense 2,546 1,628 Tax on adjustments to derive adjusted profit before tax (242) (232) Tax benefit related to settlement of tax cases – 929 Adjusted income tax expense 2,304 2,325 Share of associates’ tax 302 519 Adjusted income tax expense for purposes of calculating adjusted tax rate 2,606 2,844 Profit before tax 9,549 9,498 Adjustments to derive adjusted profit before tax1 369 1,505 Adjusted profit before tax 9,918 11,003 Add: Share of associates’ tax and non-controlling interest 382 604 Adjusted profit before tax for the purpose of calculating adjusted effective tax rate 10,300 11,607 Adjusted effective tax rate 25.3% 24.5%
Note: 1 See “Earnings per share” below.
The adjusted effective tax rate for the year ending 31 March 2012 was 25.3%. This is in line with our mid 20s adjusted effective tax rate guidance range. The Group’s share of associates’ tax declined due to the absence of the tax related to SFR following the disposal of our 44% interest in June 2011. Income tax expense has increased in the year ended 31 March 2012 largely due to the favourable impact of a tax settlement in the 2011 financial year. Earnings per share
Adjusted earnings per share was 14.91 pence, a decline of 11.0% year-on-year, reflecting the loss of our 44% interest in SFR and Polkomtel’s profits, the loss of interest income from investment disposals and mark-to-market items charged through finance costs, partially offset by a reduction in shares arising from the Group’s share buyback programme. Basic earnings per share was 13.74 pence (2011: 15.20 pence), reflecting the profit on disposal of our 44% interest in SFR and 24.4% interest in Polkomtel and lower impairment charges compared to the prior financial year, all of which are excluded from adjusted earnings per share. 2012 2011 £m £m Profit attributable to equity shareholders 6,957 7,968 Pre-tax adjustments: Impairment loss1 4,050 6,150 Other income and expense1 2 (3,705) 72 Non-operating income and expense1 3 162 (3,022) Investment income and financing costs4 (138) (1,695) 369 1,505 Taxation1 242 (697) Non-controlling interests (18) – Adjusted profit attributable to equity shareholders 7,550 8,776 Million Million Weighted average number of shares outstanding – basic 50,644 52,408 Weighted average number of shares outstanding – diluted 50,958 52,748
Notes: 1 Taxation for the 2012 financial year includes a £206 million charge in respect of the disposal of the Group’s 24.4% interest in Polkomtel. The
2011 financial year included £929 million credit in respect of a tax settlement and a £208 million charge in respect of the disposal of the Group’s 3.2% interest in China Mobile. The impairment charges of £4,050 million and £6,150 million in the 2012 and 2011 financial years respectively do not result in any tax consequences. The disposal of our 44% interest in SFR did not give rise to a tax charge.
2 Other income and expense for the 2012 financial year includes a £3,419 million gain on disposal of the Group’s 44% interest in SFR and a £296 million gain on disposal of the Group’s 24.4% interest in Polkomtel. The 2011 financial year includes £56 million representing the net loss on disposal of certain Alltel investments by Verizon Wireless. This is included within the line item “Share of results in associates” in the consolidated income statement.
3 Non-operating income and expense for the 2011 financial year includes £3,019 million profit arising on the sale of the Group’s 3.2% interest in China Mobile Limited.
4 See notes 2 and 3 in ”Net (financing costs)/investment income” on page 9.

FINANCIAL RESULTS
11
Europe Germany
Italy Spain UK Other Eliminations Europe % change
£m £m £m £m £m £m £m £ Organic 31 March 2012 Voice revenue 3,116 2,981 2,895 2,395 5,058 – 16,445 Messaging revenue 906 851 284 1,259 1,010 – 4,310 Data revenue 1,536 713 646 872 923 – 4,690 Fixed line revenue 1,849 620 342 45 322 – 3,178 Other service revenue 262 164 190 425 467 (217) 1,291 Service revenue 7,669 5,329 4,357 4,996 7,780 (217) 29,914 (0.6) (1.1) Other revenue 564 329 406 401 572 (5) 2,267 Revenue 8,233 5,658 4,763 5,397 8,352 (222) 32,181 0.5 (0.1) Direct costs (1,781) (1,248) (1,006) (1,473) (2,298) 217 (7,589) Customer costs1 (1,803) (788) (1,570) (1,576) (1,460) 5 (7,192) Operating expenses1 (1,684) (1,108) (994) (1,054) (2,115) – (6,955) EBITDA 2,965 2,514 1,193 1,294 2,479 – 10,445 (3.5) (4.5) Depreciation and amortisation:
Acquired intangibles – – – (4) (92) – (96) Purchased licences (519) (106) (9) (331) (135) – (1,100) Other (955) (673) (618) (557) (1,189) – (3,992) Share of result in associates – – – – 3 – 3 Adjusted operating profit 1,491 1,735 566 402 1,066 – 5,260 (8.1) (9.6)
EBITDA margin 36.0% 44.4% 25.0% 24.0% 29.7% 32.5%
31 March 2011 Voice revenue 3,466 3,237 3,319 2,545 5,318 (1) 17,884 Messaging revenue 790 849 345 1,148 974 – 4,106 Data revenue 1,250 602 537 762 720 – 3,871 Fixed line revenue 1,813 574 314 31 271 – 3,003 Other service revenue 152 170 220 445 504 (258) 1,233 Service revenue 7,471 5,432 4,735 4,931 7,787 (259) 30,097 Other revenue 429 290 398 340 466 (5) 1,918 Revenue 7,900 5,722 5,133 5,271 8,253 (264) 32,015 Direct costs (1,729) (1,305) (1,050) (1,548) (2,398) 259 (7,771) Customer costs1 (1,684) (695) (1,555) (1,460) (1,374) 5 (6,763) Operating expenses1 (1,535) (1,079) (966) (1,030) (2,048) – (6,658) EBITDA 2,952 2,643 1,562 1,233 2,433 – 10,823 Depreciation and amortisation:
Acquired intangibles – – (1) – (127) – (128) Purchased licences (472) (102) (7) (333) (136) – (1,050) Other (932) (638) (639) (552) (1,158) – (3,919) Adjusted operating profit 1,548 1,903 915 348 1,012 – 5,726
EBITDA margin 37.4% 46.2% 30.4% 23.4% 29.5% – 33.8%
Change at constant exchange rates % % % % % Voice revenue (11.6) (9.5) (14.2) (5.9) (3.1) Messaging revenue 12.9 (1.3) (19.0) 9.7 5.6 Data revenue 21.3 16.8 18.4 14.4 28.7 Fixed line revenue 0.4 6.6 7.3 45.2 20.6 Other service revenue 70.2 (4.2) (15.1) (4.5) (7.1) Service revenue 1.1 (3.4) (9.5) 1.3 1.5 Other revenue 30.5 12.9 0.7 17.9 23.3 Revenue 2.7 (2.6) (8.7) 2.4 2.7 Direct costs (1.3) 5.8 5.8 (4.8) 1.4 Customer costs1 (5.8) (12.0) 0.4 7.9 (7.7) Operating expenses1 (8.0) (1.1) (1.3) 2.3 (5.6) EBITDA (1.1) (6.4) (25.1) 4.9 1.6 Depreciation and amortisation:
Acquired intangibles – – – Nm 23.8 Purchased licences (8.3) (1.9) (25.7) (0.6) (0.7) Other (1.1) (4.1) 4.8 0.9 (4.0) Share of result in associates – – – – Nm Adjusted operating profit (5.2) (10.4) (39.5) 15.5 2.4
EBITDA margin movement (pps) (1.4) (1.8) (5.5) 0.6 (0.3)
Note: 1 Commercial operating expenses have been reallocated from customer costs to operating expenses. The prior year comparatives have been updated to reflect
the change.

FINANCIAL RESULTS
12
Revenue increased by 0.5% including a 0.5 percentage point impact from favourable foreign exchange rate movements. On an organic basis service revenue declined by 1.1%* primarily due to the impact of MTR cuts, competitive pricing pressures and continued economic weakness, partially offset by growth in data revenue. Growth in the UK, Germany, the Netherlands and Turkey was offset by declines in most other markets, in particular, Italy, Spain and Greece. EBITDA declined by 3.5%, including a 1.1 percentage point favourable impact from foreign exchange rate movements. On an organic basis EBITDA decreased by 4.5%*, resulting from higher customer investment due to the increased penetration of smartphones, and a reduction in service revenue in most markets, partially offset by direct cost efficiencies. Organic Other Foreign Reported change activity1 exchange change % pps pps % Revenue – Europe (0.1) 0.1 0.5 0.5 Service revenue Germany 1.2 (0.1) 1.6 2.7 Italy (3.4) – 1.5 (1.9) Spain (9.4) (0.1) 1.5 (8.0) UK 1.6 (0.3) – 1.3 Other Europe 1.7 (0.2) (1.6) (0.1) Europe (1.1) – 0.5 (0.6) EBITDA Germany (1.1) – 1.5 0.4 Italy (6.4) – 1.5 (4.9) Spain (24.9) (0.2) 1.5 (23.6) UK 5.0 (0.1) – 4.9 Other Europe 1.7 (0.1) 0.3 1.9 Europe (4.5) (0.1) 1.1 (3.5) Adjusted operating profit Germany (5.3) 0.1 1.5 (3.7) Italy (10.4) – 1.6 (8.8) Spain (39.2) (0.3) 1.4 (38.1) UK 15.7 (0.2) – 15.5 Other Europe 3.0 (0.6) 2.9 5.3 Europe (9.6) (0.2) 1.7 (8.1) Note: 1 ‘Other activity’ includes the impact of M&A activity and the revision to intra-group roaming charges from 1 October 2012 (see page 33). Germany Service revenue increased by 1.2%* as strong growth in data and enterprise revenue more than offset the impact of an MTR cut effective from 1 December 2010 and increasing competitive pressures. Data revenue grew by 21.3%* driven by a higher penetration of smartphones, an increase in those sold with a data bundle and the launch of prepaid integrated tariffs. Enterprise revenue grew by 5.6%* driven by significant customer wins and the success of converged service offerings. A number of innovative products were launched during the second half of the 2012 financial year, including OfficeNet, a cloud based solution. The roll out of LTE has continued, following the launch of services in the prior financial year. Nearly 2,700 base stations had been upgraded to LTE at 31 March 2012, providing approximately 35% household coverage. EBITDA declined by 1.1%* as the higher revenue was offset by restructuring costs and regulation changes. Italy Service revenue declined by 3.4%* as a result of weak economic conditions, intense competition and the impact of an MTR cut effective from 1 July 2011. Strong data revenue growth of 16.8%* was driven by mobile internet which benefited from a higher penetration of smartphones and an increase in those sold with a data bundle. From Q3, all new consumer contract customers are now on an integrated tariff. Enterprise revenue grew by 5.1%* with a strong contribution from Vodafone One Net, a converged fixed and mobile solution, and growth in the customer base. Fixed line growth benefited from strong customer additions although slowed in Q4 due to intense competition.

FINANCIAL RESULTS
13
EBITDA decreased by 6.4%*, and EBITDA margin fell by 1.9* percentage points resulting from the decline in service revenue partially offset by operating cost efficiencies such as site sharing agreements and outsourcing of network maintenance to Ericsson. Spain Service revenue declined by 9.4%*, impacted by intense competition, continuing economic weakness and high unemployment during the year, which have driven customers to reduce or optimise their spend on tariffs. Data revenue increased by 18.4%*, benefiting from the penetration of integrated voice, SMS and data tariffs initially launched in October 2010. Improvements were seen in fixed line revenue which increased by 7.3%*, resulting from a competitive proposition leading to good customer additions. Mobile customer net additions were strong as a result of our more competitive tariffs and a focus on improving the retention of higher-value customers. EBITDA declined by 24.9%*, with a 5.5* percentage point fall in EBITDA margin, primarily due to lower revenue with sustained investment in acquisition and retention costs. This was partially offset by operating cost efficiencies. UK Service revenue increased by 1.6%* driven by an increase in data and consumer contract revenue supported by the success of integrated offerings. This was partially offset by the impact of an MTR cut effective from 1 April 2011 and lower consumer confidence leading to reduced out-of-bundle usage. Data revenue grew by 14.5%* due to higher penetration of smartphones and an increase in those sold with a data bundle. EBITDA increased by 5.0%*, and EBITDA margin improved by 0.6* percentage points due to a number of cost saving initiatives, including acquisition and retention efficiencies. Other Europe Service revenue increased by 1.7%* as growth in Albania, Malta, the Netherlands and Turkey more than offset a decline in the rest of the region, particularly in Greece, Portugal and Ireland, which continued to be impacted by the challenging macroeconomic environment and competitive factors. Service revenue in Turkey grew by 25.1%*, driven by strong growth in consumer contract and data revenue resulting from an expanding contract customer base and the launch of innovative propositions. In the Netherlands service revenue increased by 2.1%*, driven by an increase in the customer base, partially offset by MTR cuts, price competition and customers optimising tariffs. EBITDA grew by 1.7%*, with strong growth in Turkey, driven by a combination of service revenue growth and cost efficiencies, partially offset by declines in the majority of the other markets.
FINANCIAL RESULTS
14
Africa, Middle East and Asia Pacific
India
Vodacom
Other Africa,
Middle East and
Asia Pacific Eliminations
Africa, Middle East
and Asia Pacific % change
£m £m £m £m £ Organic 31 March 2012 Voice revenue 3,253 3,452 2,369 – 9,074 Messaging revenue 207 289 435 – 931 Data revenue 347 690 483 – 1,520 Fixed line revenue 15 225 200 – 440 Other service revenue 393 252 141 – 786 Service revenue 4,215 4,908 3,628 – 12,751 3.7 8.0 Other revenue 50 730 337 – 1,117 Revenue 4,265 5,638 3,965 – 13,868 4.2 8.4 Direct costs (1,303) (1,152) (1,206) – (3,661) Customer costs1 (226) (1,396) (667) – (2,289) Operating expenses1 (1,614) (1,160) (1,029) – (3,803) EBITDA 1,122 1,930 1,063 – 4,115 2.9 7.8 Depreciation and amortisation:
Acquired intangibles (331) (358) (47) – (736) Purchased licences (85) (1) (115) – (201) Other (646) (487) (609) – (1,742) Share of result in associates – – 36 – 36 Adjusted operating profit 60 1,084 328 – 1,472 15.7 22.4
EBITDA margin 26.3% 34.2% 26.8% 29.7%
31 March 2011 Voice revenue 3,041 3,528 2,467 – 9,036 Messaging revenue 171 285 448 – 904 Data revenue 247 577 392 – 1,216 Fixed line revenue 7 216 176 – 399 Other service revenue 338 233 167 (1) 737 Service revenue 3,804 4,839 3,650 (1) 12,292 Other revenue 51 640 321 – 1,012 Revenue 3,855 5,479 3,971 (1) 13,304 Direct costs (1,114) (1,168) (1,202) 1 (3,483) Customer costs1 (185) (1,303) (617) – (2,105) Operating expenses1 (1,571) (1,164) (982) – (3,717) EBITDA 985 1,844 1,170 – 3,999 Depreciation and amortisation:
Acquired intangibles (357) (554) (55) – (966) Purchased licences (5) – (117) – (122) Other (608) (463) (619) – (1,690) Share of result in associates – – 51 – 51 Adjusted operating profit 15 827 430 – 1,272
EBITDA margin 25.6% 33.7% 29.5% 30.1%
Change at constant exchange rates % % % Voice revenue 15.4 3.4 (4.3) Messaging revenue 30.2 6.6 (7.9) Data revenue 51.3 27.7 18.5 Fixed line revenue 128.8 6.1 15.0 Other service revenue 25.2 14.0 (16.0) Service revenue 19.4 7.1 (1.9) Other revenue 4.1 21.1 1.1 Revenue 19.2 8.7 (1.7) Direct costs (26.1) (3.3) 0.7 Customer costs1 (31.8) (13.9) (2.6) Operating expenses1 (10.7) (4.7) (3.4) EBITDA 22.7 11.3 (9.2) Depreciation and amortisation:
Acquired intangibles – 31.9 16.5 Purchased licences Nm Nm 0.2 Other (14.4) (10.6) 2.0 Share of result in associates – Nm (21.0) Adjusted operating profit 348.7 41.1 (22.6)
EBITDA margin movement (pps)
0.7 0.8 (2.3)
Note: 1 Commercial operating expenses have been reallocated from customer costs to operating expenses. The prior year comparatives have been
updated to reflect the change.
FINANCIAL RESULTS
15
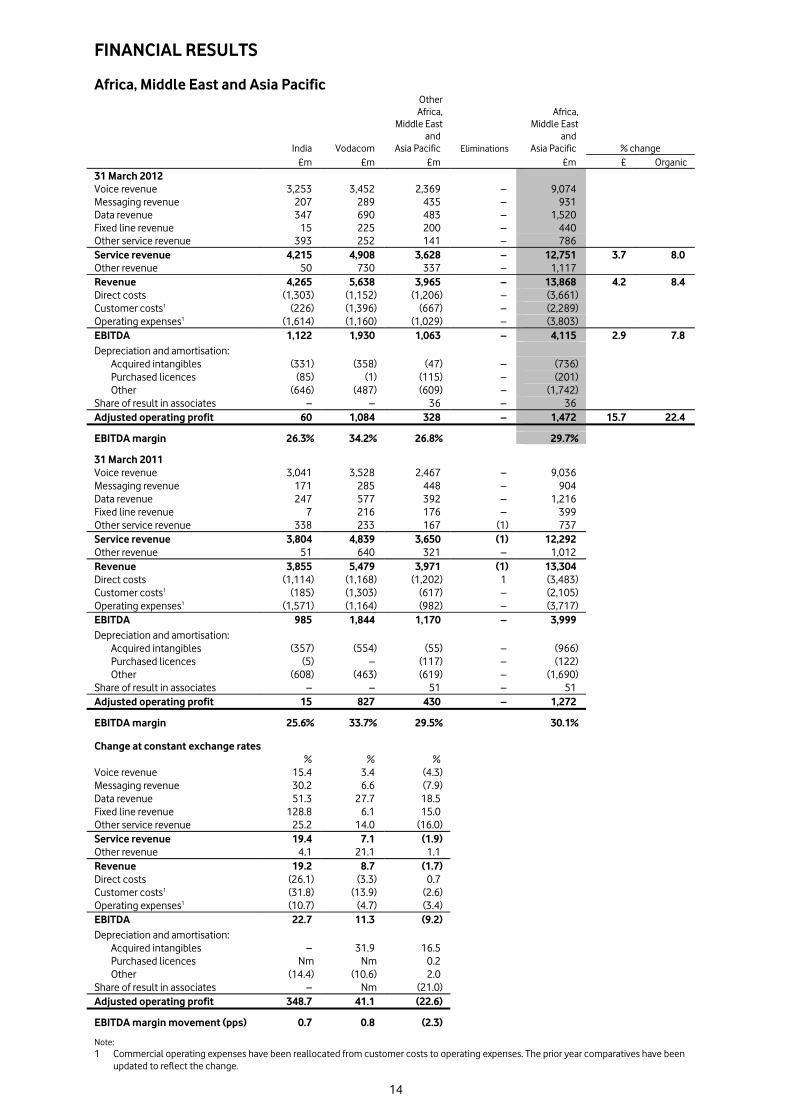
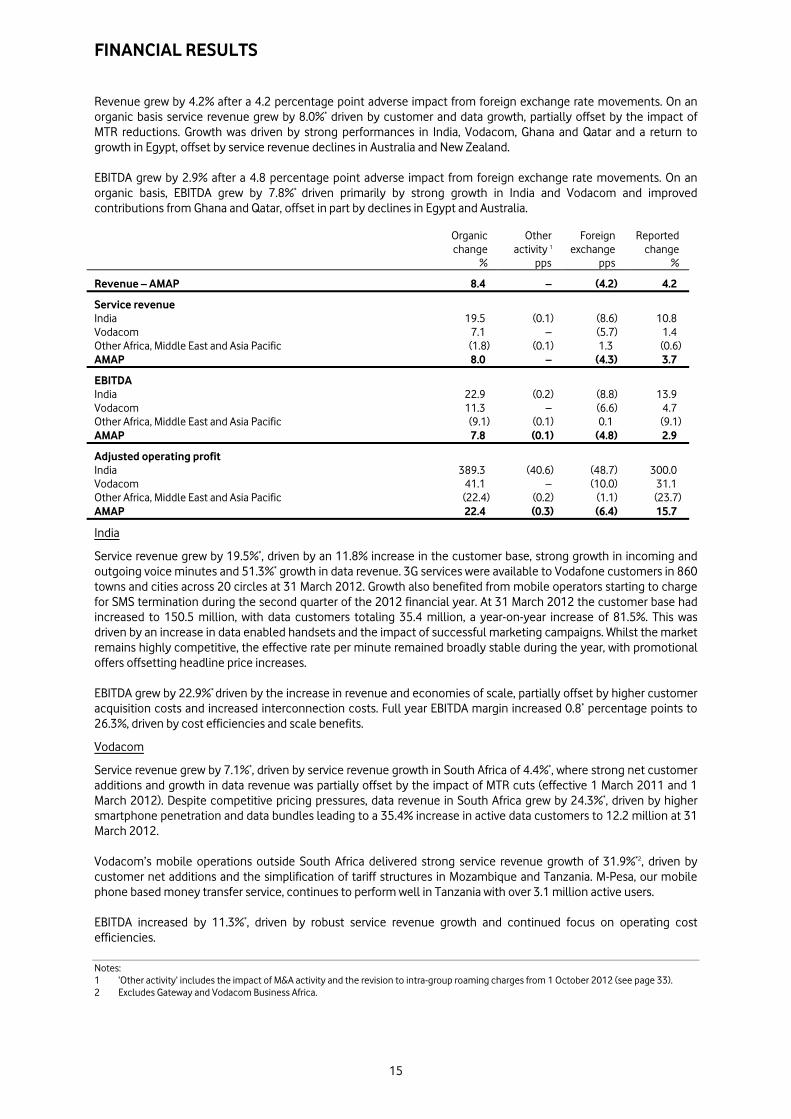
Revenue grew by 4.2% after a 4.2 percentage point adverse impact from foreign exchange rate movements. On an organic basis service revenue grew by 8.0%* driven by customer and data growth, partially offset by the impact of MTR reductions. Growth was driven by strong performances in India, Vodacom, Ghana and Qatar and a return to growth in Egypt, offset by service revenue declines in Australia and New Zealand. EBITDA grew by 2.9% after a 4.8 percentage point adverse impact from foreign exchange rate movements. On an organic basis, EBITDA grew by 7.8%* driven primarily by strong growth in India and Vodacom and improved contributions from Ghana and Qatar, offset in part by declines in Egypt and Australia. Organic Other Foreign Reported change activity 1 exchange change % pps pps % Revenue – AMAP 8.4 – (4.2) 4.2 Service revenue India 19.5 (0.1) (8.6) 10.8 Vodacom 7.1 – (5.7) 1.4 Other Africa, Middle East and Asia Pacific (1.8) (0.1) 1.3 (0.6) AMAP 8.0 – (4.3) 3.7 EBITDA India 22.9 (0.2) (8.8) 13.9 Vodacom 11.3 – (6.6) 4.7 Other Africa, Middle East and Asia Pacific (9.1) (0.1) 0.1 (9.1) AMAP 7.8 (0.1) (4.8) 2.9 Adjusted operating profit India 389.3 (40.6) (48.7) 300.0 Vodacom 41.1 – (10.0) 31.1 Other Africa, Middle East and Asia Pacific (22.4) (0.2) (1.1) (23.7) AMAP 22.4 (0.3) (6.4) 15.7 India Service revenue grew by 19.5%*, driven by an 11.8% increase in the customer base, strong growth in incoming and outgoing voice minutes and 51.3%* growth in data revenue. 3G services were available to Vodafone customers in 860 towns and cities across 20 circles at 31 March 2012. Growth also benefited from mobile operators starting to charge for SMS termination during the second quarter of the 2012 financial year. At 31 March 2012 the customer base had increased to 150.5 million, with data customers totaling 35.4 million, a year-on-year increase of 81.5%. This was driven by an increase in data enabled handsets and the impact of successful marketing campaigns. Whilst the market remains highly competitive, the effective rate per minute remained broadly stable during the year, with promotional offers offsetting headline price increases. EBITDA grew by 22.9%* driven by the increase in revenue and economies of scale, partially offset by higher customer acquisition costs and increased interconnection costs. Full year EBITDA margin increased 0.8* percentage points to 26.3%, driven by cost efficiencies and scale benefits.
Vodacom Service revenue grew by 7.1%*, driven by service revenue growth in South Africa of 4.4%*, where strong net customer additions and growth in data revenue was partially offset by the impact of MTR cuts (effective 1 March 2011 and 1 March 2012). Despite competitive pricing pressures, data revenue in South Africa grew by 24.3%*, driven by higher smartphone penetration and data bundles leading to a 35.4% increase in active data customers to 12.2 million at 31 March 2012. Vodacom’s mobile operations outside South Africa delivered strong service revenue growth of 31.9%*2, driven by customer net additions and the simplification of tariff structures in Mozambique and Tanzania. M-Pesa, our mobile phone based money transfer service, continues to perform well in Tanzania with over 3.1 million active users. EBITDA increased by 11.3%*, driven by robust service revenue growth and continued focus on operating cost efficiencies. Notes: 1 ‘Other activity’ includes the impact of M&A activity and the revision to intra-group roaming charges from 1 October 2012 (see page 33). 2 Excludes Gateway and Vodacom Business Africa.

FINANCIAL RESULTS
16
Other Africa, Middle East and Asia Pacific Organic service revenue, which now includes Australia, declined by 1.8%* with both New Zealand and Australia being impacted by MTR cuts effective from 6 May 2011 and 1 January 2012, respectively. In Australia, despite improvements in network and customer operations performance, service revenue declined by 8.8%* driven by the competitive market and weakness in brand perception following the network and customer service issues experienced from late 2010 to early 2011 and further accelerated by MTR cuts. On 22 March 2012, Vodafone Hutchison Australia appointed Bill Morrow as its new CEO. In Egypt service revenue was suppressed by the challenging economic and political environment, however, organic growth of 1.4%*, was achieved as a result of an increased customer base and strong data usage. In Qatar an increase in the customer base delivered service revenue growth of 27.1%*, despite a competitive pricing environment. Service revenue in Ghana grew by 29.2%* through strong gains in customer market share. EBITDA margin declined 2.2* percentage points, driven by the service revenue decline in Australia and the challenging economic and competitive environment in Egypt, partially offset by growth in Qatar and Ghana. Safaricom, Vodafone’s associate in Kenya, grew service revenue by 13.6%*, driven by increases in customer base, voice usage and M-Pesa activity. EBITDA margin improved in the second half of the 2012 financial year through a tariff increase in October, operating cost efficiencies and a strengthening of the local currency to take the margin for the 2012 financial year to 35.0%.

FINANCIAL RESULTS
17
Non-Controlled Interests Verizon Wireless1 2 3 2012 2011 % change £m £m £ Organic Service revenue 18,039 17,238 4.6 7.3 Revenue 20,187 18,711 7.9 10.6 EBITDA 7,689 7,313 5.1 7.9 Interest (212) (261) (18.8) Tax2 (287) (235) 22.1 Group’s share of result in VZW 4,867 4,569 6.5 9.3 KPIs (100% basis) Customers (’000)4 92,988 88,414 Average monthly ARPU (US$) 58.7 57.2 Churn 14.8% 16.3% Messaging and data as a percentage of service revenue 37.7% 32.9%
In the United States VZW reported 4.6 million net mobile customer additions bringing its closing mobile customer base to 93.0 million, up 5.2%. Service revenue growth of 7.3%* continues to be driven by the expanding customer base and robust growth in data ARPU driven by increased penetration of smartphones. EBITDA margin remained strong despite the competitive challenges and macroeconomic environment. Efficiencies in operating expenses and lower acquisition costs resulting from lower volumes have been partly offset by a higher level of customer retention costs reflecting the increased demand for smartphones. VZW’s net debt at 31 March 2012 totalled US$6.4 billion5 (31 March 2011: net debt US$9.8 billion5), after paying a dividend to its shareholders of US$10 billion on 31 January 2012.
Notes: 1 All amounts represent the Group’s share based on its 45% equity interest, unless otherwise stated. 2 The Group’s share of the tax attributable to VZW relates only to the corporate entities held by the VZW partnership and certain state taxes
which are levied on the partnership. The tax attributable to the Group’s share of the partnership’s pre-tax profit is included within the Group tax charge.
3 Organic growth rates include the impact of a non-cash revenue adjustment which was recorded to defer previously recognised data revenue that will be earned and recognised in future periods. Excluding this the equivalent organic growth rates for service revenue, revenue, EBITDA and the Group’s share of result in VZW would have been 6.8%*, 10.1%*, 6.7%* and 7.5%* respectively.
4 In order to align with the customer numbers reported externally by VZW, customers were restated to reflect retail customers only. Comparatives are presented on the revised basis.
5 Net debt excludes pending credit card receipts. Comparatives are presented on the comparable basis.

LIQUIDITY AND CAPITAL RESOURCES
18
Cash flows and funding 2012 2012 2011 2011 £m £m £m £m % EBITDA 14,475 14,670 (1.3) Working capital 206 566 Other 143 156 Cash generated by operations 14,824 15,392 (3.7) Cash capital expenditure1 (6,423) (5,658) Capital expenditure (6,365) (6,219) Working capital movement in respect of capital expenditure (58) 561 Disposal of property, plant and equipment 117 51 Operating free cash flow 8,518 9,785 (12.9) Taxation (1,969) (2,597) Dividends received from associates and investments2 1,171 1,509 Dividends paid to non-controlling shareholders in subsidiaries (304) (320) Interest received and paid (1,311) (1,328) Free cash flow 6,105 7,049 (13.4) Tax settlement3 (100) (800) Licence and spectrum payments (1,429) (2,982) Acquisitions and disposals4 4,872 (183) Equity dividends paid (6,643) (4,468) Purchase of treasury shares (3,583) (2,087) Foreign exchange 1,283 709 Income dividend from VZW 2,855 – Disposal of the Group's 3.2% interest in China Mobile Limited – 4,269 Disposal of the Group's SoftBank Mobile Corp. interests – 1,409 Other5 2,073 542 Net debt decrease 5,433 3,458 Opening net debt (29,858) (33,316) Closing net debt (24,425) (29,858) (18.2)
Notes: 1 Cash capital expenditure comprises the purchase of property, plant and equipment and intangible assets, other than licence and spectrum
payments, during the year. 2 Dividends received from associates and investments for the year ended 31 March 2012 includes £965 million (2011: £1,024 million) tax
distribution from the Group’s 45% interest in VZW and a final dividend of £178 million (2011: £383 million) from SFR prior to the completion of the disposal of the Group’s 44% interest. It does not include the £2,855 million income dividend from VZW received in January 2012.
3 Related to a tax settlement in the year ended 31 March 2011. 4 Acquisitions and disposals for the year ended 31 March 2012 primarily includes £6,805 million proceeds from the sale of the Group’s 44%
interest in SFR, £784 million proceeds from the sale of the Group’s 24.4% interest in Polkomtel and £2,592 million payment in relation to the purchase of non-controlling interests in Vodafone India.
5 Other for the year ended 31 March 2012 primarily includes £2,301 million movement in the written put options in relation to India and the return of a court deposit made in respect of the India tax case (£310 million). Other for the year ended 31 March 2011 primarily includes £356 million in relation to a court deposit made in respect of the India tax case.
Cash generated by operations decreased by 3.7% to £14.8 billion primarily driven by working capital movements and lower EBITDA. Free cash flow decreased by 13.4% to £6.1 billion primarily due increased cash capital expenditure, working capital movements and lower dividends from associates, offset by lower payments for taxation. Cash capital expenditure increased by £0.8 billion, driven by a reduction in working capital creditors and increased investment, particularly in Vodacom and Germany. Payments for taxation decreased by 24.2% to £2.0 billion primarily due to accelerated tax depreciation in the United States and the timing of tax payments in Italy. Dividends received from associates and investments decreased by £0.3 billion due to the loss of dividends resulting from the disposal of the Group’s interest in SFR and China Mobile Limited. Net interest payments were stable at £1.3 billion.

LIQUIDITY AND CAPITAL RESOURCES
19
Analysis of net debt: 2012 2011 £m £m Cash and cash equivalents1 7,138 6,252 Short-term borrowings Bonds (1,289) (2,470) Commercial paper2 (2,272) (1,660) Put options over non-controlling interests – (3,113) Bank loans (1,635) (2,070) Other short-term borrowings1 (1,062) (593) (6,258) (9,906) Long-term borrowings Put options over non-controlling interests (840) (78) Bonds, loans and other long-term borrowings (27,522) (28,297) (28,362) (28,375) Other financial instruments3 3,057 2,171 Net debt (24,425) (29,858)
Notes: 1 At 31 March 2012 the amount includes £980 million (31 March 2012: £531 million) in relation to cash received under collateral support
agreements. 2 At 31 March 2012 US$1,689 million was drawn under the US commercial paper programme; €1,226 million and US$309 million were drawn
under the euro commercial paper programme. 3 Comprises i) mark-to-market adjustments on derivative financial instruments which are included as a component of trade and other
receivables (31 March 2012: £2,959 million; 2011: £2,045 million) and trade and other payables (31 March 2012: £889 million; 2011: £548 million); and ii) short-term investments primarily in index linked government bonds included as a component of other investments (31 March 2012: £987 million; 2011: £674 million).
Net debt decreased by £5.4 billion to £24.4 billion primarily due to cash generated by operations, the proceeds from the sale of the Group’s 44% interest in SFR and 24.4% interest in Polkomtel, and the £2.9 billion income dividend from VZW, partially offset by share buybacks and dividend payments to equity holders. The following table sets out the Group’s undrawn committed bank facilities: 31 March 2012 Maturity £m US$4.2 billion committed revolving credit facility provided by 30 banks1 2 March 2016 2,655 €4.2 billion committed revolving credit facility provided by 31 banks1 July 2015 3,527 Other committed credit facilities Various 1,683 Undrawn committed facilities 7,865
Note: 1 Both facilities support US and euro commercial paper programmes of up to US$15 billion and £5 billion, respectively. 2 During the year US$4.1 billion of this facility was extended by one year to March 2017. The Group’s £2,272 million of commercial paper maturing within one year is covered 3.5 times by the £7,865 million of undrawn credit facilities. In addition, the Group has historically generated significant amounts of free cash flow which can be allocated to pay dividends, repay maturing borrowings and pay for discretionary spending. The Group currently expects to continue generating significant amounts of free cash flow. The Group has a €30 billion euro medium-term note (‘EMTN’) programme and a US shelf registration programme which are used to meet medium to long-term funding requirements. At 31 March 2012, the total amounts in issue under these programmes split by currency were US$13.3 billion, £2.5 billion, €8.9 billion and £0.2 billion sterling equivalent of other currencies.

LIQUIDITY AND CAPITAL RESOURCES
20
At 31 March 2012 the Group had bonds outstanding with a nominal value of £18.3 billion (31 March 2011: £21.0 billion). Details of bonds issued between 1 April 2011 and 30 September 2011 are included in the Group’s half-year financial report for the six months ended 30 September 2011. Between 1 October 2011 and 31 March 2012 the following bonds were issued:
Date issued Maturity Currency Amount
million
Sterling equivalent
million US shelf programme or EMTN programme
20 March 2012 20 March 2017 US$ 1,000 625 US shelf programme
Dividends In May 2010 the directors issued a dividend per share growth target of at least 7% per annum for each of the financial years in the period ending 31 March 2013. Accordingly, the directors have announced a final dividend of 6.47 pence per share, to give total ordinary dividends per share, excluding the special second interim dividend, of 9.52 pence, representing a 7% increase over the prior financial year’s total ordinary dividend per share. The ex-dividend date for the final dividend is 6 June 2012 for ordinary shareholders, the record date is 8 June 2012 and the dividends are payable on 1 August 2012. On 28 July 2011 Vodafone announced that the Board of VZW approved the payment of a US$10.0 billion (£6.1 billion) income dividend. As a 45% shareholder in VZW, Vodafone’s share of the dividend was US$4.5 billion (£2.9 billion). The Board of Vodafone therefore paid a special, second interim, dividend of £2.0 billion, equivalent to 4.0 pence per share, to Vodafone shareholders in February 2012. Dividend payments on ordinary shares will be paid by direct credit into a nominated bank or building society account or, alternatively, into the Company’s dividend reinvestment plan. The Company no longer pays dividends by cheque. Ordinary shareholders who have not already done so should provide appropriate bank account details to the Company’s Registrars: Computershare Investor Services PLC, The Pavilions, Bridgwater Road, Bristol, BS99 6ZY. Share buyback programmes Following the disposal of the Group’s 3.2% interest in China Mobile Limited on 10 September 2010, the Group initiated a £2.8 billion share buyback programme under the authority granted by the shareholders at the 2010 Annual General Meeting (‘AGM’) which was completed in June 2011. Under this programme the Group purchased a total of 1,631,662,645 shares at an average price per share, including transaction costs, of 171.60 pence.

LIQUIDITY AND CAPITAL RESOURCES
21
Following the disposal of the Group’s entire 44% interest in SFR to Vivendi on 16 June 2011, the Group initiated a £4.0 billion share buyback programme. The Group placed irrevocable purchase instructions with a number of banks to enable the banks to buy back shares on our behalf when we may otherwise have been prohibited from buying in the market. Details of the shares purchased to date, including those purchased under irrevocable instructions, are shown below:
Number of shares purchased1
Average price paid per share inclusive
of transaction costs
Total number of shares purchased
under publicly announced share
buyback programme2
Maximum value of shares that may
yet be purchased under the
programme3
Date of share purchase ’000 Pence ’000 £m
June 2011 95,908 164.15 95,908 3,843
July 2011 178,643 163.77 274,551 3,550
August 2011 196,798 165.14 471,349 3,225
September 2011 199,672 162.77 671,021 2,900
October 2011 173,100 172.69 844,121 2,601
November 2011 201,279 174.42 1,045,400 2,250
December 2011 125,000 175.60 1,170,400 2,030
January 2012 158,400 177.22 1,328,800 1,750
February 2012 181,200 174.42 1,510,000 1,434
March 2012 197,700 171.37 1,707,700 1,095
April 2012 149,800 172.63 1,857,500 836
May 2012 117,000 170.86 1,974,500 636
Total 1,974,500 4 170.35 1,974,500 636
Notes: 1 The nominal value of shares purchased is 113/7 US cents each. 2 No shares were purchased outside the publicly announced share buyback programme. 3 In accordance with shareholder authority granted at 2011 AGM. 4 The total number of shares purchased represents 4.0% of our issued share capital, excluding treasury shares, at 21 May 2012.
Option agreements and similar arrangements The Group is party to a number of option agreements which could result in it being required to pay cash to maintain or increase its equity interests in its operations in India and the United States. The agreements with Piramal in respect of its 11% shareholding in Vodafone India Limited (‘VIL’) contemplate various exit mechanisms for Piramal including participating in an initial public offering by VIL or, if such initial public offering has not completed by 18 August 2013 or 8 February 2014, respectively, or if Piramal chooses not to participate in such initial public offering, Piramal selling its shareholding to Vodafone Group in two tranches of 5.485% for an aggregate price of between approximately INR70 billion (£0.8 billion) and INR83 billion (£1.0 billion). Details of the option agreements in relation to VZW are available on page 51 of the Group’s annual report for the year ended 31 March 2011.
OTHER SIGNIFICANT DEVELOPMENTS SFR Following clearance of the transaction by the relevant competition and regulatory authorities, the Group completed the disposal of its entire 44% interest in SFR to Vivendi on 16 June 2011. The Group received cash consideration of €7.75 billion (£6.8 billion) from Vivendi and a final dividend from SFR of €200 million (£178 million). Vodafone and SFR have also entered into a partner market agreement which will maintain their commercial co-operation. Vodafone India Limited (formerly Vodafone Essar Limited) On 1 July 2011 Vodafone Group and the Essar group agreed the terms under which the Essar group would dispose of its entire interest in Vodafone India Limited (‘VIL’). Further, the parties agreed that all outstanding claims between them were terminated, and that all future claims be renounced. The parties also agreed to cooperate fully in seeking all regulatory approvals necessary for the completion of the transactions and the Essar group relinquished all of their board seats in VIL. Under the terms of the agreements, Essar Communications Limited and Essar Com Limited, sold
OTHER SIGNIFICANT DEVELOPMENTS
22
their entire 22% shareholdings in VIL to Vodafone Group taking Vodafone Group’s direct shareholding to 64.4%. The total cash outflow from Vodafone Group was US$4.2 billion (£2.6 billion), comprised of a net payment of US$3.3 billion (£2.0 billion) after withholding tax of US$0.9 billion (£0.6 billion). The transfer of these shares to Vodafone Group was completed in two tranches on 1 June 2011 and 1 July 2011. Under a separate agreement, ETHL Communications Holdings Limited sold its 11% shareholding in VIL in two equal tranches to Piramal Healthcare, completing in August 2011 and February 2012. Polkomtel On 9 November 2011 the Group completed the disposal of its entire 24.4% interest in Polkomtel in Poland. The Group received cash consideration of approximately €918 million (£784 million) before tax and transaction costs. Indian tax case On 20 January 2012 the Group received the judgment of the Indian Supreme Court. The Court concluded that Vodafone had no liability to account for withholding tax on its acquisition of interests in Hutchison Essar Limited (now VIL) in 2007. However on 16 March 2012 the Indian Government, through its budget announcement, proposed new retrospective tax legislation, which, if enacted, would countermand the verdict of the Indian Supreme Court and impose tax, interest from 2007 and, potentially, penalties on Vodafone International Holdings B.V (‘VIHBV’), notwithstanding the verdict of the Indian Supreme Court. On 17 April 2012 Vodafone served the Indian Government with a Notice of Dispute regarding the proposals, which are included in the Indian Finance Bill 2012, which the Group believes violate the international legal protection granted to Vodafone under the Bilateral Investment Treaty between India and the Netherlands. The action of the Indian government in introducing this retrospective legislation introduces substantial uncertainty, and there can be no assurance that any outcome will be favourable to VIHBV or the Group. The Group did not carry any provision in respect of the India tax case at 31 March 2012 or at previous reporting dates. SoftBank consideration On 2 April 2012 the Group received the remaining consideration of ¥200 billion (£1.5 billion) from the sale of its SoftBank Mobile Corp. interests. Offer for Cable & Wireless Worldwide plc (‘CWW’) On 23 April 2012 Vodafone Europe B.V (‘VEBV‘) announced a recommended cash offer to acquire the entire issued and to be issued share capital of CWW (the ‘Offer’). It is intended that the Offer will be effected by way of a court-sanctioned scheme of arrangement (the ‘Scheme’) under Part 26 of the Companies Act. Under the terms of the Offer, CWW shareholders will be entitled to receive 38 pence in cash for each CWW share held. The Offer values the entire issued ordinary share capital of CWW at approximately £1,045 million. On 21 May 2012 CWW and VEBV announced that the circular relating to the Scheme was being sent to CWW shareholders that day. The Scheme circular sets out, among other things, the full terms and conditions of the Scheme, an explanatory statement, notices of the required meetings, a timetable of principal events and details of the action to be taken by CWW Shareholders. Subject to approval at the relevant meetings, court approval and the satisfaction or waiver of the other conditions set out in the Scheme circular (including competition and regulatory approvals), the Scheme is expected to become effective on or around 27 July 2012. On 21 May 2012 VEBV also announced, in order to satisfy its obligation under Rule 15 of the United Kingdom City Code on Takeovers and Mergers, a recommended convertible bond cash offer to the holders of all of the outstanding CWW £230 million 5.75 per cent. convertible bonds due 2014, convertible into ordinary shares of CWW.

CONSOLIDATED FINANCIAL STATEMENTS
23
Consolidated income statement 2012 2011 £m £m Revenue 46,417 45,884 Cost of sales (31,546) (30,814) Gross profit 14,871 15,070 Selling and distribution expenses (3,227) (3,067) Administrative expenses (5,075) (5,300) Share of result in associates 4,963 5,059 Impairment loss (4,050) (6,150) Other income and expense 3,705 (16) Operating profit 11,187 5,596 Non-operating income and expense (162) 3,022 Investment income 456 1,309 Financing costs (1,932) (429) Profit before taxation 9,549 9,498 Income tax expense (2,546) (1,628) Profit for the financial year 7,003 7,870 Attributable to: – Equity shareholders 6,957 7,968 – Non-controlling interests 46 (98) 7,003 7,870 Earnings per share – Basic 13.74p 15.20p – Diluted 13.65p 15.11p
Consolidated statement of comprehensive income 2012 2011 £m £m (Losses)/gains on revaluation of available-for-sale investments, net of tax (17) 310 Foreign exchange translation differences, net of tax (3,673) (2,132) Net actuarial (losses)/gains on defined benefit pension schemes, net of tax (272) 136 Foreign exchange gains transferred to the income statement (681) (630) Fair value gains transferred to the income statement – (2,192) Other, net of tax (10) 19 Other comprehensive loss (4,653) (4,489) Profit for the financial year 7,003 7,870 Total comprehensive income for the financial year 2,350 3,381 Attributable to: – Equity shareholders 2,383 3,567 – Non-controlling interests (33) (186) 2,350 3,381

CONSOLIDATED FINANCIAL STATEMENTS
24
Consolidated statement of financial position 2012 2011 £m £m Non-current assets Goodwill 38,350 45,236 Other intangible assets 21,164 23,322 Property, plant and equipment 18,655 20,181 Investments in associates 35,108 38,105 Other investments 791 1,381 Deferred tax assets 1,970 2,018 Post employment benefits 31 97 Trade and other receivables 3,482 3,877 119,551 134,217 Current assets Inventory 486 537 Taxation recoverable 334 281 Trade and other receivables 10,744 9,259 Other investments 1,323 674 Cash and cash equivalents 7,138 6,252 20,025 17,003 Total assets 139,576 151,220 Equity Called up share capital 3,866 4,082 Additional paid-in capital 154,123 153,760 Treasury shares (7,841) (8,171) Retained losses (84,184) (77,661) Accumulated other comprehensive income 10,971 15,545 Total equity shareholders’ funds 76,935 87,555 Non-controlling interests 2,090 2,880 Put options over non-controlling interests (823) (2,874) Total non-controlling interests 1,267 6 Total equity 78,202 87,561 Non-current liabilities Long-term borrowings 28,362 28,375 Taxation liabilities 250 350 Deferred tax liabilities 6,597 6,486 Post employment benefits 337 87 Provisions 479 482 Trade and other payables 1,324 804 37,349 36,584 Current liabilities Short-term borrowings 6,258 9,906 Taxation liabilities 1,898 1,912 Provisions 633 559 Trade and other payables 15,236 14,698 24,025 27,075 Total equity and liabilities 139,576 151,220

CONSOLIDATED FINANCIAL STATEMENTS
25
Consolidated statement of changes in equity
Share
capital
Additional paid-in
capital 1 Treasury
shares
Accumulated comprehensive
income 2
Equity
shareholders’ funds
Non- controlling
interests Total
equity £m £m £m £m £m £m £m 1 April 2010 4,153 153,509 (7,810) (59,471) 90,381 429 90,810 Issue or reissue of shares – – 232 (125) 107 – 107 Redemption or cancellation of shares (71) 71 1,532 (1,532) – – – Purchase of own shares – – (2,125) – (2,125) – (2,125) Share-based payment – 180 3 – – 180 – 180 Acquisition of non-controlling interest – – – (120) (120) 35 (85) Comprehensive income – – – 3,567 3,567 (186) 3,381 Dividends – – – (4,468) (4,468) (328) (4,796) Other – – – 33 33 56 89 31 March 2011 4,082 153,760 (8,171) (62,116) 87,555 6 87,561 Issue or reissue of shares – 2 277 (208) 71 – 71 Redemption or cancellation of shares (216) 216 4,724 (4,724) – – – Purchase of own shares – – (4,671)4 – (4,671) – (4,671) Share-based payment – 145 3 – – 145 – 145 Acquisition of non-controlling interest – – – (1,908) (1,908) 1,599 (309) Comprehensive income – – – 2,383 2,383 (33) 2,350 Dividends – – – (6,654) (6,654) (305) (6,959) Other – – – 14 14 – 14 31 March 2012 3,866 154,123 (7,841) (73,213) 76,935 1,267 78,202 Notes: 1 Includes share premium, capital redemption reserve and merger reserve. The merger reserve was derived from acquisitions made prior to 31
March 2004 and subsequently allocated to additional paid-in capital on adoption of IFRS. 2 Includes retained losses and accumulated other comprehensive income. 3 Includes £2 million tax credit (2011: £24 million). 4 Amount includes a commitment for the purchase of own shares of £1,091 million (2011: £nil).

CONSOLIDATED FINANCIAL STATEMENTS
26
Consolidated statement of cash flows 2012 2011 £m £m Net cash flow from operating activities 12,755 11,995 Cash flows from investing activities Purchase of interests in subsidiaries and joint ventures, net of cash acquired (149) (46) Other investing activities in relation to the purchase of subsidiaries 310 (356) Purchase of interests in associates (5) – Purchase of intangible assets (3,090) (4,290) Purchase of property, plant and equipment (4,762) (4,350) Purchase of investments (417) (318) Disposal of interests in subsidiaries and joint ventures, net of cash disposed 832 – Disposal of interests in associates 6,799 – Disposal of property, plant and equipment 117 51 Disposal of investments 66 4,467 Dividends received from associates 4,023 1,424 Dividends received from investments 3 85 Interest received 322 1,659 Taxation on investing activities (206) (208) Net cash flow from investing activities 3,843 (1,882) Cash flows from financing activities Issue of ordinary share capital and reissue of treasury shares 71 107 Net movement in short-term borrowings 1,206 (573) Proceeds from issue of long-term borrowings 1,642 4,861 Repayment of borrowings (3,520) (4,064) Purchase of treasury shares (3,583) (2,087) Equity dividends paid (6,643) (4,468) Dividends paid to non-controlling shareholders in subsidiaries (304) (320) Other transactions with non-controlling shareholders in subsidiaries (2,605) (137) Interest paid (1,633) (1,578) Net cash flow from financing activities (15,369) (8,259) Net cash flow 1,229 1,854 Cash and cash equivalents at beginning of the financial year 6,205 4,363 Exchange loss on cash and cash equivalents (346) (12) Cash and cash equivalents at end of the financial year 7,088 6,205
CONSOLIDATED FINANCIAL STATEMENTS
27
1. Basis of preparation
The preliminary results for the year ended 31 March 2012 are an abridged statement of the full annual report which was approved by the Board of directors on 22 May 2012. The consolidated financial statements within the full annual report are prepared in accordance with International Financial Reporting Standards (‘IFRS’) as issued by the International Accounting Standards Board. They are also prepared in accordance with IFRS as adopted by the European Union (‘EU’), the Companies Act 2006 and Article 4 of the EU IAS Regulations. The auditor’s report on those consolidated financial statements was unqualified, did not draw attention to any matters by way of emphasis without qualifying their report, and did not contain statements under section 498(2) or 498(3) of the Companies Act 2006. The preliminary results do not comprise statutory accounts within the meaning of section 434(3) of the Companies Act 2006. The annual report for the year ended 31 March 2012 will be delivered to the Registrar of Companies following the Company’s annual general meeting to be held on 24 July 2012. The financial information included in this preliminary announcement does not itself contain sufficient information to comply with IFRS. The Company will publish full financial statements that comply with IFRS in June 2012. The preparation of the preliminary results requires management to make estimates and assumptions that affect the reported amounts of assets and liabilities, disclosure of contingent assets and liabilities at the end of the reporting period and the reported amounts of revenue and expenses during the reporting period. Actual results could vary from these estimates. The estimates and underlying assumptions are reviewed on an on-going basis. Revisions to accounting estimates are recognised in the period in which the estimate is revised if the revision affects only that period or in the period of the revision and future periods if the revision affects both current and future periods. 2. Equity dividends
2012 2011 £m £m Declared during the financial year: Final dividend for the year ended 31 March 2011: 6.05 pence per share (2010: 5.65 pence per share) 3,102 2,976 Interim dividend for the year ended 31 March 2012: 3.05 pence per share (2011: 2.85 pence per share) 1,536 1,492 Second interim dividend for the year ended 31 March 2012: 4.00 pence per share (2011: nil) 2,016 – 6,654 4,468 Proposed after the end of the reporting period and not recognised as a liability: Final dividend for the year ended 31 March 2012: 6.47 pence per share (2011: 6.05 pence per share) 3,195 3,106

USE OF NON-GAAP FINANCIAL INFORMATION
28
In the discussion of the Group’s reported financial position, operating results and cash flows, information is presented to provide readers with additional financial information that is regularly reviewed by management. However, this additional information presented is not uniformly defined by all companies including those in the Group’s industry. Accordingly, it may not be comparable with similarly titled measures and disclosures by other companies. Additionally, certain information presented is derived from amounts calculated in accordance with IFRS but is not itself an expressly permitted GAAP measure. Such non-GAAP measures should not be viewed in isolation or as an alternative to the equivalent GAAP measure. A summary of certain non-GAAP measures included in this results announcement, together with details of where additional information and reconciliation to the nearest equivalent GAAP measure can be found, is shown below.
Non-GAAP measure Equivalent GAAP measure
Location in this results announcement of reconciliation and further information
EBITDA Operating profit Group results on page 8
Adjusted operating profit Operating profit Group results on page 8
Adjusted profit before tax Profit before taxation Taxation on page 10
Adjusted effective tax rate Income tax expense as a percentage of profit before taxation
Taxation on page 10
Adjusted income tax expense Income tax expense Taxation on page 10
Adjusted profit attributable to equity shareholders
Profit attributable to equity shareholders
Earnings per share on page 10
Adjusted earnings per share Basic earnings per share Earnings per share on page 10 and 31
Operating free cash flow Cash generated by operations Cash flows and funding beginning on page 18
Free cash flow Cash generated by operations Cash flows and funding beginning on page 18
Net debt Short-term borrowings, Long-term borrowings, cash and cash equivalents and other financial instruments
Analysis on net debt on page 19
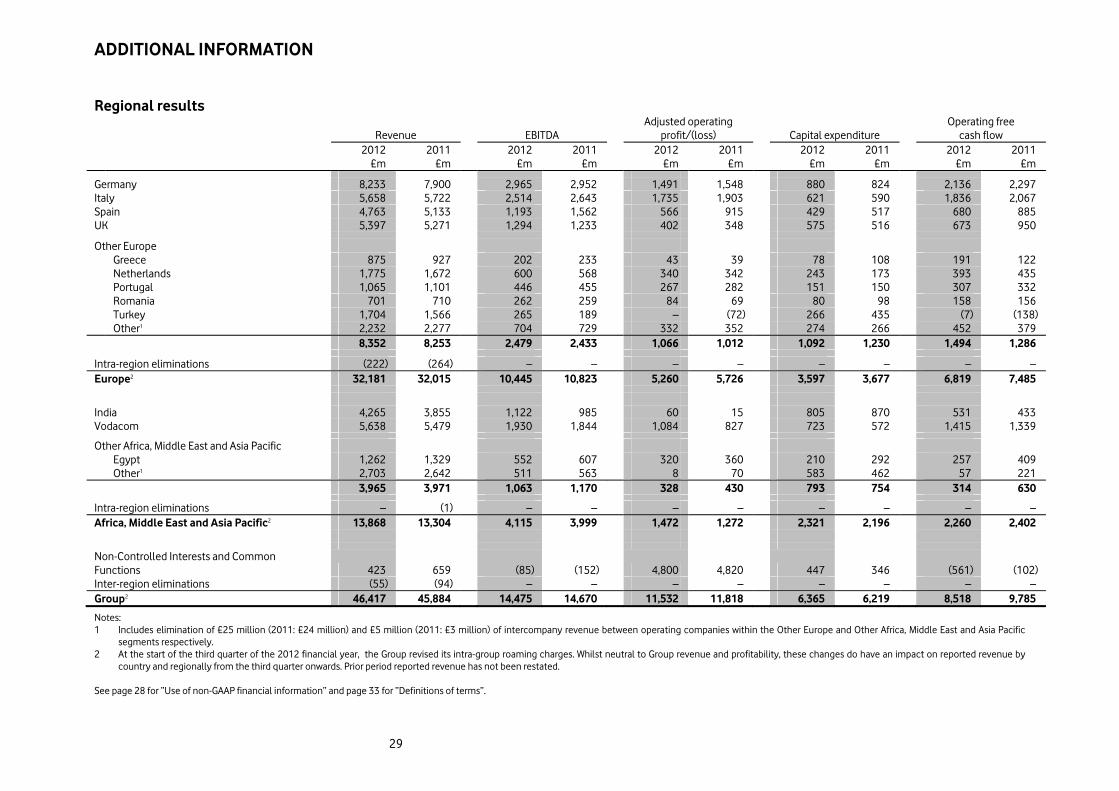
ADDITIONAL INFORMATION
29
Regional results
Revenue EBITDA Adjusted operating
profit/(loss) Capital expenditure Operating free
cash flow 2012 2011 2012 2011 2012 2011 2012 2011 2012 2011 £m £m £m £m £m £m £m £m £m £m Germany 8,233 7,900 2,965 2,952 1,491 1,548 880 824 2,136 2,297 Italy 5,658 5,722 2,514 2,643 1,735 1,903 621 590 1,836 2,067 Spain 4,763 5,133 1,193 1,562 566 915 429 517 680 885 UK 5,397 5,271 1,294 1,233 402 348 575 516 673 950 Other Europe Greece 875 927 202 233 43 39 78 108 191 122 Netherlands 1,775 1,672 600 568 340 342 243 173 393 435 Portugal 1,065 1,101 446 455 267 282 151 150 307 332 Romania 701 710 262 259 84 69 80 98 158 156 Turkey 1,704 1,566 265 189 – (72) 266 435 (7) (138) Other1 2,232 2,277 704 729 332 352 274 266 452 379 8,352 8,253 2,479 2,433 1,066 1,012 1,092 1,230 1,494 1,286 Intra-region eliminations (222) (264) – – – – – – – – Europe2 32,181 32,015 10,445 10,823 5,260 5,726 3,597 3,677 6,819 7,485 India 4,265 3,855 1,122 985 60 15 805 870 531 433 Vodacom 5,638 5,479 1,930 1,844 1,084 827 723 572 1,415 1,339 Other Africa, Middle East and Asia Pacific Egypt 1,262 1,329 552 607 320 360 210 292 257 409 Other1 2,703 2,642 511 563 8 70 583 462 57 221 3,965 3,971 1,063 1,170 328 430 793 754 314 630 Intra-region eliminations – (1) – – – – – – – – Africa, Middle East and Asia Pacific2 13,868 13,304 4,115 3,999 1,472 1,272 2,321 2,196 2,260 2,402 Non-Controlled Interests and Common Functions 423 659 (85) (152) 4,800 4,820 447 346 (561) (102) Inter-region eliminations (55) (94) – – – – – – – – Group2 46,417 45,884 14,475 14,670 11,532 11,818 6,365 6,219 8,518 9,785
Notes: 1 Includes elimination of £25 million (2011: £24 million) and £5 million (2011: £3 million) of intercompany revenue between operating companies within the Other Europe and Other Africa, Middle East and Asia Pacific
segments respectively. 2 At the start of the third quarter of the 2012 financial year, the Group revised its intra-group roaming charges. Whilst neutral to Group revenue and profitability, these changes do have an impact on reported revenue by
country and regionally from the third quarter onwards. Prior period reported revenue has not been restated.
See page 28 for “Use of non-GAAP financial information” and page 33 for “Definitions of terms”.

ADDITIONAL INFORMATION
30
Service revenue – quarter ended 31 March
Group1 2 Europe
Africa, Middle East and Asia Pacific
2012 2011 2012 2011 2012 2011 £m £m £m £m £m £m Voice revenue 6,039 6,482 3,774 4,161 2,264 2,250 Messaging revenue 1,271 1,281 1,042 1,036 229 229 Data revenue 1,604 1,384 1,209 1,043 396 329 Fixed line revenue 909 877 798 773 111 105 Other service revenue 557 525 334 337 214 200 Service revenue 10,380 10,549 7,157 7,350 3,214 3,113 % change
Group Europe
Africa, Middle East and Asia Pacific
Reported Organic Reported Organic Reported Organic Voice revenue (6.8) (2.5) (9.3) (6.9) 0.6 5.6 Messaging revenue (0.8) 2.4 0.6 2.8 – 0.6 Data revenue 15.9 19.6 15.9 18.4 20.4 24.6 Fixed line revenue 3.6 5.6 3.2 5.8 5.7 4.2 Other service revenue 6.1 9.1 (0.9) 1.3 7.0 12.7 Service revenue (1.6) 2.3 (2.6) (0.2) 3.2 7.6 Germany Italy Spain UK India Vodacom 2012 2011 2012 2011 2012 2011 2012 2011 2012 2011 2012 2011 £m £m £m £m £m £m £m £m £m £m £m £m Voice revenue 720 803 664 734 639 756 585 621 842 781 850 884 Messaging revenue 229 200 197 212 54 79 324 296 51 45 72 71 Data revenue 395 344 178 160 171 142 220 208 88 72 178 157 Fixed line revenue 456 455 151 158 90 80 12 7 6 2 57 58 Other service revenue 71 44 52 63 39 68 112 114 109 88 69 66 Service revenue 1,871 1,846 1,242 1,327 993 1,125 1,253 1,246 1,096 988 1,226 1,236 % change Germany Italy Spain UK India Vodacom Reported Organic Reported Organic Reported Organic Reported Organic Reported Organic Reported Organic Service revenue 1.4 4.0 (6.4) (4.1) (11.7) (9.5) 0.6 1.1 10.9 21.1 (0.8) 6.0
Notes: 1 At the start of the third quarter of the 2012 financial year, the Group revised its intra-group roaming charges. Whilst neutral to Group revenue and profitability, these changes do have an impact on reported service revenue
by country and regionally from the third quarter onwards. Whilst prior period reported revenue has not been restated, to ensure comparability in organic growth rates, country and regional revenue in the prior financial year have been recalculated based on the new pricing structure to form the basis for our organic calculations.
2 The sum of the regional amounts may not be equal to Group totals due to Non-Controlled Interests and Common Functions and intercompany eliminations.

ADDITIONAL INFORMATION
31
Reconciliation of adjusted earnings Note Reported Adjustments Adjusted Year ended 31 March 2012 £m £m £m Operating profit 1 11,187 345 11,532 Non-operating income and expense 2 (162) 162 – Net financing costs 3 (1,476) (138) (1,614) Profit before taxation 9,549 369 9,918 Income tax expense 4 (2,546) 242 (2,304) Profit for the financial year 7,003 611 7,614 Attributable to: – Equity shareholders 6,957 593 7,550 – Non-controlling interests 46 18 64 Basic earnings per share 13.74p 14.91p
Notes: 1 Adjustment primarily relates to the £3,419 million gain arising from the disposal of the Group’s 44% interest in SFR, £296 million gain
arising from the disposal of the Group’s 24.4% interest in Polkomtel and the £4,050 million impairment charge. 2 Adjustment primarily consists of losses in relation to equity investments. 3 Consists of a £138 million adjustment in relation to foreign exchange rate movements on certain intercompany balances. 4 Primarily consists of £206 million tax arising on the disposal of the Group’s 24.4% interest in Polkomtel and £36 million tax in relation to
foreign exchange rate movements on certain intercompany balances. Note Reported Adjustments Adjusted Year ended 31 March 2011 £m £m £m Operating profit 1 5,596 6,222 11,818 Non-operating income and expense 2 3,022 (3,022) – Net financing costs 3 880 (1,695) (815) Profit before taxation 9,498 1,505 11,003 Income tax expense 4 (1,628) (697) (2,325) Profit for the financial year 7,870 808 8,678 Attributable to: – Equity shareholders 7,968 808 8,776 – Non-controlling interests (98) – (98) Basic earnings per share 15.20p 16.75p
Notes: 1 Adjustment primarily relates to the £6,150 million of impairment charges and the £56 million net loss arising on the disposal by VZW of
certain markets related to the Alltel acquisition. 2 Adjustment primarily consists of the gain on disposal arising from the disposal of the Group’s 3.2% interest in China Mobile Limited. 3 Includes a £268 million adjustment in relation to foreign exchange rate movements on certain intercompany balances and on financial
instruments received as consideration in the disposal of Vodafone Japan to SoftBank which completed in April 2006, a £472 million gain arising from the disposal of these financial instruments to SoftBank in November 2010 and an £872 million release of interest accrual on the settlement of a tax case.
4 Represents £215 million tax arising on the disposal of the Group’s 3.2% interest in China Mobile Limited and £17 million relating to tax on the adjustments used to derive adjusted profit before tax offset by £929 million arising on the settlement of a tax case.

ADDITIONAL INFORMATION
32
Mobile customers1 (in thousands)
Country
1 January
2012 Net
additions Other
movements 31 March
2012 Prepaid2 Europe Germany 37,625 (1,164) – 36,461 57.5% Italy 23,024 (22) – 23,002 82.8% Spain 17,653 89 – 17,742 39.6% UK 19,330 (163) – 19,167 46.2% 97,632 (1,260) – 96,372 59.7% Other Europe Albania 1,809 (4) – 1,805 93.9% Czech Republic3 3,313 17 (31) 3,299 45.0% Greece 4,169 37 – 4,206 62.2% Hungary 2,684 (27) – 2,657 50.8% Ireland 2,237 (19) – 2,218 66.3% Malta 284 11 – 295 83.4% Netherlands 5,261 23 – 5,284 35.9% Portugal 6,218 (52) – 6,166 81.7% Romania 8,327 (388) – 7,939 57.1% Turkey 17,991 256 – 18,247 67.0% 52,293 (146) (31) 52,116 62.5% Europe 149,925 (1,406) (31) 148,488 60.6% Africa, Middle East and Asia Pacific India 147,747 2,718 – 150,465 95.0% Vodacom4 52,927 4,375 – 57,302 89.9% 200,674 7,093 – 207,767 93.6% Other Africa, Middle East and Asia Pacific Australia 3,362 (64) – 3,298 38.2% Egypt 36,360 695 – 37,055 95.5% Fiji 312 (2) – 310 95.2% Ghana 4,276 249 – 4,525 99.5% New Zealand 2,420 (9) – 2,411 66.8% Qatar 797 40 – 837 97.5% 47,527 909 – 48,436 87.3% Africa, Middle East and Asia Pacific 248,201 8,002 – 256,203 92.4% Group 398,126 6,596 (31) 404,691 80.5% Memorandum: Group's share of Verizon Wireless5 41,475 370 – 41,845 5.4% Vodafone Group plus the Group's share of Verizon Wireless 439,601 6,966 (31) 446,536 66.7% Notes: 1 Group customers represent subsidiaries on a 100% basis and joint ventures (being Italy, Australia and Fiji) based on the Group’s equity
interests. 2 Prepaid customer percentages are calculated on a venture basis. At 31 March 2012 there were 508.2 million venture customers. 3 Other movements relate to the restatement of the customer base. 4 Vodacom refers to the Group’s interests in Vodacom Group Limited and its subsidiaries, including those located outside of South Africa. 5 Includes Verizon Wireless’ retail customers only, based on the Group’s equity interest.

OTHER INFORMATION
33
1) Copies of this document are available from the Company’s registered office at Vodafone House, The Connection, Newbury, Berkshire, RG14 2FN.
2) The preliminary results will be available on the Vodafone Group Plc website, www.vodafone.com/investor,
from 22 May 2012. For further information: Vodafone Group Plc Investor Relations Media Relations Telephone: +44 7919 990230 Telephone: +44 1635 664 444 Notes: 1. Vodafone and the Vodafone logo, Vodacom, M-Pesa, Vodafone OfficeNet and Vodafone One Net are trademarks
of the Vodafone Group. Other product and company names mentioned herein may be the trademarks of their respective owners
2. All growth rates reflect a comparison to the year ended 31 March 2011 unless otherwise stated. 3. References to the “Q2” are to the quarter ended 30 September 2011 unless otherwise stated. References to the
“Q3” are to the quarter ended 31 December 2011 unless otherwise stated. References to the “Q4” and ‘final quarter’ are to the quarter ended 31 March 2012 unless otherwise stated. References to the “second half of the financial year” are to the six months ended 31 March 2012 unless otherwise stated. References to the “prior financial year” are to the financial year ended 31 March 2011 unless otherwise stated.
4. All amounts marked with an “*” represent organic growth which presents performance on a comparable basis, both in terms of merger and acquisition activity and movements in foreign exchange rates. At the start of Q3 the Group revised its intra-group roaming charges. Whilst neutral to Group revenue and profitability, these changes do have an impact on reported service revenue by country and regionally from Q3 onwards. Whilst prior period reported revenue has not been restated, to ensure comparability in organic growth rates, country and regional revenue in the prior financial year have been recalculated based on the new pricing structure to form the basis for our organic calculations.
5. Reported growth is based on amounts in pounds sterling as determined under IFRS. 6. Vodacom refers to the Group’s interest Vodacom Group Limited (‘Vodacom’) in South Africa and its subsidiaries,
including its operations in the Democratic Republic of Congo, Lesotho, Mozambique and Tanzania. It also includes its Gateway services and business network solutions subsidiaries.
7. Quarterly historical information including service revenue, customers, churn, voice usage and ARPU is provided in a spread sheet available at www.vodafone.com/investor.
Copyright © Vodafone Group 2012 Definitions of terms Term
Definition
Verizon Wireless Tax distributions
Specific distributions made by the Cellco Partnership to its partners based on the taxable income of Verizon Wireless.
Verizon Wireless income dividends
Distributions (other than tax distributions) by Verizon Wireless as agreed from time to time by the Board of Verizon Wireless.
Nm Not meaningful
For definitions of other terms please refer to pages 149 to 150 of the Group’s annual report for the year ended 31 March 2011.

OTHER INFORMATION
34
Forward-looking statements This document contains “forward-looking statements” within the meaning of the US Private Securities Litigation Reform Act of 1995 with respect to the Group’s financial condition, results of operations and businesses and certain of the Group’s plans and objectives. In particular, such forward-looking statements include, but are not limited to: statements with respect to: expectations regarding the Group’s financial condition or results of operations contained within the Group Chief Executive’s statement on pages 3-5 of this document and within the guidance for organic service revenue, EBITDA margin, adjusted operating profit and free cash flow for the 2013 financial year on page 7; expectations for the Group’s future performance generally, including EBITDA growth and capital expenditure; expectations regarding the Group’s 7% per annum dividend per share growth target; expectations regarding the operating environment and market conditions and trends, including customer usage, competitive pressures and price trends; intentions and expectations regarding the development and launch of products, services and technologies either introduced by Vodafone or by Vodafone in conjunction with third parties or by third parties independently, including OfficeNet; growth in customers and usage; growth in data, enterprise and broadband; expectations regarding spectrum licence acquisitions, including anticipated new 3G and 4G availability; expectations regarding adjusted operating profit, revenue, service revenue, capitalised fixed asset additions, EBITDA margins, depreciation and amortisation charges, capital expenditure, free cash flow, foreign exchange rate movements and tax rates; expectations regarding capital expenditures; expectations regarding the integration or performance of current and future investments, associates, joint ventures, non-controlled interests and newly acquired businesses, including the offer for CWW; expectations regarding disposals; expectations regarding the Group’s share buyback programmes; and the outcome and impact of regulatory and legal proceedings involving Vodafone and of scheduled or potential regulatory changes. Forward-looking statements are sometimes, but not always, identified by their use of a date in the future or such words as “will”, “anticipates”, “aims”, “could”, “may”, “should”, “expects”, “believes”, “intends”, “plans” or “targets”. By their nature, forward-looking statements are inherently predictive, speculative and involve risk and uncertainty because they relate to events and depend on circumstances that will occur in the future. There are a number of factors that could cause actual results and developments to differ materially from those expressed or implied by these forward-looking statements. These factors include, but are not limited to, the following: changes in economic or political conditions in markets served by operations of the Group that would adversely affect the level of demand for mobile services; greater than anticipated competitive activity, from both existing competitors and new market entrants, which could require changes to the Group’s pricing models, lead to customer churn or make it more difficult to acquire new customers; the impact of investment in network capacity and the deployment of new technologies, or the rapid obsolescence of existing technology; higher than expected costs or capital expenditures; slower than expected customer growth and reduced customer retention; changes in the spending patterns of new and existing customers and the possibility that new products and services will not be commercially accepted or perform according to expectations; the Group’s ability to renew or obtain necessary licences, including spectrum; the Group’s ability to achieve cost savings; the Group’s ability to execute its strategy in mobile data, enterprise and broadband and in emerging markets; changes in foreign exchange rates, including, particularly, the exchange rate of sterling to the euro and the US dollar, or interest rates; the ability to realise benefits from entering into partnerships or joint ventures and entering into service franchising and brand licensing; unfavourable consequences of acquisitions or disposals; changes in the regulatory framework in which the Group operates, including possible action by regulators in markets in which the Group operates or by the EU to regulate rates the Group is permitted to charge; the impact of legal or other proceedings against the Group or other companies in the mobile telecommunications industry; loss of suppliers or disruption of supply chains; the Group’s ability to satisfy working capital and other requirements through access to bank facilities, funding in the capital markets and operations; changes in statutory tax rates or profit mix which might impact the weighted average tax rate; and/or changes in tax legislation or final resolution of open tax issues which might impact the Group’s tax payments or effective tax rate. Furthermore, a review of the reasons why actual results and developments may differ materially from the expectations disclosed or implied within forward-looking statements can be found under “Forward-looking statements” in our half-year financial report for the six months ended 30 September 2011 and “Principal risk factors and uncertainties” in our annual report for the year ended 31 March 2011, both of which can be found on the Group’s website (www.vodafone.com/investor). All subsequent written or oral forward-looking statements attributable to the Company or any member of the Group or any persons acting on their behalf are expressly qualified in their entirety by the factors referred to above. No assurances can be given that the forward-looking statements in this document will be realised. Subject to compliance with applicable law and regulations, Vodafone does not intend to update these forward-looking statements and does not undertake any obligation to do so.
-ends-