preliminary market outlook for in water nutrient sensors€¦ · nutrient sensor challenge economic...
TRANSCRIPT
NutrientSensorChallengeEconomicWhitePaperACTMS-2015-01
i
Preliminary Market Outlook for
In-water Nutrient Sensors by
Abstract ThispaperprovidesapreliminaryassessmentofpotentialU.S.marketsforin-waternutrientsensortechnologiesbeingdevelopedaspartofthefederallysponsoredNutrientSensorChallenge(NSC).TheseNSC-basedtechnologiesarenotyetfullydeveloped,arenotexpectedtoreachmarketsuntil2017,andwilldifferfromoneanotherinwaysthatwillaffecttheirsuitabilityinvariousmarketsegments.Asaresult,thereisstillsignificantuncertaintyregardingpotentialmarketdemandoverall,inspecificmarketsegments,andforparticularNSC-basedtechnologies.Estimatespresentedinthispaperregardingpotentialsizesofmarketsandthetimingofmarketdevelopmentarebasedonongoingresearch.Theseestimatesshouldbeconsideredpreliminaryandusefulforgeneralplanningpurposes.Datawillberefinedduring2016andthroughoutthecourseoftheNSCasnewinformationbecomesavailableabouthowparticularNSC-basednutrientsensortechnologiesmatchuserneedsinspecificmarketsegments,andaboutkeymarketdriversthatwilldeterminehowrapidlythesemarketsegmentsarelikelytogrow.Keymarketdriversareassociatedwithchangesinwater-relatedresearchprioritiesandfederalandstatewaterqualityregulations,competingresearchandmonitoringfundingdemands,publicawarenessandsenseofurgencyregardingnationalandregionalwaterqualityproblems,andthecostandavailabilityofcompetingmethodsofprovidingin-waternutrientmeasurements.PreliminaryassessmentsofexistingmarketsrelatedtoFederal,state,university,industrial,agricultural,andnon-profitresearchandmonitoringneedssuggestthatoveralldemandforin-waternutrientsensorswithcharacteristicsspecifiedintheNSC,overthenextfiveyears,willbe24,000to30,000units.Atanaveragemarketpriceof$5,000perunit,thisconstitutesapotentialU.S.marketof$120millionto$150million.Thesepreliminarymarketpredictionsarebasedontheassumptionthatthesetechnologieswillbeavailableinthemarketplacein2017andachieveafive-yearadoptionrateof25%amongpotentialusersacrossvariousmarketsegments.TheydonottakeintoaccountglobalmarketpotentialorpotentialinU.S.marketsegmentsthatareexpectedtodevelopasaresultoftheavailabilityofNSC-basedsensors.Interviewswithnutrientmeasurementusersandrepresentativesofvariousmarketsegmentsindicatethatincreasingawarenessofnutrientproblemsandnewfederalandstateregulations,
NutrientSensorChallengeEconomicWhitePaperACTMS-2015-01
ii
alongwiththeavailabilityoflowcostsensorswithNSC-specifiedcharacteristics,arelikelytoresultinthedevelopmentofsignificantnewU.S.markets.TheemergenceofnewU.S.marketscombinedwithpotentialforeignmarketscanbeexpectedtoresultintheoverallmarketpotentialforthesesensorsbeingsignificantlygreaterthanestimatespresentedinthispaper.Also,thepreliminarymarketestimatespresentedinthispaperarebasedonone-timepurchasesoverafive-yearperiod.Iftheaverageusefullifeofthesesensorsystemsisapproximately5to10years,thesizeoftheoverallmarket,over20years,mightbeexpectedtobetwotofourtimeslarger.Onekeydriverofnewmarketdemandwillbestateandcountygovernmentsneedformorelocation-specificinformationaboutin-waternutrientsinordertofindandvalidatetheeffectivenessofaffordablewaystomeetTMDLs(TotalMaximumDailyLoads).Thepotentialofthesestate/countyTMDL-basedmarketscouldbesignificant,butwilldependonwhen,where,andhowTMDLsareimplementedandenforcedandrelatedreportingandverificationrequirements.Inaddition,theevolutionofwaterqualitytradingandoffsetprograms,andotherresponsestoTMDLsandothersimilarwaterqualitypoliciesintheU.S.andelsewherecouldresultinsignificantnewmarkets.
NutrientSensorChallengeEconomicWhitePaperACTMS-2015-01
iii
Table of Contents Abstract...........................................................................................................................................i
TableofContents..........................................................................................................................iii
Section1Introduction....................................................................................................................4
Format........................................................................................................................................6
Section2StagesofTechnologyMarketDevelopment...................................................................6
StatusofNutrientSensorDevelopment.....................................................................................7
Section3MarketOverview............................................................................................................8
MarketTypesandDrivers..........................................................................................................8
MarketSegments.......................................................................................................................8
Section4PreliminaryMarketAssessment.....................................................................................9
SurveyofGovernment/UniversityUsers....................................................................................9
AnalysisofPotentialDemandbyMarketSegment..................................................................10
OverviewofInterviewResults..............................................................................................10
Results......................................................................................................................................11
Agriculturalmarkets–Aspecialcase...................................................................................13
Section5Long-termMarketOutlook...........................................................................................13
Potentialcostsavings-the1%rule..........................................................................................14
PotentialCostSavings–UsingCost-effectivenessandIncrementalCostAnalysis..................15
References....................................................................................................................................19
Appendix:InterviewNotes...........................................................................................................21
IndustryMarketSegments.......................................................................................................21
DrinkingWaterFacilities.......................................................................................................21
CommercialMarketSegments.................................................................................................22
GovernmentMarketSegments................................................................................................23
FederalResearchandMonitoringPrograms........................................................................23
StateandLocalResearchandMonitoringPrograms............................................................23
OtherMarketSegments...........................................................................................................24
NutrientSensorChallengeEconomicWhitePaperACTMS-2015-01
4
Section 1 Introduction Sourcesofin-waternutrientpollutionarewidespreadandincludestormwater,wastewater,agriculturalrunoff,atmosphericdeposition(e.g.,fromcombustionoffossilfuels),andhouseholdsources(e.g.,yardfertilizers,petwaste,detergents).Growingawarenessofnutrientpollutionandtheneedtofindsolutionsisincreasinginterestinusinglocation-specificin-waternutrientmeasurementstoprioritizenutrientproblems,identifytheirsources,compareandvalidateresponseoptions,verifycompliancewithnutrientdischargelimits,and“score”waterqualitytrades,offsets,andcredits.Nutrientmeasurementsarealsousedtomakeinternaloperatingandmanagementdecisionsinvolvingflowratesandtreatmentlevelsatwastewateranddrinkingwaterfacilitiesandinvarioustypesofagriculturalandindustrialoperations.Currentlyavailablemethodsofmeasuringin-waternutrientsarebasedeitheronsimpletestkitswhicharefastandinexpensive,buttooimpreciseformostpurposes;onwatersamplingandlaboratoryanalyseswhichareaccurateandprecise,butcumbersome,timeconsuming,andexpensive;oronin-watersensorsandanalyzers.Useofcurrentlyavailablein-watersensorshasnotbeenwidespreadbecauseoftheircomplexity,technicaldemands,reliability,andpurchaseandoperatingcosts,aswellaslagtimesinlaboratoryanalysis.Marketpricesofcurrentlyavailablein-watersensorsystemsareintherangeof$20,000to$30,000,fielddeploymentsarelimitedtoafewweeks,andanadvancedleveloftrainingisrequiredtooperatethemeffectively.Itisgenerallyrecognizedthatthehighcostofreliablemeasuresofin-waternutrientsispreventingnutrientmeasurementsfrombeingavailabletoimprovenutrientmanagementdecisionsinmanyplaceswherethesedecisionsarebecomingcritical.Asaresult,largepotentialmarketsareexpectedtoexistfornewmethodsofproducingaccurate,precisein-waternutrientmeasurementsatareasonableprice.Themostpromisingmethodsforreachingthesemarketsinvolvetechnologiesthatmakeuseofin-waternutrientsensors.TheNutrientSensorChallengefocusesonnitrate/nitrateandorthophosphatesensors.Somemarketsegmentsrequiremeasuresofnitriteonly(e.g.,wastewatertreatment);othersrequiremeasuresofonlytotalnitrogenortotalphosphorus.ThispaperisaninterimreportthatpresentstheresultstodateofanongoinganalysisofpotentialU.S.marketsfornutrientsensortechnologiesbeingdevelopedaspartofthefederallysponsoredNutrientSensorChallenge(NSC).TheNSCisexpectedtoresultinnutrientsensorsthatare:accurate,easytouse,maintenance-free,capableofremotedeploymentsforuptothreemonths,andavailableinthemarketplaceby2017atapriceof$5,000orless.Theresearchthatformsthebasisofthispaperinvolved:
• areviewofresultsfrom2014NSC-basedsurveysandinterviewsoflikelygovernmentanduniversitybuyers;
• anassessmentofgenerallyavailablestatisticsregardingthenumbersofentitiesinspecificmarketsegmentsthatconstitutepotentialbuyers;
NutrientSensorChallengeEconomicWhitePaperACTMS-2015-01
5
• Preliminaryinterviewswithmorethan30currentprovidersandusersofnutrientmeasurementsandrepresentativesofvariousmarketsegmentswithinthreegeneralmarketareas:industry,government,anduniversity.
InterviewsindicatethatsensorsthatmeettheNSCchallengespecificationswilloutcompeteotheravailablenutrientmeasurementmethodsinexistingmarketsonthebasisofpriceandperformance.Perhapsmoreimportantly,mostintervieweesbelievethattheavailabilityofhighlyefficient,lowcostnutrientsensorswillresultintheemergenceoftotallynewmarketsassociatedwithnewtypesofresearch,expandedwaterqualitymonitoring,newwaysofsearchingforsolutionstonutrientproblems,andlesscostlyandmoreeffectivemethodsofmonitoringandverifyingcompliancewithnutrientdischargeregulations.Programsbeingproposedanddevelopedtoreducethecostofachievingnutrientdischargereductiongoals,suchaswaterqualitytradingandtax/subsidyprograms,arealsoexpectedtogeneratenewmarketsfornutrientmeasurementsthatwillbeneededto“score”nutrientdischargecredittradesandoffsetsandjustifynutrient-relatedtax/subsidyprograms.NSC-basedtechnologiesarenotyetfullydeveloped,arenotexpectedtobemarketableuntil2017,andareexpectedtodifferfromoneanotherinwaysthatarelikelytoaffecttheirsuitabilityinvariousmarketsegments.Asaresult,thereisstilluncertaintyregardingoverallpotentialmarketdemandforthesesensors,anddemandforspecificsensortechnologiesinspecificmarketsegments.OurpreliminaryinterviewsconfirmedthewidespreadbeliefthatU.S.marketsforNSC-basedsensorswillbelarge.However,basedonwhatlittleisknownaboutthesuitabilityofthesesensorsforparticularapplicationsandtheacceptanceofsensor-basednutrientmeasurementsbyregulatorsandmanagersmostintervieweeswerereluctantatthistimetotrytoquantifyhowmanyunitsthey,orothersinthemarketsegmentstheyrepresented,arelikelytopurchase.Typicalquestionstheythoughtwouldneedtobeansweredbeforeassessingthesizesofvariousmarketsegmentswererelatedtothefollowing:
• Accuracy,precision,andreliabilityofsensoroperationsinwaterwithdifferentsalinities,flowrates,sludgeorwastecontents,orsuspendedsolids
• Suitabilityforuseinvarioussettingsassociatedwithgroundwater,streams,rivers,lakes,estuaries,wetlands.
• Impactsofextremetemperaturesandsnowandicecoveronoperationanddurability• Size,portabilityanddeploymentandpositioningoranchoringrequirements• Datastorage,transmissionandintegration/communicationcapabilities,• Power,maintenance,andtechnicalsupportrequirements• Upfrontcosts,annualoperatingcostsandleasingoptions• Usefullife,resale/salvagevalue• Acceptabilityofmeasurements,andanalysesandinterpretationsofmeasurementsby
federalandstateregulatorsInformationthatcanbeusedtoaddresstheissueslistedabovewillbecomeavailableatlaterstagesintheNSCprocess.Untilthenitisnotpossibletoquantifythesizeofmarketsforin-
NutrientSensorChallengeEconomicWhitePaperACTMS-2015-01
6
waternutrientsensorswithanyprecision.Thepreliminaryestimatesoftheoverallsensormarketanddemandinspecificmarketsegmentsthatarepresentedinthispaperarebasedondataregardingtheoverallnumberofpotentialbuyersinvariousmarketsegmentsandinterviewswithrepresentativesofspecificmarketsegmentsregardingpossiblelevelsandratesofadoption.Theyareprovidedasaguideforgeneralplanningpurposesonly,andshouldberefinedregularlyasnewinformationbecomesavailableaboutthecharacteristicsofparticularNSC-basednutrientsensortechnologies,howtheymatchuserneedsinspecificmarketsegments,andhowthesemarketsareexpectedtorespondtochangesinregulations,researchneeds,competingtechnologies,andotherfactors.
Format Afterthisintroductionthepaperhasfoursections.Section2providessomecontextforassessingnutrientsensormarketsbydescribingthetypicalstagesoftechnologyandtechnologymarketdevelopment,andwherenutrientsensorsfallalongatypicaltechnologymarketdevelopmentcurve.Section3describesgeneralmarkettypesandspecificmarketsegmentsanddriversthatwilldeterminepotentialU.S.marketsfornutrientsensors.Section4presentspreliminaryestimatesofthepotentialsizeofoverallnutrientsensormarketsandspecificmarketsegmentsandhowactualmarketpotentialwillbeaffectedbyvariousratesandlevelsofadoption.Section5presentsthepotentiallong-termoutlookfornutrientsensormarketsrelatedtowaterqualityresearch,industrialapplications,andestablishingandmeetingregulatoryrequirements.Section6summarizesresults,presentssomeconclusions,offerscaveatsregardingtheuseofpreliminarymarketestimatespresentedinSection4,andidentifiessomeleadingindicatorsofnutrientsensormarketsthatshouldbemonitoredfromthispointforwardtohelppredictdemandinvariousmarketsegments.
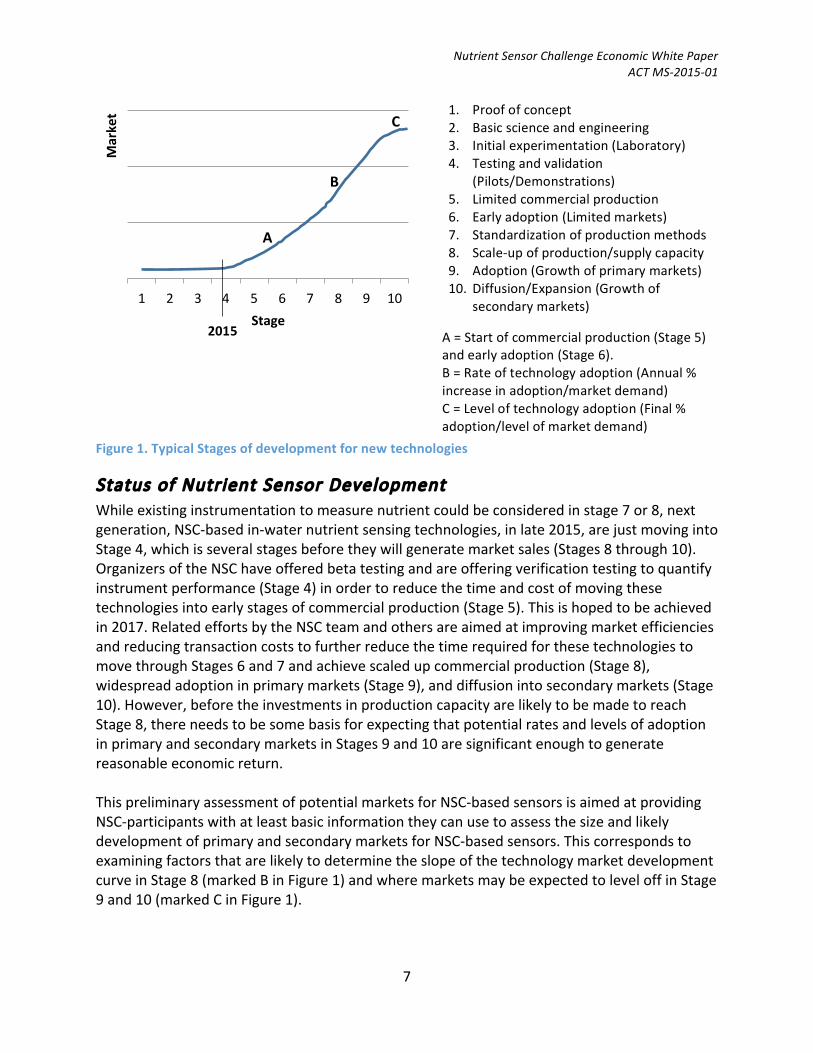
Section 2 Stages of Technology Market Development Mostnewtechnologies(e.g.,toolsandmethodsusedinheartsurgery,spaceexploration,micro-processing,andscientificinvestigation)tendtofollowasimilarsequenceofdevelopmentandadoption.Figure1showstentypicalstagesofdevelopmentfornewtechnologiesandtechnologymarketsdepictedalongatechnology/marketdevelopmentcurvewhichprovidesausefulwaytocharacterizeandtrackevolvingmarketsforNSC-basednutrientsensors.InFigure1newtechnologiesareshowntostartwithpreliminary“proofofconcept”research(Stage1)whichisfollowedbyresearchtoclarifytheunderlyingscientificandengineeringbasisofthetechnology(Stage2),andthenbysomeinitiallaboratory-basedexperimentationaimedatdeterminingifthetechnologycanmeetcertaintargets(Stage3).Ifthetechnologyseemscapableofmeetingcertaintargets,thisisfollowedbysomelimitedfieldtrials(Stage4)andthensomelimitedcommercialproduction(Stage5).Furtherrefinementsareoftenrequiredbasedontheexperiencesofearlyadopters(Stage6)whichisfollowedbythestandardizationofproductionmethods(Stage7)andthescalingupofcommercialproduction(Stage8).Thisallowsprimarymarketstodevelop(Stage9)andmayresultinfurtherrefinementsandadaptationstosupportthedevelopmentofsecondarymarkets(Stage10).
NutrientSensorChallengeEconomicWhitePaperACTMS-2015-01
7
Figure1.TypicalStagesofdevelopmentfornewtechnologies
Status of Nutrient Sensor Development Whileexistinginstrumentationtomeasurenutrientcouldbeconsideredinstage7or8,nextgeneration,NSC-basedin-waternutrientsensingtechnologies,inlate2015,arejustmovingintoStage4,whichisseveralstagesbeforetheywillgeneratemarketsales(Stages8through10).OrganizersoftheNSChaveofferedbetatestingandareofferingverificationtestingtoquantifyinstrumentperformance(Stage4)inordertoreducethetimeandcostofmovingthesetechnologiesintoearlystagesofcommercialproduction(Stage5).Thisishopedtobeachievedin2017.RelatedeffortsbytheNSCteamandothersareaimedatimprovingmarketefficienciesandreducingtransactioncoststofurtherreducethetimerequiredforthesetechnologiestomovethroughStages6and7andachievescaledupcommercialproduction(Stage8),widespreadadoptioninprimarymarkets(Stage9),anddiffusionintosecondarymarkets(Stage10).However,beforetheinvestmentsinproductioncapacityarelikelytobemadetoreachStage8,thereneedstobesomebasisforexpectingthatpotentialratesandlevelsofadoptioninprimaryandsecondarymarketsinStages9and10aresignificantenoughtogeneratereasonableeconomicreturn.ThispreliminaryassessmentofpotentialmarketsforNSC-basedsensorsisaimedatprovidingNSC-participantswithatleastbasicinformationtheycanusetoassessthesizeandlikelydevelopmentofprimaryandsecondarymarketsforNSC-basedsensors.ThiscorrespondstoexaminingfactorsthatarelikelytodeterminetheslopeofthetechnologymarketdevelopmentcurveinStage8(markedBinFigure1)andwheremarketsmaybeexpectedtoleveloffinStage9and10(markedCinFigure1).
1 2 3 4 5 6 7 8 9 10
Market
Stage2015
1. Proofofconcept2. Basicscienceandengineering3. Initialexperimentation(Laboratory)4. Testingandvalidation
(Pilots/Demonstrations)5. Limitedcommercialproduction6. Earlyadoption(Limitedmarkets)7. Standardizationofproductionmethods8. Scale-upofproduction/supplycapacity9. Adoption(Growthofprimarymarkets)10. Diffusion/Expansion(Growthof
secondarymarkets)
A=Startofcommercialproduction(Stage5)andearlyadoption(Stage6).B=Rateoftechnologyadoption(Annual%increaseinadoption/marketdemand)C=Leveloftechnologyadoption(Final%adoption/levelofmarketdemand)
A
B
C
NutrientSensorChallengeEconomicWhitePaperACTMS-2015-01
8
TheinformationpresentedherecannotbeusedtodeterminehowquicklythesetechnologieswillpassthroughStages4,5,6and7andreachStage8wheresensormarketsstarttodevelopandinvestmentsinsensortechnologiesstarttoyieldaneconomicreturn.However,otherNSC-basedinitiativesbeingundertakenoverthenexttwoyearsareaimedspecificallyatreducingthetimeandcostsassociatedwithmovingthesesensortechnologiesthroughthemostdifficultperiodofnewtechnologydevelopment(i.e.,Stages3,4,5,and6),andcreatingmorecertaintyabouthowmuchsensordemandcanbeexpectedatStages9and10.
Section 3 Market Overview
Market Types and Drivers Preliminaryinterviewsidentifiedseveraldifferenttypesofpotentialmarketsfornutrientsensorsthatcanbecategorizedgenerallyasbeingresearch-driven,regulation-driven,ordrivenbydemandtoimproveoperationalefficienciesandreducecostsinindustrialfacilities,suchaswaterresourcerecoveryfacilitiesordrinkingwatertreatmentplants.Forpurposesofcharacterizingthesemarketsandtheirlikelyadoptionrates,weassumed:
(1) marketdriversassociatedwithresearcharebasedonthedemandforinformationtounderstandanddescribenutrientproblemsandfindsolutions;
(2) marketdriversassociatedwithregulationarebasedondemandfornutrientmeasurementstodesignregulations,assessandcomparepractices,monitorcompliance,andtargetenforcement;and
(3) marketdriversassociatedwithprivatesectormarketsarebasedontheuseofnutrientsensorstomakeoperationsmoreefficientorreduceuncertaintyorcostsand/ormeetrequirementstoverifyandreportaboutcompliancewithwaterqualityornutrienttreatment/dischargeregulations.
Market Segments Withineachgeneralmarkettype-government,research,andindustry-weidentifiedseveraldistinctmarketsegmentsforNSC-basednutrientsensortechnologiesandusedavailabledataandresultsfrompreliminaryinterviewstoexaminethreefactorsthatwilldeterminetheirpotentialsize:
(1) themaximumnumberofentitiesinthemarketsectorthatmightbuy,(2) typicalnumbersofunitsthatwouldbepurchasedbyentitiesthatdobuy;and(3) rangesofpossibleadoptionrates(i.e.,thepercentofpotentialbuyerswhocanbe
expectedtobuy)Withineachmarketsegment,actualadoptionrateswillbedeterminedbytwofactors:hownutrientmeasurementscanbeusedtoimprovedecisionsinwaysthatreducecostsorrisksorincreasesomemeasureofbenefits(e.g.,revenues,productivity,nutrientdischargereductions,waterqualityimprovements,ecosystemservices);anddifferencesbetweenthecostofgeneratingnutrientmeasurementsusingNSC-basedsensortechnologiesandthecostofothermethods.NSCsensortargetfeatures(e.g.accuracy,precision,deploymentlength,etc.)were
NutrientSensorChallengeEconomicWhitePaperACTMS-2015-01
9
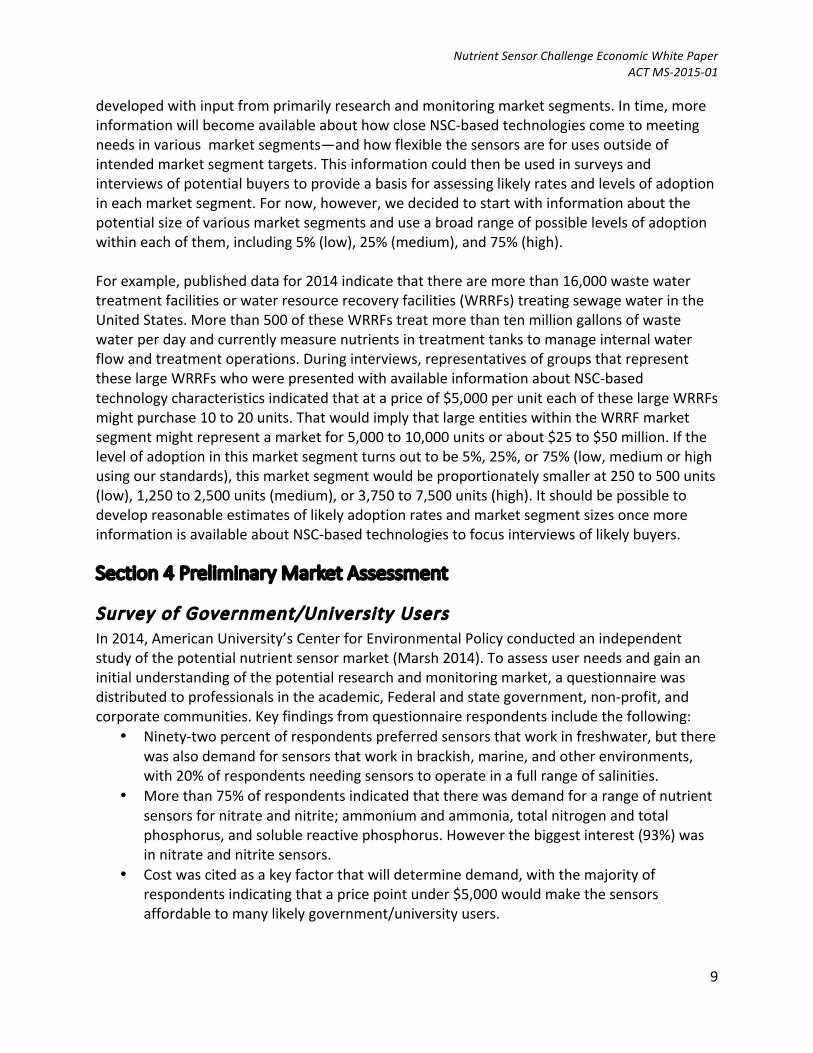
developedwithinputfromprimarilyresearchandmonitoringmarketsegments.Intime,moreinformationwillbecomeavailableabouthowcloseNSC-basedtechnologiescometomeetingneedsinvariousmarketsegments—andhowflexiblethesensorsareforusesoutsideofintendedmarketsegmenttargets.Thisinformationcouldthenbeusedinsurveysandinterviewsofpotentialbuyerstoprovideabasisforassessinglikelyratesandlevelsofadoptionineachmarketsegment.Fornow,however,wedecidedtostartwithinformationaboutthepotentialsizeofvariousmarketsegmentsanduseabroadrangeofpossiblelevelsofadoptionwithineachofthem,including5%(low),25%(medium),and75%(high).Forexample,publisheddatafor2014indicatethattherearemorethan16,000wastewatertreatmentfacilitiesorwaterresourcerecoveryfacilities(WRRFs)treatingsewagewaterintheUnitedStates.Morethan500oftheseWRRFstreatmorethantenmilliongallonsofwastewaterperdayandcurrentlymeasurenutrientsintreatmenttankstomanageinternalwaterflowandtreatmentoperations.Duringinterviews,representativesofgroupsthatrepresenttheselargeWRRFswhowerepresentedwithavailableinformationaboutNSC-basedtechnologycharacteristicsindicatedthatatapriceof$5,000peruniteachoftheselargeWRRFsmightpurchase10to20units.ThatwouldimplythatlargeentitieswithintheWRRFmarketsegmentmightrepresentamarketfor5,000to10,000unitsorabout$25to$50million.Ifthelevelofadoptioninthismarketsegmentturnsouttobe5%,25%,or75%(low,mediumorhighusingourstandards),thismarketsegmentwouldbeproportionatelysmallerat250to500units(low),1,250to2,500units(medium),or3,750to7,500units(high).ItshouldbepossibletodevelopreasonableestimatesoflikelyadoptionratesandmarketsegmentsizesoncemoreinformationisavailableaboutNSC-basedtechnologiestofocusinterviewsoflikelybuyers.
Section 4 Preliminary Market Assessment
Survey of Government/University Users In2014,AmericanUniversity’sCenterforEnvironmentalPolicyconductedanindependentstudyofthepotentialnutrientsensormarket(Marsh2014).Toassessuserneedsandgainaninitialunderstandingofthepotentialresearchandmonitoringmarket,aquestionnairewasdistributedtoprofessionalsintheacademic,Federalandstategovernment,non-profit,andcorporatecommunities.Keyfindingsfromquestionnairerespondentsincludethefollowing:
• Ninety-twopercentofrespondentspreferredsensorsthatworkinfreshwater,buttherewasalsodemandforsensorsthatworkinbrackish,marine,andotherenvironments,with20%ofrespondentsneedingsensorstooperateinafullrangeofsalinities.
• Morethan75%ofrespondentsindicatedthattherewasdemandforarangeofnutrientsensorsfornitrateandnitrite;ammoniumandammonia,totalnitrogenandtotalphosphorus,andsolublereactivephosphorus.Howeverthebiggestinterest(93%)wasinnitrateandnitritesensors.
• Costwascitedasakeyfactorthatwilldeterminedemand,withthemajorityofrespondentsindicatingthatapricepointunder$5,000wouldmakethesensorsaffordabletomanylikelygovernment/universityusers.
NutrientSensorChallengeEconomicWhitePaperACTMS-2015-01
10
Analysis of Potential Demand by Market Segment Thepotentialsizeofmarketsfornewtechnologiescanbeestimatedbydeterminingthenumbersofentitiesinvariousmarketsegmentsthatcouldbebuyers,andthenprojectinglevelsofadoptionineachmarketsegment(e.g.thepercentofpotentialbuyerswhowillactuallymakepurchases).Wheredataareavailable,ratesandlevelsofadoptionofatechnologycanoftenbebasedonestimatesofhowpotentialbuyersineachmarketsegmentcanusethetechnologytoreducecostsorrisks,orincreasesomemeasureofbenefits.ForuserswhoarerequiredtocollectandreportnutrientdataandcanuseNSC-basedtechnologiestolowercostresultingcostsavingscanprovideabasisforattachingamonetarymeasureofvaluetothesenewtechnologies.Insomecases,thesecostsavingscanbeusedtopredictadoptionratesandmarketdevelopmentfornewtechnologiesbyprojectingpaybackperiodsorreturnsoninvestmentthatusersinvariousmarketsegmentscanexpectwhentheypurchasethenewtechnology.Currently,however,nutrientsensorsprovideinformationthatisusedmostlytomakedecisionsthatgeneratepublicbenefits(e.g.,improvedwaterquality)thatcannotbetranslatedeasilyintomonetarymeasuresofvalueandcannotbeusedeffectivelytopredicthowmanybuyersexistinvariousmarketsegmentsandtheir“willingnesstopay”.Afterusinggenerallyavailablestatisticstoidentifythenumberofentitiesineachmarketsegment(e.g.,businesses,governmentagencies,researchinstitutions),weaskedintervieweesfamiliarwiththesemarketsegmentsgeneralquestionsabouthowtheuseofsensorsmightreducecostsand/orrisksorincreasesomemeasureofbenefitsfromtheperspectiveofdecision-makersineachmarketsegment.Answerstothesegeneralquestionsandsomequantitativeestimatesofmarketpotentialofferedbyintervieweesformedthebasisofourpreliminaryestimatesofpotentiallevelsofadoptioninvariousmarketsegments(seeAppendixforsummaryofinterviews).
Overview of Interview Results Preliminaryinterviewswithmorethan30representativesofdifferentmarketsegmentsindicatedthatlikelyratesandultimatelevelsofadoptionineachmarketsegmentaredifficulttoprojectatthepresenttimeforthefollowingreasons:
• Thetechnologiesarenotyetfullydeveloped.Demandinvariousmarketsegmentswilldependincriticalwaysonspecificproductcharacteristicsthathavenotyetbeendetermined.
• Fewindustrialorhouseholdsectorsusenutrientrelatedinformationtomakedecisionsthathavethepotentialtoreducecostsorrisks,orincreasebenefitsotherthanthoseassociatedwithdemonstratingcompliancewithgovernmentregulations.
• Althoughawarenessofnutrientproblemsandtheneedforregulatingnutrientdischargesisgrowing,thenatureofnutrient-relatedregulations,theirimplementationandenforcement,andcompliancemonitoringandreportingrequirementsarenotfullydeveloped.
NutrientSensorChallengeEconomicWhitePaperACTMS-2015-01
11
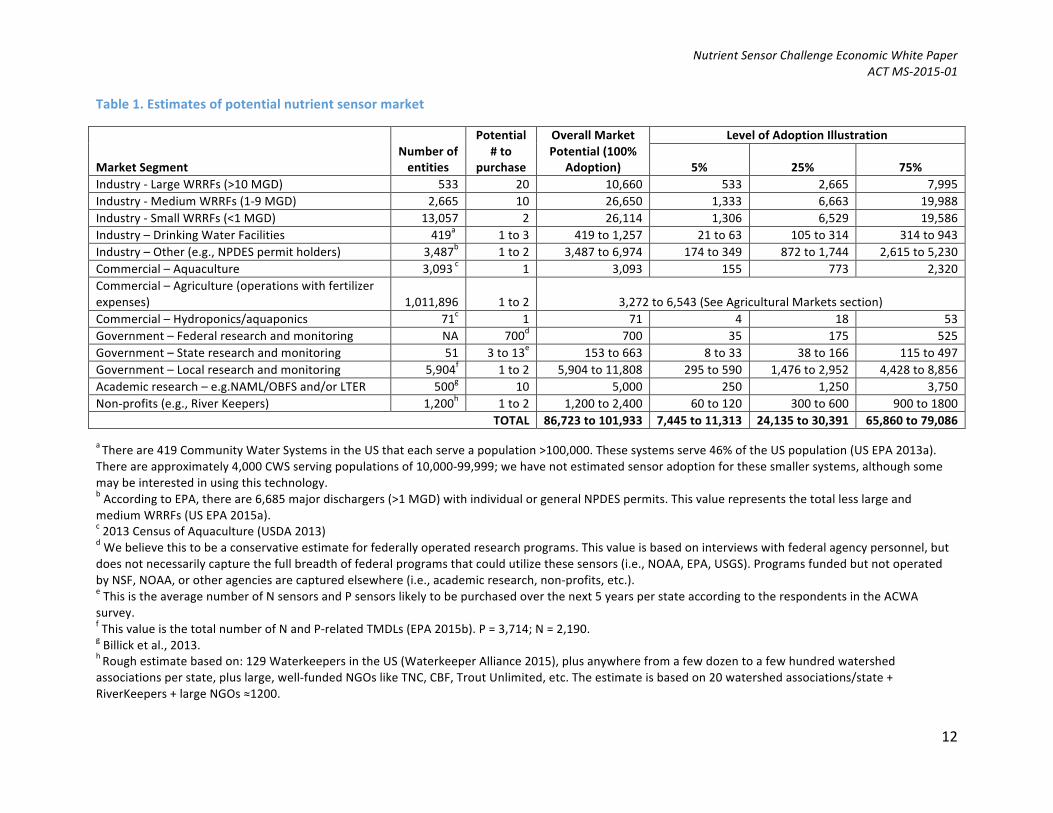
Results Table1presentspreliminaryestimatesofpotentialsizesofU.S.marketsforin-waternutrientsensorsbasedontheapproximatenumberofpotentialbuyersineachmarketsegment,interview-basedestimatesofthenumberofunitsthatmightbepurchasedbyindividualbuyersineachmarketsegments,andlow,mediumandhigh(5%,25%,and75%)levelsofadoption.Basedonthispreliminaryandverycrudecharacterizationofpotentialdemand,thepotentialmarketforin-waternutrientsensorsacrossallmarketsegmentsintheU.S.rangesfrom24,000to30,000ata25%adoptionrate.Atanaveragemarketpriceof$5,000perunitthisconstitutesapotentialU.S.marketof$120millionto$150million.NSCtargetfeaturesfornutrientsensortechnologiesweredeterminedbasedoninputfromrepresentativesofprimarilyresearchandmonitoringmarketsegments.Therefore,itispossiblethatsensorsdevelopedaspartoftheNSCmaylackfeaturesdesirableforcertainothermarketsegments(e.g.,aquaculture).Itispossible,therefore,thateventhelowadoptionrateestimatesforsomemarketsegmentsareoverlyoptimistic.Additionally,intervieweesfromsomemarketsegments(e.g.,non-profit)expressedinterestinpotentiallysharingsensors.Ifsensorsharingiswidespreadinthosemarketsegments,adoptionrateinthosesegmentswouldbesomewhatlower.InadditiontoU.S.markets,thesesensorshavepotentialforeignmarketsthatarelikelytobeatleastaslargeas,andmaybemanytimeslarger,thanU.S.markets.However,thispreliminaryreviewfocusedonlyonU.S.markets.DatatoprovideevenpreliminaryestimatesofpossibleorlikelyratesandlevelsofadoptionandmarketpenetrationofNSC-basedsensorsinvariousforeignmarketsegmentsarenotavailableatthistime.
NutrientSensorChallengeEconomicWhitePaperACTMS-2015-01
12
Table1.Estimatesofpotentialnutrientsensormarket
MarketSegmentNumberofentities
Potential#to
purchase
OverallMarketPotential(100%
Adoption)
LevelofAdoptionIllustration
5% 25% 75%Industry-LargeWRRFs(>10MGD) 533 20 10,660 533 2,665 7,995
Industry-MediumWRRFs(1-9MGD) 2,665 10 26,650 1,333 6,663 19,988
Industry-SmallWRRFs(<1MGD) 13,057 2 26,114 1,306 6,529 19,586
Industry–DrinkingWaterFacilities 419a 1to3 419to1,257 21to63 105to314 314to943
Industry–Other(e.g.,NPDESpermitholders) 3,487b 1to2 3,487to6,974 174to349 872to1,744 2,615to5,230
Commercial–Aquaculture 3,093c 1 3,093 155 773 2,320
Commercial–Agriculture(operationswithfertilizer
expenses) 1,011,896 1to2 3,272to6,543(SeeAgriculturalMarketssection)
Commercial–Hydroponics/aquaponics 71c 1 71 4 18 53
Government–Federalresearchandmonitoring NA 700d 700 35 175 525
Government–Stateresearchandmonitoring 51 3to13e 153to663 8to33 38to166 115to497
Government–Localresearchandmonitoring 5,904f 1to2 5,904to11,808 295to590 1,476to2,952 4,428to8,856
Academicresearch–e.g.NAML/OBFSand/orLTER 500g
10 5,000 250 1,250 3,750
Non-profits(e.g.,RiverKeepers) 1,200h 1to2 1,200to2,400 60to120 300to600 900to1800
TOTAL 86,723to101,933 7,445to11,313 24,135to30,391 65,860to79,086
aThereare419CommunityWaterSystemsintheUSthateachserveapopulation>100,000.Thesesystemsserve46%oftheUSpopulation(USEPA2013a).
Thereareapproximately4,000CWSservingpopulationsof10,000-99,999;wehavenotestimatedsensoradoptionforthesesmallersystems,althoughsome
maybeinterestedinusingthistechnology.bAccordingtoEPA,thereare6,685majordischargers(>1MGD)withindividualorgeneralNPDESpermits.Thisvaluerepresentsthetotallesslargeand
mediumWRRFs(USEPA2015a).c2013CensusofAquaculture(USDA2013)dWebelievethistobeaconservativeestimateforfederallyoperatedresearchprograms.Thisvalueisbasedoninterviewswithfederalagencypersonnel,but
doesnotnecessarilycapturethefullbreadthoffederalprogramsthatcouldutilizethesesensors(i.e.,NOAA,EPA,USGS).Programsfundedbutnotoperated
byNSF,NOAA,orotheragenciesarecapturedelsewhere(i.e.,academicresearch,non-profits,etc.).eThisistheaveragenumberofNsensorsandPsensorslikelytobepurchasedoverthenext5yearsperstateaccordingtotherespondentsintheACWA
survey.fThisvalueisthetotalnumberofNandP-relatedTMDLs(EPA2015b).P=3,714;N=2,190.gBillicketal.,2013.hRoughestimatebasedon:129WaterkeepersintheUS(WaterkeeperAlliance2015),plusanywherefromafewdozentoafewhundredwatershed
associationsperstate,pluslarge,well-fundedNGOslikeTNC,CBF,TroutUnlimited,etc.Theestimateisbasedon20watershedassociations/state+
RiverKeepers+largeNGOs≈1200.
NutrientSensorChallengeEconomicWhitePaperACTMS-2015-01
13
Agricultural markets – A special case The2012CensusofAgricultureestimatedatotalof1,011,896farmsoperatingintheU.S.withfertilizer-relatedexpenses,andthat,nationwide,fertilizer-relatedexpensesmakeup8.7%ofoverallfarmexpenses(USDA2014).Morethan327,000operations(32.3%)spend$10,000ormoreonfertilizerannually(withalmost72,000operationsspending$100,000ormore).Byallowingthemonitoringoftheamountofnutrientsthatrunofffarmfieldsintoadjacentwaterbodies,theuseofaffordable,accuratein-waternutrientsensorshasthepotentialtohelpfarmersapplyfertilizersmoreefficientlyandresultincost-savingsaswellaswaterqualityimprovements.However,manymethodsotherthanin-waternutrientsensorscanbeusedtogenerateinformationaboutin-soilnutrients,nutrientuptakebycrops,andnutrientrunoffinordertoadjustfertilizerapplications,optimizecropgrowth,managefertilizercosts,andreduceedge-of-fieldnutrientrunoff.Asaresult,itisnotpossibleatthistimetopredicthowmanyfarmsmaybesituatedinwaysthatmakein-waternutrientmonitoringuseful,ortopredicthowmanyfarmersmightpurchaselow-costin-waternutrientsensorsiftheywereavailable.However,itisreasonabletoexpectthatatleastasmallportionofU.S.agriculturaloperationswithfertilizerexpensesmaypurchaseorfinancethepurchaseofoneormoreNSC-basednutrientsensorsoncetheybecomeavailable,especiallyifthesensorswereabletobeusedtodocument“creditable”nutrientdischargereductionsaspartofnutrientcredittradingprograms.Forsakeofillustration,assumethat1%ofoperationswithgreaterthan$10,000inannualfertilizerexpenseswillpurchaseoneortwosensorstoimprovefertilizerapplicationdecisions.Thislevelofadoptionwouldresultinthesaleof3,272to6,543unitswhich,ataunitpriceof$5,000,wouldrepresentamarketsegmentworth$16.4millionto$32.7million.
Section 5 Long-term Market Outlook Theprevioussectionfocusedonpotentialmarketsforin-waternutrientsensorsbasedontheirexpectedcapacitytooutcompeteothermethodsofmeasuringnutrientsinexistingU.S.markets,andthelikelihoodthattheirreliabilityandlowcostwillcausethoseexistingU.S.marketstogrow.Inconventionaleconomicterms,thesereflectbothoutwardmovementsalongthedemandcurveinexistingmarkets(demandincreasingbecauseofdeclinesinprice)aswellasanexpectedupwardshiftinthedemandcurveinthosemarkets(moredemandatanygivenprice).However,manyintervieweesindicatedthattheybelievedtheavailabilityofreliable,lowcostin-waternutrientsensorswillresultinthedevelopmentoftotallynewandpotentiallylargemarkets.Forexample,undersection303(d)oftheCleanWaterAct,allstatesmustdeveloplistsofimpairedwaterbodies(i.e.,thosethatdonotmeettheirdesignatedusecriteriaduetooneormorepollutants),anddevelopTMDLs(TotalMaximumDailyLoads)forrelevantpollutantsbeingdischargedintothesewaterbodies.Ofthe68,496TMDLscurrentlybeingdevelopednationwide,6,047specifylimitsonnutrientdischarges(USEPA2015b).Asaresult,manystatesandcountiesarebeingrequiredtodescribewhatchangesinlandandwateruseandother
NutrientSensorChallengeEconomicWhitePaperACTMS-2015-01
14
managementpracticestheyplantoundertaketomeettheirallocatednutrientdischargereductiontargetsandshowthattheyareorwillbeeffective.IntheChesapeakeBaywatershed,forexample,anoverallTMDLfortheBaywasestablishedbyEPAinDecember2010thatsetsoverallannuallimitsof185.9millionpoundsofnitrogenand12.5millionpoundsofphosphorusenteringthewatershed(USEPA2013b).ThisoverallTMDL,whichistobeachievedby2025,wassubsequentlydividedinto92TMDLsforspecificriverbasins.Thesevenjurisdictionsthatmakeupthewatershed(Delaware,Maryland,NewYork,Pennsylvania,Virginia,WestVirginia,andWashington,DC)haveeachdevelopedWatershedImplementationPlans(WIPs),andassignedspecificnutrientdischargereductiongoalstoindividualcountiesand/orsectors(e.g.,wastewater,agriculture,forestry,etc.).OnesignificantproblemfacingcountygovernmentsandotherjurisdictionsintheregionthathavedevelopedoraredevelopingWIPsisthatthecostofimplementingthemhasbeenestimatedformanyjurisdictionstobeinthehundredsofmillionsorevenbillionsofdollars.AspartofitsPhaseIIWIP,forexample,Marylandestimatedin2012thatthecostofachievingitstargetnitrogen,phosphorus,andsedimentreductionsby2025wouldbeabout$14.4billiondollars(UniversityofMarylandetal.2012).ArelatedproblemiswidespreaduncertaintyaboutestimatesofWIPimplementationcostsbecauseofsignificantuncertaintyaboutwhattypesofprojectsinwhatlocationswillbemosteffectiveatreducingnutrientdischargesandhelpingachieveTMDLtargets.Onecauseofuncertaintyaboutcost-effectiveprojectstoachieveTMDLtargetsisthefactthatthehighcostofmeasuringnutrientshasresultedinmostjurisdictionsusingestimatesoftheeffectivenessofnutrientreductionoptions(e.g.,bestmanagementpracticesorBMPs)thatarebasedongenerallyaccepted“BMPefficiencies.”TheseBMPefficiencieswereoftenestimatedbasedonaveragesiteconditionsandlandscapecontextsacrossthewatershedoronmodelingresultsratherthanlocation-specificinformationfromwithineachjurisdiction(seeStateandLocalResearchandMonitoringProgramsintheAppendixformoreinformation).ThehighcostofobtainingnutrientmeasurementshasalsoresultedinstatesandcountiesnothavingsufficientdatatojustifyandvalidatethebasisforestablishinginnovativenutrientdischargetreatmentandoffsetandcredittradingprogramsthatcouldbeusedtoreducethecostofmeetingTMDLnutrientdischargetargets.Havinglocation-specificnutrientdatatodeterminewhereBMPsaremostcost-effectiveandleastcost-effectiveratherthanusingaveragevaluesoveralllocationsormodelresultshasthepotentialtoresultincountiesandstatesachievingsignificantcostsavingsandmakingitmorelikelythattheywillbeabletoachieveTMDLtargets.
Potential cost savings - the 1% rule Basedonpreliminaryinterviews,itisreasonabletoassumethatstateandcountygovernmentscouldusemorereliable,low-cost,location-specificnutrientmeasurementstoidentifycost-effectivewaysofmeetingTMDLtargets,validatetheresultsoftheirnutrientdischargereductionefforts,anddesignandmanageotherlocation-specificwaterqualityandhabitatimprovementprojects.However,sincepotentialcostsavingsfromusingsensorscannotbemeasuredatthistime,itisnotpossibletopredictifandwhengovernmentagenciesmaydecide
NutrientSensorChallengeEconomicWhitePaperACTMS-2015-01
15
topurchasesensorsortopurchasenutrientmeasurementdataprovidedbycontractorswhowillproducethemusingNSC-basedsensors.Ratherthanignorethisuncertainbutsignificantlong-termmarketpotentialitseemsreasonabletouseaconventionalruleofthumbthathasbeenusedinmanysimilarsituations,whichisthatsignificantimprovementsininformationthatformthebasisofproductionandinvestmentdecisionscanbeexpectedtoresultincostsavingsequaltoabout1%(Nordhaus1986).Forexample,ifinvestmentsrequiredtomeettheStateofMaryland’snutrient-relatedTMDLtargetsaccountforabouthalfofthestate’sestimatedWIPcosts,orabout$7billionovertenyears,applyingthis1%ruleimplies,hypothetically,thataveragecostsavingsassociatedwithimprovementsinin-waternutrientmeasurementstohelptarget,design,andvalidatenutrientdischargereductionswouldbeworthabout$70million.Hypothetically,similarcostsavingsmightbeexpectedinotherstatesintheBaywatershedandinotherwatershedsacrosstheU.S.whereinvestmentsoftensofbillionsofdollarswillbemadeoverthenexttenyearsorsotomeetnutrient-relatedTMDLtargets.The1%costsavingsexercisedescribedaboveobviouslyprovidesnohardpredictionaboutlong-termin-waternutrientsensormarkets,andabsolutelynoevidencethatthesearchforlesscostlywaystoimplementWIPsandachieveTMDLgoalswillresultinsignificantnewmarketsfornutrientmeasurementsorNSC-basednutrientsensors.However,itdoesprovidesomecontextforconsideringthepotentialimpactofpotentiallong-termdriverofmarketsfornutrientsensors.Ataunitpriceof$5,000forNSC-basedsensors,itisreasonabletoexpectthatmanygovernmentagencieswilldeterminethatpurchasingthemandusingthemtoimprovethemixofmanagementpracticesbeingusedtomeetTMDLtargetswillresultinsignificantcostsavings.InmanycasesthiswillresultinapositiveeconomicreturnfrominvestinginNRC-basedsensors.Interviewssuggestthatthisformsthebasisofahighlyfavorablelong-termoutlookforthesesensorsintheseregulation-drivenU.S.markets.Similarnutrientpollutionproblemsaroundtheworldindicatethatsimilarmarketdriversmayresultinsignificantlong-termmarketpotentialoutsideoftheU.S.
Potential Cost Savings – Using Cost-effectiveness and Incremental Cost Analysis BecauseWIPswillbecostlytoimplement,mostjurisdictionsintheChesapeakeBaywatershedandelsewherethataredevelopingWIPswillbeusingsometypeofcost-effectivenessanalysis(CEA)tocompareoptions,andsometypeofincrementalcostanalysis(ICA)todeterminehowtoprioritizeoptionsinordertominimizecostsastheyattempt,overtime,tomeettheirnutrientdischargereductiontargets.ForplanningpurposesmostofthesejurisdictionswillhavesomestandardmeasuresoftheunitcostsofBMPs(e.g.,costperacreorstreammileorleveloftreatment)andwillusethemwith“BMPefficiencies”toassessandcomparethecost-effectivenessofBMPoptions.However,withinastateandwithincounties,theeffectivenessofimplementinganyparticularBMP(e.g.,%reductioninnutrientdischarges)willrangearoundstandardmeasuresof“BMPefficiencies”
NutrientSensorChallengeEconomicWhitePaperACTMS-2015-01
16
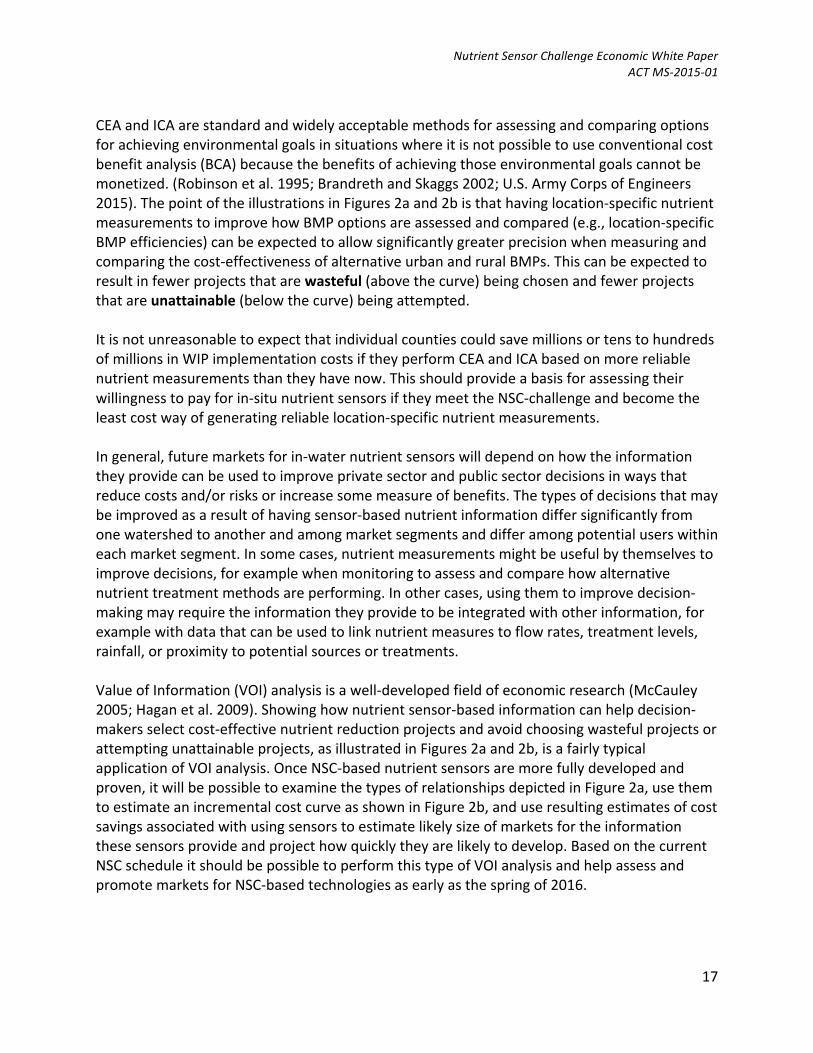
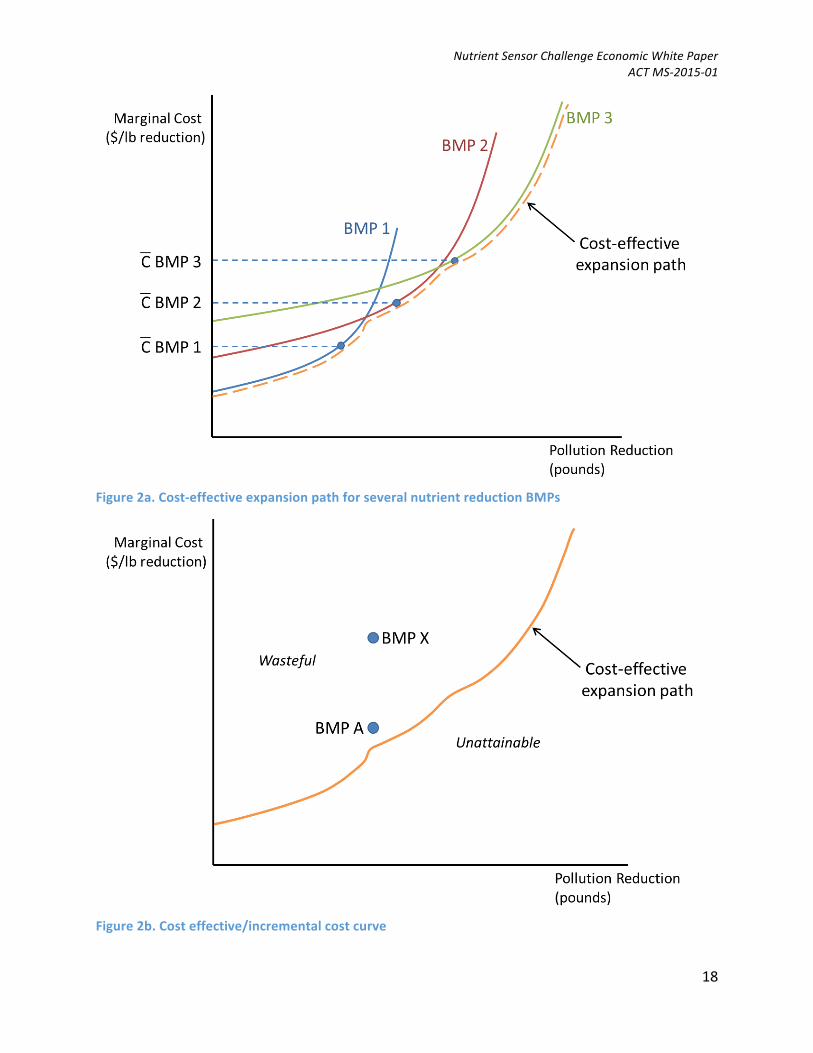
withBMPsundertakenatfavorablesitesachievinggreaterthanaverageresults,andatunfavorablesitesachievinglowerthanaverageresults.Ifinformationisavailabletoselectthemostfavorablesitesfirst,the“marginal”costofimplementinganygivenBMPwillincreasefrombelowaveragetoaboveaverageasaBMPisappliedatmoresites.Asaresult,havinginformationaboutlocationswhereBMPscanbeexpectedtobemoreorlesseffectivecanresultintheselectionofamorecost-effectiveormore“optimal”mixofBMPsforimplementingcountyWIPS.UseofChallenge-basednutrientsensorsmightalsoindicatethatBMPsaredemonstrablymoreefficientatcertaintimesorduringcertainweatherconditions.ThisisillustratedinFigure2aandb,whichpresentsoverlappingmarginalcostcurvesforthreeBMPs.TheindividualcostcurvesforeachBMPshowthemappliedfirstatfavorablesiteswithrelativelylowcosts,andthenbeingappliedatlessfavorablesiteswithincrementallyhighercosts.AsFigure2aillustrates,itispossible,andinsomecaseslikely,thatapplyingBMPswithhigheraverageunitcostsatsomesiteswithespeciallyfavorableconditionsthatmakethemmoreeffectivewillbemorecost-effectivethanapplyingsomeotherBMPwithamuchloweraverageunitcostatsomedifficultandrelativelycostlysite.ThedashedcurveonFigure2aconnectsthelowestcostcombinationofBMPsforachievingincrementallyhigherlevelsofnutrientdischargereductionandrepresentstheleastcost“expansionpath”orwhatisoftencalledan“incrementalcosteffectivenesscurve.”Estimatingthiscurve,whichdepictsthemostcost-effectivewaytomeetTMDLtargets,requiresmeasuringdifferencesinhowsiteconditionsandlandscapecontextsinfluencetheeffectivenessofvariousBMPsatreducingnutrientdischarges.Estimatingthisleastcostincrementalcostcurveandjustifyinginvestmentsthataredeterminedtobeonthiscurverequiresmorelocation-specificnutrientmeasurementsthanaregenerallyavailableatthecurrenttime.ThecurvepresentedinFigure2bdepictsthecombinationofleastcostoptionsdepictedbythethickcurveinFigure2a.Thisisthe“optimalexpansionpath”or“cost-effective/incrementalcostcurve”forusingBMPstoachieveanyparticularlevelofnutrientdischargereduction.BasedonincreasingmarginalcostsofreducingnutrientdischargesusingeachtypeofBMP,asshowninFigure2a,thiscurvecanbeexpectedtoinvolveamixofBMPsthatincludessomewithrelativelyhighaveragecostsimplementedatfavorablesiteswherecostsarenotonlybelowaverage,butlowerthanthecostofimplementingaBMPwithloweraverageunitcostthatcanonlybeappliedatarelativelyexpensivesite.Figure2billustratesthecostsavingsofnotrelyingonaverageortypicalBMPefficienciesandhowlocation-specificnutrientmeasurementscanbeusedtoreducethecostofachievingvariousnutrientdischargereductiontargets.BMPswithcombinationsofcostsandnutrientreductionsthatfallabovetheincrementalcostcurve(e.g.,BMPX)arewastefulbecauseanotheroption(e.g.,BMPA)isalowercostwaytoachievethesamelevelofnutrientreduction.ProjectsthatfallbelowthecurveinFigure2baredesignatedasunattainablebecauseifaprojectwasavailablethatachievedthesameincrementalreductioninnutrientdischargesasaprojectonthecurveatalowercost,itwouldreplacethatprojectonthecurveandtheprojectcurrentlyonthecurvewouldbeabovethecurveandclassifiedaswasteful.
NutrientSensorChallengeEconomicWhitePaperACTMS-2015-01
17
CEAandICAarestandardandwidelyacceptablemethodsforassessingandcomparingoptionsforachievingenvironmentalgoalsinsituationswhereitisnotpossibletouseconventionalcostbenefitanalysis(BCA)becausethebenefitsofachievingthoseenvironmentalgoalscannotbemonetized.(Robinsonetal.1995;BrandrethandSkaggs2002;U.S.ArmyCorpsofEngineers2015).ThepointoftheillustrationsinFigures2aand2bisthathavinglocation-specificnutrientmeasurementstoimprovehowBMPoptionsareassessedandcompared(e.g.,location-specificBMPefficiencies)canbeexpectedtoallowsignificantlygreaterprecisionwhenmeasuringandcomparingthecost-effectivenessofalternativeurbanandruralBMPs.Thiscanbeexpectedtoresultinfewerprojectsthatarewasteful(abovethecurve)beingchosenandfewerprojectsthatareunattainable(belowthecurve)beingattempted.ItisnotunreasonabletoexpectthatindividualcountiescouldsavemillionsortenstohundredsofmillionsinWIPimplementationcostsiftheyperformCEAandICAbasedonmorereliablenutrientmeasurementsthantheyhavenow.Thisshouldprovideabasisforassessingtheirwillingnesstopayforin-situnutrientsensorsiftheymeettheNSC-challengeandbecometheleastcostwayofgeneratingreliablelocation-specificnutrientmeasurements.Ingeneral,futuremarketsforin-waternutrientsensorswilldependonhowtheinformationtheyprovidecanbeusedtoimproveprivatesectorandpublicsectordecisionsinwaysthatreducecostsand/orrisksorincreasesomemeasureofbenefits.Thetypesofdecisionsthatmaybeimprovedasaresultofhavingsensor-basednutrientinformationdiffersignificantlyfromonewatershedtoanotherandamongmarketsegmentsanddifferamongpotentialuserswithineachmarketsegment.Insomecases,nutrientmeasurementsmightbeusefulbythemselvestoimprovedecisions,forexamplewhenmonitoringtoassessandcomparehowalternativenutrienttreatmentmethodsareperforming.Inothercases,usingthemtoimprovedecision-makingmayrequiretheinformationtheyprovidetobeintegratedwithotherinformation,forexamplewithdatathatcanbeusedtolinknutrientmeasurestoflowrates,treatmentlevels,rainfall,orproximitytopotentialsourcesortreatments.ValueofInformation(VOI)analysisisawell-developedfieldofeconomicresearch(McCauley2005;Haganetal.2009).Showinghownutrientsensor-basedinformationcanhelpdecision-makersselectcost-effectivenutrientreductionprojectsandavoidchoosingwastefulprojectsorattemptingunattainableprojects,asillustratedinFigures2aand2b,isafairlytypicalapplicationofVOIanalysis.OnceNSC-basednutrientsensorsaremorefullydevelopedandproven,itwillbepossibletoexaminethetypesofrelationshipsdepictedinFigure2a,usethemtoestimateanincrementalcostcurveasshowninFigure2b,anduseresultingestimatesofcostsavingsassociatedwithusingsensorstoestimatelikelysizeofmarketsfortheinformationthesesensorsprovideandprojecthowquicklytheyarelikelytodevelop.BasedonthecurrentNSCscheduleitshouldbepossibletoperformthistypeofVOIanalysisandhelpassessandpromotemarketsforNSC-basedtechnologiesasearlyasthespringof2016.
NutrientSensorChallengeEconomicWhitePaperACTMS-2015-01
18
Figure2a.Cost-effectiveexpansionpathforseveralnutrientreductionBMPs
Figure2b.Costeffective/incrementalcostcurve
NutrientSensorChallengeEconomicWhitePaperACTMS-2015-01
19
References BillickI.,IBabb,B.Kloeppel,J.C.Leong,J.Hodder,J.Sanders,andH.Swain.2013.FieldStationsandMarineLaboratoriesoftheFuture:AStrategicVision.NationalAssociationofMarineLaboratoriesandOrganizationsofBiologicalFieldStations.Availableonlineat:www.obfs.org/fsml-futureBrandreth,B.andL.L.Skaggs.2002.LessonsLearnedfromCostEffectivenessandIncrementalCostAnalyses:FinalReport.U.S.ArmyCorpsofEngineersInvestmentandManagementDecisionMakingResearchProgram.IWRReport02-R-5.Availableonlineat:http://www.iwr.usace.army.mil/Portals/70/docs/iwrreports/02r5cost_eff.pdfChesapeakeBayProgram.2015.ProtocolfortheDevelopment,Review,andApprovalofLoadingandEffectivenessEstimatesforNutrientandSedimentControlsintheChesapeakeBayWatershedModel.Availableonlineat:http://www.chesapeakebay.net/documents/CBP_BMP_Expert_Panel_Protocol_WQGIT_approved_7.13.15.pdfHagan,P.,D.KingandE.Price.2009.Increasinguseandgrowingvalueofoceanobservingsystemsinfisheries:withillustrationsfromtheU.S.Mid-Atlantic(MARCOOS)region.Marsh,AnneS.2014.IdentifyingMarketSpecificationsforAffordableNutrientSensorTechnology:UserNeedsStudy.Availableonlineat:http://www.american.edu/spa/cep/projects/upload/Sensor-Needs-Report_Final.pdfMacauley,Molly.2005.TheValueofInformation:ABackgroundPaperonMeasuringtheContributionofSpace-DerivedEarthScienceDatatoNaturalResourceManagement.RFFDiscussionPaper05-26.Nordhaus,WilliamD.1986."TheValueofInformation,"inRichardKrasnow,ed.,PolicyAspectsofClimateForecasting(Washington,DC,ResourcesfortheFuture),RFFProceedings,March4,129-134.Robinson,Ridgley,WilliamHansenandKennethOrth.1995.EvaluationofEnvironmentalInvestmentsProceduresManualInterim:CostEffectivenessandIncrementalCostAnalysis.U.S.ArmyCorpsofEngineersWaterResourcesSupportCenter,InstituteforWaterResourcesReport95-R-1.Availableonlineat:http://planning.usace.army.mil/toolbox/library/IWRServer/95r01.pdfSchueler,Tom,CeceliaLaneandBillStack.2014.RecommendationsoftheExpertPaneltoDefineRemovalRatesfortheEliminationofDiscoveredNutrientDischargesfromGreyInfrastructure.Availableonlineat:http://www.chesapeakebay.net/documents/GREY_INFRASTRUCTURE_Expert_Panel_Report_FINAL_LONG.pdf
NutrientSensorChallengeEconomicWhitePaperACTMS-2015-01
20
U.S.ArmyCorpsofEngineersChicagoDistrict.2015.BubblyCreek,SouthBranchoftheChicagoRiver,IllinoisIntegratedFeasibilityReportandEnvironmentalAssessment.Availableonlineat:http://www.lrc.usace.army.mil/Portals/36/docs/projects/bubblycreek/Bubbly_Creek_NEPA%20public%20comment%20report_14%20Apr%202015.pdfUSDA.2013.2013CensusofAquaculture.NationalAgriculturalStatisticsService.Availableonlineat:http://www.agcensus.usda.gov/Publications/2012/Online_Resources/Aquaculture/USDA.2014.2012CensusofAgricultureQuickStats.Availableonlineat:http://quickstats.nass.usda.gov/USEPA.2013a.FiscalYear2011DrinkingWaterandGroundWaterStatistics.OfficeofWater.March2013.Availableonlineat:http://water.epa.gov/scitech/datait/databases/drink/sdwisfed/upload/epa816r13003.pdfUSEPA.2013b.FactSheet:ChesapeakeBayTotalMaximumDailyLoad(TMDL):DrivingActionstoCleanLocalWatersandtheChesapeakeBay.Availableonlineat:http://www.epa.gov/reg3wapd/pdf/pdf_chesbay/BayTMDLFactSheet8_26_13.pdfUSEPA.2015a.ActiontowardsLimitingTotalNitrogen,TotalPhosphorus,andTotalInorganicNitrogenLoadsfromNPDES-PermittedFacilities.Availableonlineat:http://www2.epa.gov/nutrient-policy-data/action-towards-limiting-total-nitrogen-total-phosphorus-and-total-inorganicUSEPA.2015b.NationalSummaryofImpairedWatersandTMDLInformationwebsite.Availableonlineat:http://iaspub.epa.gov/waters10/attains_nation_cy.control?p_report_type=TUniversityofMaryland,MarylandDepartmentofPlanning,MarylandDepartmentofAgriculture,MarylandDepartmentoftheEnvironment,andMarylandDepartmentofNaturalResources.2012.Maryland’sPhaseIIWatershedImplementationPlanfortheChesapeakeBayTMDL.Availableonlineat:http://www.mde.state.md.us/programs/Water/TMDL/TMDLImplementation/Pages/FINAL_PhaseII_WIPDocument_Main.aspxWaterkeeperAlliance.2015.WaterkeeperAlliancewebsite.http://waterkeeper.org
NutrientSensorChallengeEconomicWhitePaperACTMS-2015-01
21
Appendix: Interview Notes Thesectionsbelowprovidebriefdescriptionsofsomeoftheinterviewsweconductedaspartofthisproject.
Industry Market Segments Apotentiallysignificantmarketsegmentfornutrientsensorsincludesindustrialwatertreatmentfacilities,includingwaterresourcerecoveryfacilities(WRRFs)treatingsewage;drinkingwatertreatmentplants;andothersourcesofnutrientdischargesthatarecoveredbyNPDESpermits.Waterresourcerecoveryfacilitiesrepresentperhapsthelargestmarketfornutrientsensorswithdemandbasedonbothpermitcomplianceandreportingrequirementsandinternalprocesscontrolpurposes.TheestimatesprovidedinTable1shouldbeusedwithcaution,however,becauseourinitialinterviewswithWWRFrepresentativesrevealedarangeofopinionsaboutpotentialusesand/oreffectivenessofin-waternutrientsensorsintheseoperations.OneseniormanagerofamajorWRRF(treatingmorethan10milliongallonsperday)suggestedthatnutrientsensorsmeetingchallengerequirementswouldhavehugepotentialnotonlyforregulatorycompliance,butalsoforinternalprocesscontrol.Currently,theWRRFthisindividualmanagesconductson-siteanalysisofnutrientdatacollectedusingprobesthatcostabout$60,000andrequireexpensivemaintenance.IfChallenge-basedsensorsprovetohavethelinearrangeandanti-biofoulingmechanismsrequiredbytheseapplications,theywouldnotonlyreduceup-frontandmaintenancecosts,butwouldsavesignificantoperatortime,freeingupthatstafftimetofocusmoreeffectivelyonprocesscontrol.SeveralcontactsandintervieweesassociatedwithWRRFnotedthattherewillbearangeofpotentiallevelsofadoptionbasedongeography,withsomeareasofthecountry,suchastheGreatLakesandChesapeakeBaywatersheds,likelytohavemoreregulatorydriversofdemandthanotherpartsofthecountry.Onemanagernotedthatnon-coastalorGreatLakesareasofthecountrywithWRRFsreleasingdischargesintosmaller,moresensitivebodiesofwatermighthavehigherincentivetogathermoretimelyinformationforprocesscontrolpurposesthanWRRFsoperatinginotherareaswherereceivingwaterbodiesarelarger,havestrongtidalflushes,orcontainhabitatsandecosystemsthataregenerallylesssensitivetonutrientdischarges
Drinking Water Faci l it ies Thedrinkingwatertreatmentsectorisdifficulttocharacterize,foranumberofreasons.Nitrateisabigconcernformanydrinkingwaterfacilitiesinvariousareasofthecountry,includingonesusinggroundwaterorsurfacewatersources,aselevatedlevelsofnitratehavebeenlinkedtoblue-babysyndrome.Inotherareas,elevatedphosphoruslevelshaveresultedinharmfulalgalbloomsaffectingdrinkingwatersupply.Whilerelativelylargesystemsthatprovidewatertopopulationsof100,000ormore(morethan400systemsnationwide)aretypicallytreating
NutrientSensorChallengeEconomicWhitePaperACTMS-2015-01
22
surfacewater,therearemanymorerelativelysmallfacilities(morethan4,000nationwide)providingservicetopopulationsinthe10,000to99,000range,whichtypicallyusegroundwatersources.Nutrientmonitoringneedsdiffersignificantlybetweenthesetwogroupsandwithineachgroupbasedonregionaldifferencesinlandscapeconditionsandregulatorycontexts.Oneexecutiveofalargemulti-locationfacilitytreatingsurfacewaterinaMidweststatenotedthatdatafromChallenge-basedsensorsdeployednearthesefacilitieswouldbeagreatsupplementtodatatheyalreadyobtainfromUSGSsensorslocatedupstream.WatertestedbytheseUSGSsensorshasatraveltimeofthreetoeightdaysbeforeitreachestreatmentfacilities.Additionalsensorsincloserproximitytothefacilitiesandonselectedtributarieswouldhelpcharacterizeabroaderrangeoffacility-basedwaterqualitycontroloptions.Thepotentialforuseofsensorswithinthefacilitiesthemselvesdependstoalargedegreeonthetypeofwatertreatmentthatistakingplace.Reverseosmosistreatment,forexample,wouldnotrequiresensors,asthetreatmentremovesnitrate,butothertreatmentmethodswouldbenefitfromlocationspecificnutrientmeasurementswithintankstohelpoptimizewaterflowandtreatment.Useofsensorsforgroundwatermonitoringmightincreasedemandinthismarketsegment,butanindustryexecutivepointedoutthatthisdependstoalargedegreeonregulatorychanges,asgroundwaterhaslargelybeenleftalonebyregulators.
Commercial Market Segments Interviewswithrepresentativesofsectorswithpotentialcommercialapplicationsforin-waternutrientsensorsrevealedavarietyofpotentialuses.Oneintervieweewasaresearcherworkingonthedesignandoperatingproceduresforoysteraquaculture.Henotedthatcurrentlyoysteraquacultureisconsideredbyfederalregulatorstobea“ClassIIIBMP”andinordertogeneratemarketablecreditstosellinanutrientcredittradingprogramwouldneedto“moveup”toa“ClassIBMP”.TheintervieweesawpotentialforoystergrowerstouseNSC-basedsensorstoverifytheirnutrientdischargereductionsandthenutrientremovalpropertiesofoystersinordertoachievethisdesignationchangewhichwouldfacilitatethedirectinvolvementofoysteraquacultureinthistypeoftradingandgeneratenewincomesourcesforaquaculturebusinesses.Individualswhorepresentdifferentpartsofthecommercialfinfishaquacultureindustrywerealsointerviewed.Priortotheseinterviews,weenvisionedtwopotentialusesofNSC-basedsensorsinaquacultureoperations:monitoringwaterqualityforfishhealthandimproveproductquality,andmonitoringdischargetomeetregulatoryrequirements.Inmostaquaculturefarms,however,dissolvedoxygenandammonianeedtobemonitored,butnitrateisnotasmuchofaconcern.Dischargepracticesvarywithdifferenttypesoffarms(e.g.,ponds,recirculatingsystems,etc.)andgovernment-mandatedmonitoringandreportingrequirementsvaryindifferentregionsoftheU.S.Thereisanaquaculture-basedmarketforthetypeofin-waternutrientsensorsbeingdevelopedaspartoftheChallenge,butpredictingthesizeofthismarketisverydifficultatthepresenttime.
NutrientSensorChallengeEconomicWhitePaperACTMS-2015-01
23
Twopeoplewereinterviewedregardingpotentialuseofin-waternutrientsensorsinhydroponicandaquaponicsapplications.Althoughtheoverallmarketinthesesectorsissmall,bothintervieweessawpotentialusesforNSC-basedsensors.Inahydroponicoperationwherefertilizerisstoredinlargetanks,nutrientlevelsarecurrentlyestimatedthroughelectricalconductivity.Auniversityresearcherspeculatedthatmorefrequentandaccuratemeasuresofnutrientconcentrationcouldyieldmoregrowthandabetterqualityproduct,therebyhavingapositiveimpactonprofits.Aquaponicsiscurrentlyasmallbutrapidlydevelopingindustrysectorandpotentialsensormarket.Oneinterviewee,amemberofanationalaquaponicsassociation,indicatedthatinafewyears,whengovernmentfoodsafetyauditstandardsforthissectorarefinalized,theaquaponicssectorcouldgrowsignificantlyasfarmerslooktodiversifytheiroperationsinwaysthatmitigatetheuncertainimpactsofchangesinprecipitationregimesandfloodthreatsthatareexpectedtoaccompanyclimatechange.
Government Market Segments
Federal Research and Monitoring Programs Federalresearchandmonitoringprograms,suchasthoseconductedbyUSGS,EPA,andNOAA,representasignificantsourceofpotentialdemandforNSC-basedsensors.Oneintervieweenotedinparticularthatthelowerpricepointtargetedbythechallengeiscritical,notonlyforFederalprograms,butforacademicandnon-profitinstitutionsaswell.Manypotentialusesofthesesensorsforresearchandmonitoringbyuniversities,non-profitsandfor-profitcompanieswillalsobefundedbyfederalgrantsandcontracts.
State and Local Research and Monitoring Programs Withmorethan6,000nutrientTMDLsnationwide,thereisanincreasingneedforstateandlocaljurisdictionsinareassubjecttoTMDLs,suchasthoseintheChesapeakeBaywatershed,togainabetterunderstandingofnutrientsources.OneexpertintheChesapeakeBayregionemphasizedthatfindingandremovingorreducingsourcesofnutrientdischargesmayhaveTMDL-creditbenefitsforregulatedcommunities.Anexampleofhownutrientmeasurementsareusedtomakedeterminationsaboutlevelsofnutrientremovalsandthe“creditworthiness”associatedwithparticulartypesofprojectsisanOctober2014recommendationoftheChesapeakeBayProgram’s“ExpertPaneltoDefineRemovalRatesfortheEliminationofDiscoveredNutrientDischargesfromGreyInfrastructure”.(Schueleretal.2014).TheChesapeakeBaywatershedisoneofthemostactiveregionsofthecountryintermsofTMDLdevelopment,andcanbeviewedasamodelforotherregions,andforhowChallenge-basedsensorsmighthelpinformongoingrefinementofwatershedcleanupmodelsandbestmanagementpractices(BMPs).TheChesapeakeBayProgram(CBP)WaterQualityGoalImplementationTeam(WQGIT)isresponsibleforapprovingloadingestimatestoquantifyexpectedamountsofnutrients(nitrogenandphosphorus)orsedimentloadstowaterfromspecificlandusesorpointsources.TheCBPhasdevelopedaprotocol(CBP2015)thatoutlinesspecificproceduresforitsbest-management-practiceExpertPanelstofollowsotheprocessisconsistent,transparent,andscientificallydefensible.
NutrientSensorChallengeEconomicWhitePaperACTMS-2015-01
24
Theprotocolnotesthatchangesinestimatedloadsfromaparticularpieceoflandcanoccurinanumberofways,including:1)Achangeinthelanduse(e.g.forestinsteadofgrassland),2)anadjustmentbasedonanestimateofeffectivenessofaBMP,3)ameasuredreductionindirectloadtothelanduse,and4)ameasuredreductionfromatreatmentprocess.TheCBPusestheseeffectivenessestimatesandmeasuresofdirectloadreductionstomodifyestimatesofexistingbaselineloadingforparticularlandusesandpractices.TheWQGITisresponsibleforapprovingtheloadingratereductions,andpercentageadjustmentstotheserates,usedintheChesapeakeBayWatershedModel(CBWM).The2014ChesapeakeBayWatershedAgreementincludesthecommitmenttomeettwo-yearmilestonesthatacceleratethepaceofChesapeakeBayrestoration,andtheneedtoquantifyimpactsofpracticestobeusedinWatershedImplementationPlans(WIPs)toachieveTMDLallocationtargets.
Other Market Segments Academicresearchersinterviewedforthisprojectwere,ingeneral,excitedbytheprospectofNSC-basedproductsandhowtheycouldbeusedtoidentifythesourcesandimpactsofwaterqualityproblemsandfindcost-effectivesolutions.Morethanoneacademicresearcherwasoptimisticthatthemarketamongtheirpeerswouldbestrong,indicatingthatataunitpriceoflessthan$5,000eachofthemmightpurchaseasmanyas10NSC-basedsensorsaspartoftheresearchgrantstheycurrentlymanage.However,withoutdoingsomeresearchtheywerenotwillingtoprovideestimatesabouthowlargetheoverallresearchmarketwaslikelytobe.AresearcherintheChesapeakeBaywatershedindicatedthattheavailabilityofsensorsthatcantakesamples,regardlessofweatherconditions,willgreatlyreduceuncertaintyabouthowprojectsaffectnutrientdischargesandimprovegeneralunderstandingofhowwatershedsystemswork.Forexample,inlargestormevents,itisgenerallyunderstoodthatnutrientconcentrationschangerapidly.However,becauseresearcherscannotsafelytakewatersamplesatsomelocationsexceptbeforeandafteraseverestormthe“snapshots”ofconditionstheyareabletocollecttellonlypartofthestory.AlthoughthisresearcherbelievedthepotentialresearchmarketforNSC-basesensorswouldbelarge,hewas,understandably,unwillingtopredicthowlarge.