preferential attachment in the evolution of metabolic networks
TRANSCRIPT

BioMed CentralBMC Genomics
ss
Open AcceResearch articlePreferential attachment in the evolution of metabolic networksSara Light*, Per Kraulis and Arne ElofssonAddress: Stockholm Bioinformatics Center, Department of Biochemistry and Biophyhsics, Albanova University Center, Stockholm University, Stockholm SE-10691, Sweden
Email: Sara Light* - [email protected]; Per Kraulis - [email protected]; Arne Elofsson - [email protected]
* Corresponding author
AbstractBackground: Many biological networks show some characteristics of scale-free networks. Scale-free networks can evolve through preferential attachment where new nodes are preferentiallyattached to well connected nodes. In networks which have evolved through preferentialattachment older nodes should have a higher average connectivity than younger nodes. Here wehave investigated preferential attachment in the context of metabolic networks.
Results: The connectivities of the enzymes in the metabolic network of Escherichia coli weredetermined and representatives for these enzymes were located in 11 eukaryotes, 17 archaea and46 bacteria. E. coli enzymes which have representatives in eukaryotes have a higher averageconnectivity while enzymes which are represented only in the prokaryotes, and especially theenzymes only present in βγ-proteobacteria, have lower connectivities than expected by chance.Interestingly, the enzymes which have been proposed as candidates for horizontal gene transferhave a higher average connectivity than the other enzymes. Furthermore, It was found that newedges are added to the highly connected enzymes at a faster rate than to enzymes with lowconnectivities which is consistent with preferential attachment.
Conclusion: Here, we have found indications of preferential attachment in the metabolic networkof E. coli. A possible biological explanation for preferential attachment growth of metabolicnetworks is that novel enzymes created through gene duplication maintain some of the compoundsinvolved in the original reaction, throughout its future evolution. In addition, we found thatenzymes which are candidates for horizontal gene transfer have a higher average connectivity thanother enzymes. This indicates that while new enzymes are attached preferentially to highlyconnected enzymes, these highly connected enzymes have sometimes been introduced into the E.coli genome by horizontal gene transfer. We speculate that E. coli has adjusted its metabolicnetwork to a changing environment by replacing the relatively central enzymes for better adaptedorthologs from other prokaryotic species.
BackgroundRecent studies indicate that metabolic networks evolve atthe local level through patchwork evolution and retro-grade evolution [1-3]. Patchwork evolution, which is
likely to be more important, occurs when an enzymeevolves from a broad spectrum enzyme to an enzyme witha highly specialized activity [4]. Retrograde evolution is aprocess where the depletion of a substrate from the envi-
Published: 10 November 2005
BMC Genomics 2005, 6:159 doi:10.1186/1471-2164-6-159
Received: 07 July 2005Accepted: 10 November 2005
This article is available from: http://www.biomedcentral.com/1471-2164/6/159
© 2005 Light et al; licensee BioMed Central Ltd. This is an Open Access article distributed under the terms of the Creative Commons Attribution License (http://creativecommons.org/licenses/by/2.0), which permits unrestricted use, distribution, and reproduction in any medium, provided the original work is properly cited.
Page 1 of 11(page number not for citation purposes)

BMC Genomics 2005, 6:159 http://www.biomedcentral.com/1471-2164/6/159
ronment leads to the evolution of an enzyme which canaccept a new substrate and catalyze the production of thedepleted substance [5].
Metabolic networks and other complex networks such asthe film actor collaboration network, the world wide web,protein domain networks and protein-protein interactionnetworks are small-world networks with some propertieswhich are consistent with scale-free networks [6-8]. Thesmall-worldness of the metabolic network of E. coli hasrecently been contested for an alternative network repre-sentation where carbon atomic traces in metabolic reac-
tions were used [9]. A small-world network ischaracterized by 1) short path lengths between any twonodes in the network and 2) a high clustering coefficient,which means that the neighbors of a certain node of thenetwork are often connected to each other thereby form-ing clusters. A scale-free network, in this context, has apower-law connectivity (degree) distribution, i.e. there aremany nodes which have very low connectivities and ahandful of nodes with much higher connectivities (hubs),see Figure 1a. Scale-free networks are robust networks inthe sense that they often remain intact when a large frac-tion of randomly chosen nodes is eliminated from thenetwork [10]. However, if a small fraction of the hubs ofthe network is eliminated the network is likely to becomefragmented into several components. It has been sug-gested that the scale-free character of biological networkshas evolved through natural selection for the advantage ofrobustness and error-tolerance that the scale-free networktopology confers to the organism [6]. A study by Gleiss etal showed that chemical reaction networks, which clearlyhave not been subjected to natural selection, also showscale-free characteristics thereby showing that scale-freenetworks can arise without natural selection and may be ageneral feature of chemical reaction networks [11].
Networks with scale-free properties have been shown toevolve when two simple rules are applied: 1) The networkgrows by the addition of new nodes. 2) Preferentialattachment: New nodes are more likely to become con-nected to well connected nodes in the network [12].While preferential attachment is often at the root of scale-freeness, a network with an power-law degree distributionmight be produced through other mechanisms. Preferen-tial attachment in the context of genetic networks maytake place partly through gene duplication [13,14]. Inagreement with preferential attachment Eisenberg andLevanon [15] showed that the proteins which havehomologs in all 3 domains of life, which are likely to beof ancient origin, have higher connectivities in the pro-tein-protein interaction network of S. cerevisiae. In con-trast, Kunin et al [16] recently showed that the most highlyconnected proteins date to after the evolution of primor-dial eukaryotes but before the radiation of eukaryotes toPlants, Metazoa and Protista. Here, we investigate the evi-dence for preferential attachment and the role of horizon-tal gene transfer in the metabolic network evolution of E.coli.
ResultsConnectivity and phylogenetic groupIf preferential attachment is an important mechanism inthe evolution of metabolic networks older enzymesshould have a higher average connectivity (k) thanyounger enzymes. In order to investigate this predictionwe extracted the enzymes and the reactions in E. coli from
Properties of scale-free networks and network representa-tionFigure 1Properties of scale-free networks and network repre-sentation. a) The figure shows a network where most nodes have very low connectivities (k = 1) but two nodes have connectivities which are far higher than the connectivity of most nodes in the network (k = 12). Scale-free networks, among other networks, have this general property. b) The upper part of the figure shows a common network represen-tation where the substrates and products of the reactions represent the nodes in the network and the enzymes repre-sent the edges. Our network representation is shown in the lower part of the figure where the enzymes represent the nodes in the network and the substrates and products repre-sent the edges (reaction graph).
(a)
F 0
K 0
Z 0
Z Z
A B
V 0 W 0 T 0 U 0 X 0 I 0G 0 Y 0
S 0
A A
R 0
Q 0
A 0
J0 H 0 M 0 L 0 E 0 D 0 C 0 B 0
P 0
A C
A G
A F A EA D N 0
(b)
A B C DE1 E2 E3
E1 E2 E3Our network representation
Common representation
B C
Page 2 of 11(page number not for citation purposes)

BMC Genomics 2005, 6:159 http://www.biomedcentral.com/1471-2164/6/159
the EcoCyc [17] and KEGG [18] databases. The networkrepresentation of the metabolic network of E. coli was con-structed using EcoCyc, see methods. The nodes in ourgraph represent the enzymes (complete EC numbers) cat-alyzing the reactions and the edges represent one or morecompounds involved in the reactions. There is an edgefrom enzyme El to enzyme E2 if El catalyzes a reactionwhere compound A is produced and then E2 uses A assubstrate. There can be at most one edge in each directionbetween the nodes in the graph. The connectivity of anode is defined as the number of edges connecting thenode to other nodes in the network.
Enzymes (complete EC numbers) were collected fromKEGG orthology [18] and were found in 163 differentorganisms (11 eukaryotes, 17 archaea and 135 bacteria).Among these the E. coli enzymes with representatives in74 organisms (11 eukaryotes, 17 archaea and 46 bacteria)of reasonably well understood phylogenies were extractedfor further studies, see Figure 2. The enzymes were dividedinto five age groups, see Table 1. The enzymes in group 1are likely to be among the oldest since they have repre-sentatives in eukaryotes, archaea and bacteria. Group 2contains the enzymes with representatives in eukaryotesand bacteria but not in archaea while group 3 contains theenzymes with representatives in archaea and bacteria butnot in eukaryotes. Group 4 contains E. coli enzymes with-out representatives in eukaryotes or archaea but with rep-resentatives in bacteria other than γβ-proteobacteria andgroup 5 contains enzymes with representatives in γβ-pro-teobacteria only. Enzymes belonging to group 1–3 areprobably ancient enzymes since they exist in at least twodomains of life. Enzymes which are found in group 5 areonly found in bacteria which are comparatively close rel-atives of E. coli, in the γβ-proteobacteria group, see Figure2, which indicates that they are relatively recent additionsto the metabolic repertory of E. coli. It is possible thatsome of the enzymes in groups 1–3 could have evolvedrelatively recently and subsequently been horizontallytransferred to the other domains of life but the evidenceof horizontal gene transfer between organisms belongingto different domains of life is not abundant. Horizontalgene transfer between bacterial species is believed to bemore common [19] and therefore there may be enzymesin group 4 which have been transferred from γβ-proteo-bacteria. Gene loss, which is estimated to be three timesmore common than horizontal gene transfer in prokaryo-tes [20], is probably a more important source of error inthis study since genes which serve an important functionin bacteria but not in archaea or eukaryotes may havebeen lost in the archaeal and eukaryotic lineages and as aconsequence groups 4 and 5 may not exclusively containrelatively recently evolved enzymes.
The average connectivities for the E. coli enzymes with rep-resentatives in the five groups were calculated, see Figure3a. The enzymes which are represented in all 3 domainsof life (group 1) have the highest average connectivitytogether with the enzymes which occur in bacteria andeukaryotes (group 2) while the enzymes that occur only inγβ-proteobacteria (group 5) have the lowest connectivi-ties. The average connectivity was 40% higher for group 1than for group 5 enzymes. In order to estimate the signif-icance of the results 100 000 randomized networks weregenerated through shuffling the group numbers while pre-serving the network topology. The Z-score, see methods,of the enzymes that occur in eukaryotes is substantiallyhigher than the Z-score for the enzymes which only occurin archaea and bacteria, see Figure 3b.
In a similar manner 147 other organisms were investi-gated. We collected the metabolic reactions for theseorganisms from KEGG. It should be noted that these met-abolic networks have not been investigated to the extentof the E. coli metabolic network. Therefore, the connectiv-ities of the enzymes and the results are probably not of thesame reliability. We found that the larger prokaryoticgenomes often have a particularly strong correlationbetween connectivity and domain presence while the cor-relation in smaller prokaryotes and eukaryotes is weaker,see Figure 4. Many of the smaller prokaryotes are obligateintracellular parasites or symbionts. The genomes of obli-gate parasites and symbionts have been metabolicallyreduced and many metabolic functions, such as theamino acid metabolism, are frequently provided by thehost. Since enzymes involved in amino acid metabolismare often ancient proteins with high connectivities, seeFigure 5a and 5b, the absence of genes coding for theseenzymes in the genomes of the obligate symbionts/para-sites can account for the lack of correlation between con-nectivity and domain presence in smaller genomes.
In conclusion we found that E. coli enzymes which haverepresentatives in all domains of life, and in eukaryotesbut not archaea, have a higher average connectivity in themetabolic network of E. coli than the presumably youngerenzymes which only have representatives in γβ-proteobac-teria. This finding lends support for one of the predictionsof the mechanism of preferential attachment.
Connectivity and horizontal gene transferIt has been suggested that the scale-free properties of bio-logical networks may arise, at least partially, as a result ofpreferential attachment of new nodes to highly connectednodes through gene duplication [13,14]. Preferentialattachment by gene duplication may take place accordingto the following scenario; Initially, the duplicated genehas exactly the same function and position in the networkas the template gene. Since many genes are connected to
Page 3 of 11(page number not for citation purposes)

BMC Genomics 2005, 6:159 http://www.biomedcentral.com/1471-2164/6/159
the hub of the network, the duplicated gene is by chancelikely to be connected to the hub of the network. Subse-quently, the duplicate gene may evolve towards anotherfunctionality but it could retain some of its original func-tion. For instance, a multi-domain protein could looseone of its domains through deletion but retain the otherdomains and possibly part of its original functionality. Insuch a scenario the older proteins are more likely to behighly connected than the younger proteins.
An alternative scenario is preferential attachment by hori-zontal gene transfer (HGT); A new, or alternative, enzymeis introduced through HGT. The new enzyme is morelikely to be retained in the metabolic repertory if it confersa new or improved function at a central, rather thanperipheral, position of the metabolism – such as if it isconnected to a highly connected enzyme or if it is itselfhighly connected. This is a consideration which may beparticularly important in the metabolism of bacteria sincesome bacteria are prone to delete dispensable genes fromtheir genomes [21]. Arguably, connectivity is a measurewhich indicates the centrality and importance of anenzyme in which case horizontally transferred genesshould frequently be highly connected or be connected tohighly connected enzymes. According to this scenario,horizontally transferred enzymes would be preferentiallyattached to highly connected enzymes and/or be preferen-tially replacing highly connected enzymes.
Although the extent of the evolutionary impact of HGT isstill under debate [22-24], it is generally accepted as animportant evolutionary process in microbial species [19].Roughly 18% of the protein coding genes in E. coli arelikely to have been introduced into the E. coli genome byHGT since the species diverged from the Salmonella line-age according to an analysis by Lawrence and Ochmanwhere base composition and codon usage patterns wereused to identify the horizontally transferred sequences[25]. Using this data set we found that 85 of the 486 E. colienzymes used in this study are likely to be examples ofHGT (HGT enzymes). The average connectivity for theHGT enzymes in the metabolic network of E. coli is 42.2while the other enzymes (non-HGT enzymes) have anaverage connectivity of 33.1. The most striking differencebetween the connectivity distributions of the HGTenzymes and the non-HGT enzymes is that only 15% ofthe HGT enzymes have connectivities between 0–9 and37% of the HGT enzymes have higher connectivities than60 while 28% of the non-HGT enzymes have connectivi-ties of 0–9 and 26% have connectivities higher than 60,see Figure 6. These results indicate that horizontally trans-ferred enzymes in the metabolic network of E. coli areeither introduced into the repertory of the organism as acomparatively high connectivity enzyme or acquiresmany connections during the evolution of the network.
We classified the HGT enzymes into the five phylogeneticgroups and determined the average connectivities for eachgroup, see Figure 7 and Table 1. Only HGT enzymesbelonging to group 1 and 2 have higher connectivitiesthan the non-HGT enzymes belonging to the same group.From Figure 7a it is clear that the high average connectiv-ities of group 1 and 2 enzymes, which was seen in Figure3a, is partly but not solely due to HGT enzymes. It shouldbe noted that the horizontal transfers of enzymes whichare specific for βγ-proteobacteria only (group 5) may beunderestimated since HGT events between closely relatedspecies are hard to detect [24].
Most horizontally transferred genes go through the proc-ess of amelioration, the adjustment of the transferredsequence to the base composition and codon usage of theresident genome. Therefore, most detectable HGTs havetaken place relatively recently in the history of E. coli [25].Consequently, we can conclude that while it is true thatthe highly connected enzymes in the metabolic networkof E. coli are often old in the sense that they are enzymeswith representatives in eukaryotes, and which thereforeprobably originated in the last common ancestor ofeukaryotes and bacteria, they are also overrepresentedamong the enzymes which have been introduced recentlyinto the E. coli genome through HGT. These findings sug-gest that horizontally transferred genes are introduced andretained preferentially at central positions of the metabo-lism of E. coli.
The connectivity of essential enzymes and isozymes
Jeong et al [26] showed that the highly connected proteinsin the protein-protein interaction network of S. cerevisiaeare more likely to be indispensable to the organism thanless well connected proteins. We wished to study if therewas a similar correlation in the metabolic network of E.coli. We used the essentiality classification from the studyof Gerdes et al [27] of E. coli under aerobic growth in nutri-tion rich medium. We calculated the mean connectivityfor the essential and the dispensable enzymes respectivelyand found that the essential enzymes do not show ahigher connectivity than expected
( , for networks where 15
compounds have been removed). It is possible that therelatively small size of the metabolic networks comparedto the protein-protein interaction network is the reason asimilar correlation could not be found in the metabolicnetwork of E. coli.
The hubs are the most important nodes for the integrity ofthe network. If a fraction of the hubs are removed the net-work is likely to become fragmented into smaller compo-nents. Since these enzymes are very important for the
k kessential non essential= =−29 35,
Page 4 of 11(page number not for citation purposes)

BMC Genomics 2005, 6:159 http://www.biomedcentral.com/1471-2164/6/159
Page 5 of 11(page number not for citation purposes)
Schematic representation of the phylogenetic tree for most of the organisms used in this analysisFigure 2Schematic representation of the phylogenetic tree for most of the organisms used in this analysis. The tree was redrawn from Gough et al [35] using Drawgram from the Phylip package http://evolution.genetics.washington.edu/phylip.html. Eukaryotes: Homo sapiens, Caenorhabditis elegans, Drosophila melanogaster, Saccharomyces cerevisiae, Arabidopsis thaliana, archaea: Aeropyrum pernix, Sulfolobus solfataricus, Thermoplasma volcanium, Thermoplasma acidophilum, Methanopyrus kandleri, Methanococ-cus jannaschii, Methanobacterium thermoautotrophicum, Archaeoglobus fulgidus, Pyrococcus abyssi, Pyrococcus horikoshii, Halobacte-rium sp. and bacteria: Campylobacter jejuni; Thermatogales: Thermotoga maritima; Parasitic proteobacteria: Rickettsia conorii, Rickettsia prowazekii, Buchnera aphidicola; Chlamydiae: Chlamydophila pneumoniae, Chlamydia trachomatis; Spirochetes: Borrelia burgdorferi, Treponema pallidum; Mycoplasmas: Mycoplasma genitalium, Mycoplasma pneumoniae, Ureaplasma urealyticum, Myco-plasma pulmonis; Bacillus/Clostridium-group: Caulobacter crescentus, Staphylococcus aureus, Bacillus halodurans, Bacillus subtilis, Lac-tococcus lactis, Streptococcus pneumoniae, Streptococcus pyogenes, Clostridium acetobutylicum; Cyanobacteria: Nostoc sp., Synechocystis sp.; Thermus/Deinococcus-group: Deinococcus radiodurans; Actinobacteria: Mycobacterium tuberculosis CDC1551, Mycobacterium tuberculosis H37Rv, Mycobacterium leprae; free-living α-proteobacteria: Agrobacterium tumefaciens, Mesorhizobium loti, Sinorhizobium meliloti; ε-proteobacteria: Helicobacter pylori-J99, Helicobacter pylori-26695; Aquificales: Aquifex aeolicus and βγ-proteobacteria: Escherichia coli:0157:H7, Escherichia coli:0157:H7:EDL933, Escherichia coli:k-12, Salmonella typhimurium, Yersinia pestis, Vibrio cholerae, Neisseria meningitidis 72491, Neisseria meningitidis MC58, Xylella fastidiosa, Pseudomonas aeruginosa, Ralstonia solanacearum, Pasteurella multocida, Haemophilus influenzae. Furthermore, 6 additional eukaryotes (Schizosaccharomyces pombe, Plasmodium falciparum, Encephalitozoon cuniculi, Mus musculus, Rattus norvegicus, Danio rerio) and 6 additional archaea (Methanosa-rcina mazei, Methanosarcina acetivorans, Nanoarchaeum equitans, Pyrobaculum aerophilum, Pyrococcus furiosus, Sulfolobus tokodaii) were used in the analysis.
Homo sapiens
Drosophila melanogaster
Caenorhabditis elegans
Arabidopsis thaliana
Saccharomyces cerevisiae
Pyrococcus horikoshii
Pyrococcus abyssi
Archaeoglobulus fulgidus
Methanobacterium thermoautotrophicum
Methanococcus jannaschii
Methanopyrus kandleri
Thermoplasma acidophilum
Thermoplasma volcanium
Sulfolobus solfataricus
Aeropyrum pernix
Halobacterium sp
Thermatoga maritima
Helicobacter pylori-J99
Helicobacter pylori-26695
Campylobacter jejuni
Aquifex aeolicus
Mycoplasma pneumoniae
Mycoplasma genitalium
Ureaplasma urealyticum
Mycoplasma pulmonis
Treponema pallidum
Borrelia burgdorferi
Chlamydia trachomatis
Chlamydophila pneumoniae
Buchnera aphidicola
Rickettsia conorii
Rickettsia prowazekii
Clostridium acetobutylicum
Bacillus subtilis
Bacillus halodurans
Staphylococcus aureus
Lactococcus lactis
Streptococcus pyogenes
Streptococcus pneumoniae
Escherichia coli:0157:H7:EDL933
Escherichia coli:0157:H7
Escherichia coli:K-12
Salmonella typhi
Yersinia pestis
Vibrio cholerae
Haemophilus influenzae
Pasteurella multocida
Caulobacter crescentus
Agrobacterium tumefaciens
Sinorhizobium meliloti
Mesorhizobium loti
Xylella fastidiosa
Neisseria meningitidis MC58
Neisseria meningitidis Z2491
Mycobacterium tuberculosis:H37Rv
Mycobacterium tuberculosis:CDC1551
Mycobacterium leprae
Synechocystis sp.
Nostoc sp.
Deinococcus radiodurans

BMC Genomics 2005, 6:159 http://www.biomedcentral.com/1471-2164/6/159
robustness of the network it might be suspected that theEC numbers with the highest connectivities could havemore than one representatives in the genome, i.e. thatthere are two or more isozymes representing these highlyconnected nodes. Isozymes in multicellular organisms areoften active in different tissues while isozymes in singlecellular organisms frequently have different substrate spe-cificities or are activated in different environments (suchas aerobic or anaerobic environments). We here desig-nated a pair of enzymes as isozymes if they catalyze thesame reaction but are coded for by different genes, whichare not part of the same enzyme complex.
We used Expasy [28], SGD [29] and EcoCyc [17] to deter-mine which enzymes in the metabolic networks of E. coliand S. cerevisiae occur as isozymes. We found 77 EC num-bers that were associated with isozymes in E. coli and 97EC numbers that were associated with isozymes in S. cer-evisiae, see additional files. The mean connectivities forthe isozymes and the non-isozymes were determined andthe result was compared to randomized networks. Wefound that the isozymes do not have a noticeably highermean connectivity than non-isozymes
( , for networks where 15
compounds have been removed). The result may indicatethat isozymes are not necessarily crucial for the integrity ofthe metabolic network. In accordance with our result ithas recently been shown that the isozymes of S. cerevisiaeare not overrepresented among essential enzymes [30].
Connectivity and functionKunin et al showed that the functional classes in the pro-tein-protein network of S. cere-visiae display distinctly dif-ferent connectivity levels [16]. In a similar manner weinvestigated whether enzymes belonging to different func-tional groups are characterized by distinct connectivities.
We classified the enzymes into 7 functional classesaccording to EcoCyc [17]; lipid metabolism, nucleotide
metabolism, amino acid metabolism, sugar metabolism,energy metabolism, other biosynthesis and other degrada-tion and calculated the mean connectivities for the differ-ent functional classes, see Figure 5b and Table 2. Themean connectivities for the enzymes involved in nucle-otide, amino acid, other degradation and energy metabo-lism are higher than expected. The amino acidmetabolism and nucleotide metabolism enzymes areclearly over represented in 3 domains of life whileenzymes involved in energy metabolism are slightly morecommon in 3 domains of life than expected by chance.Many of the pathways involved in energy metabolism,such as the citric acid cycle and glycolysis, are believed tobe very old. However, there are substantial variations inthe energy metabolism between different species anddomains of life [31]. Therefore, the observation thatenergy metabolism enzymes are not overrepresented inthree domains of life is not surprising.
Contrastingly, enzymes involved in lipid and sugarmetabolism are on average half as well connected as theenzymes involved in nucleotide, amino acid and energymetabolism. The group of enzymes involved in lipidmetabolism is less than half the size of the second small-est functional group and due to its small size the Z-scorefor this functional group is less reliable than for the otherfunctional groups. The sugar metabolism enzymes areclearly over represented among the enzymes that occur inbacteria only, see Figure 5a, which was anticipated sincethere are many bacterial specific enzymes involved insugar transportation [32].
Network growth through preferential attachmentAccording to the mechanism of preferential attachmentnew enzymes in the network should be preferentiallyattached to already well connected nodes. We do not haveaccess to the last universal common ancestor (LUCA) thatexisted before the 3 domains of life evolved. However, arough representation of the metabolic network of thatorganism was created by extracting the enzymes that occurin all domains of life. The connectivities of the enzymes in
k kisozyme non isozyme= =−37 34,
Table 1: Description of the phylogenetic groups 1–5 and the number of E. coli enzymes in each group. For instance, an E. coli enzyme which has at least one representative in one or more eukaryotes but not in archaea is a group 2 enzyme. The fourth column contains the number of enzymes which are proposed examples of horizontal gene transfer. The phylogenetic classification is based on the phylogenetic tree in Figure 2.
GROUP ORGANISMS NO. ENZYMES NO. HGT ENZYMES
1 E. coli, eukaryotes and archaea 262 452 E. coli, eukaryotes but not archaea 71 143 E. coli and archaea 50 84 E. coli and bacteria other than βγ-proteobacteria 75 145 βγ-proteobacteria 28 4
Page 6 of 11(page number not for citation purposes)
BMC Genomics 2005, 6:159 http://www.biomedcentral.com/1471-2164/6/159
that derived network were determined. We then calcu-lated the number of enzyme nodes that have been addedto an enzyme by subtracting the connectivity of theenzyme in the current E. coli network by the connectivityof the enzyme in the ancient network. We found that theenzymes which have higher connectivities in the ancientnetwork gain new connections at a higher rate than theenzymes with lower connectivities, see Figure 8. The cor-relation between connectivity in the ancient network and
the connectivity increase appears to be linear (r = 0.87)following the equation f(x) = 2.6 + 0.41x, where x is theconnectivity in the ancient network. We can therefore con-clude that the addition of new nodes to the metabolic net-work of E. coli occurs in a manner which is consistent withpreferential attachment.
DiscussionWe have investigated two predictions generated from themechanism of preferential attachment in the evolution ofthe metabolic network of E. coli. First, if preferentialattachment is of any significance in the evolution of themetabolic network of E. coli, the older enzymes in the net-work should have a higher average connectivity. We havefound that E. coli enzymes which are represented in threedomains of life, and in eukaryotes but not archaea, have ahigher average connectivity than expected by chance. Sec-ond, another prediction generated from the hypothesis ofnetwork evolution through preferential attachment is thathighly connected nodes should gain new edges at a fasterrate than nodes with low connectivities. To investigatethis prediction we extracted the enzymes with representa-tives in 3 domains of life and determined the network rep-resenting LUCA's metabolic network. In accordance withthe mechanism of preferential attachment we found apositive linear correlation between connectivity in theancient network and number of connections gainedthrough evolution.
Further, we found that the E. coli enzymes which arebelieved to have undergone horizontal gene transfer
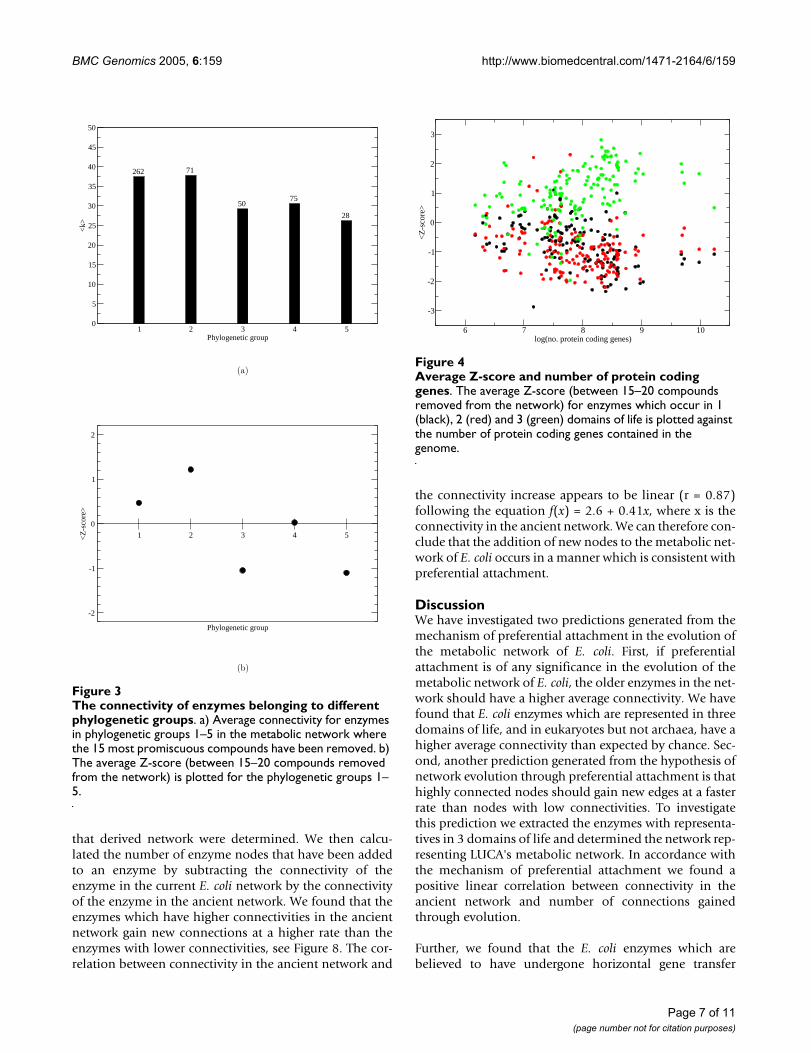
Average Z-score and number of protein coding genesFigure 4Average Z-score and number of protein coding genes. The average Z-score (between 15–20 compounds removed from the network) for enzymes which occur in 1 (black), 2 (red) and 3 (green) domains of life is plotted against the number of protein coding genes contained in the genome.
6 7 8 9 10log(no. protein coding genes)
-3
-2
-1
0
1
2
3
<Z
-sco
re>
The connectivity of enzymes belonging to different phyloge-netic groupsFigure 3The connectivity of enzymes belonging to different phylogenetic groups. a) Average connectivity for enzymes in phylogenetic groups 1–5 in the metabolic network where the 15 most promiscuous compounds have been removed. b) The average Z-score (between 15–20 compounds removed from the network) is plotted for the phylogenetic groups 1–5.
262 71
50 75
28
1 2 3 4 5Phylogenetic group
0
5
10
15
20
25
30
35
40
45
50
<k>
(a)
1 2 3 4 5
Phylogenetic group
-2
-1
0
1
2
<Z
-sco
re>
(b)
Page 7 of 11(page number not for citation purposes)

BMC Genomics 2005, 6:159 http://www.biomedcentral.com/1471-2164/6/159
(HGT enzymes) have a higher average connectivity thanother enzymes (non-HGT enzymes). This is especially truefor the HGT enzymes with representatives in eukaryotes,which is the most highly connected group of E. colienzymes. This result suggests that the highly connectedenzymes are often old in the sense that they are likely tohave originated in LUCA and been part of the bacterialmetabolic repertory for a long time. However, theseancient enzymes are sometimes relatively recent additionsto the metabolic network of E. coli. It is possible that bac-
teria such as E. coli are adjusting their metabolic networksto a changing environment by replacing the relatively cen-tral enzymes, with high connectivities, for better adaptedorthologs from other prokaryotic species.
ConclusionIt is well known that many novel functions in organismsare obtained through gene duplication, followed by sub-functionalization and neofunctionalization. Therefore, apossible biological explanation for the preferential attach-ment growth of metabolic networks, which we have nowfound some support for, could be that novel enzymes,which are created through gene duplication, maintainsome compounds involved in the reaction catalyzed bythe original enzyme throughout its future evolution. As asupplementary explanation we propose that horizontallytransferred enzymes are introduced preferentially at cen-tral positions of the metabolic network of E. coli.
MethodsDatabases and representation frameworkWe built a representation of the metabolic network of E.coli by using EcoCyc [17] (downloaded in March 2004) togather the EC assigned enzymes and to determine the con-nectivities of the enzymes. An alternative network basedon KEGG was also produced and the study was performedwhich generated similar results, results not shown. Theconnectivity of an enzyme is defined as the number ofedges connecting the enzyme to other enzymes. Only oneedge in each direction between any two enzymes was
Connectivity of HGT and non-HGT enzymesFigure 6Connectivity of HGT and non-HGT enzymes. The proportion of the number of enzymes in each connectivity group is plotted against the binned connectivities for the enzymes which are candidates for horizontal gene transfer (white bars) and enzymes which are not candidates for HGT (black bars). The results are shown for the network where the 15 most promiscuous compounds had been removed.
The phylogenetic distribution and connectivity of enzymes in different functional classesFigure 5The phylogenetic distribution and connectivity of enzymes in different functional classes. a) Function and phylogenetic distribution. The E. coli enzymes were classified into 7 functional classes (amino acid metabolism, energy metabolism, lipid metabolism, nucleotide metabolism, sugar metabolism, other biosynthesis and other degradation) and divided into enzymes which are represented in 1, 2 or 3 domains of life. 100 000 randomized networks were gener-ated for comparison and Z-score calculation. b) Connectivity and function. The enzymes were divided into functional classes and the Z-scores for the connectivities of each func-tional class were calculated for the network where the 15 most promiscuous compounds have been removed.
-6
-5
-4
-3
-2
-1
0
1
2
3
4
5
6
7
8
9
10
1 2 3
Z-s
core
Domains of life
Amino acid metabolismEnergy metabolism
Lipid metabolismNucleotide metabolism
Other biosynthesisOther degradationSugar metabolism
(a)
-8
-6
-4
-2
0
2
4
6
8
10
12
14
16
18
20
Amino acid metabolism
Energy metabolism
Lipid metabolism
Nucleotide metabolism
Other biosynthesis
Other degradation
Sugar metabolism
Z-s
core
(b)
Page 8 of 11(page number not for citation purposes)

BMC Genomics 2005, 6:159 http://www.biomedcentral.com/1471-2164/6/159
allowed. Furthermore we used KEGG orthology (KO)assignments [18] (downloaded in May 2004) to deter-
mine in which organisms the different EC numbers arerepresented.
The nodes in our graph represent the enzymes (completeEC numbers) catalyzing the reactions and the edges repre-sent one or more compounds involved in the reactions.There is an edge from enzyme El to enzyme E2 if El cata-lyzes a reaction where compound A is produced and thenE2 uses A as substrate. The network representation used inour study has been used before for metabolic networkanalysis where it has been referred to as 'protein-centric'graphs [33] or 'reaction graphs' [7], see Figure 1b. Our rep-resentation of the full metabolic network of E. coli consistsof 486 nodes and 99 917 edges.
One problematic aspect with metabolic network analysisis how promiscuous compounds, such as H2O, should behandled. One may argue that the network would becomemore biochemically meaningful if these compounds areremoved because the promiscuous compounds are usu-ally not limiting factors of reactions [34]. In this study, wehave chosen to apply a simple network-based criterion.We count the number of times a compound occurs as partof an edge in the network. The most common compoundswere then considered as promiscuous compounds [2,3].We performed our studies on different networks where upto 40 compounds have been removed.
Statistical analysisFor the statistical analysis 100 000 randomized networkswere generated through shuffling the group numberswhile preserving the network topology. Subsequently, Z-scores were calculated. The Z-score expresses how far theaverage connectivity of the enzymes belonging to a certainphylogenetic group differs from the average connectivityof randomly sampled enzymes, measured in units of therandom sampling distribution's standard deviation. Thelarger the Z-score, the less likely that the differencebetween phylogenetic group's average and the randomgroup's average is by chance.
Horizontal gene transfer, phylogenetic group and connectiv-ityFigure 7Horizontal gene transfer, phylogenetic group and connectivity. a) Average connectivities for enzymes in phyl-ogenetic groups 1–5 in the metabolic network where the 15 most promiscuous compounds have been removed. The white bars represent the enzymes which have probably not been transferred to E. coli through horizontal gene transfer (HGT) and the black bars represent the enzymes which are likely to be examples of HGT. The numbers above the bars signify the number of enzymes in each group. b) The connec-tivity distribution for enzymes which are the result of hori-zontal transfer (red dots) and enzymes which are not (black circles).
45 14
8 14
4217 57
42 61
24
1 2 3 4 5Phylogenetic group
0
5
10
15
20
25
30
35
40
45
50
55
60
<k>
hgtnon-hgt
(a)
1 2 3 4 5Phylogenetic group
0
50
100
150
200
k
(b)
Table 2: The number of E. coli enzymes belonging to 7 functional EcoCyc classes.
FUNCTION NO. ENZYMES
Sugar metabolism 76Amino acid metabolism 93Lipid metabolism 17Nucleotide metabolism 46Energy metabolism 46Other biosynthesis 140Other degradation 53
Page 9 of 11(page number not for citation purposes)

BMC Genomics 2005, 6:159 http://www.biomedcentral.com/1471-2164/6/159
For the calculations of the Z-score for the average connec-tivity for phylogenetic groups the Z-score is defined as
, where i is the
phylogenetic group and is the average connectivity.
For the calculations of the Z-score for the average connec-tivity for functional groups the Z-score is defined as
, where f is the
functional group and is the avera ge connectivity.
For the calculations of the Z-score for the number ofmembers belonging to functional groups per domain oflife the Z-score is defined as
, where d is
the number of domains of life and is the number ofenzymes belonging to each functional class.
Authors' contributionsSL performed the analysis as a graduate student under thesupervision of PK and AE.
Additional material
AcknowledgementsThis work was supported by the Foundation for Strategic Research (SSF).
References1. Rison SC, Teichmann SA, Thornton JM: Homology, pathway dis-
tance and chromosomal localisation of the small moleculemetabolism enzymes in Escherichia coli. J Mol Biol 2002,318:911-932.
2. Alves R, Chaleil RA, Sternberg MJ: Evolution of enzymes inmetabolism: a network perspective. J Mol Biol 2002,320:751-770.
3. Light S, Kraulis P: Network analysis of metabolic enzyme evo-lution in Escherichia coli. BMC Bioinformatics 2004, 5:.
4. Jensen RA: Enzyme recruitment in evolution of new function.Annu Rev Microbiol 1976, 30:409-425.
5. Horowitz NH: On the evolution of biochemical syntheses. ProcNatl Acad Sci USA 1945, 31:153-157.
6. Jeong H, Tombor B, Albert R, Oltvai ZN, Barabasi AL: The large-scale organization of metabolic networks. Nature 2000,407:651-654.
7. Wagner A, Fell DA: The small world inside large metabolic net-works. Proc R Soc Lond B Biol Sci 2001, 268:1803-1810.
8. Wuchty S: Scale-free behavior in protein domain networks.Mol Biol Evol 2001, 18:1694-1702.
9. Arita M: The metabolic world of Escherichia coli is not small.Proc Natl Acad Sci U S A 2004, 101:1543-1547.
10. Albert R, Jeong H, Barabasi A-L: Error and attack tolerance ofcomplex networks. Nature 2000, 406:378-382.
11. Gleiss PM, Stadler PF, Wagner A, Fell DA: Relevant cycles inchemical reaction networks. Adv Complex Syst 2001, 4:207-226.
12. Barabasi A-L, Albert R: Emergence of scaling in metabolic net-works. Science 1999, 286:509-512.
13. Qian J, Luscombe NM, Gerstein M: Protein family and fold occur-rence in genomes: power-law behaviour and evolutionarymodel. J Mol Biol 2001, 313:673-681.
14. Barabasi AL, Oltvai ZN: Network biology: Understanding thecell's functional organization. Nat Rev Genet 2004, 5:101-113.
15. Eisenberg E, Levanon EY: Preferential attachment in ProteinNetwork Evolution. Phys Rev Lett 2003, 91:138701.
16. Kunin V, Pereira-Leal JB, Ouzounis CA: Functional Evolution ofthe Yeast Protein Interaction Network. Mol Biol Evol 2004,21:1171-1176.
17. Karp PD, Riley M, Saier M, Paulsen IT, Collado-Vides J, Paley SM, Pel-legrini-Toole A, Bonavides C, Gama-Castro S: The EcoCyc Data-base. Nucleic Acids Res 2002, 30:56-58.
18. Kanehisa M, Goto S, Kawashima S, Nakaya A: The KEGG databasesat GenomeNet. Nucleic Acids Res 2002, 30:42-46.
19. Boucher Y, Douady CJ, Papke RT, Walsh DA, Boudreau ME, NesboCL, Case RJ, Doolittle WF: Lateral gene transfer and the originsof prokaryotic groups. Annu Rev Genet 2003, 37:283-328.
20. Kunin V, Ouzounis CA: The balance of driving forces duringgenome evolution in prokaryotes. Genome Res 2003,13:1589-1594.
21. Andersson JO, Andersson SG: Insights into the evolutionaryprocess of genome degradation. Curr Opin Genet Dev 1999,9:664-671.
22. Kurland CG, Canback B, Berg OG: Horizontal gene transfer: acritical view. Proc Natl Acad Sci U S A 2003, 100:9658-9662.
23. Snel B, Bork P, Huynen MA: Genomes in flux: the evolution ofarchaeal and proteobacterial gene content. Genome Res 2002,12:17-25.
24. Lawrence JG, Ochman H: Amelioration of bacterial genomes:rates of change and exchange. J Mol Evol 1997, 44:383-397.
Additional File 1E. coli isozymes Flat file containing a simple list of the isozymes in E. coli.Click here for file[http://www.biomedcentral.com/content/supplementary/1471-2164-6-159-S1.txt]
Z i) i stdev( i))i real rand randk k k= −( ( ( ))/ (
k
Z f real rand randk k k= −( ( (f) (f))/stdev( f))
k
Z (d) (d))/stdev( d))d real rand randno no no= −( (
no
Additional File 2S. cerevisiae isozymes Flat file containing a simple list of the isozymes in S. cerevisiae.Click here for file[http://www.biomedcentral.com/content/supplementary/1471-2164-6-159-S2.txt]
Connectivity increase and connectivity in the ancient net-workFigure 8Connectivity increase and connectivity in the ancient network. The number of edges gained from the ancient net-work to the current E. coli metabolic network is plotted against the connectivity in the ancient network.
0 10 20 30 40ancient k
0
5
10
15
20
25
30
k in
crea
se
Page 10 of 11(page number not for citation purposes)

BMC Genomics 2005, 6:159 http://www.biomedcentral.com/1471-2164/6/159
Publish with BioMed Central and every scientist can read your work free of charge
"BioMed Central will be the most significant development for disseminating the results of biomedical research in our lifetime."
Sir Paul Nurse, Cancer Research UK
Your research papers will be:
available free of charge to the entire biomedical community
peer reviewed and published immediately upon acceptance
cited in PubMed and archived on PubMed Central
yours — you keep the copyright
Submit your manuscript here:http://www.biomedcentral.com/info/publishing_adv.asp
BioMedcentral
25. Lawrence JG, Ochman H: Molecular archaeology of theEscherichia coli genome. Proc Natl Acad Sci U S A 1998,95:9413-9417.
26. Jeong H, Mason SP, Barabasi AL, Oltvai ZN: Lethality and central-ity in protein networks. Nature 2001, 411:41-42.
27. Gerdes SY, Scholle MD, Campbell JW, Balazsi G, Ravasz E, DaughertyMD, Somera AL, Kyrpides NC, Anderson T, Gelfand MS, Bhattach-arya A, Kapatral V, D'Souza M, Baev MV, Grechkin Y, Mseeh F, Fon-stein MY, Overbeek R, Barabasi A-L, Oltvai ZN, Osterman AL:Experimental determination and system level analysis ofessential genes in Escherichia coli MG1655. J Bacteriol 2003,185:5673-5684.
28. Gasteiger E, Gattiker A, Hoogland C, Ivanyi I, Appel RD, Bairoch A:ExPASy: the proteomics server for in-depth protein knowl-edge and analysis. Nucleic Acids Res 2003, 31:3784-3788.
29. Cherry JM, Adler C, Ball C, Chervitz SA, Dwight SS, Hester ET, Jia Y,Juvik G, Roe T, Schroeder M, Weng S, Botstein D: SGD: Saccharo-myces Genome Database. Nucleic Acids Res 1998, 26:73-79.
30. Papp B, Pal C, Hurst LD: Metabolic network analysis of thecauses and evolution of enzyme dispensability in yeast.Nature 2004, 429:661-664.
31. Huynen MA, Dandekar T, Bork P: Variation and evolution of thecitric-acid cycle: a genomic perspective. Trends Microbiol 1999,7:281-291.
32. Paulsen IT, Sliwinski MK, Saier MHJ: Microbial genome analyses:global comparisons of transport capabilities based on phyl-ogenies, bioenergetics and substrate specificities. J Mol Biol1998, 277:573-592.
33. Gerrard JA, Sparrow AD, Wells JA: Metabolic databases – whatnext? Trends Biochem Sci 2001, 26:137-140.
34. Ma H, Zeng AP: Reconstruction of metabolic networks fromgenome data and analysis of their global structure for vari-ous organisms. Bioinformatics 2003, 19:270-277.
35. Gough J: Convergent evolution of domain architectures (israre). Bioinformatics 2005, 21:1464-1471.
Page 11 of 11(page number not for citation purposes)