predictors of change in participation rates following acquired brain injury: results of a...
TRANSCRIPT
Predictors of change in participation rates following acquired braininjury: results of a longitudinal study
DANA ANABY1 | MARY LAW2 | STEVEN HANNA3 | CAROL DEMATTEO2
1 School of Physical and Occupational Therapy, McGill University, Montreal, Quebec. 2 School of Rehabilitation Science, CanChild Centre for Childhood Disability Research,McMaster University, Hamilton, Ontario. 3 Department of Clinical Epidemiology and Biostatistics, CanChild Centre for Childhood Disability Research, McMaster University,Hamilton, Ontario, Canada.
Correspondence to Dr Dana Anaby at School of Physical and Occupational Therapy, McGill University, 3630 Promenade Sir-William-Osler, Hosmer House Room 302, Montreal, Quebec H3G 1Y5, Canada.E-mail: [email protected]
This article is commented on by Swaine on pages 296–297 of this issue.
PUBLICATION DATA
Accepted for publication 13th October 2011.Published online 19th January 2012.
ABBREVIATIONSABI Acquired brain injuryCAPE Children's Assessment of Participation
and EnjoymentFAD Family Assessment DeviceGCS Glasgow Coma ScaleLOS Length of staySES Socio-economic status
AIM The purpose of this study was (1) to examine the changes in participation rates over 1 year
among children and adolescents after acquired brain injury and (2) to explore the effect of child
and family factors on these changes.
METHOD The participation levels of 136 children and young people (88 males; 48 females; age
range 4y 11mo–17y 6mo; mean age 11y 6mo) after acquired brain injury (3£ Glasgow Coma Scale
score £15; mean 12.8) were assessed three times: at their return to school, and at 8 and 12 months
after returning to school. The Children’s Assessment of Participation and Enjoyment measured
the participants’ diversity and intensity of participation in out-of-school activities. At baseline,
information on general family functioning and medical and demographic information was
collected as possible predictors. Mixed-effect model analyses of participation scores were
performed while controlling for child’s age at injury.
RESULTS The severity of the injury explained rates of change across time for participation
intensity in recreational, physical, and social activities. Household income influenced changes
in the intensity of recreational activities, whereas family functioning predicted changes in the
diversity of skill-based activities.
INTERPRETATION Participation is a relevant outcome of recovery that needs to be assessed and
monitored post brain injury. Special attention can be directed to severity of injury and family
functioning when developing intervention plans.
Participation, defined as involvement in life situations, is rec-ognized as an important outcome of rehabilitation interven-tion.1 Moreover, participation has been shown to play a vitalrole in children’s development, learning, and well-being, par-ticularly when engaging in after-school activities2 such as art,sports, hobbies, social clubs, and play and interaction withfriends and family members. Through participation in recrea-tional activities, children and adolescents acquire new skillsand competencies, shape their identity, and achieve mentaland physical health.3
Acquired brain injury (ABI) among children and adolescentsis an increasingly common condition (in the USA, for exam-ple, children aged 0–14y with ABI account for almost half amillion emergency visits annually4) and is characterized bylong-term implications. The participation of children and ado-lescents following ABI or after injury is restricted comparedwith their typically developing peers, both in the early stagesof recovery5 and in the later stages.6,7 There is evidence thatparticipation patterns were restricted even in a sample in
which minor injury was predominant.5 However, these studieswere cross-sectional in nature and therefore do not provideknowledge about how participation changes over time after abrain injury.
A substantial body of research has examined change in dif-ferent outcomes over time among children and adolescentswith ABI.8 The studied outcomes, however, have focused onmedical, academic,8 psychosocial,9 social,10 and functional11,12
aspects of rehabilitation. Changes in the outcome of participa-tion within this population have been under-studied. Onestudy explicitly examined how participation changes over a3-year period13 and found that change in participation inten-sity was evident in specific activity types (i.e. recreational,physical, and social) and was dependent on the child’s age.However, that study was conducted among children across abroad range of physical disabilities. Therefore, little is knownabout the recovery process in terms of participation amongchildren and adolescents following ABI or the changes in par-ticipation following ABI.
ª The Authors. Developmental Medicine & Child Neurology ª 2012 Mac Keith Press DOI: 10.1111/j.1469-8749.2011.04204.x 339
DEVELOPMENTAL MEDICINE & CHILD NEUROLOGY ORIGINAL ARTICLE
Selection of potential predictorsChild and family characteristics are identified as potential pre-dictors of participation among children with disabilities boththeoretically14 and empirically.15 Considering child character-istics, one of the leading predictors of change in recovery out-comes following ABI is severity of injury based on GlasgowComa Scale (GCS) score.8,10 Aetiology or the cause andmechanism of injury (e.g. accidental vs non-accidental) isanother factor that may be related to outcome.8 In addition,inpatient rehabilitation length of stay (LOS) in the hospital isassociated with functional outcomes.16 Finally, the child’s ageat the time of injury is an important factor to consider as it hasbeen shown that participation patterns change with age amongchildren with and without disabilities;17,18 this natural changeis most important as children move into adolescence at the ageof 12 years, when participation in most types of activitiesdeclines.
Regarding family characteristics, family functioning andsocio-economic status (SES)15,19,20 have been found to influ-ence outcome. Family functioning refers to the way the familyunit works together on essential tasks,21 which fall within dif-ferent dimensions such as problem solving, communication,and roles, among others.22
The purpose of the study is (1) to examine how participa-tion levels change over time (1y) in children and adolescentsfollowing ABI and (2) to explore the factors that affect thesechanges.
METHODParticipantsChildren were recruited from McMaster Children’s Hospitalin Hamilton, Ontario, Canada, between November 2001 andDecember 2003. They were identified through checking wardlists and emergency room lists every morning and wereincluded if (1) they were admitted to the hospital because ofABI; (2) they were aged 5 to 18 years; and (3) their initial com-puted tomography (CT) results and GCS scores were avail-able. ABI in this study was defined as damage to the brain thatis not related to a congenital neurodevelopment disorder. Outof the 434 children who were identified with ABI, 250 met theinclusion criteria (CT scan was not available, n=32; GCSscores were missing, n=41; age <5y, n=111). Of the 250 poten-tial participants, 65 refused consent (26%). Of the 185 pack-ages that were mailed, 136 were returned (74% response rate).
The sample included 136 children and adolescents withABI (88 males; 48 females) ranging in age from 4 years and11 months to 17 years and 6 months (mean 11y 6mo; SD 3y5mo). The causes of brain injury were as follows: massive vehi-cle accident, 37%; fall, 18%; and sports injury, bicycle acci-dent, or assault, 28%; in the remaining 17% ABI was due toother causes (e.g. near-drowning, brain tumour). To verifythat the ‘other cause’ subgroup (17%) did not differ from therest of the sample in terms of overall participation, t-tests wereperformed. No significant differences in participation diversity(t=0.9; p=0.37) or intensity (t=1.6; p=0.12) were found. Sev-enty-four per cent of participants had a mild injury, defined as
a GCS score of 13 to 15,23,24 whereas 26% had a moderate tosevere injury (GSC score £12) and were labelled as the non-mild group. In total, 40% lost consciousness, and the majoritydid not have seizures (96%). Initial CT was abnormal in 61%of the participants. Length of stay in the hospital ranged from1 to 89 days (median 4d; interquartile range 5–9d) and themajority of the children (80%) returned to school immediatelyafter discharge. At discharge, 76% were able to walk indepen-dently, 15% used an aid for walking, and 8% used a wheel-chair. Based on a median family income in the province ofOntario of $66 916,25 household income was at or below themedian for 44% of families and above the median for 56%.Forty-nine per cent of participants were from major urbanareas, 34% from small urban areas, and 17% from rural areas.The majority of the sample was white ⁄ Caucasian (75%), andEnglish was the language most often spoken at home (97%).
ProcedureThis study featured a prospective longitudinal inceptioncohort design. After informed consent was obtained from theparents and assents were signed by children aged 12 to18 years, the participation patterns were assessed at three timepoints over a period of 1 year: at baseline, that is when chil-dren returned to school, and at 8 months and 12 months afterbaseline. At baseline, family functioning was assessed andmedical and demographic information was retrieved from theparticipants’ medical records. The study was approved byMcMaster University Health Sciences Ethics Review Board.
MeasuresParticipation levels were measured using the Children’sAssessment of Participation and Enjoyment (CAPE),26 whichis a reliable and valid measure of involvement in everydayactivities outside mandated school activities in the previous4 months.27 The CAPE includes 49 different activities in fivecategories ⁄ types: recreational (12 items, e.g. playing board orcard games), active physical (nine items, e.g. team sports),social (nine items, e.g. visiting others), skill-based (nine items,e.g. doing gymnastics), and self-improvement activities (10items, e.g. going to the public library). The CAPE items werevalidated among children and adolescents with various physi-cal disabilities, including ABI.26 For further details see Imms’review.28
Two types of scores are generated from the CAPE: (1)diversity (a count of the number of activities in which the childhas participated); and (2) intensity (calculated by dividing thesum of item frequency by the number of possible activities ineach activity category). The intensity score ranges from 1(once ⁄ 4mo) to 7 (once ⁄ day). Diversity and intensity scores
What this paper adds• This article contributes to our understanding of how children's and adoles-
cents' participation in activities changes during the first year of recovery fol-lowing a brain injury.
• Child and family factors that predict participation curves are identified.• The importance of measuring and monitoring participation patterns after brain
injury, in particular the intensity of recreational, physical, and social activities,is explained.
340 Developmental Medicine & Child Neurology 2012, 54: 339–346
were calculated for each of the five activity types, resulting in10 scores overall.
Family functioning was measured using the ‘general func-tioning’ subscale of the Family Assessment Device (FAD).22
The FAD is a 60-item self-reported measure of family func-tioning rated on a four-point scale (1=strongly agree to4=strongly disagree). For example: ‘planning family activities isdifficult because we misunderstand each other’ (reversed item).A mean score was calculated and ranged from 1 to 4, where ahigher score indicated that family functioning was unhealthier ⁄poorer. The cut-off score for the general functioning subscaleis 2; thus, a mean score greater than 2 suggests an unhealthyfamily functioning, whereas a score of two or below indicates ahealthy family functioning.29 The general functioning subscaledemonstrated good reliability (internal consistency 0.86) andvalidity21 among a psychiatric population and a census sampleof children aged 4 to 16 years in Ontario, Canada.
Cause of injury (massive vehicle accident vs other injuries)and LOS in days were collected from medical files. Demo-graphic information such as age, sex, and household incomewas collected using a standard form.
Statistical analysisMultilevel models of change were built to describe and testchange in participation levels across the 12-month study per-iod. Multilevel models of change are mixed-effect models thattake into account each individual’s growth trajectory (within-person change).30 Two models were analysed: the level 1model tested the effect of time on participation and the level 2model tested the effect of time as a function of child character-istics (severity, LOS, cause of injury) and family features(household income, family functioning). Setting two levels ofmodels allowed us to compare covariance parameters, i.e. thevariance of the residuals and slopes, across models. Reduction inthe variation of these parameters indicated the extent to whichadding a predictor in level 2 improved the fit of the model.31
Since age at the time of injury has the potential to explainchanges in participation13 and to describe the recovery process
post ABI,8 all models controlled for age at injury. This variablewas centred on its sample mean by subtracting the mean (11y6mo) from each value of age. Centring age facilitated theinterpretation of the intercepts and hence indicated that thefitted intercepts represent the initial status of rate of change ofa child of average age (11y 6mo).30
Separate analyses were completed for each of the 10 CAPEscores using the restricted maximum likelihood. The coeffi-cients of interaction terms, for example time*severity, wereexamined to determine direction and magnitude of the inter-action effect. Differences in variation of slopes, i.e. rates ofchange, across models were calculated in percentages. Plots oftrajectories indicating changes in participation were generatedbased on the coefficients of the level 2 models. All statisticaltests were completed using SPSS 18 (SPSS Inc., Chicago, IL,USA), where alpha was set to 0.05.
Factors related to the child, i.e. severity of injury, length ofstay, cause of injury, and those related to their family, such ashousehold income and family functioning, were all treated asdichotomous variables and regrouped into two clusters. Themedian of length of stay, 4 days, served as the cut-off pointfor creating two groups. The cut-off score of the FAD (scoreof 2) was used to form two groups, one with higher levels offamily functioning (FAD £2, 72%) and one with lower levelsor unhealthy family functioning (FAD >2, 28%). For severityof injury, the GCS cut-off point of 12 was used to distinguishbetween the mild group (74%) and the non-mild (26%)group. Finally, two groups of cause of injury were generated,one comprising the 37% who had a massive vehicleaccident and the other comprising the 63% who had otherinjuries.
RESULTSSeparate models were tested for each CAPE score (overall 10scores). Results are reported by activity type for level 2 models(final models) that were found to be significant (see Tables Iand II), i.e. when child and family factors significantly predictchanges in participation over time.
Table I: The effect of severity of injury on rates of change in participation intensity
Recreational Physical Social
Level 1 model(time)
Level 2 model(time*severity)
Level 1 model(time)
Level 2 model(time*severity)
Level 1 model(time)
Level 2 model(time*severity)
Coefficient Coefficient SE Coefficient Coefficient SE Coefficient Coefficient SE
Fixed effectsIntercept 3.74a 3.62a 0.10 1.89a 1.88a 0.12 3.48a 3.44a 0.10Age at injury )0.24a )0.23a 0.02 )0.025 )0.038 0.02 0.07b 0.074b 0.02Severity 0.38 0.20 )0.083 0.24 )0.0092 0.20Time 0.0013 0.02 0.01 0.02c 0.044a 0.01 0.014 0.03b 0.009Time*severity )0.05c 0.02 )0.05c 0.02 )0.04c 0.017
Covariance parametersResidual 0.43a 0.41a 0.07 0.54a 0.54a 0.07 0.23a 0.23a 0.04Intercept 0.52a 0.57a 0.15 0.9a 0.88a 0.16 0.68a 0.72a 0.20Slope 0.0015 0.0012 0.001 0.0016 0.0005 0.001 0.0017 0.0012 0.0008Reduction invariance slope, %
– 20 – – 68 – – 29 –
ap<0.001; bp<0.01; cp<0.05. SE, standard error.
Predictors of Change in Participation Rates following ABI Dana Anaby et al. 341
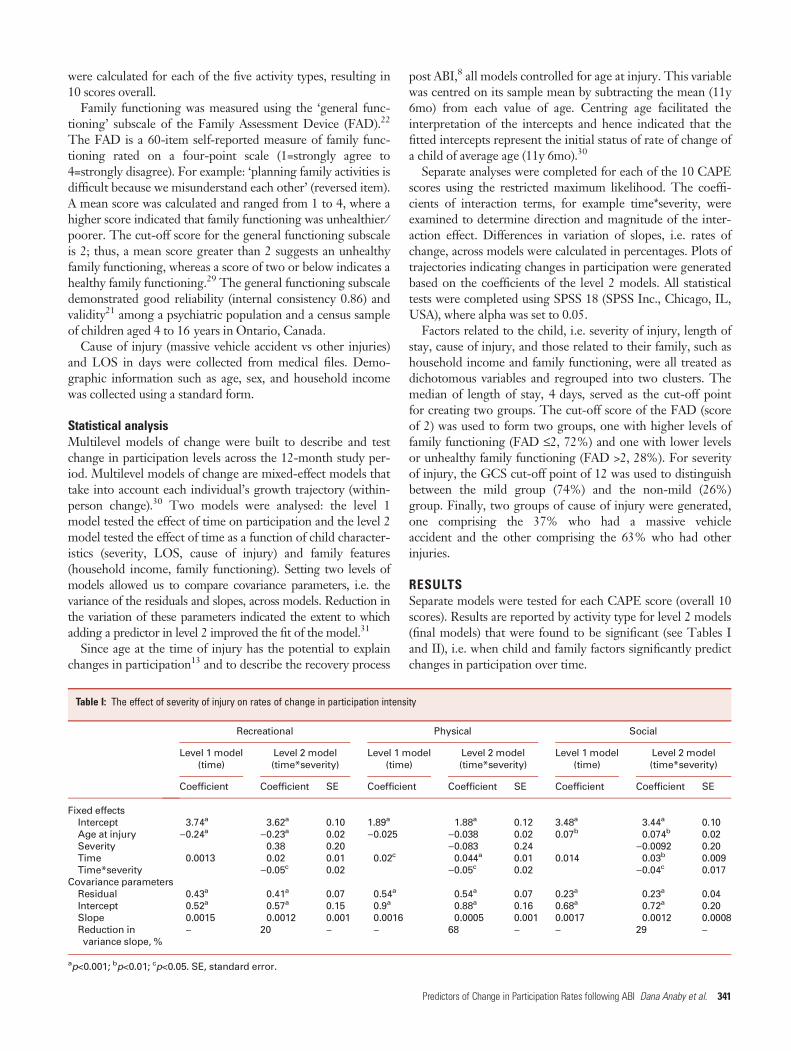
The effect of child's characteristics on rates of change ofparticipation patternsA significant interaction effect was found between the timeafter return to school and severity of injury for three of the fiveCAPE intensity scores: recreational, physical, and social activi-ties (see Table I). Level 1 models indicated that the effect oftime was not significant on its own, except in the case of physi-cal activities (for levels of participation before modelling seeTable SI; supporting material online); however, time becamesignificant in the presence of severity of injury according tolevel 2 models. Hence, changes over time in intensity of par-ticipation in recreational, physical, and social activities weresignificantly different between the mild and non-mild partici-pant groups (see Fig. 1). The coefficients of the interaction fortime*severity of injury indicate that the estimated differencesin rates of change between mild and non-mild groups werenegative and ranged from )0.04 to )0.05. The negative coeffi-cients indicate that the direction of growth in these two groups(mild vs non-mild) is different (Fig. 1). Scores for children inthe mild severity group improved over time, whereas scoresfor the non-mild group showed a slight decline over time.
Although residual values did not change a great amount acrossmodels when severity was added to the model, a reduction inthe variance of the rate of change (or slopes) was observed inall models: a 20% reduction for recreational activities, 68%for physical activities, and 29% for social activities.
Figure 1 shows prototypical trajectories derived from thelevel 2 models indicating that change in participation intensitywas different between children with mild and non-mild injury.The initial rate of participation in social activities was similarbetween the groups but among children with mild severityparticipation increased by 0.03 points per month on a seven-point scale. The estimated difference in rate of changebetween children with mild and non-mild ABI was –0.04,which was significant (p<0.05) and represented a decrease inparticipation scores (see Table I). Similar rates of change werefound for recreational and physical activities.
Although not significant, the initial rate of participation inrecreational activities was different. The estimated initial par-ticipation score for a child of average age (11y 6mo) with mildABI was 3.6, whereas for a child with non-mild ABI it washigher by 0.38 points (i.e. 4.00).
Table II: The effect of socio-economic status (SES) and family functioning (FF) on rates of change in participation
Diversity of skill-based activities Intensity of recreational activities
Level 1 model(time)
Level 2 model(time*FF)
Level 1 model(time)
Level 2 model(time*SES)
Coefficient Coefficient SE Coefficient Coefficient SE
Fixed effectsIntercept 1.9a 1.9a 0.15 3.8a 3.9a 0.12Age at injury )0.065 )0.07b 0.03 )0.24a )0.24a 0.023FF ⁄ SES – 0.029 0.3 – 0.25 0.17Time )0.025 )0.009 0.01 0.0013 )0.018 0.013Time*FF ⁄ SES – )0.08b 0.03 – )0.042b 0.018
Covariance parametersResidual 1.20a 1.20a 0.15 0.42a 0.36a 0.06Intercept 1.28a 1.26a 0.25 0.51a 0.52a 0.10Slope 0.008c 0.007b 0.003 0.0014 0.0013 0.0009Reduction in variance slope, % – 12 – – 7 –
ap<0.001; bp<0.05; cp<0.01. SE, standard error.
0
0.5
1
1.5
2
2.5
3
3.5
4
4.5
0 8m
o12
mo
8mo
12m
o8m
o12
mo0 0
Recreational Physical Social
Fre
quen
cy
MildNon-mild
Figure 1: The effect of severity on rates of change in participation intensity.
342 Developmental Medicine & Child Neurology 2012, 54: 339–346
Other factors related to the child, for example LOS andcause of injury, were not significant predictors for the CAPEscores, and therefore did not explain changes in participationrates.
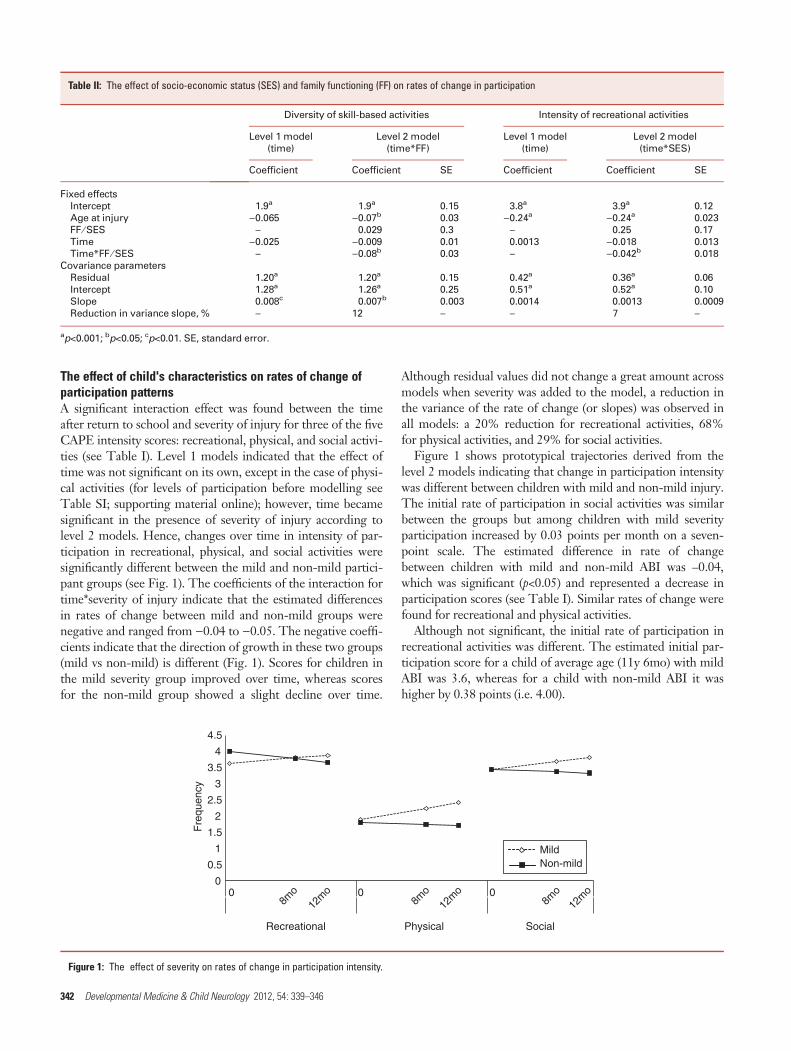
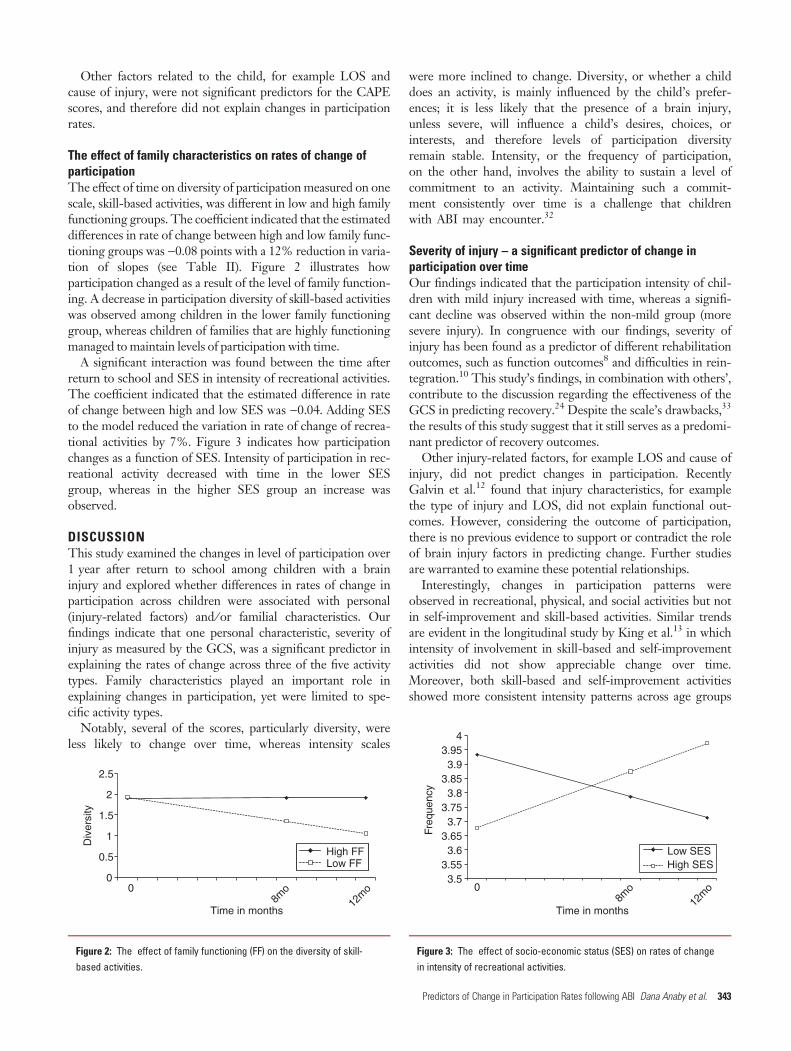
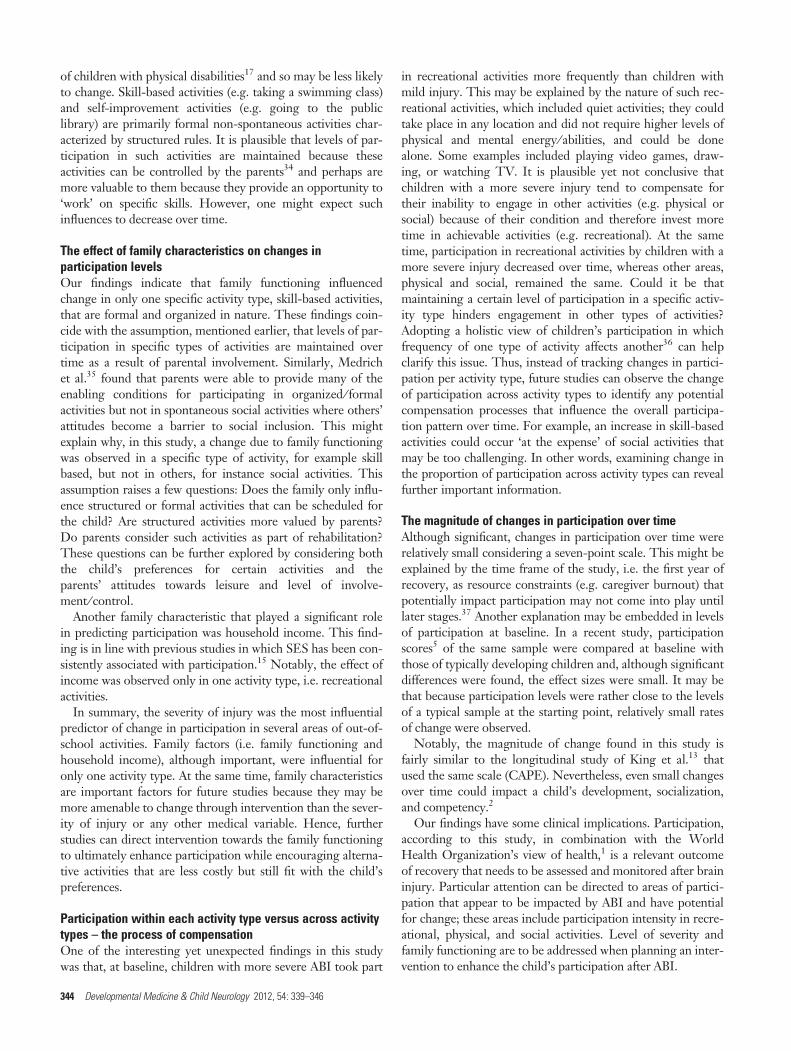
The effect of family characteristics on rates of change ofparticipationThe effect of time on diversity of participation measured on onescale, skill-based activities, was different in low and high familyfunctioning groups. The coefficient indicated that the estimateddifferences in rate of change between high and low family func-tioning groups was )0.08 points with a 12% reduction in varia-tion of slopes (see Table II). Figure 2 illustrates howparticipation changed as a result of the level of family function-ing. A decrease in participation diversity of skill-based activitieswas observed among children in the lower family functioninggroup, whereas children of families that are highly functioningmanaged to maintain levels of participation with time.
A significant interaction was found between the time afterreturn to school and SES in intensity of recreational activities.The coefficient indicated that the estimated difference in rateof change between high and low SES was )0.04. Adding SESto the model reduced the variation in rate of change of recrea-tional activities by 7%. Figure 3 indicates how participationchanges as a function of SES. Intensity of participation in rec-reational activity decreased with time in the lower SESgroup, whereas in the higher SES group an increase wasobserved.
DISCUSSIONThis study examined the changes in level of participation over1 year after return to school among children with a braininjury and explored whether differences in rates of change inparticipation across children were associated with personal(injury-related factors) and ⁄ or familial characteristics. Ourfindings indicate that one personal characteristic, severity ofinjury as measured by the GCS, was a significant predictor inexplaining the rates of change across three of the five activitytypes. Family characteristics played an important role inexplaining changes in participation, yet were limited to spe-cific activity types.
Notably, several of the scores, particularly diversity, wereless likely to change over time, whereas intensity scales
were more inclined to change. Diversity, or whether a childdoes an activity, is mainly influenced by the child’s prefer-ences; it is less likely that the presence of a brain injury,unless severe, will influence a child’s desires, choices, orinterests, and therefore levels of participation diversityremain stable. Intensity, or the frequency of participation,on the other hand, involves the ability to sustain a level ofcommitment to an activity. Maintaining such a commit-ment consistently over time is a challenge that childrenwith ABI may encounter.32
Severity of injury – a significant predictor of change inparticipation over timeOur findings indicated that the participation intensity of chil-dren with mild injury increased with time, whereas a signifi-cant decline was observed within the non-mild group (moresevere injury). In congruence with our findings, severity ofinjury has been found as a predictor of different rehabilitationoutcomes, such as function outcomes8 and difficulties in rein-tegration.10 This study’s findings, in combination with others’,contribute to the discussion regarding the effectiveness of theGCS in predicting recovery.24 Despite the scale’s drawbacks,33
the results of this study suggest that it still serves as a predomi-nant predictor of recovery outcomes.
Other injury-related factors, for example LOS and cause ofinjury, did not predict changes in participation. RecentlyGalvin et al.12 found that injury characteristics, for examplethe type of injury and LOS, did not explain functional out-comes. However, considering the outcome of participation,there is no previous evidence to support or contradict the roleof brain injury factors in predicting change. Further studiesare warranted to examine these potential relationships.
Interestingly, changes in participation patterns wereobserved in recreational, physical, and social activities but notin self-improvement and skill-based activities. Similar trendsare evident in the longitudinal study by King et al.13 in whichintensity of involvement in skill-based and self-improvementactivities did not show appreciable change over time.Moreover, both skill-based and self-improvement activitiesshowed more consistent intensity patterns across age groups
3.5 0
8mo
12m
o
3.55 3.6
3.65 3.7
3.75 3.8
3.85 3.9
3.95 4
Freq
uenc
y
Time in months
Low SESHigh SES
Figure 3: The effect of socio-economic status (SES) on rates of changein intensity of recreational activities.
00
8mo
12m
o
0.5
1
1.5
2
2.5
Div
ersi
ty
Time in months
High FF Low FF
Figure 2: The effect of family functioning (FF) on the diversity of skill-based activities.
Predictors of Change in Participation Rates following ABI Dana Anaby et al. 343
of children with physical disabilities17 and so may be less likelyto change. Skill-based activities (e.g. taking a swimming class)and self-improvement activities (e.g. going to the publiclibrary) are primarily formal non-spontaneous activities char-acterized by structured rules. It is plausible that levels of par-ticipation in such activities are maintained because theseactivities can be controlled by the parents34 and perhaps aremore valuable to them because they provide an opportunity to‘work’ on specific skills. However, one might expect suchinfluences to decrease over time.
The effect of family characteristics on changes inparticipation levelsOur findings indicate that family functioning influencedchange in only one specific activity type, skill-based activities,that are formal and organized in nature. These findings coin-cide with the assumption, mentioned earlier, that levels of par-ticipation in specific types of activities are maintained overtime as a result of parental involvement. Similarly, Medrichet al.35 found that parents were able to provide many of theenabling conditions for participating in organized ⁄ formalactivities but not in spontaneous social activities where others’attitudes become a barrier to social inclusion. This mightexplain why, in this study, a change due to family functioningwas observed in a specific type of activity, for example skillbased, but not in others, for instance social activities. Thisassumption raises a few questions: Does the family only influ-ence structured or formal activities that can be scheduled forthe child? Are structured activities more valued by parents?Do parents consider such activities as part of rehabilitation?These questions can be further explored by considering boththe child’s preferences for certain activities and theparents’ attitudes towards leisure and level of involve-ment ⁄ control.
Another family characteristic that played a significant rolein predicting participation was household income. This find-ing is in line with previous studies in which SES has been con-sistently associated with participation.15 Notably, the effect ofincome was observed only in one activity type, i.e. recreationalactivities.
In summary, the severity of injury was the most influentialpredictor of change in participation in several areas of out-of-school activities. Family factors (i.e. family functioning andhousehold income), although important, were influential foronly one activity type. At the same time, family characteristicsare important factors for future studies because they may bemore amenable to change through intervention than the sever-ity of injury or any other medical variable. Hence, furtherstudies can direct intervention towards the family functioningto ultimately enhance participation while encouraging alterna-tive activities that are less costly but still fit with the child’spreferences.
Participation within each activity type versus across activitytypes – the process of compensationOne of the interesting yet unexpected findings in this studywas that, at baseline, children with more severe ABI took part
in recreational activities more frequently than children withmild injury. This may be explained by the nature of such rec-reational activities, which included quiet activities; they couldtake place in any location and did not require higher levels ofphysical and mental energy ⁄ abilities, and could be donealone. Some examples included playing video games, draw-ing, or watching TV. It is plausible yet not conclusive thatchildren with a more severe injury tend to compensate fortheir inability to engage in other activities (e.g. physical orsocial) because of their condition and therefore invest moretime in achievable activities (e.g. recreational). At the sametime, participation in recreational activities by children with amore severe injury decreased over time, whereas other areas,physical and social, remained the same. Could it be thatmaintaining a certain level of participation in a specific activ-ity type hinders engagement in other types of activities?Adopting a holistic view of children’s participation in whichfrequency of one type of activity affects another36 can helpclarify this issue. Thus, instead of tracking changes in partici-pation per activity type, future studies can observe the changeof participation across activity types to identify any potentialcompensation processes that influence the overall participa-tion pattern over time. For example, an increase in skill-basedactivities could occur ‘at the expense’ of social activities thatmay be too challenging. In other words, examining change inthe proportion of participation across activity types can revealfurther important information.
The magnitude of changes in participation over timeAlthough significant, changes in participation over time wererelatively small considering a seven-point scale. This might beexplained by the time frame of the study, i.e. the first year ofrecovery, as resource constraints (e.g. caregiver burnout) thatpotentially impact participation may not come into play untillater stages.37 Another explanation may be embedded in levelsof participation at baseline. In a recent study, participationscores5 of the same sample were compared at baseline withthose of typically developing children and, although significantdifferences were found, the effect sizes were small. It may bethat because participation levels were rather close to the levelsof a typical sample at the starting point, relatively small ratesof change were observed.
Notably, the magnitude of change found in this study isfairly similar to the longitudinal study of King et al.13 thatused the same scale (CAPE). Nevertheless, even small changesover time could impact a child’s development, socialization,and competency.2
Our findings have some clinical implications. Participation,according to this study, in combination with the WorldHealth Organization’s view of health,1 is a relevant outcomeof recovery that needs to be assessed and monitored after braininjury. Particular attention can be directed to areas of partici-pation that appear to be impacted by ABI and have potentialfor change; these areas include participation intensity in recre-ational, physical, and social activities. Level of severity andfamily functioning are to be addressed when planning an inter-vention to enhance the child’s participation after ABI.
344 Developmental Medicine & Child Neurology 2012, 54: 339–346
Limitations and future directionsThis is the first study that examines change over time in theoutcome of participation within this population, and as suchserves as a building block for future studies. One of the limita-tions of the study is that it followed changes in participation inthe first year after return to school in relatively small timeintervals. It is plausible that different pattern of change wouldbe observed at different time points or later stages within theprocess of recovery. For example, levels of participation at thestarting point, i.e. return to school, can affect rates of changeover time. However, examining the correlations between theintercepts and the slopes indicated no significant associationacross all activity types, with the exception of physical activity.Overall, the first year of recovery is considered critical in therehabilitation process following a brain injury,11 and return toschool is a crucial transition point.
The way in which participation was measured should alsobe noted. Although participation was examined in variousactivity types using a valid and reliable measure (CAPE), itaddressed two dimensions (diversity and intensity) and coveredone participation domain (leisure). Examining participation indifferent settings while considering the subjective dimensionof participation, for example satisfaction, can complement ourfindings. In addition, parents who completed the CAPE werenot blinded to medical information or the general objectivesof the study. Finally, the CAPE was assessed at different sea-
sons between 2001 and 2003, which potentially could haveinfluenced patterns of participation.
This study tested multiple models considering its samplesize. However, the overall findings coincide with previous evi-dence13 where the intensity of specific activity types (i.e. rec-reational, physical, and social) is potentially sensitive tochange. This increases the confidence of the findings, yetfurther study is needed using larger samples.
Changes in participation due to changes in a child’sdevelopment and functional abilities over time were notspecifically examined in this study. Future studies withlarger samples can examine how such factors, along with bio-medical variables (e.g. GCS scores), influence participationover time.
In conclusion, changes in levels of participation areobserved during the first year of recovery after brain injury.These changes are influenced by child factors of severity andfamily factors such as SES and function. Exploring participa-tion at different time points across the recovery process in avariety of populations and including broader aspects of theenvironment and adapted activities as key predictors of changeis warranted.
ONLINE MATERIAL ⁄ SUPPORTING INFORMATIONAdditional material and supporting information for this paper may befound online.
REFERENCES
1. WHO. International Classification of Functioning, Disabil-
ity and Health. Geneva: WHO, 2001.
2. Larson RW. Toward a psychology of positive youth devel-
opment. Am Psychol 2000; 55: 170–83.
3. Desha LN, Ziviani JM. Use of time in childhood and
adolescence: a literature review on the nature of activity
participation and depression. Aust Occup Ther J 2007; 54: 4–
10.
4. Centers for Disease Control and Prevention. (2010) Trau-
matic brain injury in the United States: emergency depart-
ment visits, hospitalizations, and deaths, 2002–2006. http://
www.cdc.gov/traumaticbraininjury/tbi_ed.html (accessed 21
November 2011).
5. Law M, Anaby D, DeMatteo C, Hanna S. Participation pat-
terns of children with acquired brain injury. Brain Inj 2011;
25: 587–95.
6. Bedell GM, Dumas HM. Social participation of children and
youth with acquired brain injuries discharged from inpatient
rehabilitation: a follow-up study. Brain Inj 2004; 18: 65–82.
7. Galvin J, Froude EH, McAleer J. Children’s participation in
home, school and community life after acquired brain injury.
Aust Occup Ther J 2010; 57: 118–26.
8. Johnson AR, DeMatt E, Salorio CF. Predictors of outcome
following acquired brain injury in children. Dev Disabil Res
Rev 2009; 15: 124–32.
9. McKinlay A, Dalrymple-Alford JC, Horwood LJ, Fergusson
DM. Long term psychosocial outcomes after mild head
injury in early childhood. J Neurol Neurosurg Psychiatry
2002; 73: 281–8.
10. Muscara F, Catroppa C, Eren S, Anderson V. The impact of
injury severity on long-term social outcome following paedi-
atric traumatic brain injury. Neuropsychol Rehabil 2009; 19:
541–61.
11. Forsyth RJ, Salorio CF, Christensen JR. Modelling early
recovery patterns after paediatric traumatic brain injury. Arch
Dis Child 2010; 95: 266–70.
12. Galvin J, Lim BC, Steer K, Edwards J, Lee KJ. Predictors of
functional ability of Australian children with acquired brain
injury following inpatient rehabilitation. Brain Inj 2010; 24:
1008–16.
13. King G, McDougall J, DeWit D, Petrenchik T, Hurley P,
Law M. Predictors of change over time in the activity partici-
pation of children and youth with physical disabilities. Child
Health Care 2009; 38: 321–51.
14. King G, Law M, King S, Rosenbaum P, Kertoy MK, Young
NL. A conceptual model of the factors affecting the recrea-
tion and leisure participation of children with disabilities.
Phys Occup Ther Pediatr 2003; 23: 63–90.
15. King G, Law M, Hanna S, et al. Predictors of the leisure and
recreation participation of children with physical disabilities:
a structural equation modeling analysis. Child Health Care
2006; 35: 209–34.
16. Bedell GM. Functional outcomes of school-age children with
acquired brain injuries at discharge from inpatient rehabilita-
tion. Brain Inj 2008; 22: 313–24.
17. King G, Law M, Hurley P, Petrenchik T, Schwellnus H. A
developmental comparison of the out-of-school recreation
and leisure activity participation of boys and girls with and
without physical disabilities. Int J Disabil Dev Edu 2010; 57:
77–107.
18. Jarus T, Anaby D, Bart O, Engel-Yeger B, Law M. Child-
hood participation in after-school activities: what is to be
expected? Br J Occup Ther 2010; 73: 344–50.
19. Taylor HG, Yeates KO, Wade SL, Drotar D, Stancin T, Bu-
rant C. Bidirectional child-family influences on outcomes of
traumatic brain injury in children. J Int Neuropsychol Soc
2001; 7: 755–67.
20. King G, Petrenchik T, Law M, Hurley P. The enjoyment of
formal and informal recreation and leisure activities: a com-
parison of school-aged children with and without physical
disabilities. Int J Disabil Dev Edu 2009; 56: 109–30.
21. Byles J, Byrne C, Boyle MH, Offord DR. Ontario Child
Health Study: reliability and validity of the general function-
ing subscale of the McMaster Family Assessment Device.
Fam Process 1988; 27: 97–104.
22. Epstein NB, Baldwin LM, Bishop DS. The McMaster
Family Assessment Device. J Marital Fam Ther 1983; 9:
171–80.
23. Chapman SB, Nasits J, Challas JD, Billinger AP. Long-term
recovery in paediatric head injury: overcoming the hurdles.
Int J Speech Lang Pathol 1999; 1: 19–30.
24. Sternbach GL. The Glasgow coma scale. J Emerg Med 2000;
19: 67–71.
25. Statistics Canada. (2006) Census Tables Income and Earn-
ings. http://www12.statcan.ca.libaccess.lib.mcmaster.ca/cen-
sus-recensement/2006/dp-pd/hlt/index-eng.cfm (accessed 6
April 2011).
26. King G, Law M, King S, et al. Children’s Assessment of Par-
ticipation and Enjoyment (CAPE) and Preferences for Activi-
ties of Children (PAC). San Antonio, TX: Harcourt
Assessment, 2004.
Predictors of Change in Participation Rates following ABI Dana Anaby et al. 345
27. King GA, Law M, King S, et al. Measuring children’s partici-
pation in recreation and leisure activities: construct validation
of the CAPE and PAC. Child Care Health Dev 2007; 33: 28–
39.
28. Imms C. Review of the Children’s Assessment of
Participation and Enjoyment and the Preferences for
Activity of Children. Phys Occup Ther Pediatr 2008; 28:
389–404.
29. Miller IW, Bishop DS, Epstein NB, Keitner GI. The
McMaster Family Assessment Device – reliability and valid-
ity. J Marital Fam Ther 1985; 11: 345–56.
30. Singer JD, Willett JB. Applied Longitudinal Data Analysis:
Modeling Change and Event Occurrence. Oxford; New
York: Oxford University Press, 2003.
31. Peugh JL, Enders CK. Using the SPSS mixed procedure to
fit cross-sectional and longitudinal multilevel models. Edu
Psychol Measure 2005; 65: 717–41.
32. Dumas HM, Bedell GM, Shannon Hamill M. Strategies
to promote activity and participation in children and
youths with acquired brain injuries. Int J Rehabil Res
2003; 26: 303–8.
33. Lieh-Lai MW, Theodorou AA, Sarnaik AP, Meert KL,
Moylan PM, Canady AI. Limitations of the Glasgow Coma
Scale in predicting outcome in children with traumatic brain
injury. J Pediatr 1992; 120: 195–9.
34. Bedell GM, Cohn ES, Dumas HM. Exploring parents’ use of
strategies to promote social participation of school-age chil-
dren with acquired brain injuries. Am J Occup Ther 2005; 59:
273–84.
35. Medrich EA. The Serious Business of Growing Up: A Study
of Children’s Lives Outside School. Berkeley: University of
California Press, 1982.
36. Feldman AF, Matjasko JL. The role of school-based extracur-
ricular activities in adolescent development: a comprehensive
review and future directions. Rev Edu Res 2005; 75: 159–210.
37. DeMatteo CA, Cousins MA, Lin CY, Law MC, Colantonio
A, Macarthur C. Exploring postinjury living environments
for children and youth with acquired brain injury. Arch Phys
Med Rehabil 2008; 89: 1803–10.
346 Developmental Medicine & Child Neurology 2012, 54: 339–346