predicting the quantifiable impacts of iso 50001 on ... · predicting the quantifiable impacts of...
TRANSCRIPT
Predicting the Quantifiable Impacts of ISO
50001 on Climate Change Mitigation
Aimee McKanea, Peter Therkelsena, Anna Scodela, Prakash Raoa, Arian Aghajanzadeha, Simon Hirzelb, Ruiqin Zhangc, Richard Premd, Alberto Fossae, Ana M. Lazarevskaf, Marco Matteinig, Bettina Schreckg, Fabian Allardh, Noé Villegal Alcántari, Karel Steynj, Ertaç Hürdoğank, Thomas Björkmanl, and John O’Sullivanm
a Lawrence Berkeley National Laboratory, One Cyclotron Road, Berkeley, CA 94720,
USA b Fraunhofer Institute for Systems and Innovation Research ISI, Breslauer Strasse 48,
76139 Karlsruhe, Germany c Zhengzhou University, No. 100 Science Avenue, Zhengzhou 450001, China d Prem Consulting, Josefstaedter Strasse, 51/1/30, 1080 Vienna, Austria e MDJ Consulting, Avenia Vereador José Diniz, 3720 - 7o andar, São Paulo, Brazil f Ss. Cyril and Methodius University, Faculty of Mechanical Engineering, ul. Rugjer
Boshkovikj, bb, Skopje, Macedonia g United Nations Industrial Development Organization, Vienna International Centre,
P.O. Box 300, A-1400, Vienna, Austria h Natural Resources Canada, 580 Booth Street, Ottawa, Ontario, Canada i National Commission for the Efficient Energy Use, Av. Revolución 1877, Piso 8,
Barrio Loreto, Álvaro Obregón, 01090, Ciudad de México, Mexico j Eskom, PO Box 1091, Johannesburg, 2001, South Africa k Osmaniye Korkut Ata University, 80000 Osmaniye, Turkey l Swedish Energy Agency, Kungsgatan 43 Eskilstuna, Rosenlundsgatan 9,
Stockholm, Sweden m Sustainable Energy Authority of Ireland, Wilton Park House, Wilton Place, Dublin
2 D02 T228
Energy Technologies Area August, 2017
LBNL-2001076
ii
Disclaimer
This document was prepared as an account of work sponsored by the United States
Government. While this document is believed to contain correct information, neither the
United States Government nor any agency thereof, nor The Regents of the University of
California, nor any of their employees, makes any warranty, express or implied, or
assumes any legal responsibility for the accuracy, completeness, or usefulness of any
information, apparatus, product, or process disclosed, or represents that its use would not
infringe privately owned rights. Reference herein to any specific commercial product,
process, or service by its trade name, trademark, manufacturer, or otherwise, does not
necessarily constitute or imply its endorsement, recommendation, or favoring by the
United States Government or any agency thereof, or The Regents of the University of
California. The views and opinions of authors expressed herein do not necessarily state or
reflect those of the United States Government or any agency thereof or The Regents of
the University of California.
iii
Acknowledgements
This work was supported by the Office of the Assistant Secretary for International Affairs
of the U.S. Department of Energy, under U.S. Department of State Interagency
agreement S-OES-12-1A-0010, Contract No. 3012199.
The authors particularly acknowledge the support of Graziella Siciliano, of U.S.
Department of Energy, and of the Clean Energy Ministerial’s Energy Management
Working Group (EMWG).
The authors would like to acknowledge the review and feedback received from their
additional colleagues on the ISO 50001 Global Impacts Research Network:
Ali Hasanbeigi, Global Efficiency Intelligence, LLC
Chris Beregszaszy, National Resources Canada
Omar Fredy Prias Cacicedo, Universidad Nacional de Colombia sede Bogotá, Colombia
Dr. Juan Carlos Campos, Universidad del Atlántico University, Colombia
Lázaro Flores Diaz, Asociación de Normalización y Certificación, Mexico
Emilson dos Santos, University of São Paulo, Brazil
Dr. Anita Grozdanov, Ss. Cyril and Methodius University, Macedonia
Erik Gudbjerg, Your Energy, Denmark
Alfred Hartzenburg, Council for Scientific and Industrial Research, South Africa
Dr. Ertac Hurdogan, Osmaniye Korkut Ata University, Turkey
Israel Jauregui, CONUEE, Mexico
Peter Maagøe, Viegand maagøe, Denmark
Petra Lackner, Austrian Energy Agency, Austria
Liam McLaughlin, GEN Europe S.L., Ireland
Bettina Schreck, UNIDO
Karl Steyn, ESKOM, South Africa
Wang Ke, Zhengzhou University, China
Robert Williams, Energy Efficiency Consultant, Austria
Felipe Sgarbi, University of São Paulo, Brazil
1
Abstract
Energy consumption in the industrial and commercial (service) sectors accounts for
nearly 40% of global greenhouse gas emissions. Reducing this energy consumption will
be critical for countries to achieve their national greenhouse gas reduction commitments.
The ISO 50001-Energy management standard provides a continual improvement
framework for organizations to reduce their consumption. Several national policies
already support ISO 50001; however, there is no transparent, consistent process to
estimate the potential impacts of its implementation.
This paper presents the ISO 50001 Impacts Methodology, an internationally-developed
methodology to calculate these impacts at a national, regional, or global scale suitable for
use by policymakers. The recently-formed ISO 50001 Global Impacts Research Network
provides a forum for policymakers to refine and encourage use of the methodology.
Using this methodology, a scenario with 50% of projected global industrial and service
sector energy consumption under ISO 50001 management by 2030 would generate
cumulative primary energy savings of approximately 105 EJ, cost savings of nearly US
$700 billion (discounted to 2016 net present value), and 6500 million metric tons (Mt) of
avoided CO2 emissions. The avoided annual CO2 emissions in 2030 alone are equivalent
to removing 210 million passenger vehicles from the road.
Highlights
Present a methodology to estimate global or national impacts of ISO 50001 uptake
Policymakers can use this methodology in developing national or regional programs
Methodology applies to global energy consumption in industrial and service sectors
Estimates of 105 EJ of cumulative primary energy saving from ISO 50001 by 2030
Keywords
Climate change mitigation; Energy management; ISO 50001; Savings methodology;
Energy savings; Greenhouse gas emissions
Suggested Citation:
Aimee McKane, Peter Therkelsen, Anna Scodel, Prakash Rao, Arian Aghajanzadeh,
Simon Hirzel, Ruiqin Zhang, Richard Prem, Alberto Fossa, Ana M. Lazarevska, Marco
Matteini, Bettina Schreck, Fabian Allard, Noé Villegal Alcántar, Karel Steyn, Ertaç
Hürdoğan, Thomas Björkman, John O'Sullivan, Predicting the quantifiable impacts of
ISO 50001 on climate change mitigation, Energy Policy, Volume 107, August 2017,
Pages 278-288, ISSN 0301-4215, https://doi.org/10.1016/j.enpol.2017.04.049.
2
Table of Contents Acknowledgements ............................................................................................................ iii Abstract ............................................................................................................................... 1 Abbreviations ...................................................................................................................... 3
1 Introduction .................................................................................................................. 4 2 Background .................................................................................................................. 5 3 ISO 50001 – Energy Management System Standard ................................................... 1 4 Global ISO 50001 Uptake and Supporting Policies .................................................... 2 5 Methodology ................................................................................................................ 3
5.1 Determining an ISO 50001 Uptake Function ................................................... 4
5.2 Calculating Energy Savings.............................................................................. 5 5.2.1 Calculating Energy Savings for the Initial Year .................................... 6
5.2.2 Calculating Energy Savings for Subsequent Years ............................... 6 5.3 Calculating Energy Cost Savings ..................................................................... 8 5.4 Calculating CO2 Savings .................................................................................. 9
5.5 Cumulative Savings from Individual Years ..................................................... 9 5.6 Summary of ISO 50001 Impacts Methodology ................................................ 9
6 Data ............................................................................................................................ 11
7 Conclusion and Policy Implications .......................................................................... 12 Appendix A ....................................................................................................................... 15
References ......................................................................................................................... 21
3
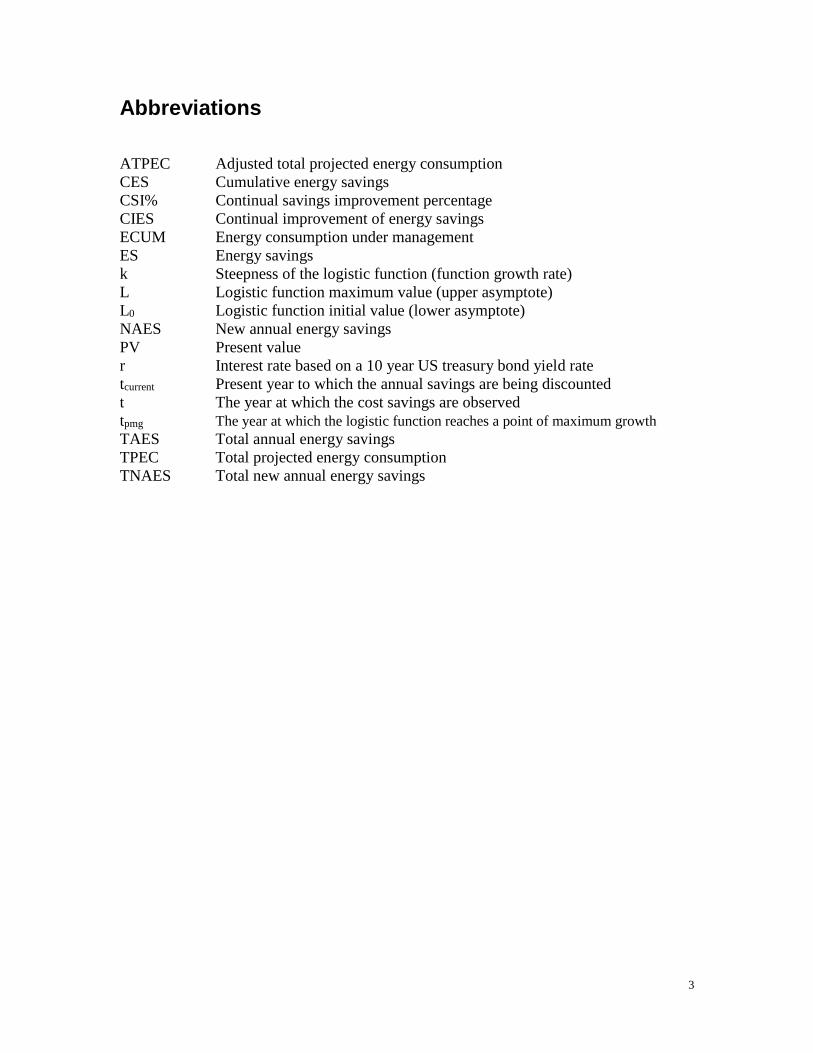
Abbreviations
ATPEC Adjusted total projected energy consumption
CES Cumulative energy savings
CSI% Continual savings improvement percentage
CIES Continual improvement of energy savings
ECUM Energy consumption under management
ES Energy savings
k Steepness of the logistic function (function growth rate)
L Logistic function maximum value (upper asymptote)
L0 Logistic function initial value (lower asymptote)
NAES New annual energy savings
PV Present value
r Interest rate based on a 10 year US treasury bond yield rate
tcurrent Present year to which the annual savings are being discounted
t The year at which the cost savings are observed
tpmg The year at which the logistic function reaches a point of maximum growth
TAES Total annual energy savings
TPEC Total projected energy consumption
TNAES Total new annual energy savings
4
1 Introduction
For the 197 countries who are convention parties to the United Nations Conference on
Climate Change 2015 Paris Agreement, achieving their GHG reduction targets will
require an unprecedented focus on effective policies, international coordination, and
engagement with key stakeholders, especially in the private sector. Because energy
consumption in the industrial and commercial sectors accounts for nearly 40% of global
GHG emissions (Fischedick et al., 2014; Lucon et al., 2014), reducing energy
consumption in these sectors is critical for countries working to achieve their GHG
reduction targets. Although the energy savings potential in the industrial and commercial
sectors is significant, barriers remain to achieving these savings. According to the
Intergovernmental Panel on Climate Change, “a lack of human and institutional
capacities to encourage management decisions is a primary barrier for energy efficiency
that must be removed for the industrial sector to realize its mitigation potential”
(Fischedick et al., 2014).
The systematic management of energy has been identified as a pathway to overcome a
number of these barriers and improve energy efficiency in organizations while
maintaining productivity (EMWG, 2014). The International Organization for
Standardization (ISO) 50001 - Energy management systems – Requirements with
guidance for use provides a continual improvement framework to guide organizations in
making energy performance improvement an ongoing part of normal business operations,
rather than focusing on individual efficiency projects (McKane et al., 2009). Through its
dual emphasis on an energy management system (EnMS) and continual improvement of
energy performance, ISO 50001 assists organizations in reducing industrial and
commercial energy consumption, managing energy costs, and avoiding GHG emissions.
Therkelsen et al. (2015) have shown that the implementation of an ISO 50001-certified
EnMS results in more than four times the energy savings achieved under a business as
usual scenario, with a payback of under 1.5 years for medium to large industrial facilities.
Organizations around the world are implementing ISO 50001 on their own initiative and
in response to national and regional policies and programs. Facilities that implement ISO
50001 can choose to demonstrate their conformance to the standard through validation by
an external certification body. An ISO-maintained database of these certifications reports
that nearly 12000 ISO 50001 certificates were issued worldwide in 2015, up from nearly
7000 in 2014 (ISO, 2015). While the number of ISO 50001 certificates issued continues
to increase, accelerated uptake is needed to significantly impact global GHG emissions.
To support this acceleration, policymakers need to be able to transparently assign,
evaluate, and communicate the value of ISO 50001 adoption on a national, regional, and
global scale. In addition, policymakers would greatly benefit from opportunities to share
information on the relative efficacy of ISO 50001-enabling policies in a range of
regulatory contexts.
The Energy Management Working Group (EMWG) of the Clean Energy Ministerial
provides an international forum for member governments to collaborate on activities to
5
accelerate broad use of EnMS in industry and commercial buildings worldwide (EMWG,
2016a). The EMWG identified the need for an internationally-developed, transparent, and
adaptable methodology to estimate the impacts of ISO 50001 and subsequently
established the ISO 50001 Global Impacts Research Network (Impacts Network).
Membership of the Impacts Network includes international academics, researchers, and
policymakers, who collectively are tasked with providing input on the development of the
methodology and facilitating discussion of policy drivers for energy management.
This paper describes the ISO 50001 Impacts Methodology as set forth in the ISO 50001
Impacts Estimator Tool (IET 50001) and presents estimates of the potential global
energy, energy cost, and carbon dioxide (CO2) emissions savings associated with ISO
50001 uptake. The IET 50001 software is designed to help global policymakers estimate
the impact of implementing ISO 50001 in a country or region. The Impacts Network has
provided comments and expert guidance in shaping and refining the methodology
presented in this paper. To provide a policy context, the Impacts Network experts have
also contributed several examples of national and regional ISO 50001 implementation
plans, actions, and impacts, which are included in Appendix A.
2 Background
Reducing energy consumption in the industrial and commercial sectors presents a
significant opportunity for countries to achieve the GHG reduction targets outlined in the
COP21 INDCs. The industrial sector1 contributes 30% of total GHG emissions, of which
85% are CO2 (Fischedick et al., 2014). Based on Lucon et al. (2014), the commercial
sector accounts for 7% of global GHG emissions. The bulk of commercial-sector
emissions are indirect CO2 emissions from the consumption of electricity in buildings.
In recent decades there have been improvements in energy intensity (a measure of the
energy used per unit of output) in the industrial sector, but the progress has been more
than offset by growth in production (IIP, 2012). Looking forward, energy demand in both
the industrial and service sectors is expected to steadily grow (EIA, 2013; Fischedick et
al., 2014), making it particularly important for governments and businesses to work
towards achieving greater improvements in energy performance to limit climate impacts.
Improved energy efficiency has been identified as a low-cost option to reduce CO2
emissions from organizations while maintaining or improving productivity levels (IEA,
2015a; UNIDO, 2011). Substantial energy savings are available in the industrial and
service sectors from both technological and operational improvements (UNIDO, 2011).
Cost savings potentials in the service sector from high-performance envelope and higher-
efficiency equipment are between 35-50%, and retrofits can achieve 25-70% savings in
total energy use (Lucon et al., 2014).
1 For the purposes of this paper the industrial sector includes manufacturing, mining, and
construction.

6
Although best available technologies are approaching technical limits for some sectors,
there remain many energy-efficiency opportunities in optimizing the operation of
industrial processes and the configuration and operation of industrial and service sector
systems, especially for less energy-intensive industries. For example, motor-driven
equipment consumes about 60% of electricity in manufacturing, and while replacing
motors can deliver between 2% and 5% in energy savings, optimizing the motor system,
made up of multiple components, can achieve savings between 20-30% (UNIDO, 2010).
The emissions mitigation potential associated with industrial efficiency improvements is
higher in developing countries than in developed ones (UNIDO, 2011), offering
substantial opportunity to incorporate energy efficiency improvements into new facility
design and to sustain these efficiencies through effective energy management.
Despite the significant potential for efficiency improvements and emissions reductions,
barriers continue to limit uptake of these measures including: management focus on
production rather than energy; lack of energy use and consumption data; lack of
understanding of financial and other non-energy benefits from reducing energy use; a
shortage of technical skills for identifying, developing, and implementing energy
efficiency measures; a disconnect between capital costs and operating costs, and limited
upfront capital (DOE, 2015; McKane et al., 2009; Sorrell et al., 2011). Energy
management systems provide an organizational structure for overcoming these barriers.
1
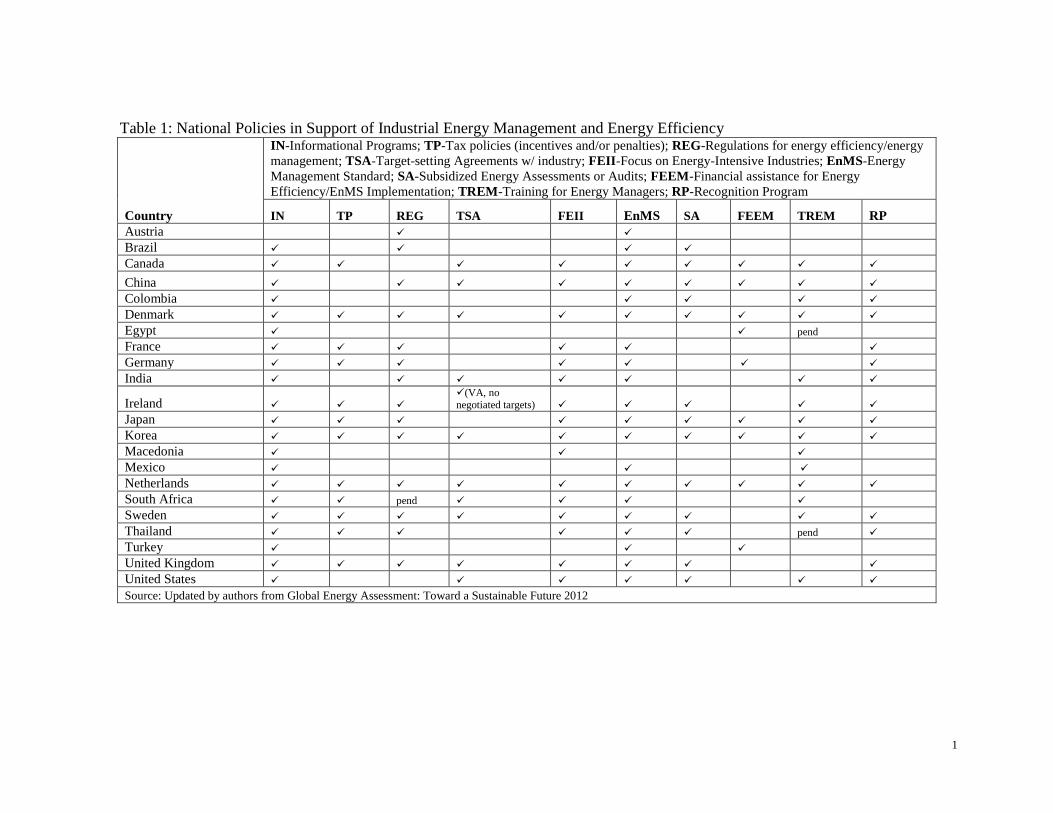
Table 1: National Policies in Support of Industrial Energy Management and Energy Efficiency
Country
IN-Informational Programs; TP-Tax policies (incentives and/or penalties); REG-Regulations for energy efficiency/energy
management; TSA-Target-setting Agreements w/ industry; FEII-Focus on Energy-Intensive Industries; EnMS-Energy
Management Standard; SA-Subsidized Energy Assessments or Audits; FEEM-Financial assistance for Energy
Efficiency/EnMS Implementation; TREM-Training for Energy Managers; RP-Recognition Program
IN TP REG TSA FEII EnMS SA FEEM TREM RP
Austria
Brazil
Canada
China
Colombia
Denmark
Egypt pend
France
Germany
India
Ireland (VA, no negotiated targets)
Japan Korea Macedonia
Mexico
Netherlands South Africa pend
Sweden Thailand pend Turkey
United Kingdom United States
Source: Updated by authors from Global Energy Assessment: Toward a Sustainable Future 2012
1
3 ISO 50001 – Energy Management System Standard
Energy management has been identified as a key component of achieving energy savings
in the industrial and commercial sectors (UNIDO, 2011; Worrell, 2011), which means it
is a key component of achieving GHG emissions reductions. A key outcome of ISO
50001 implementation is continual improvement in energy performance. Energy
performance is defined by ISO 50001:2011 as the, “measurable results related to energy
efficiency, energy use, and energy consumption.” Backlund, et. al. (2012) argue that
estimates of the potential for energy efficiency in organizations would be higher if they
considered energy management practices, as technology-focused energy efficiency
actions alone are unlikely to achieve their full potential without maintenance and
continuous monitoring. Estimates of the energy savings potential for organizations that
adopt an EnMS range from 10-40% (Ahmed et al., 2010; Duarte and Acker, 2011;
EMWG, 2014; IIP, 2012).
ISO 50001 is a voluntary, internationally-developed standard for energy management
systems that offers a flexible framework for organizations and facilities to integrate
energy efficiency into their management practices. It establishes requirements for an
EnMS and builds on previous ISO management standards like 9001 (quality
management) and 14001 (environmental management) that use a continuous
improvement model to improve quality and safety in organizations worldwide. A
portfolio of related standards has been developed to support and encourage the
implementation of ISO 50001 and to assist in the quantification of resulting energy
performance improvements.
ISO 50001 can be applied in any sector and provides organizations with an
internationally-accepted structure for: improving their understanding of current energy
use and consumption, identifying capital and operational energy efficiency opportunities,
providing a business context for implementation decisions, and evaluating the post-
implementation results. Key elements include: establishing an energy policy, energy
management team, and a baseline of organizational use; identifying energy performance
indicators, setting targets, and incorporating controls and procedures to address energy
use; and measuring and documenting energy performance and reporting to management.
The business context and the management support required for implementation of ISO
50001 can help overcome a number of the most common barriers to improving energy
performance in organizations. The EnMS integrates the management of energy into daily
business practices to help organizations identify, implement, and measure energy saving
opportunities. Unlike traditional project-based energy efficiency actions, the EnMS
approach emphasizes cultural changes in business processes rather than focusing solely
on individual projects. A well-designed EnMS allows organizations to actively manage
energy and reduce cost without negatively impacting production or operations and
document savings. This enables organizations to achieve sustained and persistent system-
wide improvements (McKane et al., 2009).
2
4 Global ISO 50001 Uptake and Supporting Policies
ISO 50001 has been widely adopted as a national and regional standard. A number of
national policies and programs have fostered uptake and effective implementation of ISO
50001. Public programs in support of EnMS implementation help organizations
overcome barriers to industrial and commercial efficiency with tax incentives, regulatory
mechanisms, recognition programs, information provision, training, workforce
development, and technical tools and assistance (Reinaud and Goldberg, 2014; UNIDO,
2008).
The majority of ISO 50001 certificates issued in 2015, the most recent ISO data
available, were in Germany, followed by the United Kingdom, Spain, Italy, and India.
The five countries with the most growth in the number of certificates between 2014 and
2015 were Germany, France, Spain, India, and China (ISO, 2015). The number of
certifications continues to increase substantially as large international companies seek
certification across their organizations (e.g., Hilton Worldwide, which has certified more
than 4200 properties to ISO 50001 in 2014).
Regional and national programs to support industrial energy efficiency can be mandatory
or voluntary. They will vary in terms of the offerings and incentives. Table 1 provides a
comparison of the characteristics of some public-sector programs and policy mechanisms
in support of improving energy efficiency and EnMS in the industrial sector. For more
detailed descriptions of national programs submitted by Impacts Network experts, see
Appendix A.
While some countries have been building policies for several years and now operate
mature programs, others are in the early stages of program development. In both cases,
policymakers have some ability to monitor progress and impact through ISO-50001
certification numbers, organizational reporting on energy savings, and other verification
mechanisms. What has been lacking is a consistent and transparent mechanism for
policymakers worldwide to estimate the savings potential from ISO 50001
implementation.
As the heart of ISO 50001 is a non-tangible culture-changing business practice. A key
outcome of this culture change is improved decision making relative to energy efficiency
project implementation and technology adoption. Because of this, estimating the energy
and CO2 savings impact of the ISO 50001 continual improvement approach at the
national or regional level is more complex than estimating the impact of technology
upgrades such as lighting. Further, it has been difficult to monitor how energy efficiency
policies contribute towards meeting national energy and climate change mitigation targets
(Schreck, 2011). Establishing the value of ISO 50001 uptake can help inform
policymaking, reduce the transaction costs of establishing EnMS programs (Tanaka,
2011), and provide supporting documentation for program development.
3
A number of factors make aggregation of ISO 50001 impacts challenging. At the
organizational or facility level, energy performance improvement is measured using
organization-specific metrics. Some countries focus their industrial energy efficiency
programs on reducing electricity consumption, while others consider energy consumption
across the full range of energy types. Differences in how national and regional
implementation programs account for energy performance improvement, report savings,
and record uptake can further complicate aggregation of impacts.
A globally accepted methodology to determine the potential impact of ISO 50001 on a
national and global scale has been developed. When applied by country and regional-
level policy makers, the methodology can facilitate the development of baselines and
targets for ISO 50001 adoption. The use of the methodology by multiple countries can
enable harmonization of savings estimates, comparison of impacts, and knowledge
sharing on the efficacy of different program implementation schemes.
5 Methodology
The ISO 50001 Impacts Methodology has been established to assist policymakers in
determining the impact of industrial and commercial (service) sector ISO 50001
implementation on a regional, national, or global scale. The methodology is detailed in
this paper and has been embodied as software in the ISO 50001 Impacts Estimator Tool
(IET 50001) (EMWG, 2016b). To be consistent with IEA data sources, the methodology
description that follows and the IET 50001 use the term “service” to describe the
commercial sector. For the purpose of this paper, these terms should be considered to be
equivalent.
The ISO 50001 Impacts Methodology was designed based on the following criteria: the
use of accepted, existing data sources (e.g., International Energy Agency); the use of
transparent, testable assumptions; and the ability for users to customize inputs.
Methodology users must identify a region of interest, gather relevant input data including
projected energy consumption on a delivered basis and carbon emission factors for
various energy types, establish a projection of ISO 50001 uptake for the time period of
interest, and select what level of annual savings will be realized from ISO 50001
implementation. These inputs are used to determine the amount of energy under the
management of an ISO 50001 EnMS and the resulting energy, energy cost, and CO2
emissions savings. Energy cost and CO2 emissions savings are determined based upon
calculated energy savings. ISO 50001 Impacts Methodology users can aggregate results
generated by applying the methodology for multiple regions or economic subsectors. For
example; the methodology could be used for each country or industrial/service subsector
(e.g., glass, pulp and paper, hospitality, and educational) within the country, and the
results aggregated across multiple countries or subsectors within a geographic area.

4
5.1 Determining an ISO 50001 Uptake Function
Energy savings resulting from ISO 50001 uptake are calculated based upon user-supplied
projections of energy consumption for the region of interest. The ISO 50001 Impacts
Methodology assumes that only a fraction of the total projected energy consumption will
be under the management of an ISO 50001 EnMS and that ISO 50001 uptake will be
non-linear over the time period of interest. This latter assumption is based upon evidence
from uptake of other ISO management standards such as ISO 9001 and ISO 14001 both
globally and in individual countries. The ISO 50001 adoption rate is assumed to grow
slowly initially with early adopters implementing the EnMS. However, through the
experiences of the early adopters, best practices and implementation resources will
become available and policies will begin to form around ISO 50001. During this period,
ISO 50001 adoption will grow exponentially up until a period of near-saturation. Beyond
this point, the adoption rate will decline until an ultimate maximum uptake level is
reached. This results in an individual ISO 50001-uptake percentage for each year of the
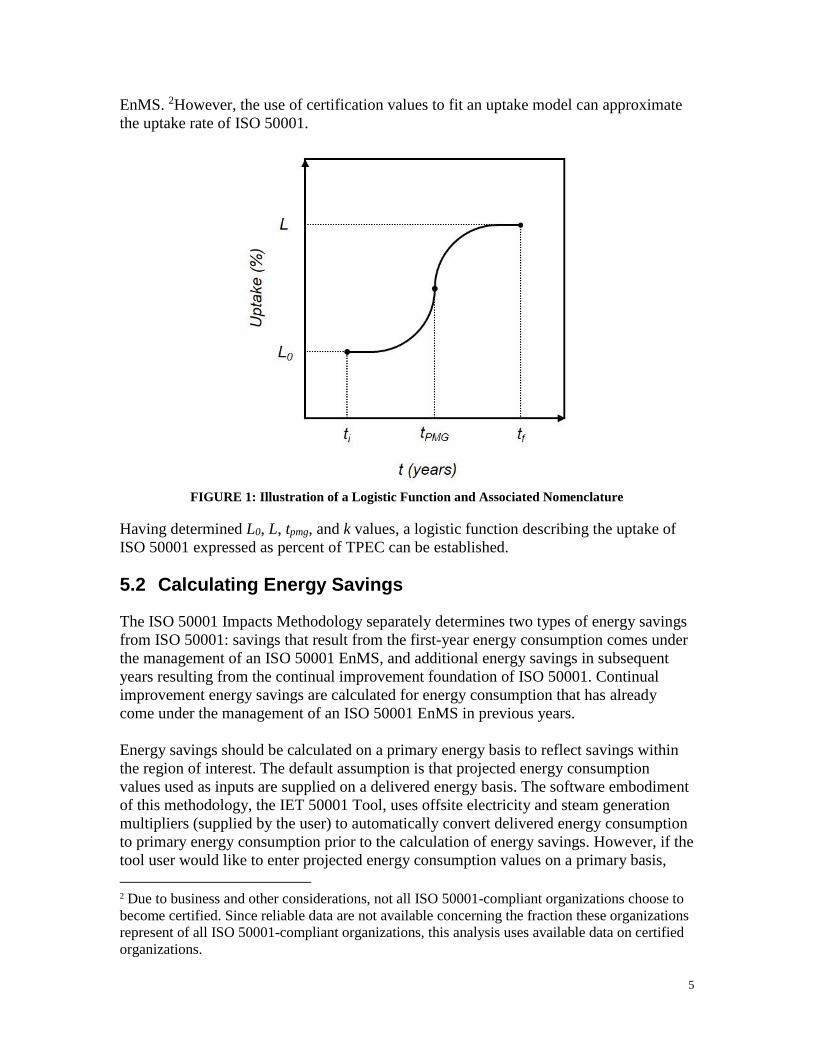
adoption. A logistic function is used to model this non-linear uptake of ISO 50001. The
general form a logistic function is shown in Figure 1 and detailed in Equation 1.
Equation 1 ISO 50001 uptake %𝒕
= 𝑳𝟎 +𝑳−𝑳𝟎
𝟏+𝒆−𝒌(𝒕−𝒕𝒑𝒎𝒈)
Where:
L0 is the initial year uptake value of ISO 50001 for the time period of interest,
L is the final year uptake value of ISO 50001 for the time period of interest,
tpmg is the year at which the logistic function reaches a point of maximum growth,
k is a factor to adjust the rate of uptake.
L0 and L are values, expressed as percentages, that represent the fraction of projected
energy consumption under the management of an ISO 50001 EnMS at the start and end
points of the analysis. This percentage is established as the amount of energy under the
management of an ISO 50001 EnMS divided by the total projected energy consumption
(TPEC) for the region of interest.
An appropriate value for L0 may be 0% if 2011, the year ISO 50001 was first published,
is selected as the initial year. The selection of a value for L may be based on a number of
factors, including a determination of economic, technical, or market potential for ISO
50001 within a region. The rationale behind the selection of L and L0 values should be
documented to maintain the transparent nature of the methodology and its use.
To determine the shape of the uptake function, users must determine the values of tpmg
and k. One method to establish these values is to use historical certification values for
ISO 9001, ISO 14001, or other ISO management systems. An iterative process can be
used to determine values for tpmg and k that provide the best fit for the historical data,
which are subsequently used to model uptake of ISO 50001. Historic certification data
should be evaluated and adjusted for non-routine events such as economic downturns as
well as the absence of data. Methodology users should be aware that the number of
certificates issued for these other standards, or even ISO 50001, does not directly
correlate to the amount of energy consumption under the management of an ISO 50001
5
EnMS. 2However, the use of certification values to fit an uptake model can approximate
the uptake rate of ISO 50001.
FIGURE 1: Illustration of a Logistic Function and Associated Nomenclature
Having determined L0, L, tpmg, and k values, a logistic function describing the uptake of
ISO 50001 expressed as percent of TPEC can be established.
5.2 Calculating Energy Savings
The ISO 50001 Impacts Methodology separately determines two types of energy savings
from ISO 50001: savings that result from the first-year energy consumption comes under
the management of an ISO 50001 EnMS, and additional energy savings in subsequent
years resulting from the continual improvement foundation of ISO 50001. Continual
improvement energy savings are calculated for energy consumption that has already
come under the management of an ISO 50001 EnMS in previous years.
Energy savings should be calculated on a primary energy basis to reflect savings within
the region of interest. The default assumption is that projected energy consumption
values used as inputs are supplied on a delivered energy basis. The software embodiment
of this methodology, the IET 50001 Tool, uses offsite electricity and steam generation
multipliers (supplied by the user) to automatically convert delivered energy consumption
to primary energy consumption prior to the calculation of energy savings. However, if the
tool user would like to enter projected energy consumption values on a primary basis,
2 Due to business and other considerations, not all ISO 50001-compliant organizations choose to
become certified. Since reliable data are not available concerning the fraction these organizations
represent of all ISO 50001-compliant organizations, this analysis uses available data on certified
organizations.

6
they also need to set offsite electricity and steam generation multipliers to the value of
one. Regardless of which method is used, the final numbers presented in the results
section will be calculated on a primary energy basis.
5.2.1 Calculating Energy Savings for the Initial Year
Before calculating annual energy savings for the initial year (t = 0), initial year energy
consumption under management (ECUM) must be established by taking the product of
initial year TPEC and initial year ISO 50001 uptake percentage for both the industrial and
service sectors as shown in Equation 2.
Equation 2 ECUM𝑡=0 = TPEC𝑡=0 × ISO 50001 uptake % 𝑡=0
New annual energy savings (NAES) attributable to ISO 50001 for the initial year are then
calculated as shown in Equation 3 as the product of industrial and service sector ECUM
and initial year percentage of energy savings attributable to ISO 50001 as determined in
Section 5.1.
Equation 3 NAES𝑡 = ECUM𝑡 × % of ES attributable to ISO 50001
Because this is the initial year, the continual improvement in energy savings from
previous years is not considered. Therefore, Total New Annual Energy Savings (TNAES)
for the first year equals the NAES. However, energy savings due to continual
improvement will be a consideration in subsequent years.
5.2.2 Calculating Energy Savings for Subsequent Years
TPEC values are commonly available from government or other reports and typically do
not account for the projected impact of ISO 50001. Because ISO 50001 supports
continual improvement, this methodology makes adjustments to the projected energy
consumption values to account for the reductions in energy consumption associated with
ISO 50001-related energy savings sustained from previous years.
Adjusted total projected energy consumption (ATPEC) is calculated for years after the
initial year by subtracting energy savings calculated for the previous year from the
current year unadjusted TPEC value as shown in Equation 4.
Equation 4 ATPEC𝑡 = TPEC𝑡 − ∑ TNAES𝑛𝑡−1𝑛=1
The ATPEC for a given year is then used along with the ISO 50001 uptake % for that
same year to calculate the ECUM per Equation 5.
Equation 5 ECUM𝑡 = ATPEC𝑡 × (ISO 50001 uptake %𝑡 − ISO 50001 uptake %𝑡−1)

7
Continual improvement of energy performance is a foundation of ISO 50001. Continual
improvement of energy performance indicates that energy savings from previous years
will be maintained and built upon, ever increasing the total energy savings. The ISO
50001 Impacts Methodology takes this into account by calculating continual
improvement energy savings (CIES) for years subsequent to the initial year by applying a
continual savings improvement percentage value, CSI%. To account for continual energy
performance improvement, energy consumption that comes under the management of an
ISO 50001 EnMS each year must be accounted for separately. Equation 6 details how
CIES is calculated.
Equation 6 CIES𝑡 = CSI% × ∑ (𝐸𝐶𝑈𝑀𝑛 − 𝑁𝐴𝐸𝑆𝑛 − 𝐶𝐼𝐸𝑆𝑛)𝑡−1𝑛=1
TNAES (Total New Annual Energy Savings) for a given year after the initial year as
shown in Equation 7 is calculated as the product of current year ECUM and the
percentage of energy savings attributable to ISO 50001 plus CIES for the current year.
Equation 7 TNAES𝑡 = NAES𝑡 + CIES𝑡
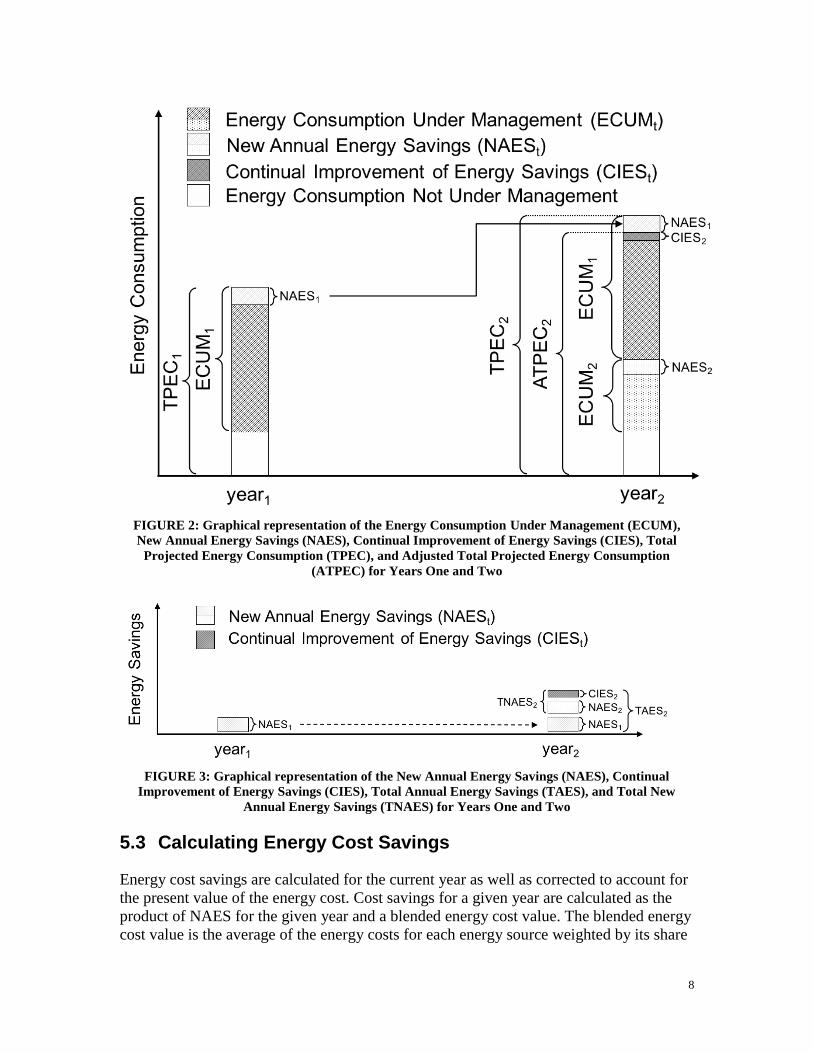
Figure 2 graphically represents the relationship of multiple years Energy Consumption
Under Management (ECUM), New Annual Energy Savings (NAES), Continual
Improvement of Energy Savings (CIES), Total Projected Energy Consumption (TPEC),
and Adjusted Total Projected Energy Consumption (ATPEC).
Figure 3 illustrate NAES for the first two years, showing how CIES from the year one
ECUM is included in determining year two NAES. Total Annual Energy Savings (TAES)
are calculated as the summation of each year’s Total New Annual Energy Savings
(TNAES) (Equation 8). TAES is also graphically represented in Figure 3.
Equation 8 TAES𝑡 = ∑ TNAES𝑛𝑡𝑛=1
Finally, the cumulative energy savings (CES) is calculated as shown in Equation 9.
Equation 9 CES𝑡 = ∑ TAES𝑛𝑡𝑛=1
8
FIGURE 2: Graphical representation of the Energy Consumption Under Management (ECUM),
New Annual Energy Savings (NAES), Continual Improvement of Energy Savings (CIES), Total
Projected Energy Consumption (TPEC), and Adjusted Total Projected Energy Consumption
(ATPEC) for Years One and Two
FIGURE 3: Graphical representation of the New Annual Energy Savings (NAES), Continual
Improvement of Energy Savings (CIES), Total Annual Energy Savings (TAES), and Total New
Annual Energy Savings (TNAES) for Years One and Two
5.3 Calculating Energy Cost Savings
Energy cost savings are calculated for the current year as well as corrected to account for
the present value of the energy cost. Cost savings for a given year are calculated as the
product of NAES for the given year and a blended energy cost value. The blended energy
cost value is the average of the energy costs for each energy source weighted by its share

9
of total energy consumption. The cost savings for each year can be discounted to present
value. Equation 10 can be used to determine present value of annual cost savings.
Equation 10 PV = Annual Cost Saving for year 𝑡
(1+𝑟)(𝑡−𝑡𝑐𝑢𝑟𝑟𝑒𝑛𝑡)
5.4 Calculating CO2 Savings
CO2 emissions savings for a given year are calculated as the product of TAES for that
year and an appropriate CO2 emissions rate for the region. CO2 emission rates are
typically reported on a delivered basis, such as metric tons of CO2 per kWh consumed.
For energy types that ordinarily do not include a primary to delivered multiplier, such as
natural gas or diesel fuel, this issue will not be of concern. However, for energy types that
do commonly include primary to delivered multipliers such as delivered electricity and
steam, care should be taken to convert calculated energy savings from primary to
delivered prior to calculating CO2 emissions values for these energy types.
5.5 Cumulative Savings from Individual Years
Energy, energy cost, and CO2 emission savings calculated for individual years can be
accumulated to reflect savings over time. Cumulative savings are calculated as the
summation of savings for each year of interest.
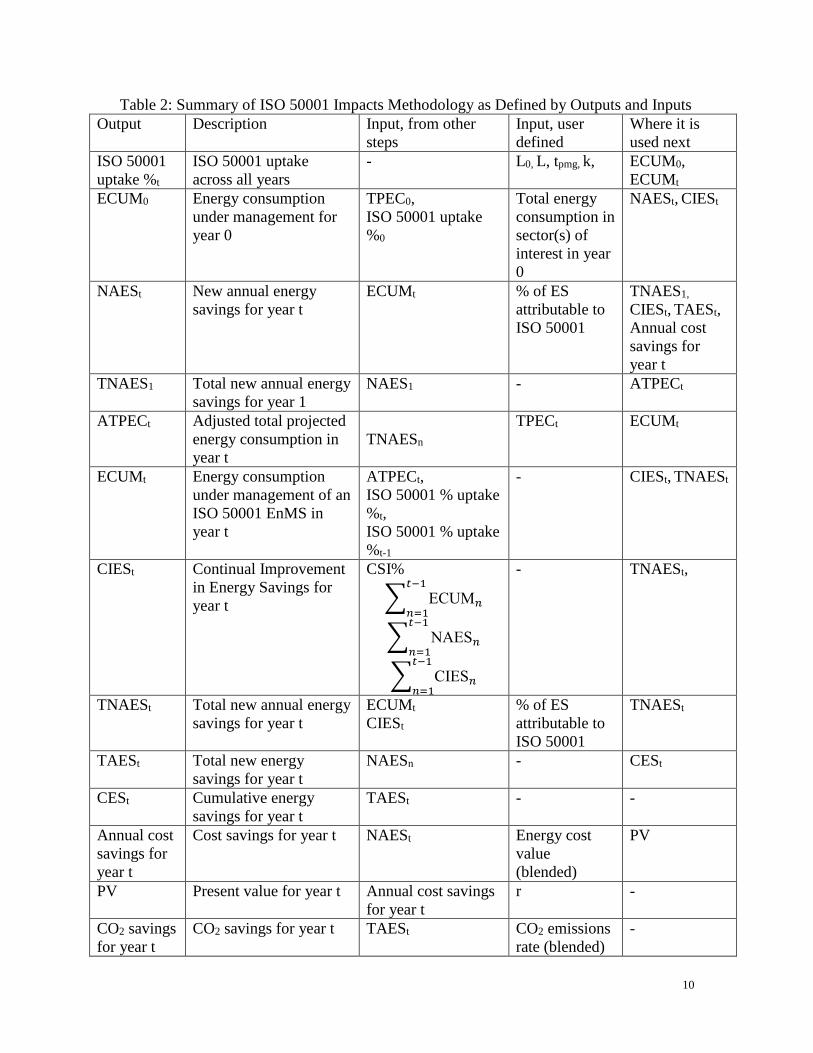
5.6 Summary of ISO 50001 Impacts Methodology
Table 2 provides a summary of the ISO 50001 Impacts Methodology as defined by the
inputs and outputs used for each step of the methodology. The table also includes
reference to the appropriate section number of this paper.
10
Table 2: Summary of ISO 50001 Impacts Methodology as Defined by Outputs and Inputs
Output Description Input, from other
steps
Input, user
defined
Where it is
used next
ISO 50001
uptake %t
ISO 50001 uptake
across all years
- L0, L, tpmg, k, ECUM0,
ECUMt
ECUM0 Energy consumption
under management for
year 0
TPEC0,
ISO 50001 uptake
%0
Total energy
consumption in
sector(s) of
interest in year
0
NAESt, CIESt
NAESt New annual energy
savings for year t
ECUMt
% of ES
attributable to
ISO 50001
TNAES1,
CIESt, TAESt,
Annual cost
savings for
year t
TNAES1 Total new annual energy
savings for year 1
NAES1 - ATPECt
ATPECt Adjusted total projected
energy consumption in
year t
TNAESn
TPECt ECUMt
ECUMt Energy consumption
under management of an
ISO 50001 EnMS in
year t
ATPECt,
ISO 50001 % uptake
%t,
ISO 50001 % uptake
%t-1
- CIESt, TNAESt
CIESt Continual Improvement
in Energy Savings for
year t
CSI%
∑ ECUM𝑛
𝑡−1
𝑛=1
∑ NAES𝑛
𝑡−1
𝑛=1
∑ CIES𝑛
𝑡−1
𝑛=1
- TNAESt,
TNAESt Total new annual energy
savings for year t
ECUMt
CIESt
% of ES
attributable to
ISO 50001
TNAESt
TAESt Total new energy
savings for year t
NAESn - CESt
CESt Cumulative energy
savings for year t
TAESt - -
Annual cost
savings for
year t
Cost savings for year t NAESt
Energy cost
value
(blended)
PV
PV Present value for year t Annual cost savings
for year t
r -
CO2 savings
for year t
CO2 savings for year t TAESt
CO2 emissions
rate (blended)
-

11
6 Data
Using IET 50001, the authors have developed an initial estimate of the global impact of
ISO 50001 implementation based upon the following assumptions:
Initial year (t = 0) is 2011, the year ISO 50001 was first published.
Uptake of ISO 50001 that results in 50% of projected global industrial and service
sector energy consumption under ISO 50001 management by 2030 (L = 50%).
The choice of 50% uptake in 2030 is designed to illustrate the potential impact of
ISO 50001 EnMS on global energy consumption and emissions, although actual
uptake is uncertain in the absence of globally consistent policy drivers.
Industrial sector uptake of ISO 50001 follows a logistic function form with L0 =
0%, L = 50%, tpmg = 14 years, and k = 0.30. Based upon global historic ISO 14001
uptake in the industrial sector.
Service sector uptake of ISO 50001 follows a logistic function form with L0 = 0%,
L = 50%, tpmg = 9 years, and k = 0.65. Based upon global historic ISO 14001
uptake in the service sector.
5% energy savings in the first year energy comes under the management of ISO
50001. Based upon minimum requirements and observed results of the U.S.
Department of Energy Superior Energy Performance program (Therkelsen et al.,
2015).
Continual energy savings of an additional 1% per year are realized. Based upon
minimum requirements and observed results of the U.S. Department of Energy
Superior Energy Performance program (Therkelsen et al., 2015).
Annual interest rate of 1.83% used to calculate net present value, based upon 10
year US treasury note.
Delivered energy consumption in 2025 and 2030 for the industrial and service
sectors is projected to be 215 EJ and 229 EJ respectively (IEA, 2015b).
Figure 4 graphically illustrates the resulting uptake rates of ISO 50001 for the global
industrial and service sectors based upon these assumptions.
Figure 4: Uptake of ISO 50001 in the Global Industrial and Service Sectors based upon presented
assumptions.
12
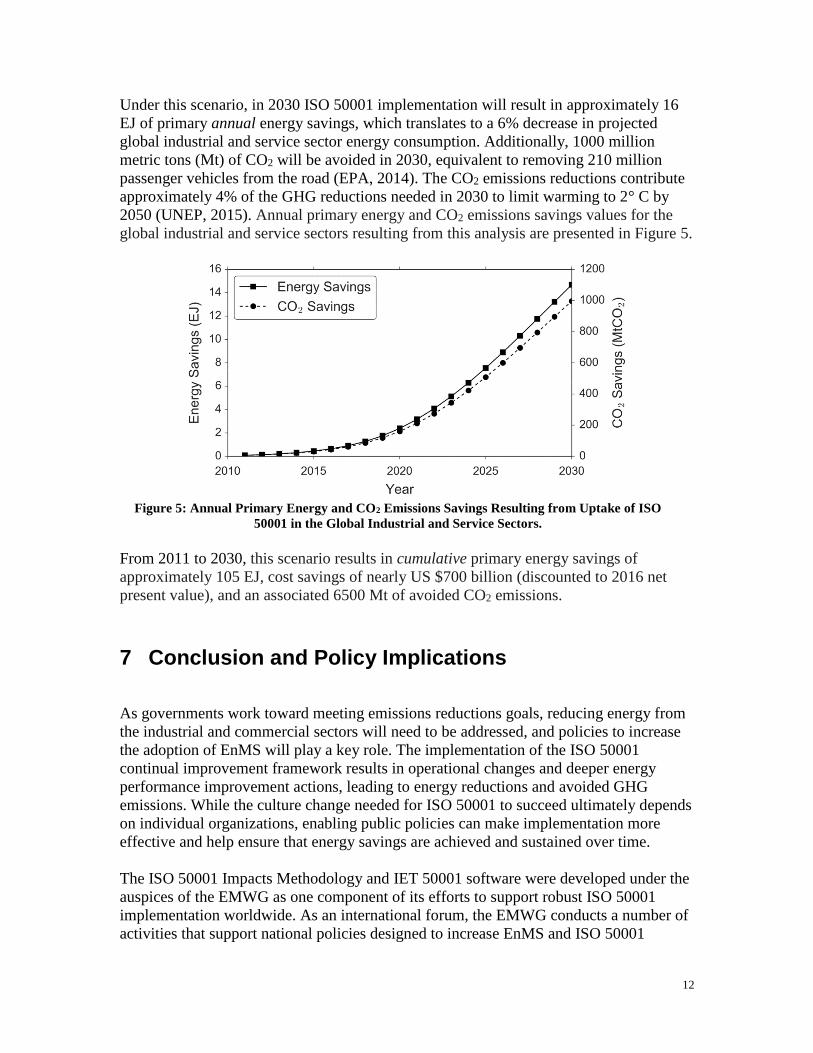
Under this scenario, in 2030 ISO 50001 implementation will result in approximately 16
EJ of primary annual energy savings, which translates to a 6% decrease in projected
global industrial and service sector energy consumption. Additionally, 1000 million
metric tons (Mt) of CO2 will be avoided in 2030, equivalent to removing 210 million
passenger vehicles from the road (EPA, 2014). The CO2 emissions reductions contribute
approximately 4% of the GHG reductions needed in 2030 to limit warming to 2° C by
2050 (UNEP, 2015). Annual primary energy and CO2 emissions savings values for the
global industrial and service sectors resulting from this analysis are presented in Figure 5.
Figure 5: Annual Primary Energy and CO2 Emissions Savings Resulting from Uptake of ISO
50001 in the Global Industrial and Service Sectors.
From 2011 to 2030, this scenario results in cumulative primary energy savings of
approximately 105 EJ, cost savings of nearly US $700 billion (discounted to 2016 net
present value), and an associated 6500 Mt of avoided CO2 emissions.
7 Conclusion and Policy Implications
As governments work toward meeting emissions reductions goals, reducing energy from
the industrial and commercial sectors will need to be addressed, and policies to increase
the adoption of EnMS will play a key role. The implementation of the ISO 50001
continual improvement framework results in operational changes and deeper energy
performance improvement actions, leading to energy reductions and avoided GHG
emissions. While the culture change needed for ISO 50001 to succeed ultimately depends
on individual organizations, enabling public policies can make implementation more
effective and help ensure that energy savings are achieved and sustained over time.
The ISO 50001 Impacts Methodology and IET 50001 software were developed under the
auspices of the EMWG as one component of its efforts to support robust ISO 50001
implementation worldwide. As an international forum, the EMWG conducts a number of
activities that support national policies designed to increase EnMS and ISO 50001

13
adoption. These include: informational programs (fact sheets, case studies); recognition
programs (Energy Management Leadership Awards); and activities to support EnMS
robust implementation (through liaison to ISO Technical Committee 301, by developing
an international ISO 50001 Lead Auditor Certification Scheme in support of consistent
certification outcomes, and through a campaign to encourage uptake of ISO 50001). The
EMWG has also undertaken an initiative to develop an international database of certified
organizations to assist national governments in tracking the impact of their policies.
The ISO 50001 Impacts Methodology uses projections of energy consumption for a given
country or region and models the percentage of energy coming under ISO 50001
management over time. This
methodology provides a flexible and transparent process to help policymakers understand
the potential impact of ISO 50001 through both annual and cumulative energy savings
estimates. With harmonized savings estimates across countries, policymakers can more
easily compare impacts and learn from different policies. The methodology can facilitate
and strengthen energy efficiency and energy management programs by allowing
policymakers to understand the economic and environmental value of ISO 50001
implementation, design programs based on country- or region-specific analysis, and track
program performance. Many national programs have already led to significant increases
in ISO 50001 implementation, as shown in a number of examples in Appendix A. The
ISO 50001 Impacts Methodology will allow program managers to estimate the impacts of
this increased uptake, as well as model impacts from different uptake scenarios.
Program designers may wish to use the methodology to help set specific national or
regional objectives and clarify and monitor how their program fits into broader energy
and climate change mitigation goals. They can also use results from the methodology to
guide how their program offerings, including financial incentives, technical assistance,
workshops, or other activities, should be targeted within the industrial and commercial
sectors. The methodology provides valuable information to aide policymakers in
targeting public resources to maximize ISO 50001 impacts while accommodating the
variation in energy uses and business practices of different subsectors. Because ISO
50001 provides a framework for continual improvement across an organization, programs
in support of its implementation will also identify ongoing energy efficient opportunities,
thus increasing the potential for increased uptake of energy efficiency at the project level.
The widespread implementation of ISO 50001 will also create a more informed energy
end-user market facilitating and accelerating the adoption of emerging energy efficiency
technologies.
Assuming a 50% uptake level of ISO 50001 in the industrial and commercial sectors by
2030 along with other documented assumptions, IET 50001 projects that in 2030 ISO
50001 will result in approximately 16 EJ of annual primary energy savings, and 1000 Mt
of avoided annual CO2 emissions . This scenario results in cumulative primary energy
savings between 2011 and 2030 of approximately 105 EJ, delivered cost savings of
nearly US $700 billion (discounted to 2016 net present value), and an associated 6500 Mt
of avoided CO2 emissions. Actual uptake will depend on a number of factors and will
increase as more enabling policies are established. As countries work towards meeting
14
climate change mitigation goals, policymakers and other stakeholders can utilize the ISO
50001 Impacts Methodology and associated IET 50001 software to estimate country- and
regional-level impacts of ISO 50001.
The development, review, and refinement of the methodology and IET 50001 tool has
already engaged a global network of policymakers, academics, and technical experts – a
necessary first step toward international adoption of ISO 50001 as a key climate change
mitigation strategy. The ongoing engagement of the Impacts Network and other key
policymakers will continue to strengthen the methodology and IET 50001 software tool,
provide ongoing opportunities to share and track estimates of potential national and
regional impacts from ISO 50001 implementation, and provide a forum for discussion
and sharing EnMS program and policy best practices to support the realization of the ISO
50001 savings potential. Future work on the ISO 50001 Impacts Methodology and IET
50001 tool will include a sensitivity analysis of key inputs as well as establishing
confidence intervals for results.
15
Appendix A
The descriptions presented here represent only a sampling of national program offerings
currently supporting implementation of ISO 50001. As work within the Impacts Network
progresses, it is anticipated that both the number and scope of national program offerings
shared within the Network will increase.
Austria
The European Union Guideline 2012/27/EU, implemented through the Energy Efficiency
Law (EEffG) in August 2014, requires any enterprise not classified as a small- or
medium-sized enterprise (SME) to perform an Energy Audit at least every four years or
to implement an Energy Management System (ISO 50001) or an Environmental
Management System (ISO 14001 or EMAS) that includes the aspects of an energy audit.
Although publicly available data are limited, there has been a significant increase in the
number of EnMS implementations reported. During the first year of the EEffG
requirement, covered enterprises reported identifying 11.15 PJ in energy savings.
Brazil
Brazil has been building a national policy framework in support of energy efficiency
since the 2001 passage of the Energy Efficiency Law. The most recent revision to the
National Plan for Energy Efficiency (PNef) recommends the implementation of ISO
50001 in the industrial sector. The revised PNef is expected to include a program to
promote ISO 50001 uptake in Brazilian industry. In the absence of a supportive national
policy, 23 facilities had already been certified to ISO 50001 as of 2014 (ISO, 2015).
Canada
In 2011, Canada implemented a voluntary program to increase the energy efficiency of
all Canadian industry, regardless of size. The Energy Efficiency Program for Industry
operates in conjunction with the Canadian Industry Program for Energy Conservation
(CIPEC), a government-industry partnership that has been helping organizations improve
energy efficiency since 1975. It offers networking opportunities through conferences and
meetings, provides customized energy management workshops, and produces technical
guides, case studies, videos, and newsletters to increase awareness and uptake of
industrial energy efficiency. In addition, the Program provides CIPEC members with
financial assistance to perform ISO 50001 implementation pilots, energy management
projects, process integration studies, and/or computational fluid dynamics studies. To
date, 17 facilities have been certified to ISO 50001, and two organizations are also
certified to the United States Department of Energy’s Superior Energy Performance
program, with one organization implementing an Enterprise solution covering four of its
facilities. In 2013 – 2014 alone, CIPEC organizations recorded total annual energy
savings of 1.65 PJ–enough to power about 19,200 households – and reduced annual GHG
emissions by an estimated 170 kt.
16
China
The Top 10,000 Enterprises Energy Efficiency and Low Carbon Action Plan requires
approximately 17,000 industry and commercial enterprises accounting for 60% of
China’s energy consumption to establish an EnMS and obtain GB/T 23331-2012 or ISO
50001:2011 certifications.3 All enterprises with an energy consumption of more than
5000 tons of coal equivalent were required to establish EnMS, including industry,
transports, and commercial. In addition to the standard, enterprises also have access to
both general and sector-specific EnMS implementation guidance. Additionally,
implementation of an EnMS is now part of the evaluation of energy consumption for new
and existing governmental investment programs.
Uptake of the standard has been higher in the more developed regions of the country, but
remains slower than planned. By the end of 2015, there were 1847 enterprises certified to
GB/T23331-2012 in China. Barriers to accelerated uptake include: lack of governmental
incentives; a shortage of experts, especially trainers; and gaps in the internal capacity of
some enterprises. Promotion of energy management will be a key strategy for achieving
industrial emissions reductions and energy savings in the 13th 5-year plan and will
include incentive schemes as well as mandates targeting the 10,000 largest energy
consuming firms in industry.
Germany
In 2014, German companies held 3,402 ISO 50001 certifications, approximately 50% of
the worldwide total. These results can be attributed to supportive national energy policies,
including energy price and tax reductions, as well as technical assistance for the
introduction of energy management systems.
The German Eco tax cap for industry was introduced in 1999 and began in 2013 to
require companies falling under this scheme to operate an energy, environmental, or
similar management system by the end of 2015. If the manufacturing industry as a whole
improves its energy intensity by a certain percentage (1.35% in 2016), companies that
comply can claim a reduction of electricity and/or energy taxes of up to 90%.
Another mechanism, the special equalization scheme, allows energy-intensive companies
to request a partial exemption from the German renewable energy surcharge on electricity
of 0.0624 EUR/kWh if they operate a certified environmental management system or
EnMS (ISO 50001 or DIN EN 16001). A total of 1,069 certificates for energy
management systems were submitted by companies in 2014 as a legal requirement in
response to this scheme (BMWi, 2014).
In 2013, the Federal Office for Economic Affairs and Export Control (BAFA) fund began
supporting the introduction of EnMS mainly in small- and medium-sized enterprises that
are not eligible for the other schemes. BAFA allows for a total funding of up to EUR
20,000 per company within a period of 3 years, with specific allowances based on a
percentage of costs incurred for initial certification of an EnMS, purchase of metering
technology and/or energy management system software, energy consultant services, and
training staff members as energy managers.
3 GB/T 2331-2012 is aligned with ISO 50001, but is not included in the ISO Annual Survey
17
Ireland
Ireland has been actively engaged in promoting continual improvement of the energy
performance of its industrial enterprises since publication of the Irish national energy
management standard in 2005. Representatives from Ireland were active in the
development of ISO 50001 Energy management system standard, which was adopted as a
national standard following its publication in 2011. The Sustainable Energy Authority of
Ireland (SEAI) continues to support uptake of ISO 50001 through its Large Industry
Energy Network (LIEN), Energy Agreements programme and Public Sector Partnership
programmes. There are 65 companies currently maintaining ISO 50001 certification.
Recent publications for these programmes are listed under Sustainable Energy Authority
of Ireland in the references section of this paper.
Ireland is currently developing additional energy management standards and programmes
aimed to innovate and to drive deeper levels of energy performance, including a strong
focus on continual improvement for mature EnMS as well as energy efficient design,
construction, and commissioning.
Macedonia
Starting in May 2015, the United Nations Industrial Development Organization
(UNIDO), in collaboration with the Macedonian Ministry of Environment and Physical
Planning (MoEPP), the Ministry of Economy (MoE), the Energy Agency (EA), and the
Macedonian Bank for Development Promotion (MBDP), began implementing a project
targeted to overcome technical, financial, and policy barriers to improving energy
efficiency in Macedonian industry. During the first project year, 10 companies
representing approximately 10% of total national energy consumption were selected to
implement an ISO 50001-aligned EnMS. Their energy management teams are receiving
assistance from 20 national consultants who in turn are receiving extensive training in
energy efficiency and energy management during the course of the project. The project is
expected to have both direct and indirect impacts on Macedonian industrial energy
consumption and to generate 67-76 kt CO2eq cumulative direct and 66-72 kt CO2eq of
indirect GHG emissions reductions (GEF-UNIDO-REC, 2015).
Mexico
In 2014, the Commission for the Efficient Energy Use (CONUEE) launched the National
Program of Energy Management Systems (PRONASGEn), which seeks to overcome
and/or minimize the main barriers and bad practices that prevent energy users from the
systematic adoption of energy efficient measures, while supporting the formal adoption
of Energy Management Systems (EnMS). As a parallel effort, PRONASGEn is
developing training to create national and international experts in EnMS and energy
efficiency.
PRONASGEn operates primarily through “learning networks”. These networks integrate
consulting firms, education and research institutions, and other diverse participants to
assist in both the implementation of EnMS and the development of trainers.
PRONASGEn is working with Germany, Denmark, the United States, and Canada, which
contribute to six learning networks with more than 50 participants. There are three

18
networks in the industry sector, two in the SME sector, and one in the federal sector. One
of these networks extends through the three countries in North America. The
PRONASGEn has also begun to export its knowledge and experiences to other countries
in Latin America, beginning in May 2016 with two additional learning networks
involving El Salvador, Nicaragua, Costa Rica and Germany. The detected barriers and
needs will be used to create and improve the national policy in order to facilitate EnMS
adoption for every sector in Mexico.
South Africa
Eskom, the largest electricity utility on the African continent, launched an Energy
Efficiency and Demand Side Management program (EEDSM) in early 2002. Starting in
2004, the program was supported by the National Electricity Regulator (NER) through
the approval of a levy on the electricity tariff. The program remains in existence and is
hugely successful.
The Industrial Energy Efficiency (IEE) Project was established in 2010 in response to the
growing need to improve the energy efficiency of South Africa. UNIDO, along with the
Swiss Secretariat for Economic Affairs, the UK Department of International
Development and partnered by the Department of Trade and Industry (the dti) and the
Department of Energy (DoE) of South Africa, embarked on a program to address the
global drive for greater energy efficiency. Since 2010 this project has introduced training
courses to industry for a wide range of levels including energy experts, consultants, plant
personnel, and practitioners. Project implementations were performed to demonstrate the
impact of energy-efficiency practices on local industries. In the past four years (ending
2015), the IEE Project in South Africa has assisted industry in achieving energy savings
worth over ZAR 1.541 Billion. The IEE Project assisted companies in developing and
implementing an energy management system in line with the ISO 50001 Energy
Management Standard, and supported companies’ efforts to achieve this certification. 21
individuals were qualified as lead auditors for ISO 50001 certification purposes under the
IEE Project. The IEE Project in South Africa was the first of its kind, developed from
concept to implementation over five years – and has served as an international pilot
project. Similar projects are now operational through UNIDO in 16 other developing
countries worldwide.
The South African government also approved a tax incentive to the value of ZAR 0.45
per kWh (or kWh equivalent for any energy source), for achieved and verified energy
efficiency saving from November 1, 2013, to any business. This incentive has since been
increased to ZAR 0.95 per kWh (or kWh equivalent) from April 1, 2015 to encourage
more businesses to implement energy efficiency projects.
The South African Department of Energy has introduced a measure that would make the
preparation and submission of energy management plans mandatory for all enterprises
with annual energy consumption in excess of 180 TJ. The policy measures previously
introduced would complement this new requirement by using a combination of
awareness-raising, assistance, and incentives to encourage firms to seek ISO 50001
certification. Consideration is also being given to reducing the threshold energy

19
consumption above which energy management plans are mandatory. Incentives for
smaller firms to achieve ISO 50001 certification might include rebates against carbon tax
liability to cover part of the cost of obtaining and maintaining certification.
The development of learning hubs is being considered to help raise awareness of the
possible benefits of ISO 50001 certification and provide resources that may be useful in
the certification process.
Sweden
Sweden’s “Program for Improving Energy Efficiency in Energy Intensive Industries”
(PFE) operated as a voluntary program from 2005 until 2013 to increase energy
efficiency in energy-intensive industries. Companies were required to become certified to
an energy management standard (initially the Swedish national standard, later ISO
50001) within the first two years and implement identified energy efficiency measures
over the following three years. Participation in the program exempted companies from
the national tax on electricity and provided access to resources on energy management
and implementation, networking, and workshops. The program resulted in a 10% savings
in national electricity consumption, or approximately 3 TWh. Nearly all of the companies
that participated in PFE have remained certified to ISO 50001. There has been an uptake
of ISO 50001 at the enterprise level in the energy intensive industries as well as an
increased interest in expansion into supplier networks.
Turkey
Turkey’s 2007 Energy Efficiency Law, together with secondary legislation (2008) and
additional amendments (2011), provides the basis for other energy efficiency policies.
According to the legislation, industrial companies may be eligible for financial assistance
if they adopt ISO 50001 and become certified. Eligible companies may receive financial
assistance for as much as 30% of their energy efficiency investment. Companies that do
not have ISO 50001 certification or are not in the process of applying are not eligible for
the governmental support.
Most certifications are issued by TSE (Turkish Standard Institution), although some other
private certification bodies also operate in Turkey. It is predicted that the number of
certified industrial plants is around 160. For municipalities, there is only one big
municipality who has recently been certified. One of the challenges is that there is no
clear information on how many companies are certified because certification bodies do
not release this statistical information.
There is currently no mechanism for auditing certification bodies in Turkey. TURKAK,
the national accreditation body, is not yet accredited to ISO 50001. The lack of auditing
means that certification bodies may be issuing certificates without evidence that all ISO
50001 requirements have been met.
United States
The United States Department of Energy established the voluntary Superior Energy
Performance (SEP) Program in 2012 to build on ISO 50001 with specific energy
20
performance improvement criteria. It requires adoption of ISO 50001 and includes third-
party verification of energy performance improvements, which can help strengthen the
business case for energy management to management and investors. Companies that meet
the program requirements receive SEP certification at the Silver, Gold, or Platinum
levels. The program offers technical assistance, training, software tools, and public
recognition.
Companies earning SEP certification have achieved verified energy performance
improvements of up to 30%, with a 12% average annual reduction in energy costs during
the first 15 months of implementation and annual savings of up to US $938,000 using
low- or no-cost operational measures. SEP is currently expanding its program to move
beyond facility-level certification and cover Enterprise-wide implementation, which will
help companies capitalize on economies of scale associated with adopting ISO 50001
(DOE, 2016).

21
References
Ahmed, A., Ploennigs, J., Menzel, K., Cahill, B., 2010. Multi-dimensional building
performance data management for continuous commissioning. Adv. Eng.
Informatics 24, 466–475. doi:10.1016/j.aei.2010.06.007
Backlund, S., Thollander, P., Palm, J., Ottosson, M., 2012. Extending the energy
efficiency gap. Energy Policy 51, 392–396. doi:10.1016/j.enpol.2012.08.042
BMWi, 2014. Third National Energy Efficiency Action Plan (NEEAP) 2014 for the
Federal Republic of Germany. Fed. Minist. Econ. Aff. Energy.
DOE, 2015. Barriers to Industrial Energy Efficiency, United States Department of
Energy. doi:10.1108/IJESM-05-2013-0008
Duarte, C., Acker, B., 2011. Prioritizing and visualizing energy management and control
system data to Provide Actionable Information for Building Operators, in: Western
Energy Policy Research Conference.
EIA, 2013. International Energy Outlook 2013, United States Energy Information
Administration.
EMWG, 2016a. Overview [WWW Document]. Energy Manag. Work. Group, Clean
Energy Minist. URL http://www.cleanenergyministerial.org/Our-
Work/Initiatives/Energy-Management/EMWG-Overview (accessed 5.12.16).
EMWG, 2016b. ISO 50001 Impact Estimator Tool [WWW Document]. URL
http://www.cleanenergyministerial.org/Our-Work/Initiatives/Energy-
Management/iet50001 (accessed 5.15.16).
EMWG, 2014. Models for Driving Energy Efficiency Nationally Using Energy
Management, Energy Management Working Group, Clean Energy Ministerial.
EPA, 2014. Greenhouse Gas Equivalencies Calculator [WWW Document]. Environ.
Prot. Agency. URL https://www.epa.gov/energy/greenhouse-gas-equivalencies-
calculator (accessed 5.6.16).
Fischedick, M., Roy, J., Abdel-Aziz, A., Acquaye, A., Allwood, J.M., Ceron, J.-P., Geng,
Y., Kheshgi, H., Lanza, A., Perczyk, D., Price, L., Santalla, E., Sheinbaum, C.,
Tanaka, K., 2014. Industry, Climate Change 2014: Mitigation of Climate Change.
Contribution of Working Group III to the Fifth Assessment Report of the
Intergovernmental Panel on Climate Change.
GEF-UNIDO-REC, 2015. Project document for “Catalyzing market transformation for
industrial energy efficiency and accelerate investments in best available practices
and technologies in the Former Yugoslav Republic of Macedonia.”
IEA, 2015a. Energy and Climate Change, World Energy Outlook Special Report. Paris,
France. doi:10.1038/479267b
IEA, 2015b. Energy Technology Perspectives, International Energy Agency. Paris,
France. doi:10.1787/energy_tech-2014-en
IIP, 2012. Energy Management Programmes for Industry, Institute for Industrial
Productivity, International Energy Agency. Washington, DC.
ISO, 2015. The ISO Survey of Management System Standard Certifications - 2014
[WWW Document]. Int. Stand. Organ. URL http://www.iso.org/iso/iso-survey
(accessed 12.5.16).
Lucon, O., Urge-Vorsatz, D., Zain Ahmed, A., Akbari, H., Bertoldi, P., Cabeza, L.F.,
22
Eyre, N., Gadgil, A., Harvey, L.D.D., Jiang, Y., Liphoto, E., Mirasgedis, S.,
Murakami, S., Parikh, J., Pyke, C., Vilarino, M.V., 2014. Buildings, Climate Change
2014: Mitigation of Climate Change. Contribution of Working Group III to the Fifth
Assessment Report of the Intergovernmental Panel on Climate Change.
doi:10.2753/JES1097-203X330403
McKane, A., Desai, D., Matteini, M., Meffert, W., Williams, R., Risser, R., 2009.
Thinking Globally: How ISO 50001-Energy Management can make industrial
energy efficiency standard practice. Lawrence Berkeley Natl. Lab.
Reinaud, J., Goldberg, A., 2014. The more the merrier : leveraging diverse players to
deploy energy management systems in industry, in: ECEEE Industrial Summer
Study Proceedings. pp. 689–697.
Schreck, B., 2011. What are the steps to adopt Energy Management Systems?
Sustainable Energy Authority of Ireland, 2016. http://www.seai.ie/LIEN-Report/;
http://www.seai.ie/Your_Business/Large_Energy_Users/LIEN/LIEN_Reports/;
http://www.seai.ie/Your_Business/Public_Sector/. (accessed 6.24.16)
Sorrell, S., Mallett, A., Nye, S., 2011. Barriers to industrial energy efficiency: a literature
review, United Nations Industrial Development Organisation.
Tanaka, K., 2011. Review of policies and measures for energy efficiency in industry
sector. Energy Policy 39, 6532–6550. doi:10.1016/j.enpol.2011.07.058
Therkelsen, P., McKane, A., Sabouni, R., Tamm, Y., Rao, P., Scheihing, P., 2015.
Development of an Enhanced Payback Function for the Superior Energy
Performance Program, in: ACEEE Summer Study on Energy Efficiency in Industry.
UNEP, 2015. The Emission Gap Report 2015. A UNEP Synthesis Report, United Nations
Environment Programme.
UNIDO, 2011. Industrial Development Report 2011: Industrial energy efficiency for
sustainable wealth creation, United Nations Industrial Development Organization.
Vienna, Austria.
UNIDO, 2010. Motor Systems Efficiency Supply Curves, United Nations Industrial
Development Organisation. Vienna, Austria.
UNIDO, 2008. Policies for Promoting Industrial Energy Efficiency in Developing
Countries and Transition Economies, United Nations Industrial Development
Organisation. Vienna, Austria. doi:http://industrial-energy.lbl.gov/node/29
Worrell, E., 2011. Barriers to energy efficiency: International case studies on successful
barrier removal, United Nations Industrial Development Organization -
Development policy, Statistics & Research branch.